
Abstract
The pattern of capillary plasma perfusion was investigated in the rat brain during functional activation. Functional hyperemia was induced in the left whisker-barrel cortex by deflection of the right mystacial vibrissae for 2 min at frequencies of 1–7 Hz. Rats were decapitated under anesthesia 3 s after i.v. bolus injection of Evans blue dye. The steep increase of the arterial dye concentration ensures that divergent capillary plasma transit times result in unequal intracapillary dye concentrations. Plasma perfusion heterogeneity was determined from the coefficient of variation (CV) of Evans blue concentrations measured in numerous single capillaries of the whisker-barrel cortex. Functional hyperemia was quantified from measurements of CBF using the [14C]-iodoantipyrine technique in a second experimental group. CBF in the left whisker-barrel cortex increased with the stimulation frequency and was maximal at 5 Hz compared to the right side. Conversely, plasma perfusion heterogeneity decreased with stimulation frequency in a reciprocal way, being minimal at 5 Hz. Results indicate a decrease in the microcirculatory flow heterogeneity during functional hyperemia in the brain.
Keywords
In the past, discussion of the microcirculation in the brain was focused on the question of whether or not capillaries are closed and opened when CBF is changed (Klein et al., 1986; Kissen and Weiss, 1989; Göbel et al., 1990; Kuschinsky and Paulson, 1992; Williams et al., 1993). Weiss (1988) postulated a partial perfusion of about half of the capillaries under normal conditions. In contrast, our group demonstrated a complete filling of all brain capillaries with plasma within 5–10 s after i.v. bolus injection of a fluorescent dye (Klein et al., 1986; Theilen et al., 1993). Complete capillary perfusion has also been verified for pathophysiological conditions such as streptozotocin-induced diabetes (Knudsen et al., 1991) or incomplete forebrain ischemia (Theilen et al., 1993). The divergent findings of Weiss (1988) have been ascribed to methodological defects of the technique applied (Kuschinsky and Paulson, 1992). The lack of capillary recruitment that follows from these findings has been principally supported by Chen et al. (1995). These authors have estimated influx rate constants, (K1), and permeability-surface area products for 14C-iodoantipyrine and 14C-3-O-methyl-glucose by quantitative autoradiography when CBF was increased locally in various brain areas during acute nicotine treatment. From their data, they concluded that essentially no additional capillaries were recruited under these conditions of hyperemia. The concept of continuous perfusion of all brain capillaries with plasma has also been corroborated by confocal laser microscopy of superficial brain capillaries in vivo (Villringer et al., 1989, 1994).
Although intravital microscopy has the advantage that flow can be observed continuously in single capillaries, it is limited by the technical constraint that only a few capillaries close to the brain surface can be investigated. Analysis of a large number of capillaries in various brain structures appears to be helpful with respect to the detection of potential differences in the flow of single capillaries. Such analysis is possible by using a method recently developed in our laboratory (Abounader et al., 1995). An i.v. bolus of Evans blue dye is administered and the rat is decapitated 3–4 s later. In cryosections, all brain capillaries filled with Evans blue are visible after fixation. The fluorescent intensity of the intravascular Evans blue is measured in single capillaries and related to their cross-sectional area. Since the arterial concentration of Evans blue increases during the time period between i.v. injection and decapitation, the amount of Evans blue contained in each capillary at the moment of decapitation depends upon the velocity of plasma flow within this capillary. Higher capillary plasma flow velocities—corresponding to shorter transit times—lead to higher intracapillary concentrations of Evans blue than do lower capillary plasma flow velocities. Intravascular Evans blue concentrations measures in numerous adjacent capillary profiles should reflect the various transit times that exist between capillaries of the brain structure investigated. Variations in the transit times can be expressed as coefficient of variation (CV) (SD/mean × 100%) of intracapillary dye concentration. Previous studies have shown an extremely heterogeneous pattern of intracapillary dye concentration reflecting a diversity of transit times of plasma perfusion in different brain capillaries (Abounader et al., 1995). When CBF was decreased by hypocapnic hyperventilation, the plasma perfusion heterogeneity changed incoherently whereas it decreased considerably during an increase in CBF induced by hypercapnia (Abounader et al., 1995; Vogel et al, 1996).
The aim of the present study was to investigate the heterogeneity of plasma perfusion during changes of CBF induced by functional activation of a specific brain area. As a model of functional activation, the mechanical stimulation of the whiskers of rats was used. Laser Doppler flowmetry (Lindauer et al., 1993), videomicroscopy, (Cox et a., 1993) and H2 clearance studies (Moskalenko et al., 1996) have shown an increase of the blood flow in the corresponding brain cortex, i.e., the whisker-barrel cortex, during deflection of the whiskers of rats. In accordance with these studies whiskers of one side of the muzzle of the rats were deflected rhythmically and either local blood flow or capillary perfusion heterogeneity was measured in the whisker-barrel cortex of the contralateral side. The ipsilateral side served as control.
METHODS
Surgical procedure
Experiments were performed in 14 male Sprague–Dawley rats weighing 180–250 g each, and were in accordance with institutional guidelines. Before surgery, animals were anesthetized by a gas mixture containing 1–1.5% halothane, 70% N2O, and O2 (vol/vol). Body temperature was maintained at 37–37.6°C using a temperature-controlled heating pad. For infusion of anesthetics and application of 4-iodo-N-methyl-[14C]-antipyrine (ARC, St. Louis, MO, U.S.A.) or Evans blue (Sigma, Deisenhofen, Germany), both femoral veins were cannulated. The catheterized left femoral artery was used for monitoring arterial blood pressure, arterial blood sampling to determine arterial blood gases (using an AVL 990 analyzer, AVL GmbH, Bad Homburg, Germany), and determination of the time course of either arterial Evans blue concentration or 4-iodo-N-methyl-[14C]-antipyrine concentration. Preliminary studies demonstrated that the loss of ˜0.6–0.9 ml blood during the sampling periods has no effect on the mean arterial blood pressure (MABP). After a 2-h recovery period from the halothane anesthesia in a rat restrainer (Braintree Scientific, Braintree, MA, U.S.A.), anesthesia was reinduced using 0.8 mg/kg body wt diazepam (Valium) together with 0.6 mg/kg body wt etomidate (Etomidat Lipuro). The initial dose of etomidate was followed by a continuous infusion in a dosage of 0.025–0.035 mg/kg body wt/min. This low mainly sedative-acting dosage of etomidate, which is known to have minimal effects on cardiovascular and respiratory functions (Janssen et al., 1975; Famewo and Odugbesan, 1978), was chosen to minimize the effects of anesthesia on the parameters measured.
Experimental procedure
A home-made mechanical stimulator was placed next to the right side of the muzzle of the rat and all whiskers were deflected rhythmically and maximally, front-to-back, using a single defined frequency within the natural range of the whisking frequency, 1–7 Hz (Welker, 1964). Care was taken that the whiskers of the left side received no stimulation. Stimulation lasted for 2 min without touching common fur or other parts of the muzzle. After this time period, blood flow within the whisker barrel field reaches a steady state (Dirnagl et al., 1993; Lindauer et al., 1993). Then, the final acid-base status of arterial blood was determined and either 4-iodo-N-methyl-[14C]-antipyrine or Evans blue infused.
Intracapillary dye distribution was measured in seven rats. To this end, 1 ml/kg 2% Evans blue dissolved in 0.9% saline was injected into the left femoral vein as a bolus, ending after ˜0.2 s duration. Timed arterial blood samples (4–7 droplets/s) were taken simultaneously from the free flowing arterial catheter and collected separately on sheets of aluminum foil. Rats were decapitated during the phase of the increasing arterial concentration of Evans blue, i.e., 3–4 s after the bolus injection of the dye, when the first distinct blue-colored droplet appeared on the aluminum foil.
Measurement of intracapillary dye concentration
Brains were rapidly dissected out, frozen in 2-methylbutane chilled to −60°C, and divided sagittally into two equal parts. Both hemispheres were cut immediately at −20°C in a 2800 Frigocut E cryomicrotome (Leica, Nussloch, Germany). Alternating sections of 5 and 20 μm thickness were obtained by slicing in a plane tangential to the whisker-barrel field of the cerebral cortex according to previous studies (Durham and Woolsey, 1978; Melzer et al., 1985). The sagittal planes of the brain halves were adjusted to the sectioning plane with an angle in the coronal plane of 30°, which opened to the bregma, and an angle in the horizontal plane of 10°, which opened to the rostrum (Fig. 1). These angles were the best planes for tangential sectioning, as determined in preliminary experiments. The map given by Woolsey and Van-der-Loos (1970) for mice served as a guide. Sampling of sections was started 400 μm beneath the brain surface and was stopped when subcortical white matter appeared. The 20 μm sections were transferred to a slide and stained for activity of succinate dehydrogenase according to Riddle et al. (1993). Concentrations of enzymes of the oxidative metabolism, e.g., succinate dehydrogenase or cytochrome oxidase, are higher in the whisker-barrel field than in the surrounding cortex (Wong-Riley, 1979; Riddle et al., 1993; Killackey et al., 1994). Each of the corresponding 5 μm sections was transferred to a slide that had been covered just before with a thin film of a solution containing 1.82 g sucrose + 0.18 g glucose/ml H2O and kept at room temperature. Immediately (<0.5 s) after taking up the frozen section, the slide was dipped into cold acetone (–20°C) for 20 s. Slides were then transferred into acetone at room temperature; after 20 s, they were dried on a heated plate at 35–40°C. Then, fixed sections were covered with immersion oil and observed with an Zeiss Axioplan incident light fluorescence microscope (Zeiss, Oberkochen, Germany) equipped with a HBO 100 high-pressure mercury lamp (Zeiss) and a Zeiss MPM microscope photometer (Zeiss). The emitted fluorescent light passed through an aperture into the photomultiplier of the microscope photometer and its signals were quantified by a Zeiss MSP-21 microscope-system-processor (Zeiss). Before a series of measurements were taken, the system was adjusted to a standardized sensitivity using a Zeiss FL-Standard 47–42–56 fluorescent standard (Zeiss). In the 5 μm sections, the outer shape of the whisker barrel cortex was surrounded by a needle scratch that was placed according to the stain of the adjacent 20-μm section. Evans blue concentrations were measured in 150 neighboring capillaries of the whisker-barrel cortex of each side in each rat.
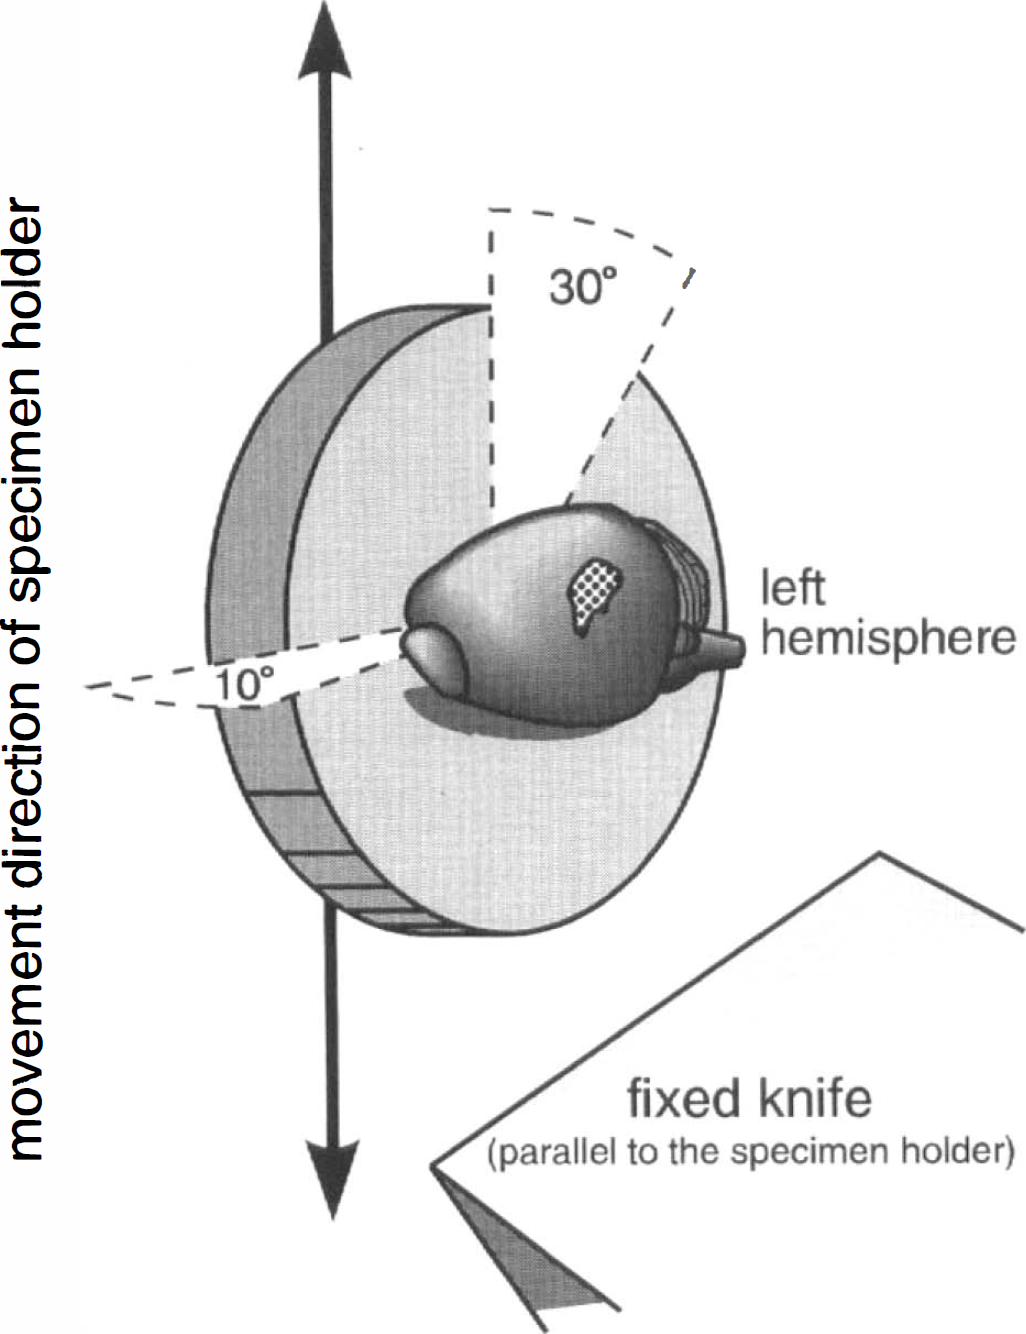
Schematic drawing of the mounting procedure in the cryomicrotome. The dotted area shows the whisker-barrel cortex, which was sectioned in a plane tangential to the cortical surface.
The concentration of Evans blue in each capillary was determined by measuring fluorescence per cross-sectional area of the dye. Capillaries containing Evans blue were observed and measured using a 546 nm primary filter, a 580 nm dichroic interference mirror, and a 590 nm secondary filter. For quantification of fluorescence, a single capillary profile was positioned under 50% excitation light intensity into the middle of an aperture of the photometer with a depiction diameter of 10 μm. Capillaries were selected based on diameter (<7.6 μm) and a nearly round shape. It took, maximally, 10 s to adjust the capillary profile into the right position. Fluorescence intensity was then measured for 0.2 s at 100% excitation light intensity. After fluorescence intensity had been determined in a capillary profile, fluorescent cross-sectional area of this profile was measured by shifting the attachment of the microscope from the photometer to a CCD camera (Kappa CF6, Kappa Meßtechnik, Gleichen, Germany) connected to an image analyzer (Signum, Munich, Germany). In such a setting, the cross-sectional area of a capillary profile with high luminescence, i.e., fluorescence intensity per cross-sectional area, from the fluorescent marker would appear larger than the area of the same profile containing a lower amount of fluorescent marker. Therefore, gray filters were used to individually attenuate the luminescence of different capillary profiles to yield similar values of luminescence. Thirteen different filter combinations were used to attenuate the fluorescence intensities down to 6%, if necessary, in attenuation steps of 5–10%. For determining the correct filter combination, the fact that most capillaries were not perfectly circular, but rather angular at some part, was useful. When capillary profiles were observed by fluorescence microscopy, their shape was compared with that displayed on the video screen of the image analyzer. Gray filters were then inserted into the light path of the excitation light until the shape of the selected capillary on the video screen of the image analyzer completely resembled the shape of the capillary that could be observed through the ocular of the microscope. Then, the cross-sectional area of that capillary profile was measured. To verify the time course of the arterial concentration of Evans blue, the aluminum foil with the sampled blood droplets was cut into strips with one droplet per stripe. To minimize evaporation, immediately after decapitation of the animal, the first droplet together with the aluminum foil, was put into a small air tight tube. After weighing the tube, the blood droplet was washed away from the foil with distilled water. Then, the foil was dried, put back into the tube, and the tube weighed again; the difference represented the weight of the droplet. Pilot experiments have shown that the weight of all droplets of one experimental series varied by <± 2%. Since the weight of the droplets was defined by this procedure, all other droplets were diluted with 3 ml of saline solution and centrifuged. The concentration of Evans blue in each droplet was then calculated from the photometric absorption, using a Zeiss PMQ II Photometer (Zeiss), measured in the supernatant.
Measurement of CBF
In seven rats, local CBF was determined in the whisker-barrel cortex of both sides by the autoradiographic method of Sakurada et al. (1978) as described elsewhere (Göbel et al., 1989). To minimize the diffusion of the 4-iodo-N-methyl-[14C]-antipyrine during the time between decapitation and freezing, only brains that were dipped into cold 2-methylbutane within <50 s after decapitation were used. Using the funnel technique, Ponten et al. (1973) have shown that the tissue 1 mm beneath the surface is frozen within 10–20 s. Besides, no major diffusion of the 4-iodo-N-mefhyl-[14C]-antipyrine could be detected in the cortex of rat brains that had been frozen in situ immediately after decapitation (Williams et al., 1991). Brains were cut tangentially to the whisker-barrel field of the cerebral cortex, as described above, and alternate 20 μm sections taken either for autoradiography or staining for succinate dehydrogenase activity (see above) to verify the position of the whisker-barrel field.
Analysis of data
In each rat, the difference of the CV (SD/mean × 100%) between the left and right sides of the whisker-barrel cortex were calculated for intracapillary Evans blue concentrations. These values as well as the differences of blood flow between the left and right sides of the whisker-barrel cortex were related to the corresponding stimulation frequency. In order to test whether all whisker stimulations were followed by changes in blood flow and/or perfusion heterogeneity, the data obtained for all different stimulation frequencies were pooled. Then, the existence of significant differences in blood flow and perfusion heterogeneity between the stimulated and the contralateral control side was tested for using the Wilcoxon test for pair differences. Differences in the physiological variables between the Evans blue and the iodoantipyrine groups were tested using Student's t-test for independent samples.
RESULTS
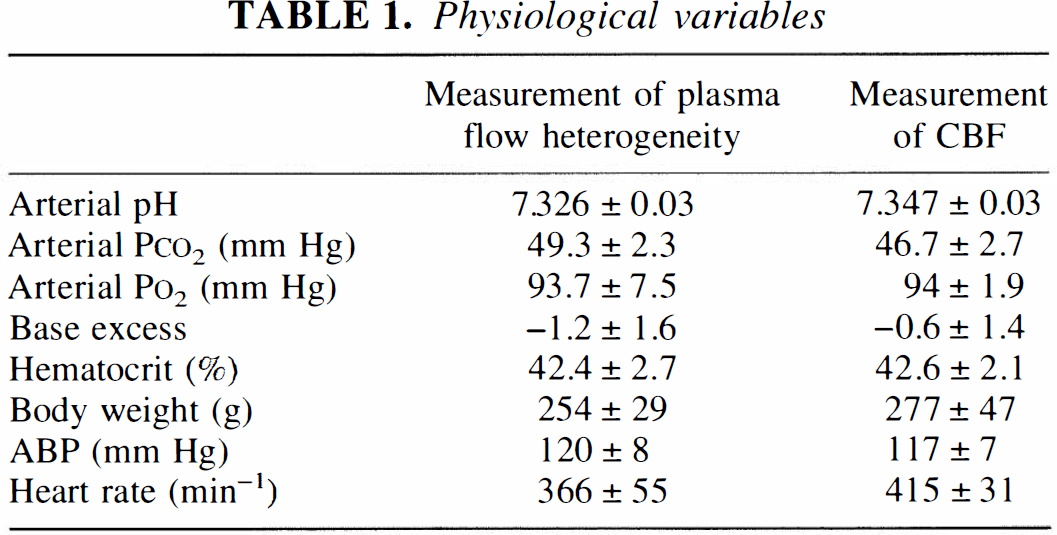
Table 1 shows the physiological variables measured during whisker stimulation. No significant differences could be found between groups.
Physiological variables
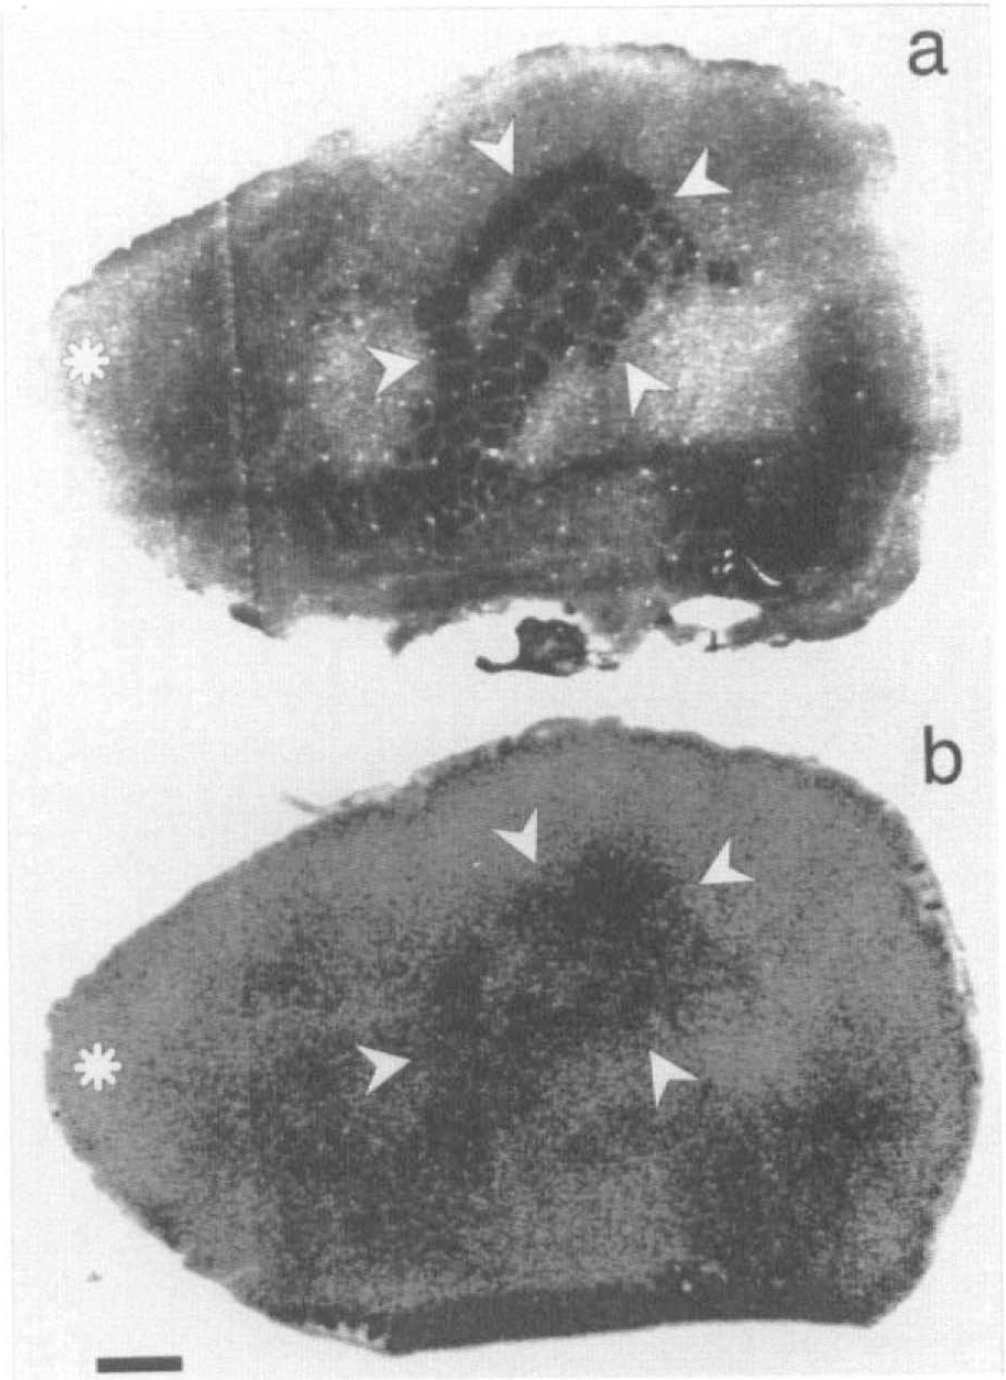
The exact position of the whisker-barrel cortex was verified for each section from adjacent sections stained for the activity of succinate dehydrogenase. Figure 2A shows an example of a succinate dehydrogenase stain of the whisker-barrel field in which the area of measurement has been marked. In this figure, the typical pattern of the whisker-barrel cortex (Woolsey and Van-der-Loos, 1970; Riddle et al., 1993) is clearly visible Figure 2B shows, for comparison, an autoradiogram of 14C-iodoantipyrine obtained from the adjacent section in which the whisker-barrel field that corresponds to the adjacent histological stain has been marked. Figure 3 shows the “tuning curve” of the blood flow response in the whisker-barrel cortex relative to functional activation at different stimulation frequencies. Differences between blood flow of the stimulated side of the whisker-barrel cortex and the contralateral unstimulated side reached a maximum of 40 ml/100g/min at 5 Hz. Values for CBF obtained at different stimulation frequencies are summarized in Table 2.
CBF and plasma flow heterogeneity in the left and right sides of the whisker-barrel cortex at different stimulation frequencies of whiskers
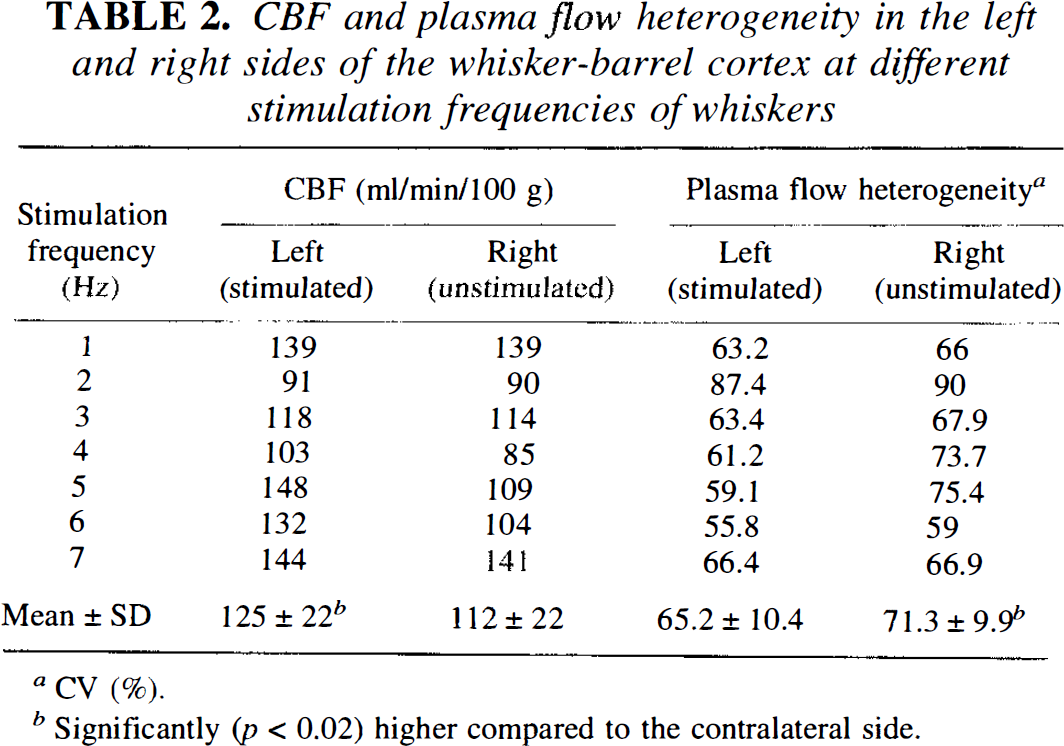
CV (%).
Significantly (p < 0.02) higher compared to the contralateral side.
For analysis of intracapillary Evans blue concentration within the area of the whisker-barrel cortex, an identical stimulation protocol was chosen. Figure 4 shows the “tuning curve” of the frequency response of the heterogeneity of intracapillary Evans blue concentration in the whisker barrel cortex relative to functional activation. Differences between the plasma flow heterogeneities of both sides reached a maximum of 17% at 5 Hz. Values of the CVs obtained at the different stimulation frequencies are summarized in Table 2.
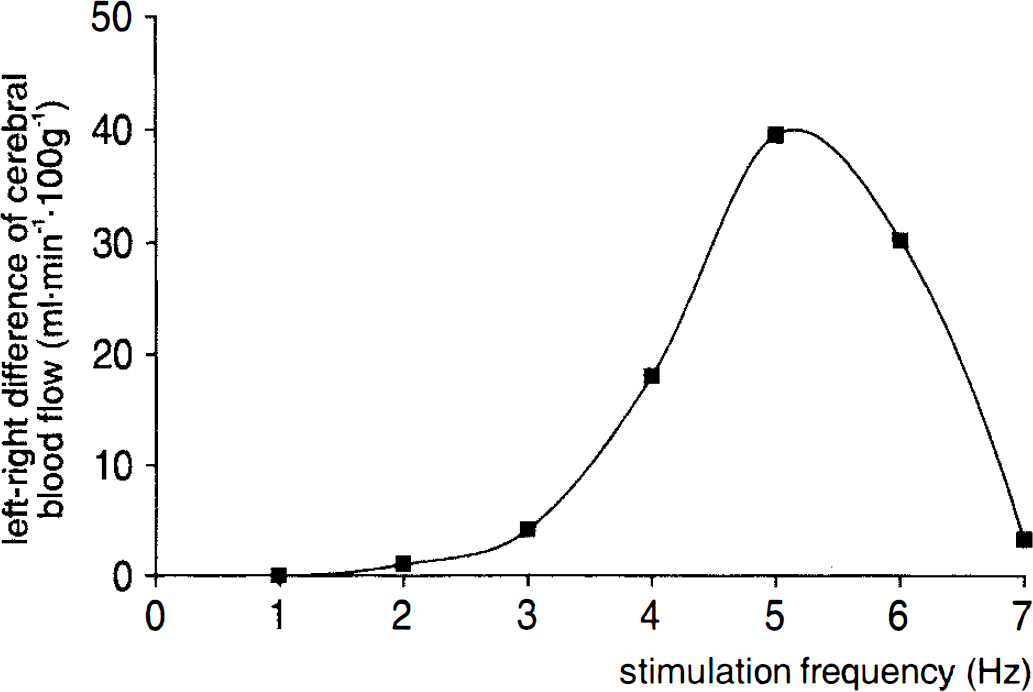
Left-right difference of blood flow in the whisker-barrel cortex plotted against the frequency of mechanical whisker stimulation. Differences in CBF between the activated whisker-barrel cortex and the corresponding nonactivated contralateral cortex showed a maximum of 40 ml 100 g min−1 at 5 Hz. This finding indicates an optimal stimulation frequency of 5 Hz for the induction of functional hyperemia.
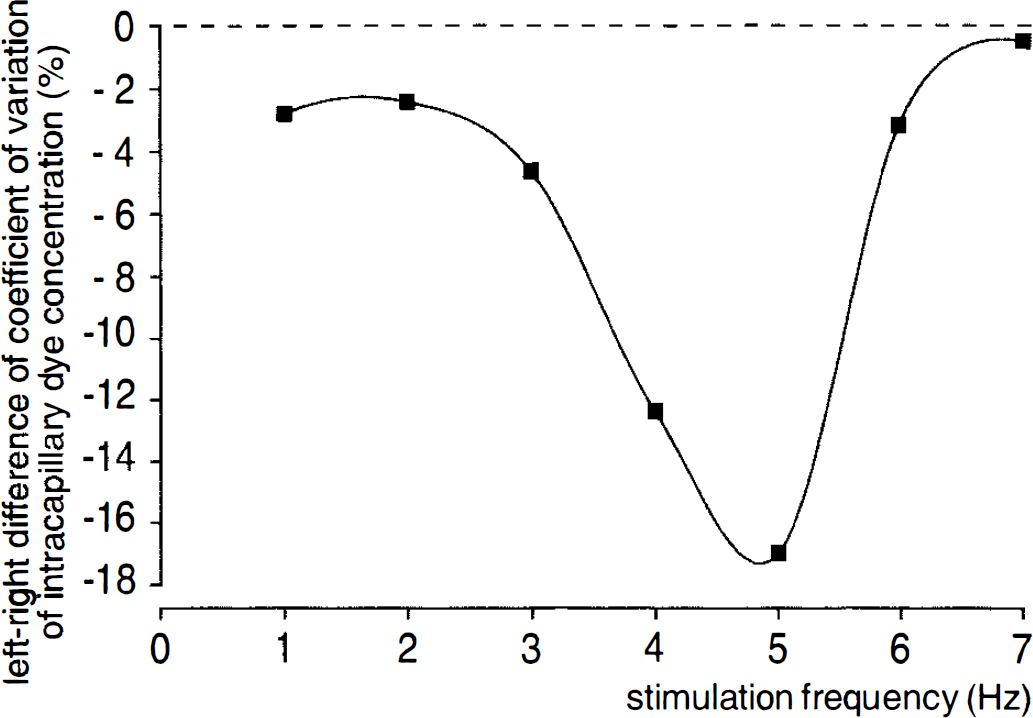
Left-right difference of the CV of intracapillary dye concentration in the whisker-barrel cortex plotted against the frequency of mechanical whisker stimulation. The difference is maximal at a stimulation frequency of 5 Hz, indicating the most homogeneous perfusion at this frequency.
DISCUSSION
In the present study, heterogeneity of the capillary plasma perfusion was investigated during functional hyperemia in the rat-whisker barrel cortex. Functional activation of the brain cortex was induced by deflection of the mystacial vibrissae at frequencies of 1–7 Hz. Local blood flow and plasma perfusion heterogeneity showed a reciprocal dependency on the stimulation frequency. The maximal blood flow observed at 5 Hz was paralleled by a minimum of the perfusion heterogeneity at this stimulation frequency, indicating a decreased heterogeneity of capillary transit times during functional hyperemia in the brain.
Because of its large size and ease of detection, the whisker-barrel cortex of rodents has been the subject of investigation in several studies of functional brain activation. Rhythmical deflection of the whiskers has been used for the investigation of cerebral blood flow during functional activation of the brain (Cox et al., 1993; Lindauer et al, 1993; Masino et al., 1993; Moskalenko et al., 1996). In addition, cerebral glucose metabolism (Durham and Woolsey, 1978; Melzer et al, 1985) and various electrophysiological parameters have been studied (Simons, 1978, 1985; Welker et al., 1993). Acute removal of single rows of whiskers (Durham and Woolsey, 1978) or stimulation of single whiskers (Melzer et al., 1985) in awake mice results in corresponding patterns of decreased or increased glucose metabolism in single barrels of the contralateral whisker-barrel field. Since mechanical stimulation of whiskers is a well-established approach to the study of functional hyperemia in the brain, it was chosen for the present study to test the heterogeneity of plasma flow in the cerebral microcirculation during functional hyperemia.
The present study shows heterogeneity of plasma transit time in different capillaries during unstimulated control conditions and a decrease of heterogeneity during functional hyperemia. Heterogeneity of the cerebral microcirculation has already been indicated by a less direct approach performed in- humans. Using the double-indicator method, extraction of test substances e.g.,
The cause of the heterogeneity of plasma flow and its changes observed in the present and our recent studies (Abounader et al., 1995; Vogel et al., 1996) is unknown. Morphological differences in capillary length and diameter might cause variations in the flow resistance of different capillaries resulting in heterogeneity of plasma flow. However, differences in capillary morphology cannot explain the changes in heterogeneity of plasma flow that occur parallel to changes in CBF. Therefore, additional mechanisms appear likely to contribute to the observed variation in the heterogeneity of capillary plasma flow. Such mechanisms could be based on active regulatory adjustments within the microvascular network and/or passive changes of flow distribution within the network due to the unique flow properties of blood. Active adjustments could be based on changes of arteriolar or precapillary resistance, either of which could result in corresponding changes in the heterogeneity of microvascular flow. Active adjustments of microvascular flow could also be caused by an endothelial bulging resulting in a redistribution of microvascular flow in individual capillaries (Lubbers et al., 1979; MacDonald et al., 1995). Passive mechanisms could depend on the nonlinear rheological properties of blood, e.g., the nonuniform distribution of erythrocytes at capillary bifurcations (phase separation) (Yen and Fung, 1978; Pries et al., 1986), dependency of blood viscosity on hematocrit (Pries et al., 1992), vessel diameter (Fahraeus and Lindqvist, 1931; Pries et al., 1992), and shear rate (Chien, 1970; Sirs, 1991). Parallel changes of the heterogeneity of plasma flow (Abounader et al., 1995) and erythrocyte flux (Villringer et al., 1994) observed during hypercapnic hyperemia may argue for a primary cause of the erythrocytes for induction of flow heterogeneities, which are followed by corresponding secondary changes in plasma flow heterogeneities.
From the present study, it can be concluded that an increase in blood flow induced by functional activation of the brain cortex results in a decrease of the heterogeneity of capillary plasma perfusion. Microvascular perfusion in the brain appears to become more homogeneous during an increase in CBF, independent of the cause of the hyperemia.
Footnotes
Abbreviations used
Acknowledgment:
This study was supported by a grant from the Deutsche Forschungsgemeinschaft.