
Abstract
The aim of the present study is to describe and validate a method for accurate quantification of 5-hydroxytryptamine (5-HT)2A receptors using [18F]altanserin-positron emission tomography (PET) and the bolus/infusion approach. A bolus/infusion ratio of 1.75 h aimed at attaining rapid steady state in blood and brain was predicted from previous bolus studies performed in our laboratory. The infusion schedule was tested in normal subjects (n = 10) using dynamic PET and frequent plasma sampling for 6 h. Steady state was attained in brain and plasma within 2 h, and time–activity curves remained constant for another 3 h. To represent free and nonspecifically bound [18F]altanserin and its radiolabeled metabolites only, cerebellum must show no displacement in 5-HT2A displacement studies. To validate this, saturating doses of cold ketanserin were administered and it was found that specific binding of [18F]altanserin decreased uniformly to the level of the cerebellum and no change in the cerebellar time–activity curve was found after ketanserin administration. A shorter experimental setup was tested in a second group (n = 20) including patients with neuropsychiatric disorders. Dynamic PET (five frames of 8 minutes each) and venous blood sampling at midscan time started 2 h after [18F]altanserin administration. The mean percentage rate of change per hour in the outcome parameter, DV3′, was low (mean −0.3% h−1; range −7.3–7.2% h−1) and no correlation of DV3′ versus time was demonstrated. It is concluded that 5-HT2A receptor studies can be conducted within 2 h of [18F]altanserin infusion, yielding reliable results.
Keywords
Dysfunction of the 5-hydroxytryptamine (5-HT)2A receptors is thought to be implicated in the pathogenesis of several neuropsychiatric disorders and in the mechanism by which medication relieve symptoms. [18F]Altanserin has proven useful for PET studies of the serotonergic system (5-HT) (Lemaire et al., 1991). Altanserin binds with high affinity to the 5-HT2A receptor (Ki = 0.3 nmol/L) and a lower affinity to other serotonin receptor subtypes [5-HT1A KI = 1,570 nmol/L, 5-HT2C KI = 6.0 nmol/L, 5-HT6 Ki = 1,756 nmol/L, 5-HT7 Ki = 15 nmol/L; (Goffinet et al., 1990; Tan et al., 1999)] and other receptor sites [α1 Ki = 4.55 nmol/L, D2 Ki = 62 nmol/L, histamine H1 Ki = 39 nmol/L; (Leysen, 1989)]. [18F]Altanserin crosses the blood–brain barrier (BBB) rapidly (peak cortical concentration at approximately 30 minutes after bolus injection) with a maximal uptake of 3% of the injected dose (Biver et al., 1994; Sadzot et al., 1995).
In humans, four radiolabeled metabolites of [18F]altanserin have been demonstrated, and two of them are identified as [18F]altanserinol and a secondary metabolite of [18F]4-(4-fluorobenzoyl)piperidine (FBP) (Tan et al., 1999). Altanserinol and 4-FBP are also known as metabolites of the structurally closely related ketanserin (Meuldermans et al., 1984). The radiolabeled metabolites of [18F]altanserin pass the BBB; however, only [18F]altanserinol and in particular the secondary metabolite of [18F]4-FBP have been demonstrated to significantly contribute to the total amount of measured radioactivity (Smith et al., 1998). Recently, Price et al. (2001a) demonstrated a substantial uptake of [18F]4-FBP (and/or their metabolites) in the baboon brain 40 minutes past bolus injection with tissue to plasma ratios close to 30. In vitro receptor binding studies only demonstrated negligible binding of [18F]altanserinol and [18F]4-FBP to 5-HT receptors in rat cortex (Tan et al., 1999), and PET studies in baboons demonstrated that nonspecific binding of [18F]altanserinol and [18F]4-FBP (and/or their metabolites) at later times (>20 minutes) was fairly uniform across regions (Price et al., 2001a).
In cerebellum, low levels of 5-HT2A receptors are present (Pazos et al., 1987; Eastwood et al., 2001). Thus, the presence of quantitatively important amounts of BBB-penetrating radiolabeled metabolites of [18F]altanserin may contribute to the inability of cerebellar time–activity curves to fit a one-tissue compartment model (Biver et al., 1994). Mintun and co-workers proposed the use of dual input functions (representing parent compound and BBB penetrating metabolites) in modeling the cerebellar time–activity curves with two parallel one-tissue compartment models and in constraining the size of the nonspecifically bound compartment of parent compound and BBB-penetrating metabolites in regions rich with 5-HT2A receptors to the values obtained in cerebellum (Mintun et al., 1996). In a recent work, Price et al. (2001a) concluded that the dual-input function compartmental model is the most comprehensive and valid method for the analysis of human bolus injection [18F]altanserin PET data. However, the statistical quality of PET data and HPLC data makes the extraction of binding parameters using dual input functions a difficult task in terms of experimental complexity (scan times >90 minutes, many arterial blood samples for HPLC analysis) and patient discomfort. Thus, overall the authors recommend using a single input function and Logan analysis of bolus data—disregarding the presence of BBB-permeable metabolites (Price et al., 2001b).
An alternative to administering the tracer as a bolus alone is to combine it with a constant infusion to obtain tracer steady state in brain and blood (Patlak and Pettigrew, 1976; Carson et al., 1993; Abi-Dargham et al., 1994). For most tracers this approach is both analytically and experimentally simple. For quantification of [18F]altanserin binding to 5-HT2A receptors, this approach offers the additional advantage of simple correction for BBB-penetrating metabolites: at [18F]altanserin steady state the outcome measure, DV3′, is calculated by subtracting the radioactivity in cerebellum from the region of interest and dividing by the plasma concentration of [18F]altanserin. This approach requires that the specific binding of [18F]altanserin to 5-HT2A receptors in cerebellum is negligible so that the radioactivity in cerebellum represents nonspecifically bound and free radioligand and labeled metabolites only, and, furthermore, that this concentration is identical to that in other regions of interest (ROIs).
Van Dyck et al. (2000b) described the use of the bolus-infusion approach for quantification of [18F]altanserin and the deuterated analog of [18F]deuteroaltanserin (van Dyck et al., 2000a). Using a bolus/infusion ratio of 3.2 h (i.e., the bolus component is worth 3.2 h of infusion), steady state was not attained in brain and plasma until 5 to 6 h after tracer injection. This long experimental time is likely to hamper the use of the bolus/infusion approach in clinical settings, and it also complicates quantification because the decay of [18F]altanserin will imply problems with count statistics, particular for the HPLC data.
The aim of the present study was to describe a method that both provides reliable quantitative estimation of receptor parameters and easy implementation in a clinical setting. We also conducted a thorough validation of the assumptions regarding the use of cerebellum as a reference region and finally, the vulnerability of the setup was tested in desaturation experiments.
MATERIALS AND METHODS
Subjects
Studies were conducted in two separate groups. The first group consisted of 11 healthy subjects with a mean age of 42 years (range 23–78 years). No subjects had a history of neurologic or psychiatric disorders. The experimental setup of the second population was based on the data of the first population. The second group consisted of 20 subjects with a mean age of 50 years (range 21–79 years); 14 subjects fulfilled the diagnostic criteria of obsessive-compulsive disorder (DMS-IV and the IDC-10 criteria) or had mild cognitive impairment. Physical examinations gave normal results in all subjects, and all subjects claimed to be alcohol free and drug free. The ethical committee of Copenhagen and Frederiksberg had approved the study (KF 02–058/99 and KF 12–029/02).
Radiochemistry
[18F]Altanserin was synthesized as previously reported (Lemaire et al., 1991). The specific activity at the end of synthesis was 166 ± 58 GBq/mmol, and the radiochemical purity was greater than 99%.
Positron emission tomography studies
Cannulas were inserted into both cubital veins for blood sampling and radiotracer administration, respectively. Subjects received a maximum of 3.7 MBq/kg body weight of [18F]altanserin. [18F]Altanserin was administered as a combination of a bolus injection and a continuous infusion to produce tracer steady state in tissue and blood. In one subject, a bolus/infusion ratio of 3.2 h was used (as in van Dyck et al., 2000b), and in another 30 subjects a bolus/infusion ratio of 1.75 ± 0.03 h was used. The latter bolus/infusion ratio was based on time–activity curves acquired for 2 h in five healthy subjects after a bolus injection (unpublished data). The mean bolus arterial input function from these five experiments was decomposed into a sum of three exponential functions

where Ai (unitless) is the relative zero-time intercept of each exponential, and ai (min−1) is the elimination rate constant associated with each exponential

The plasma concentration of tracer

after a bolus/infusion experiment was simulated using Eq. 1 (Pinborg et al., 2000):
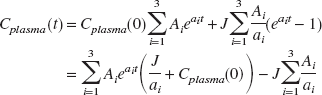
where

(MBq mL−1) is the peak arterial plasma concentration of tracer after a bolus injection, and J (MBq mL−1 min−1) is the arterial plasma concentration of tracer after 1 minute of constant infusion. For most ligands, the “unit impulse function” of the plasma () will be completely dominated by the slowest component

after 60 to 75 minutes. From Eq. 1, it follows that plasma steady state is hastened when
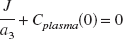
Because Cplasma (0) and J depend on the same initial volume of distribution of the tracer, the optimal bolus/infusion protocol, (B/I), to hasten tracer steady state in plasma will be
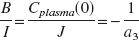
In each of the five healthy subjects, the elimination rate constant (a3) associated with the slowest component of bolus arterial input curve was calculated (−0.66 h−1, −0.57 h−1, −0.77 h−1, −0.46 h−1, −0.51 h−1). The optimal bolus/infusion protocol was calculated according to Eq. 2. The mean value of −1/ a3 in the five healthy individuals was 1.75 ± 0.36 h. Thus, a bolus/infusion ratio of 1.75 h was used to hasten steady state in plasma.
PET scanning was performed in a GE-Advance scanner (General Electric Medical Systems, Milwaukee, WI, U.S.A.) operating in three-dimensional (3D) acquisition mode with technical specification as previously described (DeGrado et al., 1994; Lewellen et al., 1996). Subjects were positioned with the orbitomeatal line parallel to ring planes of the detector and head movements were restricted with straps. To facilitate accurate repositioning, marks were placed along the orbitomeatal line and glabella and realigned during the experiment with laser lights. For correction of tissue attenuation, 10-minute transmission scans were performed before each PET session using retractable 68Ga/68Ge-pin sources. The transmission scans were corrected for tracer activity by a 5-minute emission scan performed in two-dimensional mode.
Dynamic PET was performed in two parts: First, 11 subjects were examined with scanning protocols of 6 h. In the first subject, PET scanning was acquired (21 frames of 10 to 20 minutes) during 7.5 h of constant [18F]altanserin infusion using a bolus/infusion ratio of 3.2 h. In the remaining 10 subjects, a bolus/infusion ratio of 1.75 h was used. In 6 of the 10 subjects, PET scanning was acquired (15 to 20 frames of 10 minutes) from 60 to 360 minutes during [18F]altanserin infusion. Subjects remained in the scanner as long as possible during the experimental time, taking one to two breaks out of the scanner. In 2 of the 10 subjects, desaturation experiments were done: PET scanning was acquired continuously from 120 to 240 minutes, but [18F]altanserin infusion was stopped after only 160 minutes. In another two subjects, displacement studies were conducted: PET scanning was acquired continuously from 120 to 300 minutes, and at 180 minutes cold ketanserin (Pharmacia) was administered intravenously as a bolus (10 mg) followed by a constant infusion (6 mg h−1) throughout the study. This administration schedule is known not to influence cerebral hemodynamic parameters and is without significant clinical side effects (Olsen et al., 1993). In all subjects, 15 to 20 venous blood samples were drawn frequently during the experimental time for determination of parent compound in plasma.
In the second part, the clinical application of the method with a shorter scan duration was examined in 20 subjects. PET scanning was acquired (5 frames of 8 minutes) from 120 to 160 minutes during [18F]altanserin infusion. Five venous blood samples were drawn at midscan times for determination of plasma parent compound.
Data were reconstructed into a sequence of 128 ×128 × 35 voxel matrices, each voxel measuring 2.0 × 2.0 × 4.25 mm, with software provided by the scanner manufacturer. A 3D reprojection algorithm with a transaxial Hann filter (6 mm) and an axial ramp filter (8.5 mm) was applied. Corrections for deadtime, attenuation, and scatter were performed.
Determination of parent compound in plasma
The plasma metabolites of [18F]altanserin were determined using a modification of previously published procedures (Sadzot et al., 1995; Lopresti et al., 1998; van Dyck et al., 2000b). Plasma whole blood samples (13 mL) were centrifuged for 10 minutes at 4700 g. Plasma (0.5 mL) was counted in a gamma counter (Cobra 5003, Packard Instruments, Meriden, CT, U.S.A.) for determination of radioactivity. Five milliliters of plasma was mixed with acetic acid (20 mL, 50 mmol/L) and eluted through a Sep-Pak C18 cartridge (Waters Associates, Milford, MA, U.S.A.), which had been preactivated with methanol (2 mL) and water (10 mL). The Sep-Pak was washed with triethylamine (10 mL, 0.1%) and water (10 mL) before the outlet was connected to a filter (Millipore 0.45 μm), and the radioactive content was eluted with methanol (1 mL) followed by distilled water (3 mL). The resulting mixture (4 mL) was injected on the semipreparative HPLC system [column: Waters μBondapack C18, 7.8 × 300 mm; solvent A: CH3COONH4 (0.073 mol/L, adjusted to pH 4.5 with CH3COOH); solvent B: 70% CH3CN/30% CH3COONH4 (0.22 mol/L); flow: 6 mL/min)] equipped with an ultraviolet detector (254 nm) and a Packard flow scintillation analyzer (500TR series) connected in series. Solvent B was increased with a linear gradient from 25% to 100% for 10 minutes. The [18F]altanserin eluted after 8.4 minutes and was well separated from the metabolites eluting after 5.1 minutes, 5.6 minutes, and 7.3 minutes, respectively.
Magnetic resonance imaging studies
Magnetic resonance imaging was performed on a 1.5-T Vision scanner (Siemens, Erlangen, Germany). One hundred fifty-eight slices were acquired continuously in the sagittal plane using a three-dimensional MPRAGE sequence (TE = 4 milliseconds, TR = 11 millisecond, TI = 300 milliseconds, flip angle = 12°, image matrix = 256 × 256, slice thickness = 1.14 mm, in-plane resolution 1.21 × 1.21 mm).
Positron emission tomography magnetic resonance imaging coregistration
Positron emission tomography images were aligned on a voxel-by-voxel basis using a three-dimensional automated six parameters rigid body transformation (Woods et al., 1992) and the anatomical magnetic resonance imaging scans were coregistered to the individual averages of the aligned PET images (Evans et al., 1991; Willendrup et al., 2002). For coregistration, eight corresponding landmarks in the two imaging modalities were selected and a six-parameter transformation transfer function was estimated. Regions of interest were delineated on the coregistered magnetic resonance imaging images and applied to the aligned PET scans, thus generating time–activity curves for neocortical ROIs, striatum, thalamus, and cerebellum.
Derivation of binding parameters
Distribution volume (DV) is defined as the ratio of the steady-state tissue ligand concentration to the steady-state plasma ligand concentration. In receptor studies, the DV of a ROI (DVROI) represents the sum of the specifically bound DV (DV3) and the nonspecifically bound DV (DV2). Nonspecifically bound DV represents radiolabeled ligand and potential metabolites in the brain, free or nonspecifically bound to proteins and lipids. Distribution volume of a ROI is related to binding parameters as follows:
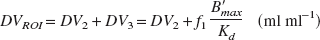
where f1 is the tracer fraction unbound to plasma proteins, assuming that the concentration of free ligand in tissue water equals the concentration in plasma water, B ′max (nmol/L) is the concentrations of receptors available for binding, and Kd (nmol/L) is the equilibrium dissociation constant of [18F]altanserin. From Eq. 3 it can be seen that DVROI is a linear function of B ′max, provided that Kd and f1 are unaltered. Because of the overall physicochemical constancy of the brain tissue, DV2 is often assumed to equal the DV of a ROI devoid of receptors (DVREF). Inserting DV2 =DVREF and rearranging Eq. 3 yields the outcome measure used in this study:
RESULTS
Bolus/infusion ratio of 3.2 h
Figure 1A depicts the time–activity curves after the administration of [18F]altanserin at a bolus/infusion ratio of 3.2 h. The [18F]altanserin plasma time–activity curve reaches a plateau level after approximately 180 minutes. The [18F]altanserin tissue time–activity curves decrease until approximately 200 minutes and increase subsequently until the end of the study. The time–activity curves representing regional specific binding reach a plateau level after approximately 120 minutes in striatum and after approximately 240 minutes in cortex. Thus, from 240 minutes after tracer injection and until the end of the study, rates of change are low in plasma (2.2%/h), cortex (6.3%/h), and striatum (1.7%/h). The rates of change were calculated by dividing the linear regression slope by the mean value in the same time interval.
Bolus/infusion ratio of 1.75 h
In Fig. 1B each data point represents the mean value of the six subjects studied with the bolus/infusion ratio of 1.75 h. From 110 minutes to 300 minutes after tracer injection, the time–activity curves representing regional specific binding and plasma parent compound attain plateau levels, and the rates of change of the mean time–activity curves are low in plasma (1.6%/h), cortex (1.3%/h), and striatum (4.5%/h). No significant correlations between regional specific binding versus time, and plasma parent compound versus time were found in any of the six subjects. From approximately 300 minutes after tracer injection, a tendency towards an increase in regional specific binding and plasma parent compound is observed. Standard deviations are large (approximately 25% of the mean radioactivity in plasma and ROIs) and not added to Fig. 1A. The standard deviations primarily represent interindividual variability in radioactivity concentration.
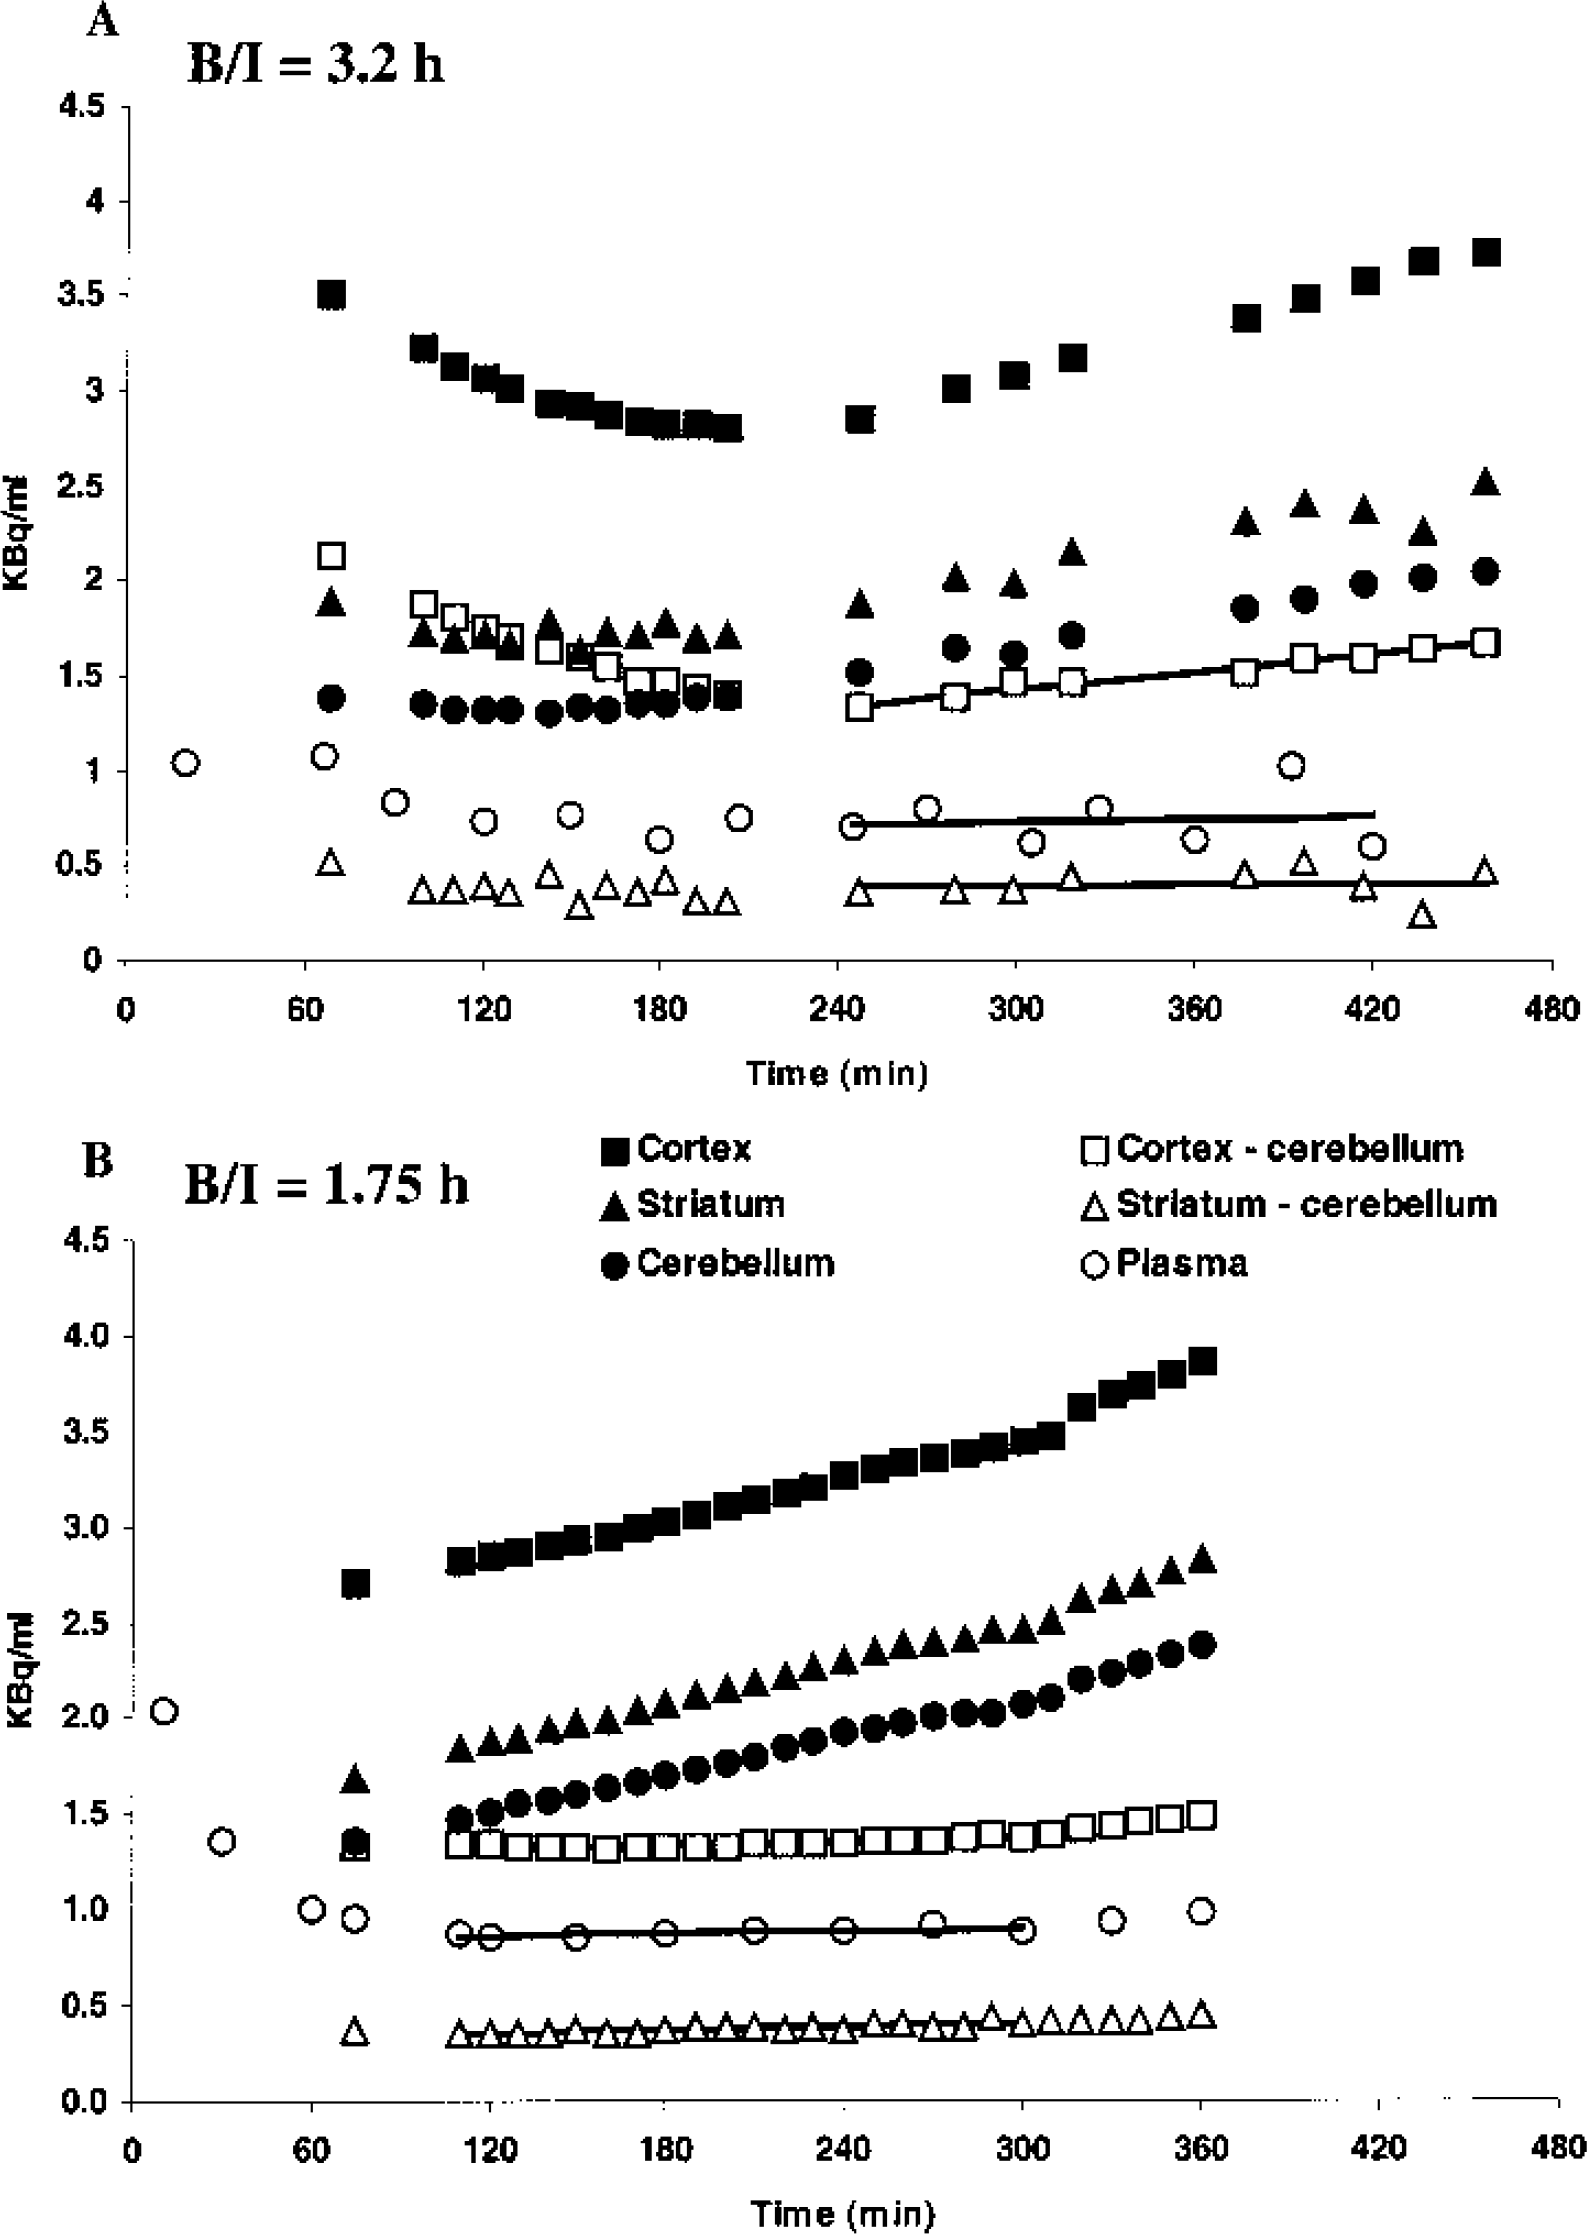
Figure 2 shows the mean normalized cortical, striatal, and plasma time–activity curves. For each subject, the time–activity curves were normalized, with the individual time-averaged radioactivity concentration from 110 to 300 minutes. Thus, after normalization it is possible directly to compare at every time point how the radioactivity concentration varies with the mean “steady state” radioactivity concentration in plasma, receptor-poor regions, and receptor-rich regions. For times where the mean normalized radioactivity concentration is close to 1 (the apparent steady-state value), a large standard deviation would imply the presence of individuals in the population where the plasma or tissue radioactivity concentration is notably different from the individual mean radioactivity concentration. For the large cortical ROI, the normalized time–activity curve attains a plateau level quickly, and except for t = 75 minutes, standard deviations are small (<2.1%) throughout the experiment. For the small striatal ROI and the plasma normalized time–activity curves, larger variations are found, also after 75 minutes. However, from 110 minutes until the end of the experiment, all standard deviations are smaller than 10% of the average normalized radioactivity concentration. No significant correlations between standard deviations versus time are demonstrated from 110 to 360 minutes for striatum (P > 0.22) and plasma (P > 0.08) using Pearson's product moment correlation analysis.
Average time course with standard deviation of normalized plasma parent compound and specific binding in cortex and striatum for the six subjects of Fig. 1B. Normalization has been performed by dividing the value at each point of time by the average value from 110 to 300 minutes.
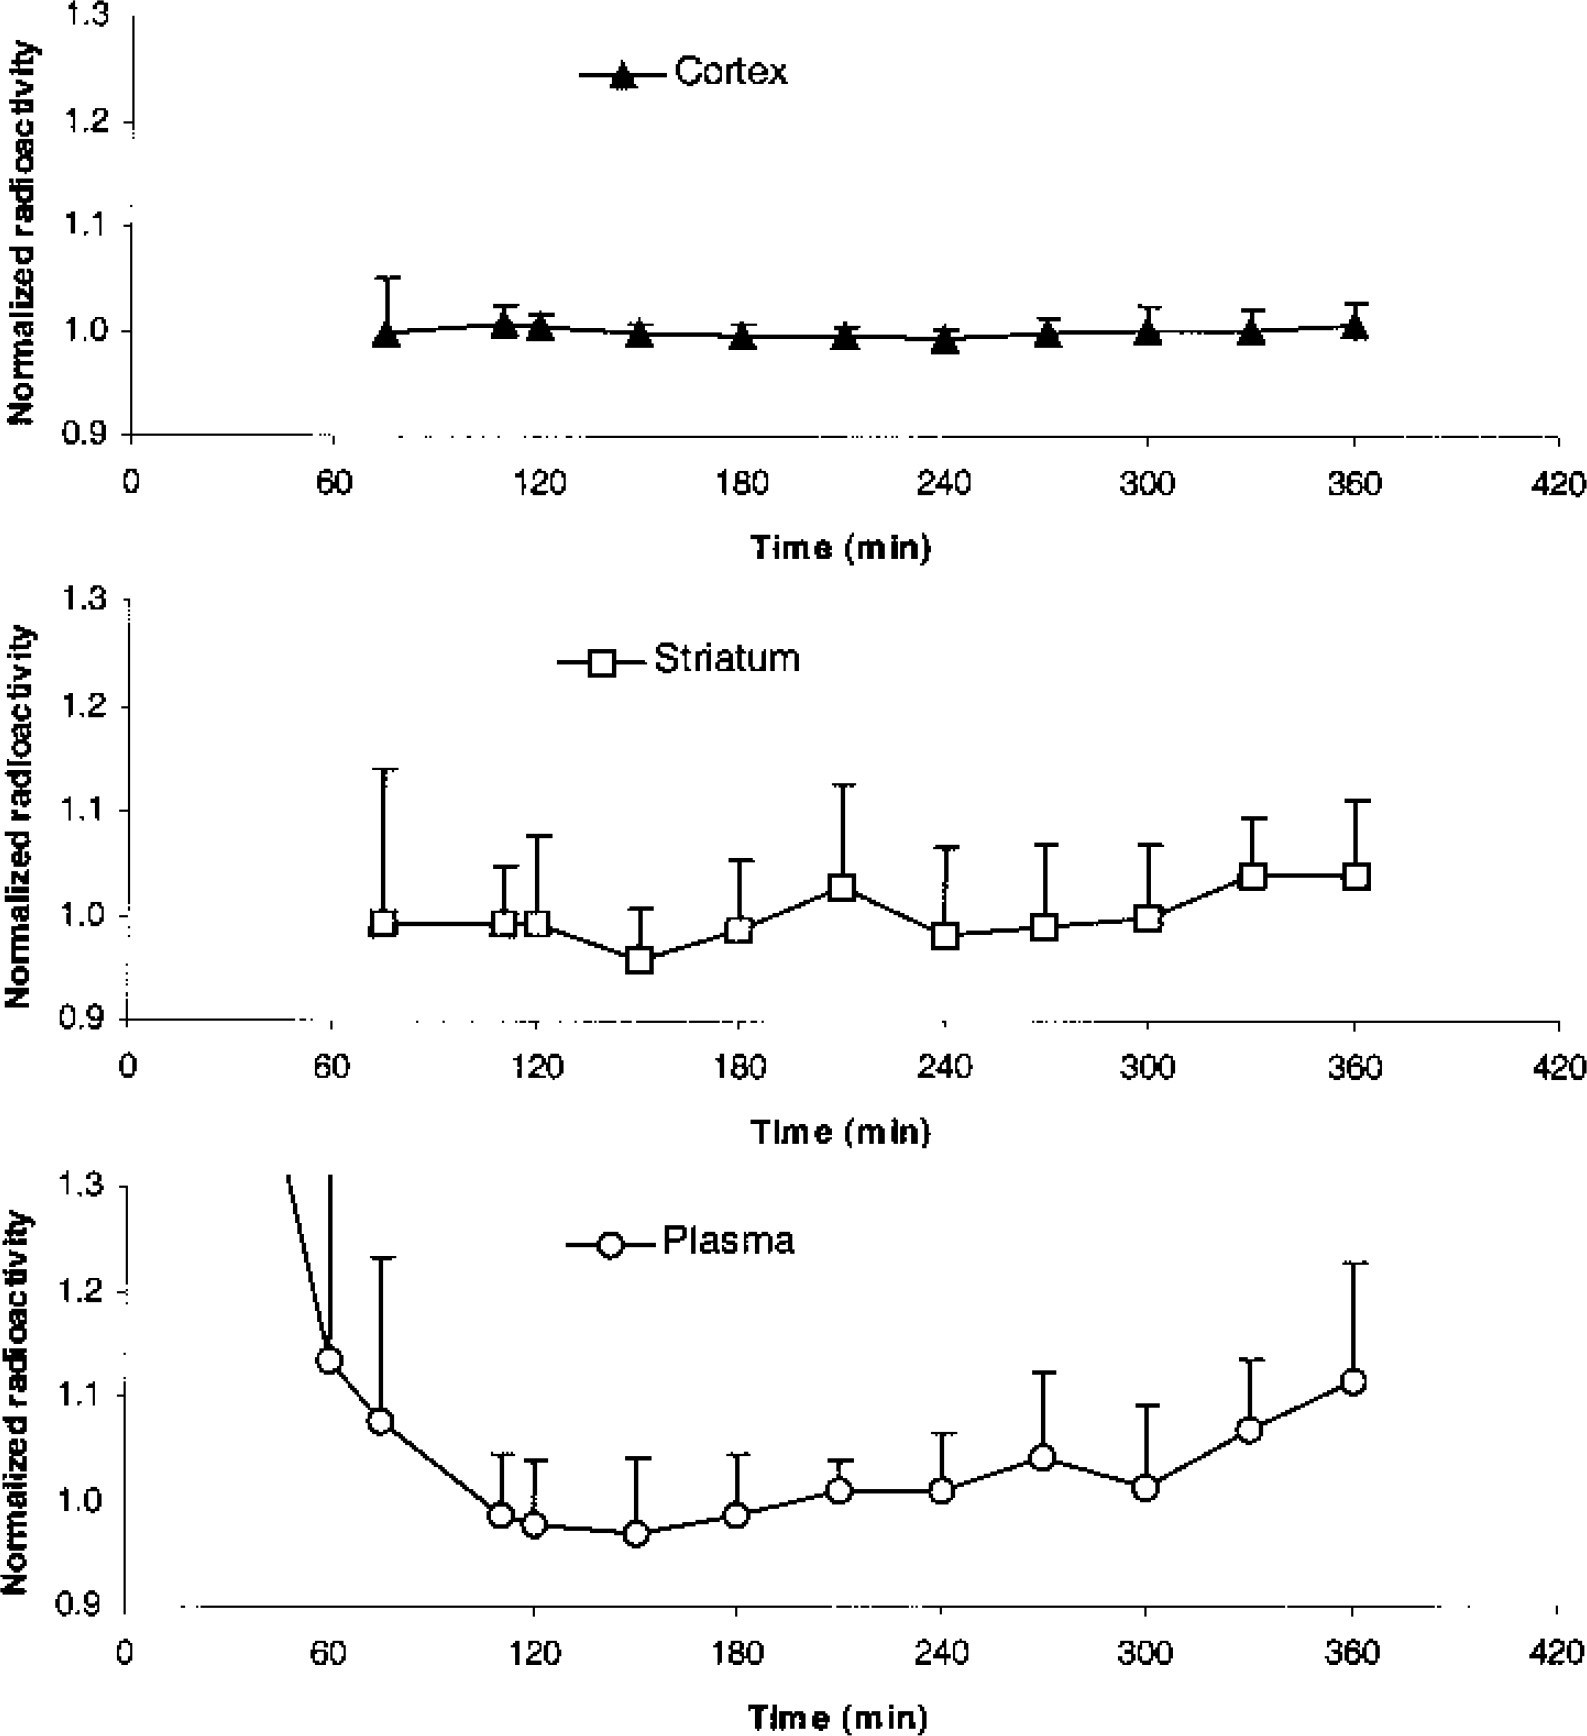
Figure 3 depicts the mean DV3′ as a function of time in three cortical and two subcortical ROIs. Steady-state conditions are attained from approximately 110 minutes after tracer injection in both receptor-rich and receptor-poor ROIs and no significant correlation between regional DV3′ versus time could be demonstrated for any of the six subjects.
Average time course of DV3′ in cortical regions of interest, striatum, and thalamus in six subjects after a bolus/infusion ratio of 1.75 h. Linear regression lines from 110 to 300 minutes are shown.
Table 1 shows mean regional DV3′ calculated between 110 and 300 minutes after tracer injection. Mean regional rates of change in the six subjects are low (−0.5 to 2.9%/h), but are the result of larger individual differences, especially in receptor-poor regions. Figure 4 shows mean cortical and striatal normalized DV3′ versus time in the six subjects. At each time point, the individual DV3′ value is normalized with the individual DV3′ value calculated from 110 to 300 minutes. Standard deviations are larger in the receptor-poor region compared to the receptor-rich region. After 75 minutes of tracer infusion, the standard deviations of the cortical normalized DV3′ are within 10% of the normalized DV3′ value at all other time points. The standard deviations of the normalized striatal DV3′ are significantly larger than the normalized cortical DV3′ (P < 0.001, paired two-tailed t-test), and contrary to the standard deviations of the normalized cortical DV3′, a significant correlation between the standard deviations of the normalized striatal DV3′ and time (110 to 360 minutes) is found (P < 0.01, Pearson's product moment correlation analysis).
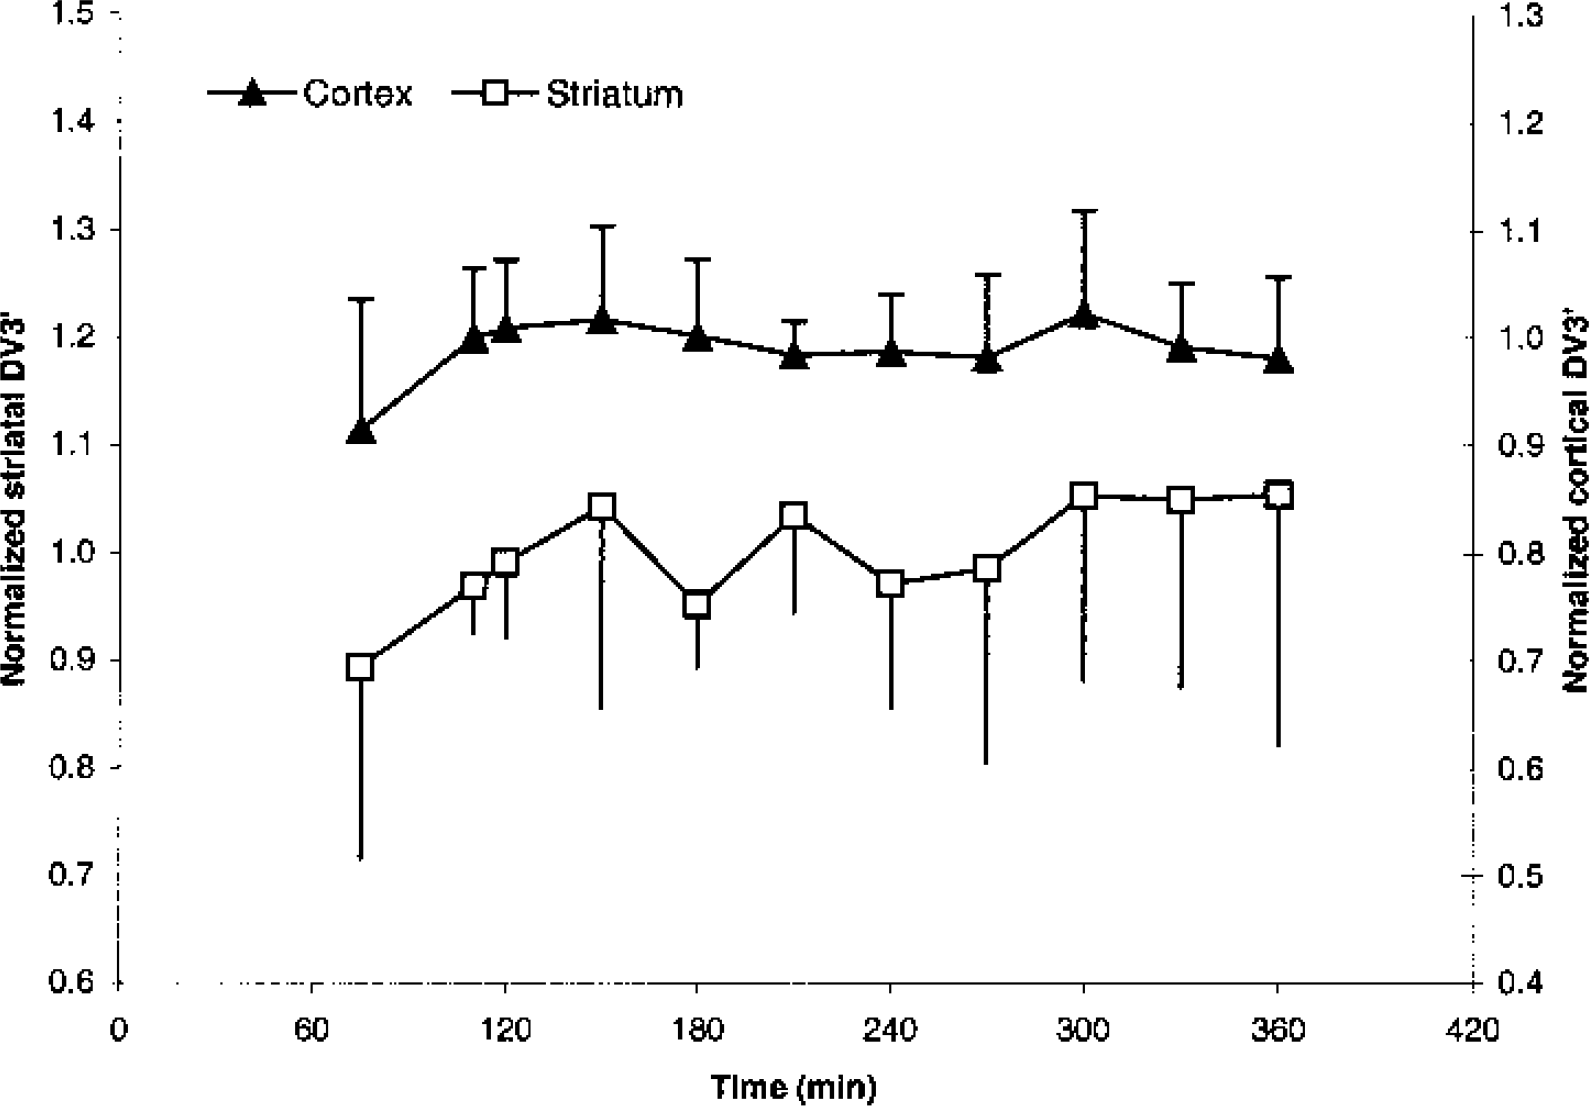
Average time course with standard deviation of normalized cortical DV3′ (primary axis) and striatal DV3′ (secondary axis) in the six subjects of Fig. 3.
DV3′ and stability of DV3′ at steady state in six subjects
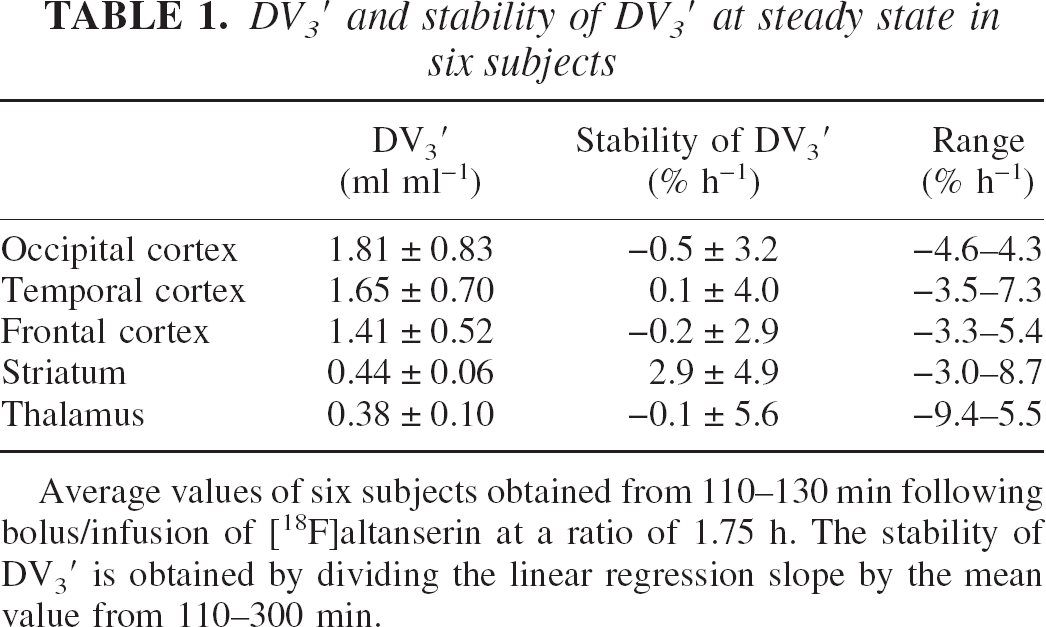
Average values of six subjects obtained from 110–130 min following bolus/infusion of [18F]altanserin at a ratio of 1.75 h. The stability of DV3′ is obtained by dividing the linear regression slope by the mean value from 110–300 min.
Desaturation studies
Figure 5 shows the mean time–activity curves of two subjects where PET scanning and blood sampling continued after tracer administration stopped at 160 minutes. Immediately, the parent compound in plasma begins desaturating, and after approximately 10 minutes, desaturation is also clearly observable in the cortex. From 120 to 160 minutes, steady-state values of DV3′(t) are attained. From approximately 190 minutes until the end of the study, a second plateau is attained. The mean apparent DV3′(190 to 235 minutes) was 35% (22% and 47%) larger than the mean steady-state DV3′(120 to 160 minutes).
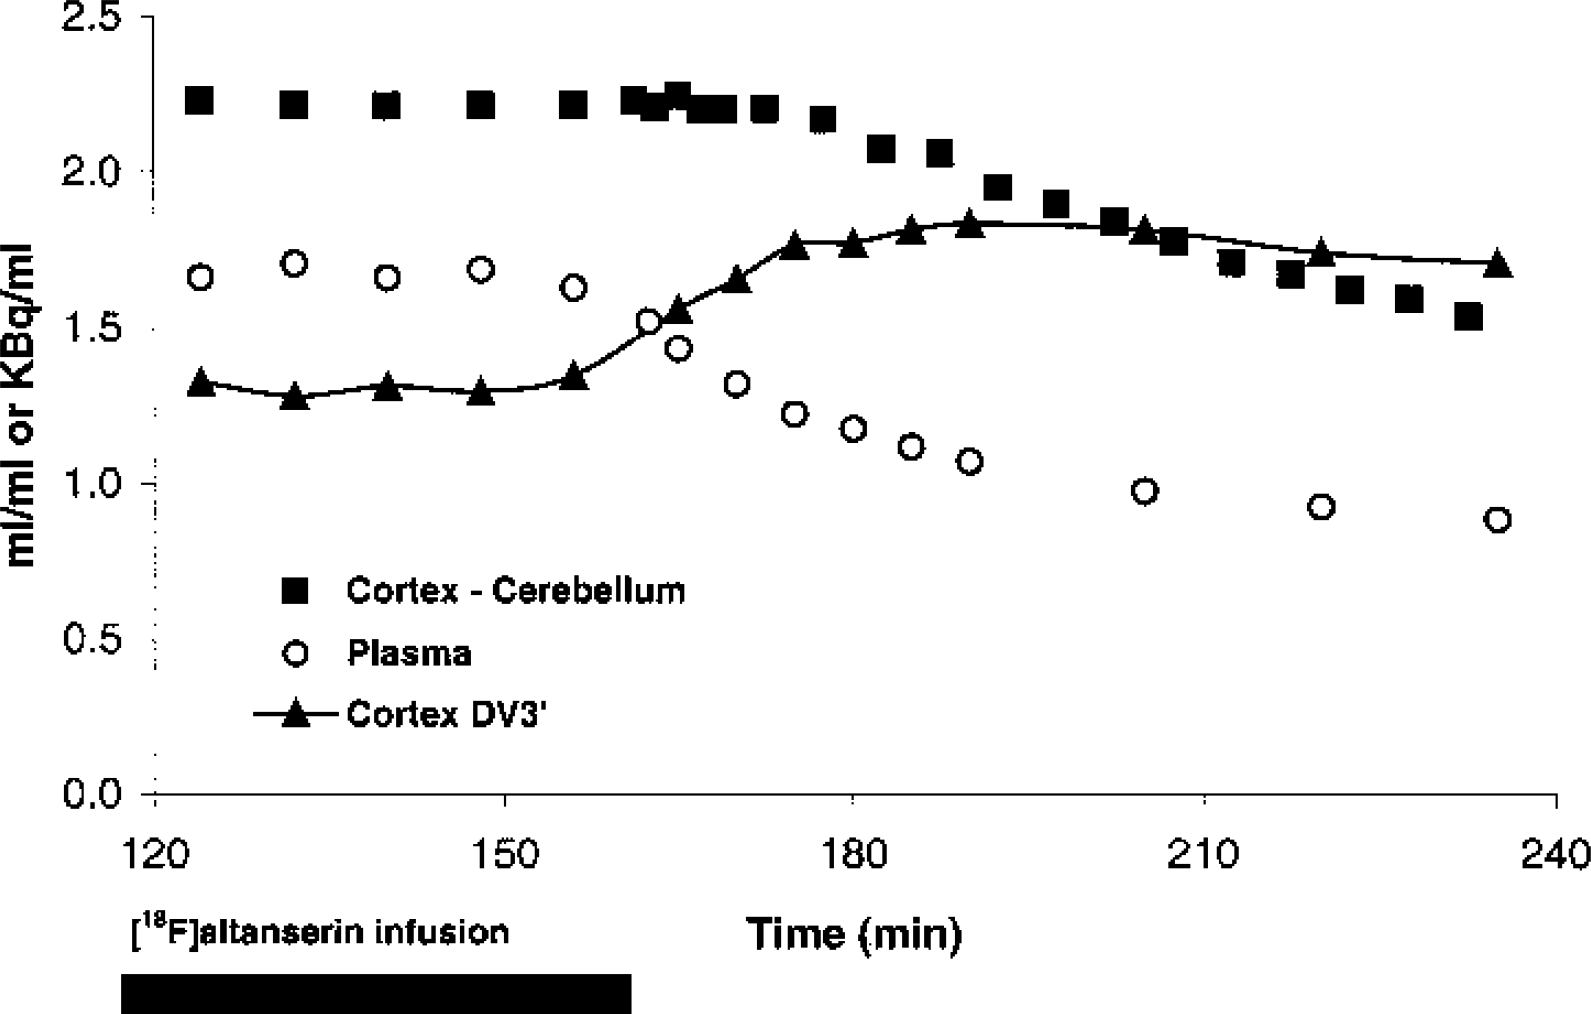
Desaturation. Average time course of plasma, cortical-specific binding, and apparent DV3′ in two subjects after a bolus/infusion ratio of 1.75 h. The [18F]altanserin infusion was stopped at 160 minutes.
Displacement studies
Figure 6A shows the time–activity curves in a subject before and during ketanserin displacement. Immediately after ketanserin administration (bolus/infusion) at 180 minutes, the cortical time–activity curve declines and attains the level of cerebellum after approximately 240 minutes. From 240 to 300 minutes, there is no significant difference between the cortical and cerebellar time–activity curves (P > 0.25, paired t-test). There is no obvious observable change in the cerebellar time–activity curve after ketanserin administration. Before ketanserin administration, the slope of the regression line is 0.42 kBq h−1 with a ±95% confidence interval of 0.36 to 0.48 kBq h−1. After ketanserin displacement, the slope of the regression line from 180 to 236 minutes is 0.35 kBq h−1 with a ±95% confidence interval of 0.27 to 0.43 kBq h−1. These findings were replicated in another subject, although data were not available from 200 to 260 minutes. Figure 6B shows PET images before (120 to 180 minutes) and after (240 to 300 minutes) ketanserin administration. The radioactivity present in the PET image after ketanserin administration represents free and nonspecifically bound [18F]altanserin and radiolabeled metabolites.
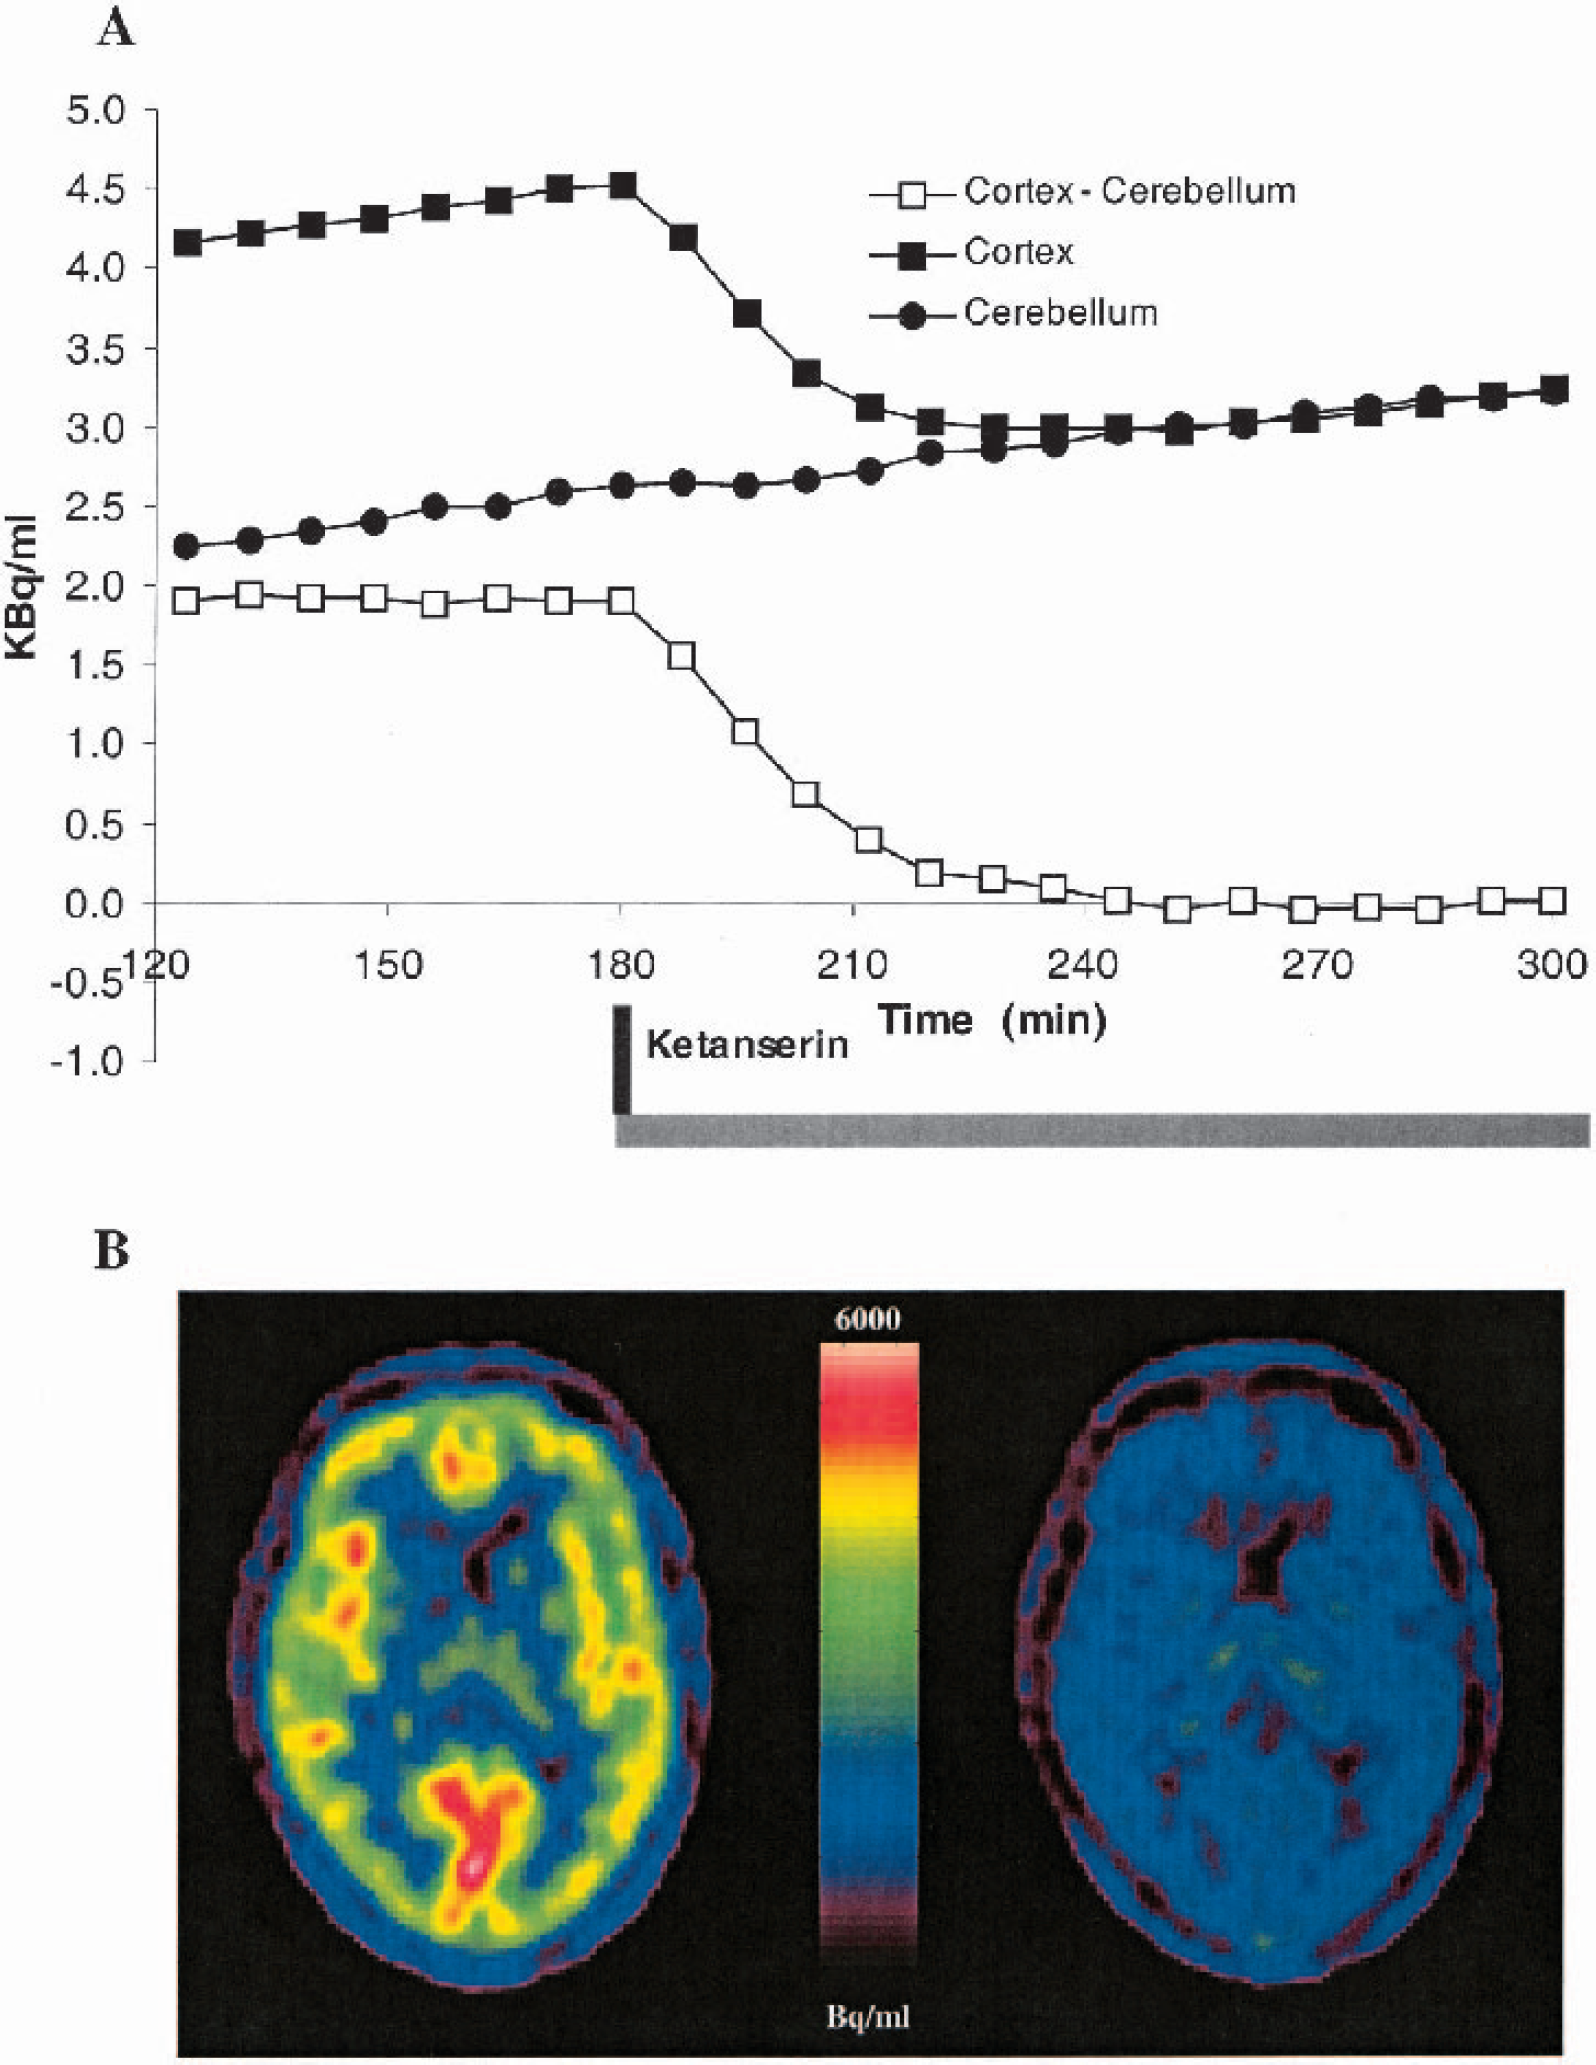
Displacement. (
Clinical studies
To test the feasibility of conducting [18F]altanserin steady-state experiments after 2 h with a bolus/infusion ratio of 1.75 h, a second population of 20 individuals was investigated. From 120 to 160 minutes, the mean regional DV3′ percentage rate of change was −0.3 ± 4.2% h−1. In 4 of the 20 subjects, DV3′ percentage rate of change was outside a ±5% h−1 range (−7.3% h−1, −5.5% h−1, 7.2% h−1, 7.2% h−1). The mean coefficient of variation (standard deviation divided by mean DV3′ × 100%) was 3.4% (range 1.3% to 7.2%). No significant correlation between regional DV3s versus time was found for any of the 20 subjects.
DISCUSSION
The aim of the present study was to describe a method to be used in clinical studies of the 5-HT2A receptor using [18F]altanserin-PET. To be feasible for clinical studies, a method must provide reliable quantification of binding parameters and yet be experimentally simple and the stress to the patient must be minimized as much as possible. We chose the bolus infusion approach and a bolus/infusion ratio of 1.75 h. First, steady-state conditions were attained in all subjects, in all ROIs, and in plasma within 110 minutes lasting to at least 300 minutes after tracer administration. Second, the desaturation data demonstrated that during tracer steady-state, cerebellum is a reliable representation of free and nonspecifically bound [18F]altanserin and BBB-permeable radiolabeled metabolites. Third, the results from the desaturation experiments stress the importance of controlling pump conditions carefully. Finally, a short experimental setup proved to be feasible in clinical studies of neuropsychiatric patients.
Bolus/infusion ratio of 3.2 h
In the subject in whom a bolus/infusion ratio of 3.2 h was used, the time–activity curves attained plateau levels in plasma after approximately 4 h. This is faster than the 5- to 6-h period described in humans (van Dyck et al., 2000a, 2000b) but comparable to a later study in monkeys (Staley et al., 2001). The time to reach steady-state conditions in the blood and the brain after bolus/infusion of tracer depends on individual parameters such as plasma clearance and binding potential (Pinborg et al., 2000). Thus, using a population-based bolus/infusion ratio will introduce individual variation in the time to reach steady state. However, whether steady state is attained within 4 h or 6 h, an experimental setup with a total study time of 5 to 7 h is difficult to implement in most clinical settings because of patient discomfort. Furthermore, the decay of the isotope leads to a decreasing signal-to-noise ratio, which causes problems in both HPLC analysis and PET determinations, especially in receptor-poor ROIs.
Bolus/infusion ratio of 1.75 h
The bolus/infusion ratio of 1.75 h was based upon the average slowest component of the plasma clearance (a3) in five subjects measured from 0 to 120 minutes after a bolus injection of [18F]altanserin. As demonstrated in Fig. 1B, average plasma parent compound and the specific binding in both receptor-poor and receptor-rich ROIs stabilize between 75 and 110 minutes. This finding is reproduced in the normalized time–activity curves shown in Fig. 2. Before 110 minutes, the standard deviations of the normalized time–activity curves are large. Thus, despite the fact that average normalized specific binding is close to the steady-state value at t = 75 minutes, the average value reflects individual deviations from the steady-state value. From 110 minutes, the standard deviations of the normalized cortical time–activity curve are small. This is probably related to the large size of the cortical and cerebellar ROIs and the large density of 5-HT2A receptors in cortex. The standard deviations of the normalized striatal time–activity curve are notably larger. Contrary to the cortex, this is probably related to the smaller size and receptor density of striatum, which makes the data more susceptible to random noise. In addition, the small size of the striatal ROI makes a precise realignment more critical and thereby the ROI definition vulnerable to errors. The mean normalized [18F]altanserin plasma time–activity curve also shows larger variation than the mean normalized cortical time–activity curve. However, the presence of BBB-permeable metabolites of [18F]altanserin necessitates the use of [18F]altanserin as a representation of the input function. Because the counting statistics of the gamma counter are very good, the variance in the measurements of parent compound is primarily related to the variation in the HPLC analysis. Preliminary testing of the HPLC procedure with approaches including different cartridges for solid phase extraction and different HPLC columns was done. Despite our efforts to optimize HPLC analysis, variation in the plasma concentration determination seems to dominate the overall variation in the cortical DV3′ determinations (Fig. 2 and Fig. 4). For the striatal region, the variability in the striatal-specific binding and the plasma parent compound contribute almost equally to the variability in DV3′. Both components are susceptible to a decreasing signal-to-noise ratio with time because of decay of [18F]altanserin, and this causes the significant correlation between the standard deviations of the striatal DV3′ versus time (110 to 360 minutes).
Figure 3 shows that steady-state DV3′ levels are attained in thalamus, striatum, and cortical ROIs after 110 minutes and are maintained until approximately 300 minutes. The mean percent change per hour is small but reflects larger individual variance as shown in Table 1. The largest percent change per hour is seen in receptor poor areas. From 300 to 360 minutes, a tendency towards a decrease in cortical DV3′ is noted. However, it is only at 360 minutes that the cortical DV3′ value is smaller than the mean cortical DV3′—1 SD calculated from 110 to 300 minutes. Thus, to draw firmer conclusion from these time–activity curves regarding deviations from steady state with time, the experimental time should have been longer. However, the changes in the time–activity curves may reflect the fact that the bolus/infusion ratio was based on bolus data from 0 to 120 minutes, where the slowest component of the plasma clearance (a ∞) may not have been fully attained. Thus, the bolus/infusion ratio of 3.2 h may be more optimal for maintaining steady state from 360 minutes to infinity. At the other end of the spectrum, one may consider the pseudoequilibrium approach (Farde et al., 1989), where the steady-state value of ligands after a bolus injection is only attained at the single point in time where the specific binding peaks. Finding the tradeoff between an experimental time suitable for clinical studies, on the one hand, and on the other hand establishing sustained steady state for reliable quantification is difficult for high-affinity ligands (Pinborg et al., 2000). One way to address this problem is to vary the infusion rate during the experiment to match the different components of the bolus time–activity curve. In this setup using a bolus/infusion ratio of 1.75 h, one could consider decreasing the infusion rate slightly after 180 minutes to take into account the slight increase in the normalized [18F]altanserin plasma time–activity curve.
In Table 1 we list the mean DV3′ in thalamus, striatum, and cortical ROIs based on measurements obtained between 110 and 300 minutes. The mean values of DV3′ are in correspondence with previously published values (van Dyck et al., 2000b). DV3′ values vary considerably between subjects; the mean coefficient of variation is on the order of 10% to 40% and is largest in cortical ROIs. Intersubject variation is well known to be caused by age effects (Rosier et al., 1996; Meltzer et al., 1998; Sheline et al., 2002), but a large fraction of the interindividual differences is age independent. It is unknown to which extent the interindividual differences in DV3′ are caused by either genetic or environmental factors.
The [18F]altanserin fraction unbound to plasma proteins (f1) was not taken into account in this study. Thus, we do not report separate values of f1 and Bmax/ Kd, and DV3′ is used as the outcome parameter. f1 is assumed to be constant during steady-state conditions and is not expected to have any effect on the shape of the time–activity curves. In several steady-state studies, f1 of [18F]altanserin and [18F]deuteroaltanserin have been reported to be low (1% to 2%) and difficult to measure, leading to a significantly higher variability of Bmax/ Kd compared to DV3′ (van Dyck et al., 2000a, 2000b; Soares et al., 2001). Although the assumption of negligible intersubject variability in f1 may bias the use of DV3′ as a representation of Bmax/ Kd, violations of this assumption will not affect the shape of the time–activity curves and consequently, the analysis of steady-state conditions.
Desaturation studies
Figure 5 shows the mean time–activity curves of two subjects in whom PET scanning and blood sampling continued for 80 minutes after the constant infusion of [18F]altanserin was discontinued. After initial attainment of steady state, disruption of tracer infusion was immediately followed by a rapid plasma clearance, and after approximately 10 minutes a somewhat slower clearance from the cortical ROI is also observed. After approximately 30 minutes, a new apparent “steady state” is established, leading to an increase in the apparent DV3′ of 35%. This increase in apparent DV3′ is related to the elimination rate constants of the plasma clearance as described by Carson et al. (1993). In addition, when the infusion of [18F]altanserin is discontinued, steady state is no longer present. Thus, cerebellum will not be a correct representation of free and nonspecific bound [18F]altanserin and radiolabeled metabolites because the specific bound compartment will add to the free and nonspecific compartment in ROIs with 5-HT2A receptors.
Displacement studies
The aim of the displacement studies was to validate the use of the cerebellum as a reference region for steady-state [18F]altanserin-PET studies. If the cerebellum is to be used as a reference region, then after complete displacement of [18F]altanserin with cold ketanserin, time–activity curves of ROIs with 5-HT2A receptors must decrease to the cerebellar level and the cerebellar time–activity curve must remain unchanged.
According to Fig. 6A and B, cerebellum behaves as such an ideal reference region. The cortical ROI decreases to the cerebellar level, and from 240 to 300 minutes there is no significant difference between the cortical and cerebellar time–activity curves. This is also true for all other ROIs with 5-HT2A receptors. Finally, during the period from 180 to 236 minutes where a large decrease in the cortical time–activity curve is observed, only a small decrease (just outside the 95% confidence interval) in the slope of the cerebellar time–activity is demonstrated. In contrast to this finding, human receptor autoradiographic studies with [3H]ketanserin have revealed cerebellar gray matter binding at levels between 15% (Schotte et al., 1983; Pazos et al., 1987) and 40% (Eastwood et al., 2001) of that seen in prefrontal cortex. Ketanserin and altanserin are structurally closely related, and their binding properties are comparable (Leysen, 1989). A small population of 5-HT2A receptors, as detectable with autoradiography, may be difficult to detect with PET and pharmacologic displacement. This is both because of the statistical quality of PET data and the spatial resolution of PET images. Using a single experiment, baseline-displacement paradigm, in this study minimized the potential impact of a poor statistical quality of PET data, compared to paired bolus studies, with and without pretreatment with a 5-HT2A-blocking drug, where test–retest variability is expected to have an important impact on the interpretation of data (Watabe et al., 2000). A poor spatial resolution of PET images leads to tissue heterogeneity in ROIs. Thus, in contrast to autoradiography, it is not possible to accurately separate gray and white matter, leading to an apparent smaller density of 5-HT2A receptors in PET ROIs compared to autoradiography ROIs. Tissue heterogeneity may also explain the existence of two kinetically separable cerebellar tissue compartments after bolus injection of the 5-HT2A antagonist [11C]MDL 100,907. Ito et al. (1998) interpreted the need for a two-tissue compartment model in cerebellum as a sign of specific binding in the cerebellum. However, blocking the 5-HT2A receptors with unlabeled MDL 100,907 prior to the PET study did not eliminate the need for a two-tissue compartment model in cerebellum (Watabe et al., 2000). Our data show that for [18F]altanserin, there is no detectable cerebellar binding to 5-HT2A receptors. We therefore conclude that for quantification of steady-state [18F]altanserin-PET studies, cerebellum is a valid representation of free and nonspecifically bound [18F]altanserin and BBB-permeable radiolabeled metabolites.
A shorter experimental setup, aimed at clinical studies
Based on our long bolus/infusion experiments, we recommend the following experimental setup for clinical studies: Two hours after bolus/infusion of [18F]altanserin (1.75 h), 5 frames of 8 minutes each are acquired. During PET scanning, five venous plasma samples are drawn at midframe times. To derive the input to the brain, the plasma samples are counted in a gamma counter for determination of radioactivity and analyzed using reverse-phase HPLC for determination of parent compound and radiolabeled metabolites. DV3′ are calculated for the five time-points. Steady-state conditions are tested by looking at the percent change per hour of the regression line. We consider the steady-state condition to be attained when the percent change per hour is less than 10%. Our data indicate that the percent change per hour in regional DV3′ is mainly due to the statistical quality of the PET and the HPLC data. No significant correlations between regional DV3s versus time were found for any of the 20 subjects. An experimental setup with short infusion time has the advantage of higher count rates compared to an experimental setup with longer infusion schedule and later imaging. This may in part explain the large test–retest variability for cortical DV3′ following more than 5 h of [18F]deuteroaltanserin infusion. Soares et al. (2001) demonstrated a mean cortical test–retest variability of 14.1 ± 7.6%. For occipital cortex, the mean cortical test–retest variability was 20.4 ± 18.0%. In addition, at steady state it is possible to increase the statistical quality of the PET data by adding the frames. This may be important especially for quantification of DV3′ in receptor-poor areas. Likewise, the number of blood samples may be changed, depending on the statistical quality of data and HPLC processing time.
This setup was tested in a second population of 20 individuals included in two clinical studies. We found a mean regional DV3′ percentage rate of change of −0.3 (range 7.3% to 7.2%/h), and no significant correlations between DV3′ versus time were found in any region for any of the 20 subjects. Altogether, positioning of a patient in the PET scanner (10 minutes), the transmission scan (10 minutes), the two-dimensional emission scan (5 minutes), and the three-dimensional emission scan (40 minutes) lasted approximately 1 hour and 15 minutes. Processing of each of the blood samples—starting with centrifugation of the whole blood sample and ending with the HPLC analysis—took approximately 25 minutes. The 112 h from [18F]altanserin injection until positioning in the PET scanner was used for relaxation or clinical interviews. Both patients and investigators found the setup feasible. In addition, the setup allows for examination of more than one patient a day.
In conclusion, we recommend the use of the bolus infusion approach and a bolus infusion ratio of 1.75 h for quantification of [18F]altanserin binding to 5-HT2A receptors. This approach allows for reliable and robust correction for radiolabeled metabolites passing the BBB and measurement of the effect of pharmacologic challenge in a single experiment. Finally, the approach proved to be feasible in a clinical setting.
Footnotes
Acknowledgments
The authors thank Karin Stahr for expert technical assistance and Dr. S. Yndgaard for help with the ketanserin experiments, as well as the staff at the PET Center at Rigshospitalet, Copenhagen. The authors also thank the John and Birthe Meyer Foundation for the donation of the Cyclotron and PET scanner.