
Abstract
We have developed a feedback-controlled bolus plus infusion (FC-B/I) method for monitoring the interaction between positron emission tomography (PET) ligands and their specific target molecules with PET. The usefulness of the FC-B/I method was evaluated by the direct interaction between [11C]raclopride, a dopamine D2 receptor (D2R) ligand, and cold raclopride (10 and 100 μg/kg) in the brains of conscious monkeys. The present results demonstrated that the FC-B/I method could achieve the equilibrium state of [11C]raclopride in the striatum of monkey brain, and also that the cold raclopride-induced reduction of [11C]raclopride binding to D2R was observed in a dose-dependent manner. Good correlations of distribution volume ratio of the striatum to cerebellum between the conventional bolus plus infusion (B/I) method and the FC-B/I method as well as between the conventional bolus injection method and the FC-B/I method were observed. These results indicated that the system could be a useful tool for the evaluation of interaction between drug candidates and their target molecules like enzymes, receptors, and transporters by using of their specific PET ligands.
INTRODUCTION
Positron emission tomography (PET) is a useful tool for noninvasive assessment of pharmacological effects in the central nervous system. Pharmacological effects are usually evaluated to determine the changes in PET data between before and after drug treatment with bolus injection of PET ligand. But it would be stressful for subjects to stay so long time in PET scanner. In addition, although we analyze PET data by a kinetic modeling with the time-activity curve of metabolite-corrected arterial blood radioactivity as an input function, 1 the arterial blood sampling would give more stress to subjects. Furthermore, the metabolite analysis of arterial blood would sometimes increase variability of analyzed data because of its experimental errors.
To solve these problems, the alternative steady-state method with bolus plus constant infusion (B/I) of [ 11 C]raclopride was first proposed that the pharmacological effects could be observed in a single PET scan.2,3 In this method, since it was indispensable to apply PET ligands with reversible binding property, [ 11 C]raclopride with reversible binding to dopamine D2 receptors (D2R) was a proper PET ligand.1,4 In addition, [ 11 C]raclopride binding was known to be sensitive to the changes in the endogenous dopamine concentration in synaptic cleft,5–7 the effects of amphetamine-induced endogenous dopamine on [11C]raclopride binding to D2R were evaluated with B/I method.2,3,8–10 In B/I method, a distribution volume (DV) that was defined as a ratio of ligand concentration between in arterial plasma and in a tissue at an equilibrium state was directly acquired. To achieve a good steady state of PET ligand in the brain, the B/I method requires preliminary extra bolus injection PET measurement to estimate the infusion protocol from kinetic property of each PET ligand.2,11 To make B/I scan method more practical and reliable than the conventional B/I method, we have developed a feedback-controlled bolus plus infusion (FC-B/I) method, in which realtime reconstructed PET data are used for feedback control of infusion rate of PET ligand to achieve equilibrium state in target region of interest (ROI).12,13 In the present study, we evaluated the interaction between [ 11 C]raclopride and cold raclopride with the FC-B/I method, and also compared with two conventional approaches of bolus injection and B/I methods.
MATERIALS AND METHODS
Overview of Feedback-Controlled Bolus Plus Infusion Method
The block diagram of FC-B/I method was shown in Figure 1A. Feedback-controlled bolus plus infusion system consisted of an animal PET scanner (Hamamatsu SHR-7700, Hamamatsu Photonics, Hamamatsu, Japan), a realtime reconstruction computer, a feedback control computer and a syringe pump (CFV-3200, Nihon Koden, Tokyo, Japan) connected to a venous vessel of a monkey leg.
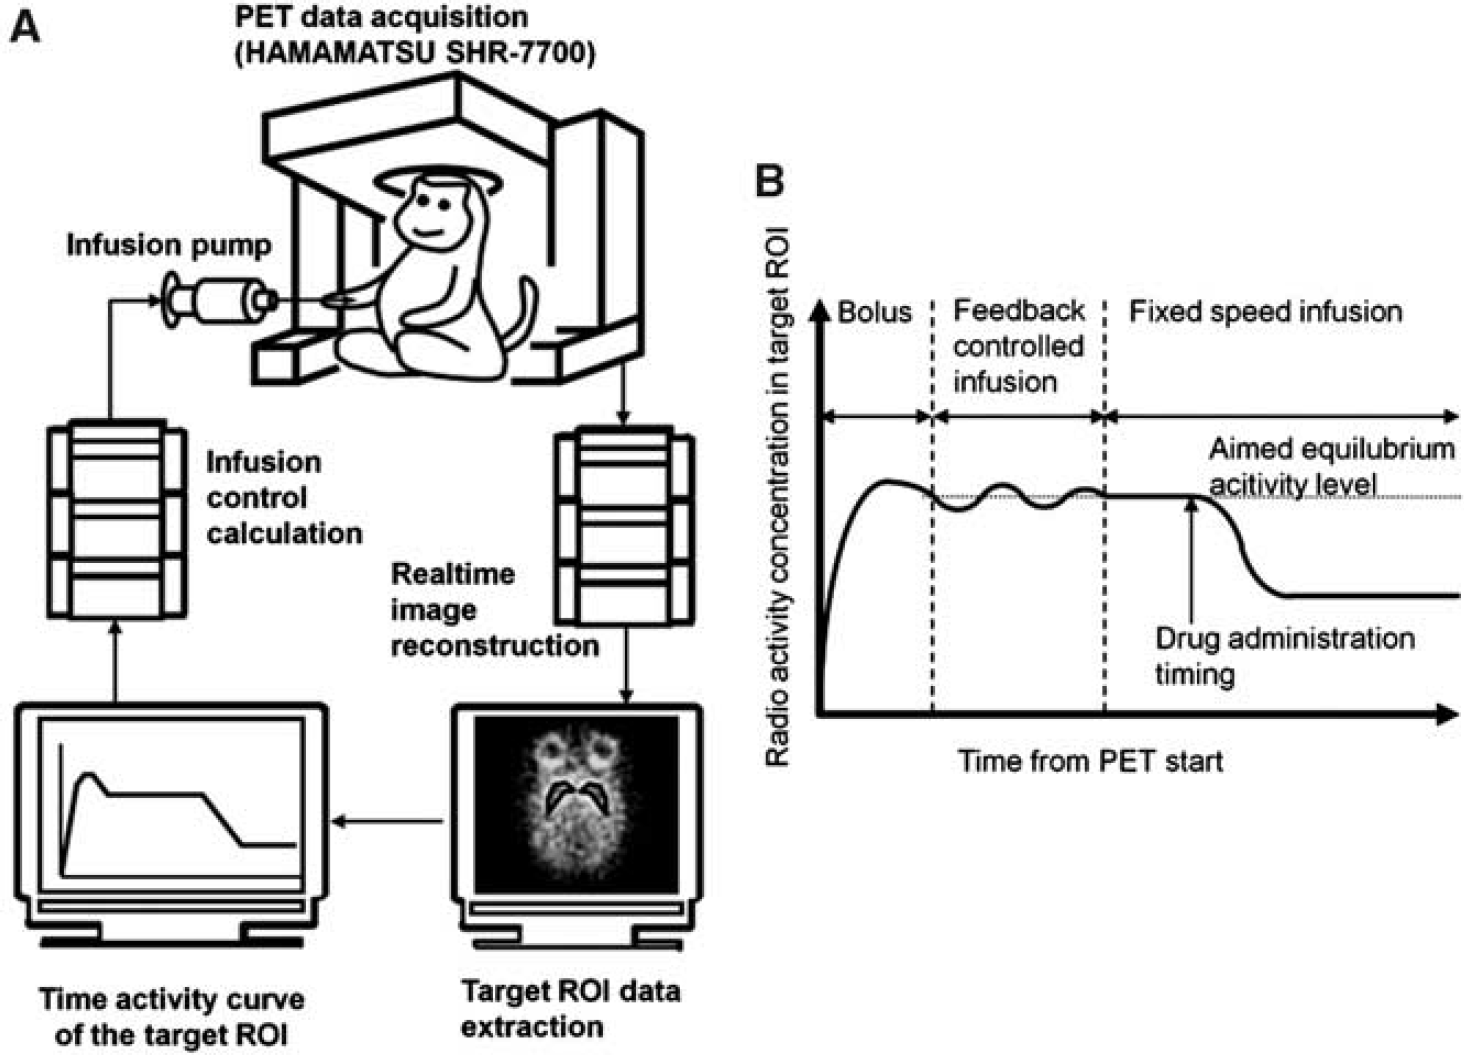
The semantic diagram of feedback-controlled bolus plus infusion (FC-B/I) method. (
Before a PET scan, the position of striatal ROI was determined from MRI (magnetic resonance imaging) image of each monkey, which was previously coregistered to individual PET image coordinate. The ROI was used to derive a time history of radioactivity concentrations from the PET real-time reconstructed images. And 12 mL of [ 11 C]raclopride solution in a syringe was set on the infusion pump.
A multiframe PET scan was started simultaneously with the start of bolus injection of [ 11 C]raclopride. One-fifth of the total volume was injected within the first 30 seconds in a bolus to make the radioactivity concentration in the target ROI near equilibrium state. The real-time image reconstruction computer made a real-time image to calculate time-activity curves (TAC) in the ROI. The real-time images were reconstructed by filtered back projection with Hanning filter of 8.0 mm FWHM every 30 seconds.
When the TAC reached the peak, an aimed equilibrium activity level for feedback control was determined as an averaged value of the TAC in the last 3 minutes around the peak (Figure 1B, equilibrium level estimation mode). Once the aimed equilibrium activity level was attained, the system operation mode was switched to feedback-controlled infusion mode shown in Figure 1B. In this mode, infusion speed was controlled to keep the current TAC value at the aimed activity level using a proportional-integral-derivative (PID) control theory 14 (Supplementary Text; Supplementary Figure S1).
When a percent difference of the TAC against the equilibrium activity level was within ± 1% in the latest 10 minutes, the feedback-controlled infusion operation was switched to a fixed speed infusion mode. The infusion speed was set to the value of total infused volume divided by a total time of feedback control duration.
Chemicals
[ 11 C]raclopride was synthesized by the standard method at Hamamatsu Photonics PET Center. 15 In this study, radioactive purity of [ 11 C]raclopride was 498% and specific activity was 64.9 ± 18.3 GBq/μmol (mean ± s.d.).
Animals
Three male rhesus monkeys (Macaca mulatta) weighting from 3.9 to 6.2 kg, 5 to 8 years old were used in this study. They were maintained and handled in accordance with the recommendations of the US National Institutes of Health and the guidelines of the Central Research Laboratory, Hamamatsu Photonics.
Magnetic resonance imaging of monkeys were taken at National Institute for Physiological Sciences with a 3.0-T MR imager (Allegra; Siemens, Erlangen, Germany) under anesthesia with pentobarbital. The stereotactic coordinates of PET and MRI were adjusted based on the orbitomeatal line with a specially designed head holder.
After the overnight fast, the monkey was sat to the monkey chair and its head was fixed with stereotactic coordinates paralleled to the orbitomeatal line. A cannula was implanted into the saphena of a monkey leg for administration of [ 11 C]raclopride and another cannula was put into the posterior tibial artery of the other leg to get arterial blood samples.
Positron Emission Tomography Measurement Protocol
Beside the FC-B/I method, other two types of administration protocols were conducted. One was a bolus injection method, which was a standard procedure and the labeled ligand was bolusly injected, and another was a conventional bolus plus infusion (B/I) method, in which a partial volume of labeled ligand was bolusly injected and the remainder was infused at a constant rate.
A high-resolution animal PET scanner (SHR-7700, Hamamatsu Photonics) 16 was employed, and all data were acquired in 2D mode. To correct the sensitivity of the scanner detectors, a blank scan of 120 minutes duration was performed using 68Ge–68Ga rotation rod source before emission study within a day. Transmission scan for 30 minutes duration was conducted. Positron emission tomography data were reconstructed by filtered back projection method with Hanning filter of 4.5 mm FWHM to produce a 256 × 256 × 31 voxel image, and each voxel size was 1.2 × 1.2 × 3.6 mm3.
Bolus Injection Method
Emission data of total 91 minutes duration were dynamically collected. Positron emission tomography scan with arterial blood sampling was simultaneously started with the bolus injection of [ 11 C]raclopride during 30 seconds with the total volume of 3 mL.
The baseline and loading scans were performed in a day separated over 2.5 hours, and the sets of PET scans of the same animal were separated >1 month. For loading scans, cold raclopride at doses of 10 and 100 μg/kg was intravenously administered via the saphenous vein 20 minutes before the emission start.
B/I Method
Emission data of total 90 minutes duration were collected by multiframe timing as 1 minute × 90 frames. Positron emission tomography scan with arterial blood sampling was simultaneously started with bolus injection followed by continuous infusion using a infusion pump (CFV-3200, Nihon Koden) with 12 mL in a syringe (SS-10ESZ, Terumo, Tokyo, Japan). The volume of the bolus injection was set to 2.6 mL, and the infusion rate was subjected to Kbol 11 , which was calculated by PMOD (PMOD Technologies, Zurich, Switzerland) using the previous measured data bolus injection scan to achieve an equilibrium in the striatum within 20 minutes. The infusion speed of each animal was set at 0.088, 0.084, and 0.074 mL/min (Kbol at 28.3, 29.7, and 33.7 minutes), respectively. Cold raclopride was then administered into the saphenous vein 45 minutes after the scan start.
The BPND was obtained as a ratio of tissue radioactivity concentration between the target (striatum) and reference (cerebellum) regions at equilibrium.
Feedback-Controlled Bolus Plus Infusion Method
To check an influence on bolus volume changes to FC-B/I control, three different bolus volumes were examined. The bolus volume of 2.6 mL was used in 10 μg/kg cold raclopride loading scans and the bolus volumes of 3.4, 6.5, and 2.6 mL were used at 100 μg/kg cold raclopride loading scans. Dynamic PET emission scan with FC-B/I method and arterial blood sampling were performed by the same manner as conducted in B/I method. The feedback-controlled infusion was started after 15 minutes and regulated its speed every 1 minute. Cold raclopride was administered into the saphenous vein 45 minutes after scan start.
Blood Sampling and Metabolite Analysis
Bolus Injection Method. Arterial blood samples of about 1 mL during the PET scan were collected for 90 minutes using a auto blood sampling system (DR-2, Eicom, Kyoto, Japan). Aliquots of 50 μL whole blood and 100 μL plasma centrifuged at 9,510 g for 2 minutes under room temperature (FB-8000, Kurabo, Osaka, Japan) were weighted (HR-120, A&D, Tokyo, Japan) and the radioactivity counts were measured by γ counter (1480 WIZARD, Perkin-Elmer, Waltham, MA, USA). For metabolite analysis, the other aliquots of 100 μL plasma were mixed with 200 μL ethanol and the mixture was centrifuged at 9,510 g for 5 minutes at room temperature. The supernatants were developed on thin layer chromatography plates (AL SIL G/UV, Whatman, Kent, England) with a mobile phase (chloroform:methanol:triethylamine = 36:4:1). At each sampling time point for the metabolite analysis, the ratios of radioactivity in the unmetabolized fraction to that in total plasma (metabolite plus unmetabolite) were determined using a phosphoimaging plate (FLA-7000, Fuji Film, Tokyo, Japan).
Bolus Plus Infusion and Feedback-Controlled Bolus Plus Infusion Methods. Arterial blood samples of about 1 mL during the PET scan were collected for 90 minutes using a autoblood sampling system (DR-2, Eicom, Kyoto, Japan). Thin layer chromatography metabolite analysis was also performed as described above.
Data Analysis. In the bolus injection method, multilinear analysis method17,18 (MA1), which was modified method of Logan graphical analysis 19 (LGA) to reduce the noise-induced bias, was used to calculate total distribution volume (VT) in each region and binding potential (BPND) of striatum (STR) to cerebellum (CER) was obtained.
In the B/I and FC-B/I methods, the ratio (R = CSTR/CCER) that corresponded to DVR 20 was calculated 2 before and after the loading of cold raclopride, where CSTR and CCER were the averaged radioactivity concentrations in STR and CER at equilibrium, respectively. These DVR values were then translated to BPND by the calculation of DVR – 1. The first equilibrium state level before drug administration (Rpre) was obtained by an average between 30 and 40 minutes of TAC data and the second equilibrium state (Rpost) were an averaged value between 70 and 80 minutes of TAC data, respectively. VT was also calculated by CSTR/Cp, where Cp was an averaged radioactivity concentration of metabolite-corrected plasma during the first or second equilibrium.
RESULTS
Time-activity curve data in the striatum and cerebellum acquired by FC-B/I and B/I methods in same monkeys and their corresponded PET images were shown in Figure 2. Time-activity curves in the striatum reached the first equilibrium level during 25 to 33 minutes (28 ± 3 minutes, mean ± s.d.) in FC-B/I studies and during 24 to 31 minutes (27 ± 3 minutes) in B/I studies. In FC-B/I scans, the attained infusion speed in equilibrium was 0.052, 0.044, and 0.046 mL/min in 10 μg/kg loading scans and 0.049, 0.107, and 0.042 mL/min in 100 μg/kg loading scans. In FC-B/I method, PID control mode was preliminary set and started at 15 minutes and the fixed speed infusion mode was started at 38 ± 3 minutes (mean ± s.d.).
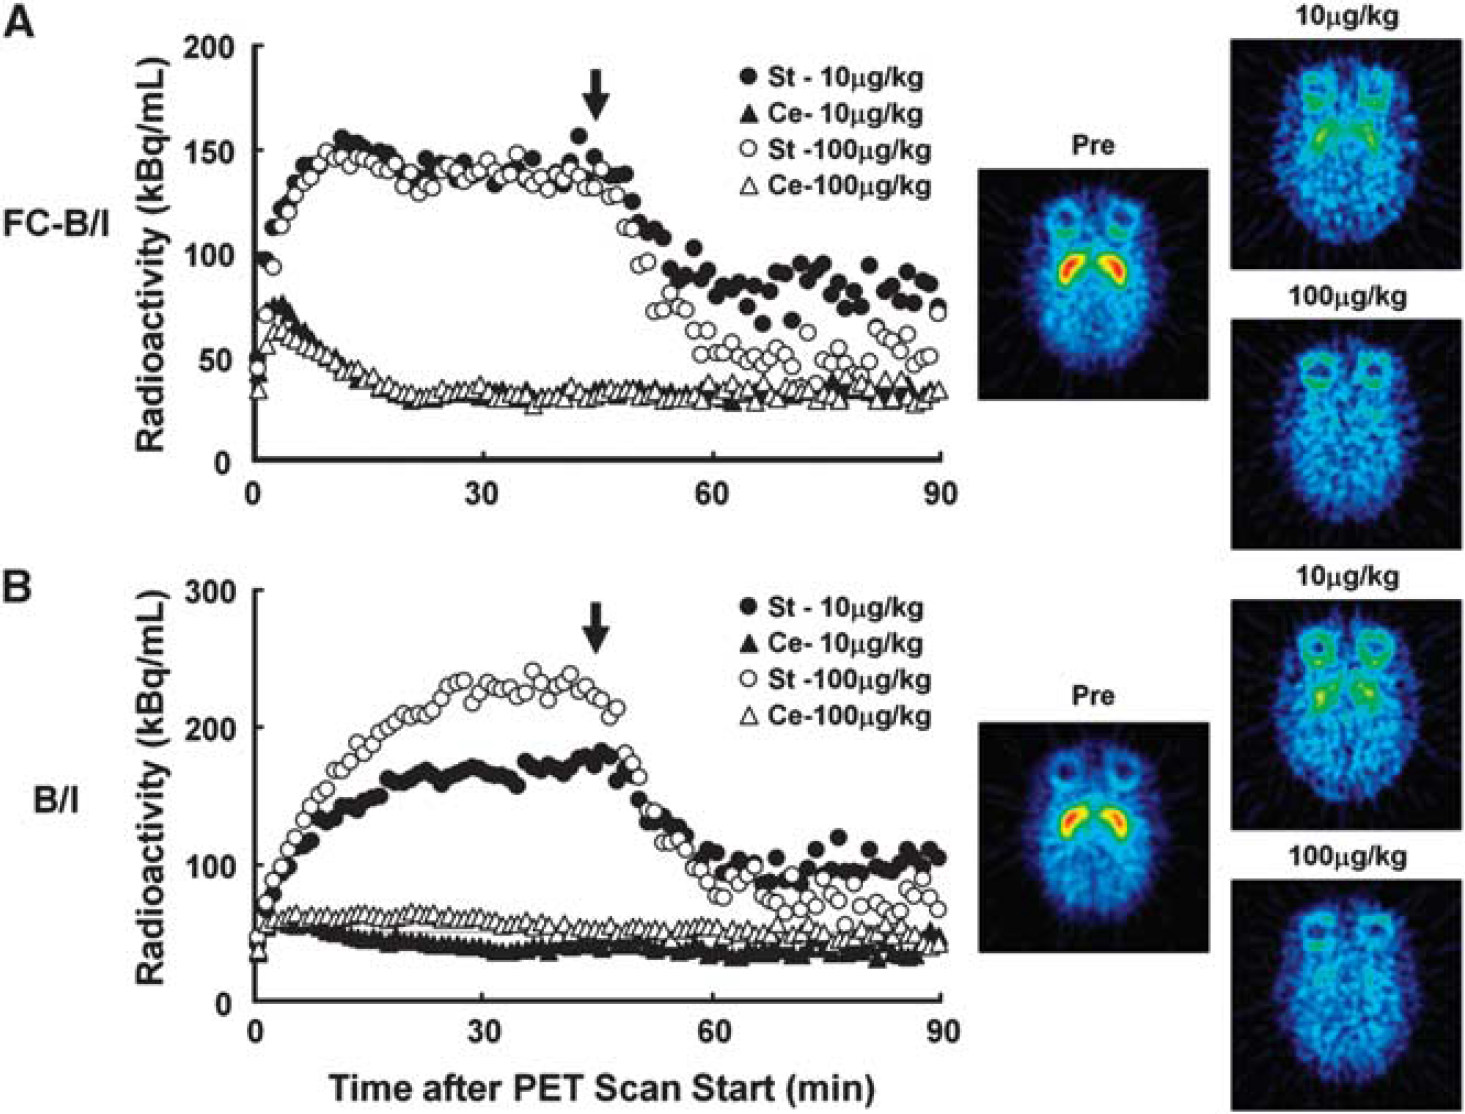
Time-activity curves (TAC) and images of [
11
C]raclopride under feedback-controlled bolus plus infusion (FC-B/I) and B/I methods. (
After the loading at the doses of 10 and 100 μg/kg/intravenously at 45 minutes, TACs were descended to the second equilibrium level around 70 minutes. The first equilibrium level of TACs in the cerebellum was kept same level even after cold raclopride administration. The second equilibrium levels in the striatum showed reduction in a dose-dependent manner. The deference of TAC shape between FC-B/I and B/I methods was observed in the early duration of scans.
As shown in Figure 2A, the TAC in a target tissue maintained constant level between 20 to 40 minutes after administration. An overshoot was observed after the first bolus administration around 10 minutes, because a small bolus injection was conducted to realize rapid equilibrium realization in FC-B/I. The results of arterial blood sampling in same animals were shown in Figure 3. Radioactivity concentration of metabolite-corrected plasma reached first equilibrium until about 30 minutes in both FC-B/I and B/I studies (Figures 3A and 3C). At 45 minutes, plasma radioactivities were rapidly increased because of a loading of cold raclopride; however, those were immediately returned to the similar plateau level observed with the preadministration. Unmetabolite ratios in Figures 3B and 3D were slightly decreased despite of the equilibrium of plasma activity concentration by the loading.
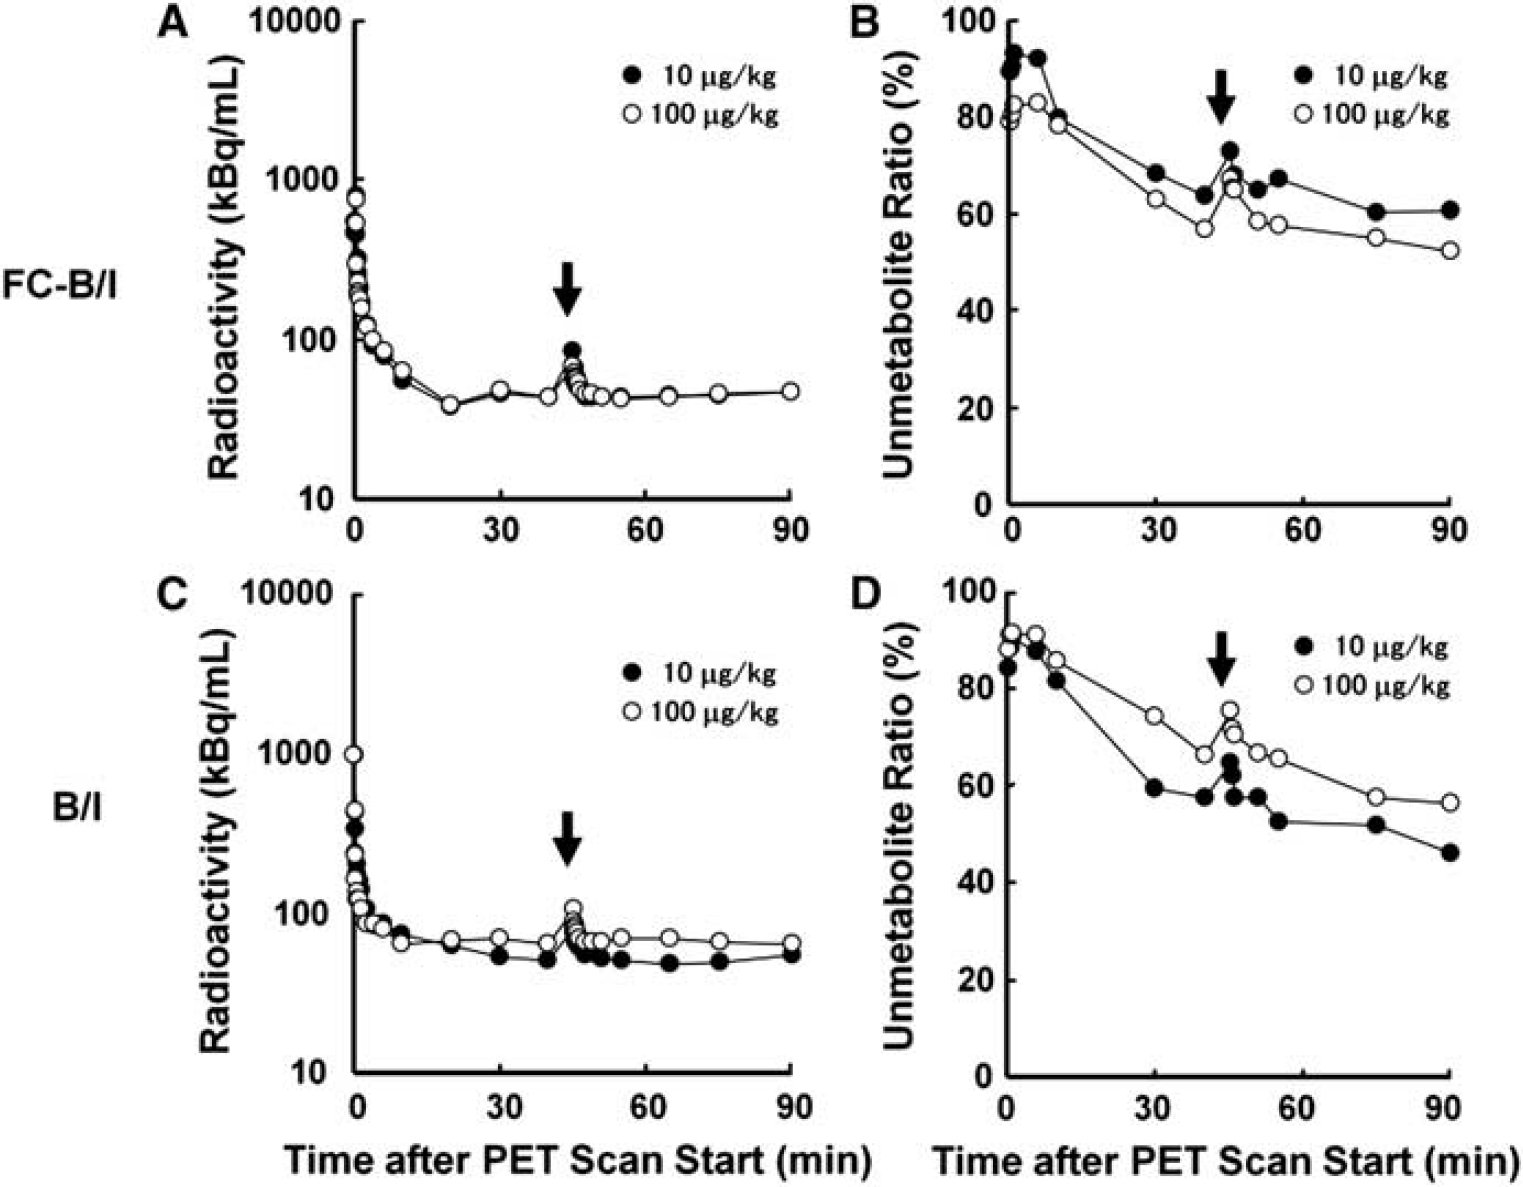
Unmetabolized plasma radioactivity and unmetabolite rate of [
11
C]raclopride in feedback-controlled bolus plus infusion (FC-B/I) and B/I methods. Unmetabolized plasma radioactivity (
The BPND values of the ratio of the striatum to cerebellum in FC-B/I, B/I, and those calculated by MA1 in bolus injection methods were shown in Figure 4. Regression lines were y = 1.36 x – 0.57, R 2 = 0.99 between bolus injection and FC-B/I methods, y = 1.26x – 0.41, R 2 = 0.98 between bolus injection and B/I methods, and y = 1.06x −0.08, R 2 = 0.98 between B/I and FC-B/I methods, respectively. The BPND of FC-B/I method were almost same as those of B/I; however, the BPND of FC-B/I and B/I methods showed higher than those of bolus injection method.
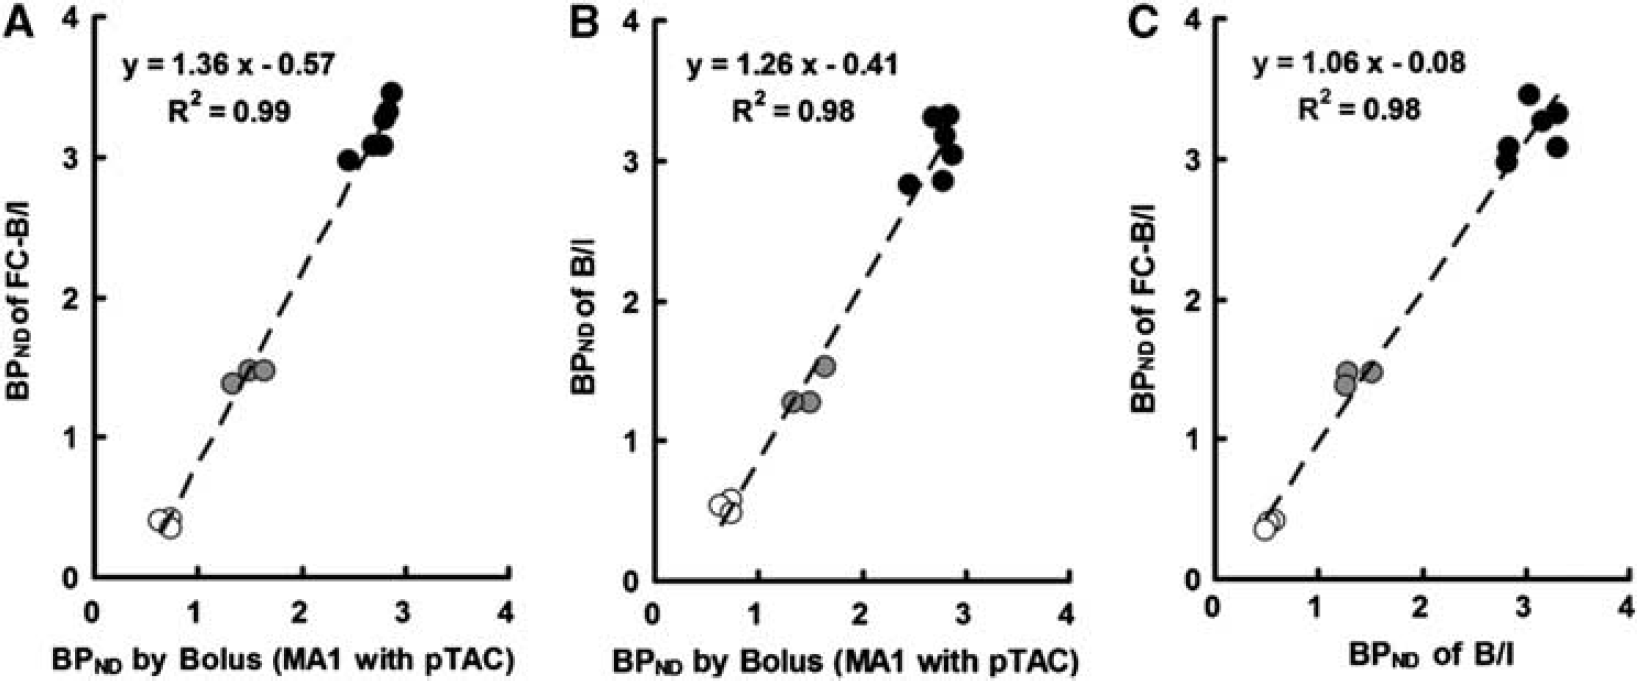
Correlation of binding potential (BPND) of the striatum to cerebellum obtained by bolus injection, B/I and feedback-controlled bolus plus infusion (FC-B/I) methods. (
VT values of the ratio of the striatum to plasma radioactivity in FC-B/I, B/I, and those calculated by MA1 in bolus injection methods were shown in Figure 5. Regression lines of VT were y = 1.16x – 0.04, R 2 = 0.64 between bolus injection and FC-B/I methods, y = 1.23x – 0.44, R 2 = 0.85 between bolus injection and B/I methods, and y = 0.97x + 0.32, R 2 = 0.80 between B/I and FC-B/I methods, respectively. VT of FC-B/I method was good correlation to B/I; however, VT values of FC-B/I and B/I methods showed slightly higher than those of bolus injection method.
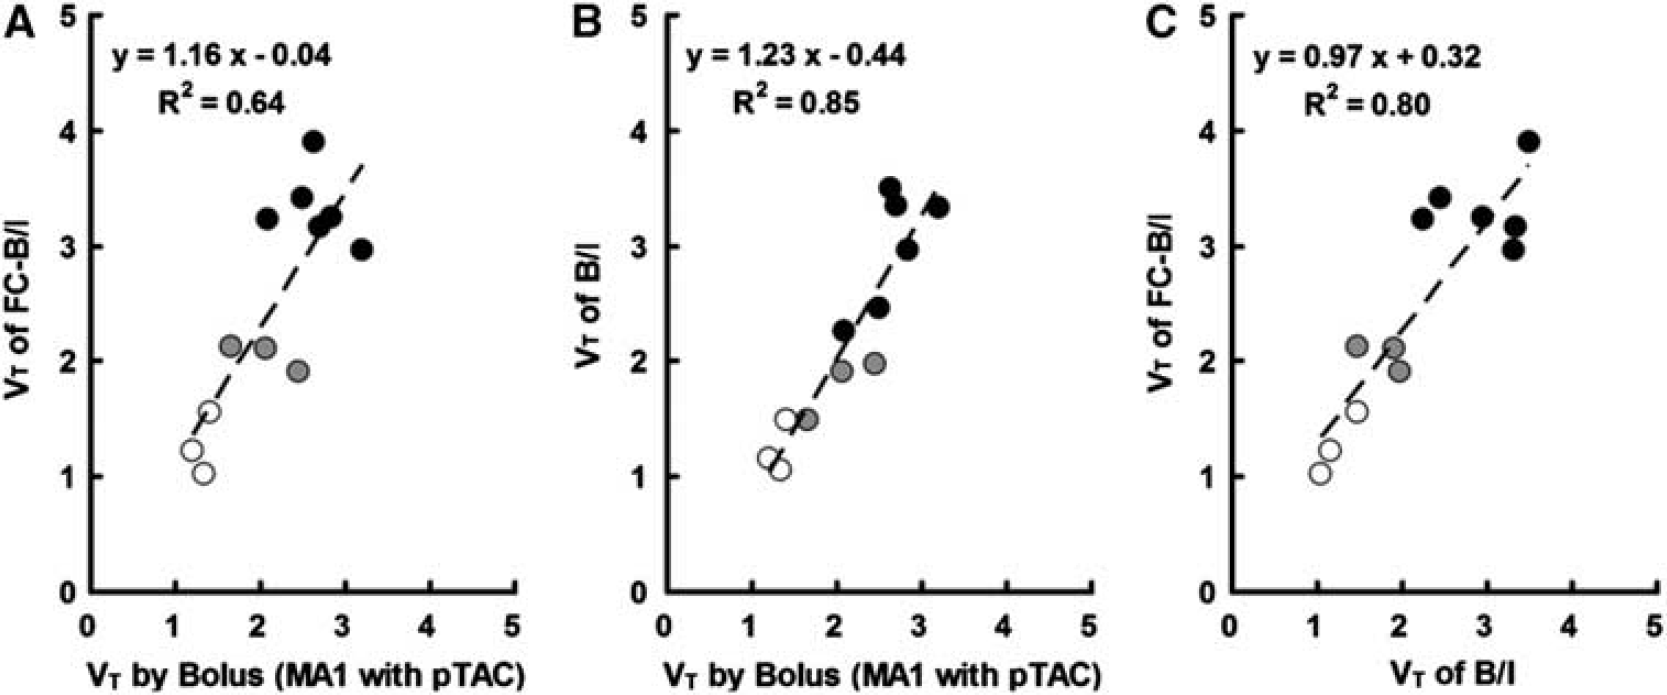
Correlation of VT of the striatum and cerebellum obtained by bolus injection, B/I and feedback-controlled bolus plus infusion (FC-B/I) methods. (
DISCUSSION
Data Agreement with Conventional Methods
Distribution volume was utilized in PET neuroreceptor quantification. Distribution volume was defined as a ratio of radioactivity concentration between in arterial plasma and in a target tissue at equilibrium. 20 B/I method realized the equilibrium states exactly, and measured the DV directly. Thus, B/I method could monitor a change of the DV caused by intervention such as a loading of psychotropic agents. The original B/I method aimed at an equilibrium state using a combination of a bolus injection and a continuous infusion without control. It was not, however, guaranteed to achieve an equilibrium state. Feedback-controlled bolus plus infusion was actively controlled the injection speed based on an instantaneous activity concentration in a tissue in real-time fashion to realize rapidly and stably. Despite of the variation of the initial bolus volume (2.6 to 6.5 mL) in FC/B/I, the equilibrium was well obtained, so that the PID algorithm and its parameters were suitable for the experiments. I have confirmed that same PID parameters obtained from [ 11 C]raclopride can be used for other PET ligands such as [ 18 F]β-CFT-FE, a novel dopamine transporter PET ligand.13,21
As a result of the correlation analyses, the ratio of radioactivity concentration in striatum to cerebellum obtained by the FC-B/I method agreed with that of B/I method (Figures 4C and 5C). These results indicated that the control of the infusion speed worked well. We also evaluated DVR and VT obtained by FC-B/I and B/I method, and these were apparently higher than those obtained by bolus injection method (Figures 4A, Figures 4B and 5A, 5B). We assumed that the differences between the equilibrium methods and the bolus injection method were caused by the underestimation in a graphical analysis, such as LGA, of bolus injection method due to the noise of TAC data. 22 Although we adopted VT of noise-robust analysis of MA1, 17 we compared MA1 to LGA to realize the effect of the noise of TAC. Regression line of VT suggested that noise-induced underestimation in both LGA and MA1 was not observed clearly (data not shown). As an overestimation of VT in B/I compared with that in the LGA or four-parameter model were suggested, 2 our result of the striatum VT in both FC-B/I and B/I methods were reasonable.
Kbol comparison with B/I method
Intrinsically, FC-B/I did not require Kbol because the injection rate was controlled so that the equilibrium was achieved. However, the bolus injection was conducted at the beginning of measurements due to realize rapid equilibrium. The resultant Kbol in FC-B/I method ranged from 49.6 to 69.5 minutes (60 ± 7.0 minutes, mean ± s.d.), which were similar to the Kbol values reported previously. 2 It should be noted that these were almost twice of the Kbol of the B/I method (Kbol of 28.3 to 33.7 minutes) calculated by PMOD with our own TAC data from PET and input function from metabolite-corrected plasma data after bolus injection. These differences appeared in the shapes of TAC shown in Figure 2. The shape of B/I method showed no overshoot before the first equilibrium state, while FC-B/I method showed an overshoot induced by the bolus injection. Although the reasons why such discrepancy was observed remain unclear, we experienced similar result with [ 18 F]β-CFT-FE, thus the Kbol calculated by PMOD software was almost half of that determined with the results from the FC-B/I method (data not shown). It might need reconsideration of parameter setting for simulation of Kbol estimation with PMOD. To achieve the faster equilibrium level, the large Kbol was needed and the equilibrium level should be achieved around peak of the overshoot of TAC owing to the controlled injection in FC-B/I.
Selection of Target Region of Interest
Feedback-controlled bolus plus infusion used an averaged TAC derived from a defined ROI onto a target tissue, the striatum with high-specific binding sites of D2R for [ 11 C]raclopride. However, if the region with lower-specific binding sites was selected as a target ROI, the radioactivity level in the ROI might not be enough stable to control the feedback calculation. Therefore, we choose the striatum with high-specific binding to D2R. Although the high-specific binding sites were selected as a target ROI, there was a controversial point that feedback control of the infusion speed could not continue after the loading because of the change in the radioactivity concentration by the drug. To solve the problem, the infusion rate of labeled compound was fixed to the averaged rate obtained in the period before drug administration to keep constant concentration of the labeled compound in the blood. As shown in Figure 2A, TAC in the striatum was reached peak level within about 15 minutes from the start of PET scan and maintained equilibrium state until the loading of cold raclopride, and TAC in the cerebellum with less D2R kept first equilibrium state until the end of scan. Radioactivity in plasma input in Figure 3 kept an equilibrium level from 30 to 40 and from 60 to 80 minutes, respectively, except the timing just after the loading. These demonstrated that ROI could be set even in the high-specific binding region such as the striatum in our FC-B/I method for the assessment of drug effects with PET.
Suitability of Our Technique
I considered that the PET ligands suitable for the FC-B/I method have rapid clearance rate from the brain and blood. Since the FC-B/I system regulates the infusion rate of syringe pump with feedback control using PET data obtained in real-time from PET system, the PET system combined should allow FC-B/I system to receive PET data in real-time during the scan.
CONCLUSION
The present study demonstrated that the FC-B/I method that used the B/I protocol with fully controlled infusion speed was applicable to measure DV for the quantitative PET measurement. This method achieved the equilibrium state more reliable than the conventional B/I method, and could assess the drug-induced changes in the PET ligand binding to the specific target molecules in the living brain. It should be expected that the system becomes the efficient tools for the evaluation of interaction between drug candidates and their target molecules like enzymes, receptors, and transporters with their specific PET ligands.
DISCLOSURE/CONFLICT OF INTEREST
The authors declare no conflict of interest.
Footnotes
References
Supplementary Material
Please find the following supplemental material available below.
For Open Access articles published under a Creative Commons License, all supplemental material carries the same license as the article it is associated with.
For non-Open Access articles published, all supplemental material carries a non-exclusive license, and permission requests for re-use of supplemental material or any part of supplemental material shall be sent directly to the copyright owner as specified in the copyright notice associated with the article.