
Abstract
The authors tested the hypothesis that the oxygen content of brain tissue is negligible by injecting an intracarotid bolus of 15O-labeled tracer into rats. Under the hypothesis, the clearance rates of 15O radioactivity from the brain after injections of both 15O-labeled water (H215O) and 15O-labeled oxyhemoglobin (HbO15O) should be identical. However, the logarithmic slope of the 15O radioactivity curve after HbO15O injection (0.494 ± 0.071 min-1) was steeper than that after H215O injection (0.406 ± 0.038 min−1) (P<0.001, n = 13), where the time range used in the comparison was between 60 and 120 seconds after the injection. A possible interpretation of this result is that nonmetabolized O15O may dwell in the brain tissue for a finite period of time before it is eventually metabolized or returned to the blood stream unaltered. These findings contradict assumptions made by models currently used to measure cerebral oxygen metabolism.
All methods used to measure the regional cerebral metabolic rate of oxygen using 15O radioactivity assume that oxygen supplied from the capillaries is immediately utilized and converted into water, implying that there is no oxygen reservoir in brain tissue. This idea is supported by many reports showing that tissue oxygen tension is significantly lower than that for venous blood (Erdmann, 1973; Hempel, 1977). Chance's (1965) finding that dissolved oxygen does not diffuse freely across the blood–brain barrier also supports this notion. On the other hand, several recent reports suggest that interstitial oxygen does exist in the brain. For example, the interstitial partial pressure of oxygen during normoxia was reported to be 30 mm Hg using a magnetic resonance imaging spectroscopic technique (Duong et al., 2001), and 32 mm Hg using oxygen microelectrodes (Ances et al., 2001). The significant presence of oxygen in brain tissue was also suggested by a recent quantitative PET CBF activation study using combined visual activation and hypoxia (Mintun et al., 2001).
Motivated by these conflicting reports, we have designed an experiment to directly test the hypothesis that oxygen content in the brain is negligible. The method observes the washout from brain tissue after the injection of 15O radioactivity. Assuming that the hypothesis is valid, it can be shown that the clearance rate of 15O radioactivity after an injection of HbO15O should be identical with that observed after an injection of H215O. Therefore, the kinetics of 15O-labeled tracers after intracarotid bolus injection of HbO15O and H215O were measured in rat using a homemade β detector (Yamamoto et al., 1997), and nonextracted intravascular 15O radioactivity was excluded by comparing the clearance curves after the passage of this intravascular component. The results showed that the clearance of HbO15O was faster than that of H215O.
THEORY
H215O kinetics
Assuming that H215O is a highly diffusible tracer under physiologic conditions, the relationship between the arterial input function Ca(t) and the brain tissue response function Cb(t) during washout is given by the following equation:

where f is the cerebral blood flow, Ew is the extraction fraction of water, β is a geometrical scale factor, pw is the blood–brain partition coefficient of water (assumed to be 0.95; Herscovitch and Raichle, 1985), and the asterisk denotes a convolution integral. When an intracarotid bolus injection is applied, Ca(t) can be approximated as a unit impulse and Eq.1 becomes a monoexponential function with a clearance rate of Ewf/pw:

where BW is the concentration of radioactivity contained in the bolus injection. Thus, the rate constant Ewf/pw can be uniquely determined from the logarithmic slope of the curve measured after intracarotid bolus injection of H215O.
HbO15O kinetics
There are three components to consider when analyzing the tracer kinetics of 15O radioactivity after HbO15O bolus injection: the concentrations of nonmetabolized O15O [Cn(t)] and metabolized H215O [Cm(t)] in the tissue and hemoglobin-bound O15O confined in the intravascular space [Cv(t)] (Mintun et al., 1984). Hence,

However, the hypothesis that the brain oxygen content is negligible requires that Cn(t) is zero. Moreover, if it is also assumed that the fraction of activity that recirculates is small, then Cv(t) is only present during the first passage of the hemoglobin-bound tracer in the intravascular space. Its contribution can be omitted by discarding the early part of the kinetics as determined by observing the vascular transit of an intracarotid bolus injection of HbC15O, a substance that does not diffuse out of the intravascular space. Therefore, for times longer than the vascular transit time, τ, the solitary source of radioactivity in the brain is metabolized oxygen. That is,

Under these conditions, it is straightforward to show that the metabolized component behaves in the same way as for the water kinetics of Eq. 2, but modified for the rate of oxygen extraction

where BO is the concentration of HbO15O radioactivity injected into the brain tissue and OEF is the oxygen extraction fraction. Thus, after omitting the first passage of hemoglobin-bound tracer, the logarithmic slope of the activity curve after intracarotid bolus injection of HbO15O should be identical with that of the curve measured after intracarotid bolus injection of H215O.
MATERIALS AND METHODS
Animal preparation
The institute's animal use committee approved the animal experiments. Anesthesia and muscle relaxation were maintained throughout the experiment with intravenous α-chloralose (35 mg/kg/h) and pancuronium bromide (0.8 mg/kg/h). Body temperature was maintained at 37.0°C with a rectal thermometer and a heating pad. Arterial blood pressure was continuously monitored and arterial blood gas measured during each experiment. The left external carotid artery was ligated and polyethylene tube (PE-10, 0.28-mm inner diameter) was introduced through the left external carotid artery to the origin for injection of the tracer to the internal carotid artery. The pterygopalatine artery was ligated to prevent leakage of the tracers into the extracerebral tissues. The rat was fixed with a stereotactic frame and the parietal bone of the left cortex was thinned with a drill to an approximate thickness of 0.5 mm. The “window” covered a 3 × 5-mm2 rectangle and a β detector was positioned over it. An LDF (Unique Medicals, Tokyo) set in close proximity to the β detector was used to monitor global CBF change (Fig. 1).
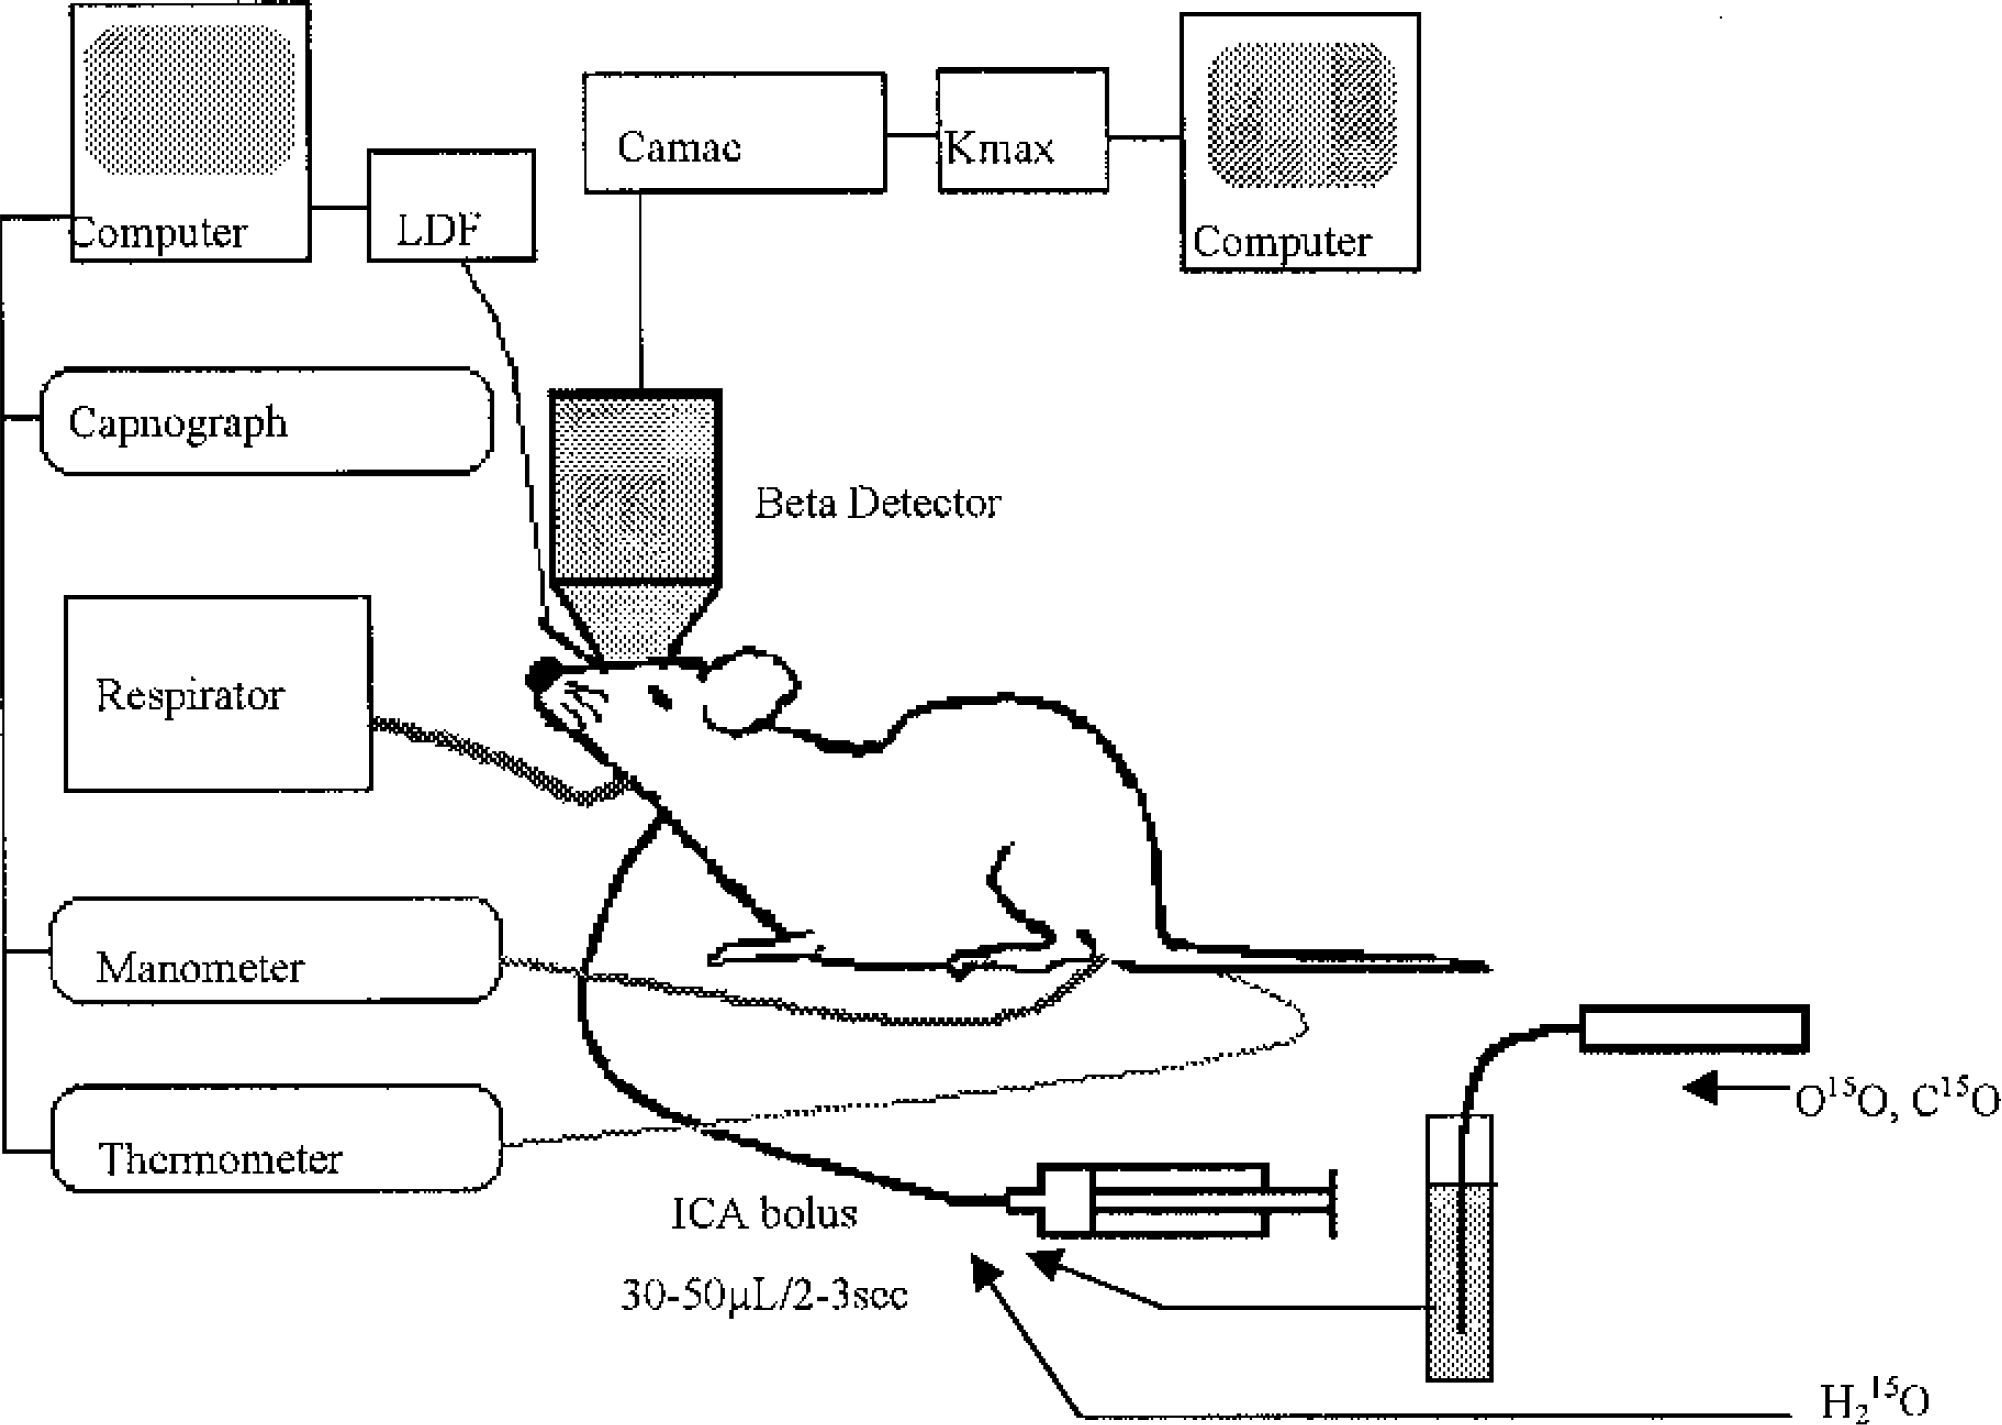
Experimental setup. The head of the rat was fixed with a stereotactic frame and a β detector was put on the thinned skull of the left hemisphere. Three catheters were inserted into the left femoral artery for blood sampling for PaCO2 and blood pressure monitoring, the left femoral vein for administration of anesthesia and muscle relaxant, and the left internal carotid artery for bolus injection of radioactive tracers. The HbO15O and HbC15O tracers were prepared by bubbling radioactive O15O and C15O into the blood, respectively. An LDF was set in the vicinity of the β detector.
Preparation of the 15O-labeled tracers
15O radioactivity was produced by a compact in-house cyclotron (BC168, Japan Steel Works, Muroran, Japan). H215O was synthesized by the in-target method (Hagami, 1986), and vapor of H215O was trapped in a saline vial. HbO15O and HbC15O were made by bubbling O15O and C15O, respectively, into heparinized blood (2 mL) taken from the donor rat and put in a glass tube (100 mL). Each injectate was placed in a polyethylene tube (PE-50) and introduced into the internal carotid artery cannula with a 2- to 3-second injection (Fig. 1). The total radioactivity injected was approximately 100 (3.7), 20 (0.5), and 20 (0.5) μCi (MBq) for the H215O, HbO15O, and HbC15O injections, respectively. The injected volume was between 30 and 50 μL.
Measurement and analysis
Sixteen male Sprague-Dawley rats (366 ± 43 g) were used for the study. Three rats were used to compare the kinetics of HbC15O, HbO15O, and H215O, and the remaining 13 were used to compare the clearance slopes of 15O radioactivity after intracarotid injections of HbO15O and H215O. Measurement began at the commencement of bolus injection. Monitoring cortical CBF with the LDF checked for possible perturbation of the cerebral circulation by the intracarotid injection. The time between frame acquisitions was 4 seconds and the measurement lasted for 120 seconds (30 frames in total). Multiple measurements of H215O, HbO15O, and/or HbC15O activity were repeated for the same rat with a minimum interval of about 20 minutes. The administration of injections was randomized to help avoid any systematic physiologic change between injections. Arterial blood gas tension was measured prior to each injection. The animals were killed with an overdose of intravenous pentobarbital after the last measurement.
The time course of 15O radioactivity at the brain surface was measured with a homemade β detector (Yamamoto, 1997). The detector consisted of a thin CaF2(Eu) scintillator, a tapered fiberoptic plate, and a position-sensitive photomultiplier tube. The output signal consisted of a 64 × 64-pixel image fed to a CAMAC-based data acquisition system attached to a Macintosh computer running K-max software. A 10-mm-diameter detector was used in this study so that 1 pixel corresponded to an area of 0.156 × 0.156-mm2. Performance tests revealed that 66% of the signal originates within a depth of 0.5 mm and 97% from within 2 mm of the detector surface.
Acquired images were transferred to a workstation (Indy, SGI) for further analysis. An elliptical ROI was selected from each data set by visual inspection of the part of the image considered to constitute cortex. Approximately 2,000 pixels covering an area of about 50 mm2 were included in each ROI. The mean and standard deviation of the activity–time course was obtained from the ROIs using the Dr. View (Asahi Kasei Jyoho System, Tokyo) image analysis software. The physical decay of 15O (T1/2 = 123 seconds) was corrected for throughout all procedures.
RESULTS
Tracer time–activity curves
The mean time courses of H215O, HbO15O, and HbC15O radioactivity were compared. Figure 2 shows a typical set of time–activity curves acquired after each of the three tracers was injected into a rat. Data were corrected for the physical decay of 15O. The time–activity curve of HbC15O decreased to less than 1% of the peak within 30 seconds of the injection. Thus, the vascular transit of red blood cells requires that at least the first 30 seconds of data after injection is neglected during washout analysis.
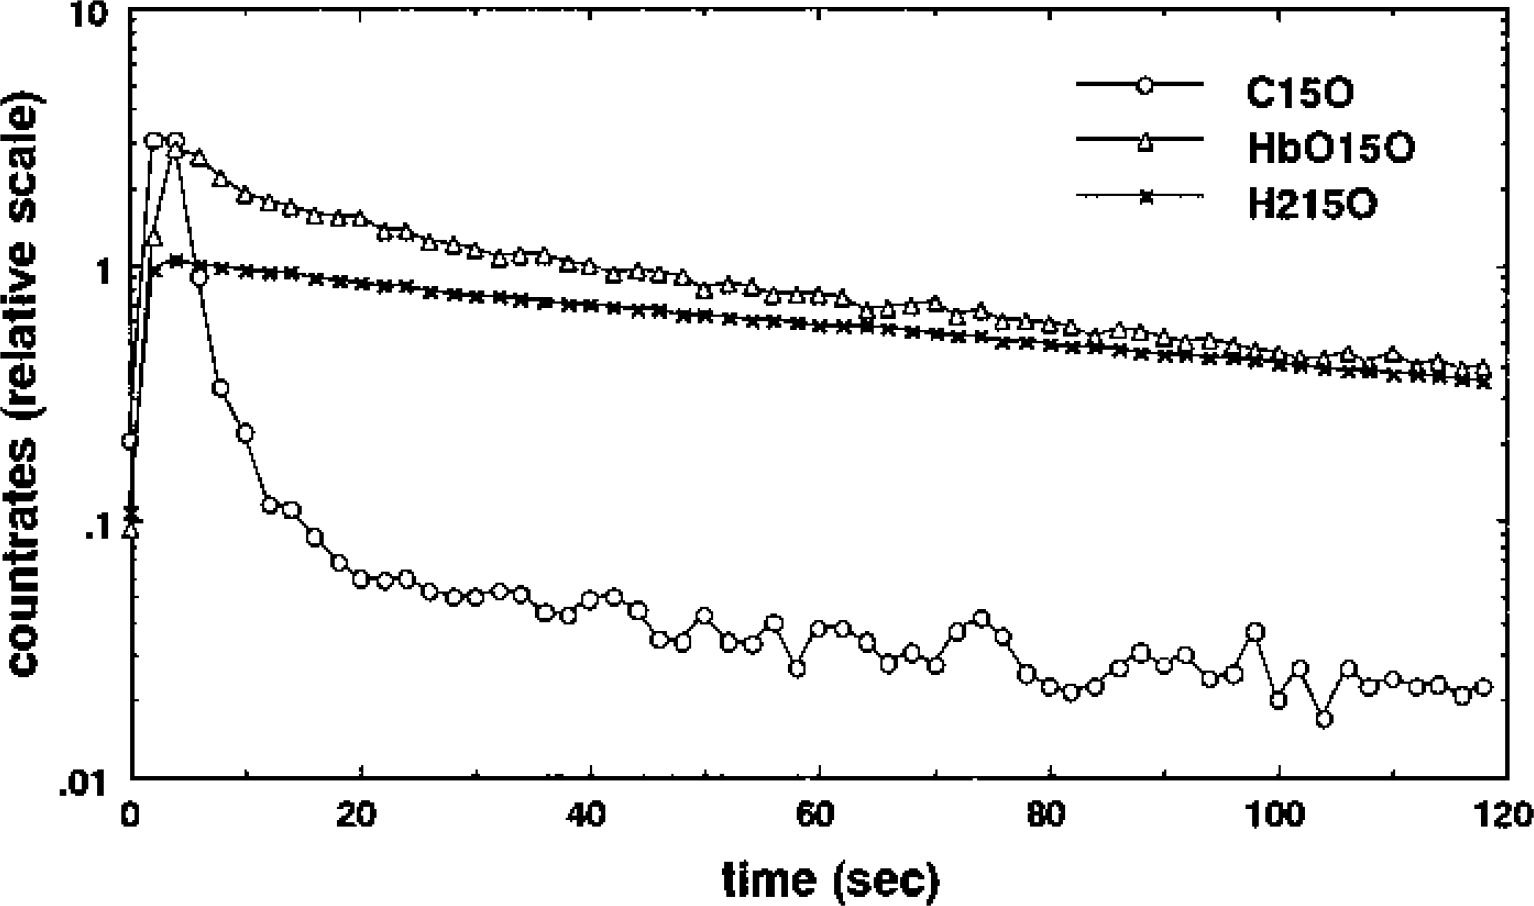
Logarithmic display of time–activity curves after intracarotid bolus injection of 15O tracers in rat. HbC15O (circle) does not leak out from the vascular space and only passed through the inside of the vessel after it was injected. H215O (cross) diffused into the brain tissue and was washed out by cerebral blood flow. The HbO15O (triangle) curve showed a small peak early on corresponding to nonextracted tracer. Extracted 15O was washed out afterward, but with a slightly faster slope than that measured for the H215O curve.
The curve after the H215O injection had a linear slope in the logarithmic scale, consistent with the expected monoexponential clearance of the H215O tracer. On the other hand, the curve after the HbO15O injection showed a small peak compatible with nonextracted oxygen passing through vessels in the region, followed by the clearance phase. Upon visual inspection, the part of this curve after the transit of intravascular tracer also appears to have an approximately linear behavior in the logarithmic scale. The gradient of the logarithmic curve can be compared with that of the H15O data.
Comparison of 15O radioactivity clearance rates
In order to quantitatively compare the kinetics of 15O radioactivity after bolus injection of H215O and HbO15O, we calculated the slope of the portion of the curve between 60 and 120 seconds with a least-squares fit of a straight line to the logarithmic data. Even though the HbC15O measurements showed that intravascular tracer can be neglected after only 30 seconds, the data during this later period was selected to make certain that all unextracted tracer had passed. Estimates of the HbO15O and H215O clearance rates for each rat are presented in Table 1. The mean ± SD HbO15O clearance rate (0.494 ± 0.07 min-1) is larger than the H215O rate (0.406 ± 0.037 min−1).
Clearance rate of 15O radioactivity after intracarotid bolus injection of HbO15O and H215O during normcapnia in 13 rats
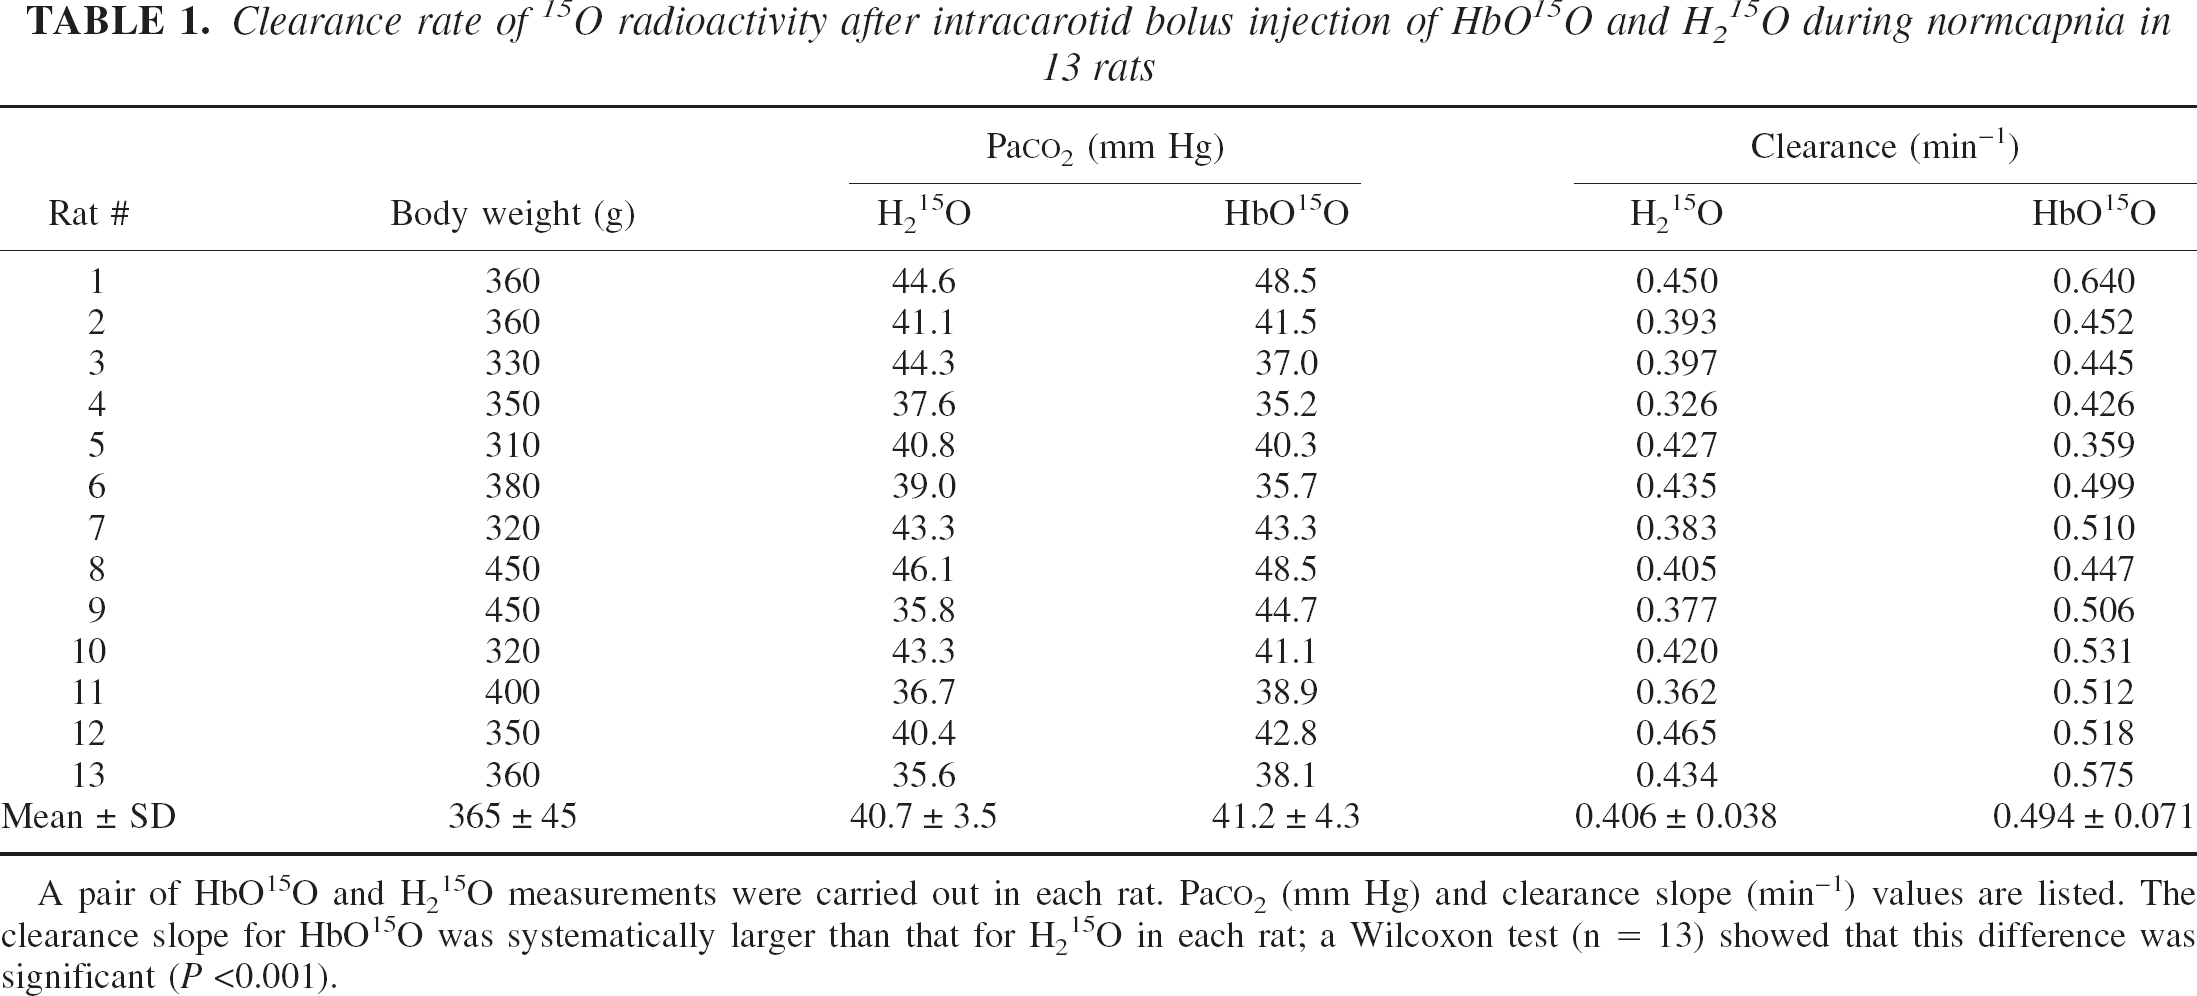
A pair of HbO15O and H215O measurements were carried out in each rat. PaCO2 (mm Hg) and clearance slope (min−1) values are listed. The clearance slope for HbO15O was systematically larger than that for H215O in each rat; a Wilcoxon test (n = 13) showed that this difference was significant (P <0.001).
The estimates were pooled and a Wilcoxon test (n = 13) was used to test for a significant difference between the HbO15O and H215O groups. The radioactivity clearance was significantly larger after HbO15O injection than after H215O injection (P<0.001). At the same time, the mean ± SD PaCO2 levels of the H215O and HbO15O injections were 40.7 ± 3.5 mm Hg and 41.2 ± 4.3 mm Hg, respectively, and another Wilcoxon test on this data showed that there was no significant difference between the two groups. Therefore, the clearance rates of 15O radioactivity after bolus injection of HbO15O and H215O were significantly different under the same normocapnic Paco2 level.
Additional observations
No sharp peak corresponding to unextracted tracer in the early part of the H215O kinetics was observed. It is possible that the limited temporal resolution (8 s/frame) of the β camera may have allowed a small peak to pass unresolved, but the absence of any peak was consistent across all H215O experiments. Therefore, it appears that Ew ≈ 1 and [15O]water behaved as a freely diffusible tracer under the current experimental conditions. With this information and pw = 0.95, the CBF value was calculated from the [15O]water activity curves to be approximately 0.39 ± 0.035 mL·100 g−1·min−1, which is low compared with normal rat values (Sakurada et al., 1978) and might be due to the effects of the anesthesia.
DISCUSSION
Possible explanations for the difference in clearance rates
In the current study, we tested the hypothesis that oxygen diffusing into brain is immediately metabolized into water so that the oxygen concentration of brain tissue is negligible. If this hypothesis is correct, then the clearance rates of 15O radioactivity after bolus injection of HbO15O and H215O into the intracarotid artery should be identical. However, the logarithmic slope of the curve after HbO15O injection was significantly steeper than that after H215O injection (Fig. 2, Table 1).
One explanation for the larger HbO15O clearance slope could be the significant presence of nonmetabolized oxygen in the brain tissue. If this is truly the case, then there are two molecular forms of 15O radioactivity in brain tissue after HbO15O administration: diffused O15O and metabolized H215O. Under this assumption, the unbound O15O behaves as a diffusible tracer (it may diffuse into the interstitial space and back into the bloodstream without being metabolized), but the partition coefficient is unknown. If oxygen behaves as a lipophilic substance and the solubility is proportional to the lipid fraction of each component, brain tissue should have a large capacity for oxygen because it contains a significant fraction of lipid. Nevertheless, there is a much larger capacity for oxygen in red blood cells, which leads to a smaller brain–blood partition coefficient of oxygen than unity. On the other hand, the brain–blood partition coefficient of water is almost unity (Herscovitch and Raichle, 1985). Therefore, the O15O clearance should be much faster than H215O clearance. This means that the steeper slope of the curve after HbO15O injection might be explained as an additional relatively rapid O15O clearance added to the metabolized H215O clearance curve, assuming that the latter behaves in the same manner as externally supplied H215O.
Another potential explanation for the larger slope is the contribution of recirculating 15O radioactivity returned from systemic circulation. At maximum, the amount of returning H15O activity is expected to be about 10% (Høedt-Rasmussen et al., 1966). For the case of the HbO15O tracer, under the original hypothesis recirculating radioactivity includes both a H215O component and a nonmetabolized O15O component that arises exclusively from O15O radioactivity that has not diffused into the brain. The H215O component should produce approximately the same contribution as a H215O injection, and the nonmetabolized O15O component will contribute an additional factor. Therefore, the recirculation fraction after a HbO15O injection will increase the radioactivity concentration, corresponding to slower clearance than for an injection of H215O. It follows that the clearance curve after a HbO15O injection should be less steep than that for H215O in the logarithmic scale, which is contrary to our observation. Consequently, a recirculating component does not explain the difference in slope.
The possibility that some change occurred in the physiologic condition of the rats after injection cannot be ignored. However, as shown in Table 1, PaCO2 levels were carefully monitored during all experiments and no significant differences were observed. Furthermore, the order of injection administration was randomized. Another possibility is that the injectates might have affected the cerebral circulation or global CBF (e.g., hemorheologic factors like viscosity). Monitoring CBF with LDF eliminated this possibility, and no systematic change in CBF level was observed after injection with either tracer.
Finally, as the field of view of the β detector was relatively large (approximately 10 mm in diameter) with respect to the rat brain, the clearance might have suffered from a heterogeneity problem due to the inclusion of multiple brain tissue components. However, as the geometry was identical for both injections, this heterogeneity problem cannot explain the difference in clearance slopes. Additionally, as the depth response of the detector is limited to around 2 mm and the β rays were detected through the partially thinned skull, the detected radioactivity is confined to the cortex. That is, the detector overwhelmingly detected signal from gray matter so that there was very little mixing of the signals from white and gray matter.
Consequences of nonmetabolized tissue oxygen
Assuming that the above reasoning is correct in rejecting most of the potential confounding factors discussed in the previous section, the finding of a steeper logarithmic clearance curve after HbO15O injection than after H215O injection suggests that there is some unknown component contributing to the former curve. If this unknown component is the result of a relatively rapid clearance of nonmetabolized O15O radioactivity from tissue, then the original hypothesis of a negligible brain oxygen concentration must be reconsidered. Abandoning the hypothesis means that it is necessary to divide the tissue activity into metabolized and nonmetabolized oxygen compartments. A suggested model is shown in Fig. 3. In this model, the radioactivity in the water compartment is unidirectionally supplied from the nonmetabolized oxygen compartment, and a fraction of the nonmetabolized O15O is returned directly to the blood stream. A brief derivation of the compartmental concentrations is included in the Appendix. The resultant tissue radioactivity during clearance is a biexponential curve with two intrinsic clearance rates.
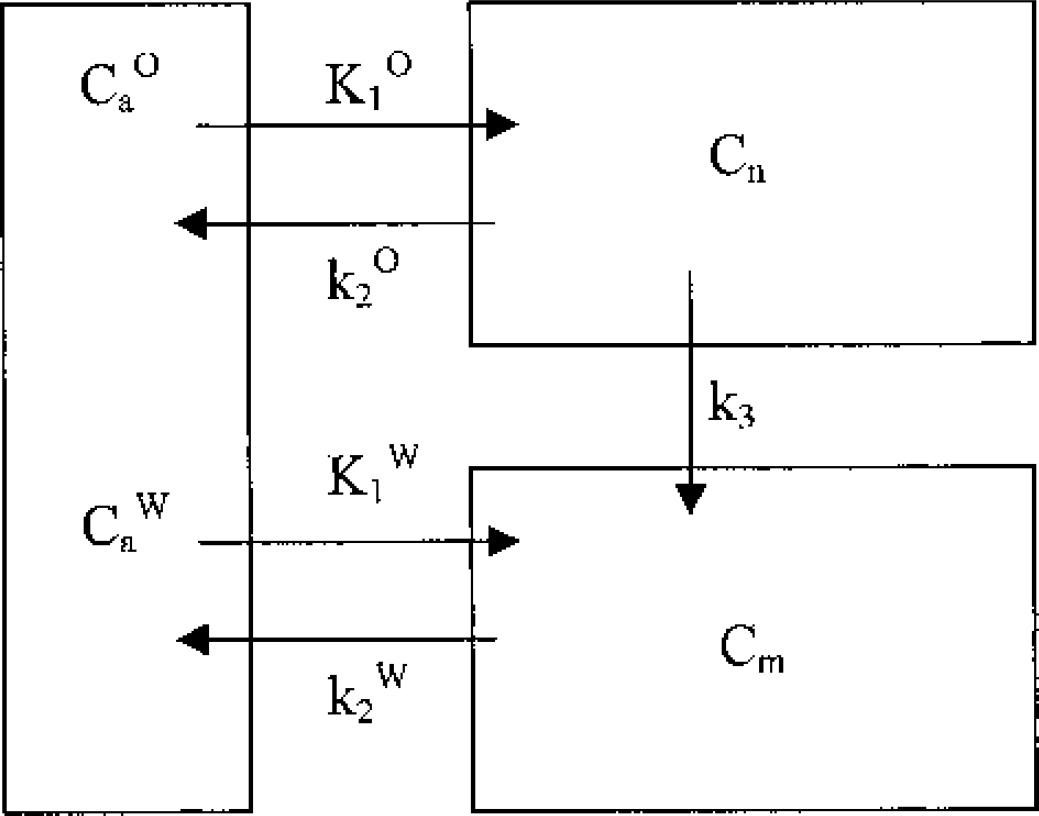
Tracer model for radioactivity kinetics after HbO15O injection. The model consists of a vascular compartment, a nonmetabolized oxygen compartment, and a metabolized water compartment. Cn and Cm denote the radioactivity concentrations in the nonmetabolized and metabolized brain tissue compartments, respectively. CaO and CaW are the arterial nonmetabolized oxygen and metabolized water in the vascular compartment. K1O and k2O are the rate constants of radioactive nonmetabolized oxygen transfer between the arterial blood and nonmetabolized oxygen compartment. K1W and k2W are the rate constants of radioactive metabolized water transfer between arterial blood and the metabolized water compartment. k3 is the rate constant for metabolism from nonmetabolized oxygen to metabolized water.
It is not our intention to conclusively show that biexponential behavior explains the contradiction observed in the results. After all, the two extra degrees of freedom allowed by a biexponential fitting function will obviously account for more of the variance in the data. Also, the monoexponential fits to the O15O data were very good, with an F test showing that there is a probability of less than 0.1% that a linear fit is incompatible with the logarithmic data. Nevertheless, the low temporal resolution and limited range of the data do not rule out possible biexponential behavior. Using the H15O clearance estimates as the rate of water transfer from brain tissue to vessel, k2W, a nonlinear least-squares calculation estimated the other rate, k2O + k3, to be 1.58 (0.03, 2.03) min−1. This estimate is quoted as the median and interquartile range of the estimates from all rats. Although the error in this estimate is large, it meets the expectation that k2O + k3 must be the faster rate because the [15O]water clearance (k2W) dominates at long times.
If a biexponential interpretation of the data is correct, there may be serious consequences for the estimation of physiologic parameters with PET. For example, the assumption that nonmetabolized oxygen is negligible has been widely utilized when estimating CMRo2. The existence of a nonmetabolized oxygen tissue compartment will result in an overestimation of the CMRo2 determined using O15O tracer and PET. In calculating CMRo2 with autoradiographic imaging methods like single-breath (Mintun et al., 1984) or steady-state (Frackowiak et al., 1980) inhalation, the size of the error can be simply estimated by the fraction of nonmetabolized [15O]radioactivity with respect to metabolized water. However, in order to quantify the magnitude of the error in CMRo2, further study is necessary to measure the concentration of nonmetabolized oxygen.
CONCLUSION
The clearance of 15O radioactivity after an intracarotid bolus injection of HbO15O into rat was found to be faster than that observed after a bolus injection of H215O. One interpretation of this finding is that a nonnegligible presence of oxygen exists in the extravascular space of the brain. If this is true, then further study is needed to quantify the oxygen concentration in brain tissue and to estimate the error in CMRo2 measurement with PET.
Footnotes
APPENDIX
Tracer kinetics for a model including a nonmetabolized oxygen compartment, a metabolized water compartment, and a blood compartment was derived using the following parameters:
CaO, arterial concentration of radioactive oxygen
CaW, arterial concentration of radioactive water
Cn, concentration of activity in the nonmetabolized compartment
Cm, concentration of activity in the metabolized compartment
K1O, rate of oxygen transfer from vessel to brain tissue
k2O, rate of oxygen transfer from brain tissue to vessel
K1W, rate of water transfer from vessel to brain tissue
k2W, rate of water transfer from brain tissue to vessel
k3, transfer rate from nonmetabolized to metabolized compartment
Ignoring the contribution from the physical decay of 15O radioactivity, the equations for the model in Fig. 3 are
Assuming Cn(0) = Cm(0) = 0 and k2O + k3 – k2W ≠ 0, these equations can be solved by Laplace transform to give
where * denotes a convolution integral. Hence, the total brain radioactivity concentration during washout (i.e., after vascular transit and with negligible recirculation) can be written as the sum of the two compartments
For the simplest case of a bolus injection of HbO15O; i.e., CaO = BOδ(t) and CaW = 0, the concentration of radioactivity is
which is biexponential.
Acknowledgments:
The authors thank Ms. Yuko Miura for her critical suggestions during the preparation of this paper, Dr. Kazuhiro Takahashi for valuable advice on the experimental setup, Mr. Yozo Ito for rat surgery, and the Department of Radiology and Nuclear Medicine staff for technical assistance.