
Abstract
The authors compared temporal profiles of Nacetylaspartate (NAA) and the NAA/total creatine ratio with neuronal and astrocytic densities and with tissue atrophy in the hippocampal CA1 sector of gerbils after 5-minute bilateral forebrain ischemia and subsequent reperfusion for up to 6 months. The CA1 sector was dissected from 20-μm lyophilized sections (n = 5) for NAA, phosphocreatine, and creatine assays using high-performance liquid chromatography. Adjacent 10-μm sections were used for immunohistochemical analysis to follow neuronal and astrocytic responses. The NAA concentration was significantly (P<0.01) decreased after 7 days but leveled off thereafter. The NAA/total creatine (phosphocreatine + creatine) ratio was significantly decreased after 7 days and further decreased (P<0.05) after 6 months. Extensive neuronal damage developed beyond 7 days, while reactive astrogliosis progressed throughout the observation period. There was a good linear correlation (P<0.01) between astroglial density and the NAA/total creatine ratio beyond 7 days. The thickness of the CA1 sector was significantly reduced after 1 month and further reduced after 6 months. Although both NAA level and the NAA/total creatine ratio seemed to be indicators of neuronal damage, the latter could be influenced by reactive astrogliosis with progression of tissue atrophy.
Analysis of neuronal and glial responses is valuable for elucidation of the pathophysiologic mechanisms of various disease states in the central nervous system. Using HPLC, we previously found a strong linear correlation between the level of NAA, a metabolic neuronal marker for ischemic brain damage (Tsai and Coyle, 1995), and neuronal density in the CA1 sector of the hippocampus after transient forebrain ischemia in gerbils, and suggested that the NAA level could serve as a useful index for structural integrity of neurons (Nakano et al., 1998, 2001).
Proton MRS can measure the brain NAA level noninvasively, because the result is a distinct peak at 2.02 ppm (Miller, 1991). Since it is not always easy to determine the absolute NAA level using MRS (Miller, 1991), the ratio of the NAA peak to the total creatine (phosphocreatine + creatine) peak at 3.03 ppm has been used. A decrease in this ratio has been reported in various diseases including stroke (Tsai and Coyle, 1995), with the assumption that the total creatine level is fairly constant even in various disease states (Miller, 1991). This assumption appears to be reasonable because the conversion between phosphocreatine and creatine supports an energy-requiring system via creatine kinase in all cell types in the CNS (Erecinska and Silver, 1989). However, recent studies have suggested that the total creatine level may be altered in some disease states (Higuchi et al., 1996; van Walderveen et al., 1999), possibly because of the influence of astrogliosis (van Walderveen et al., 1999). Another reason to use the NAA/total creatine ratio in MRS is to normalize the NAA level to avoid the partial volume effect caused by cerebrospinal fluid, especially in the spectroscopic region of interest where brain atrophy is suspected (Tsai and Coyle, 1995; van Walderveen et al., 1999). Accumulating evidence suggests that a decrease in the NAA/total creatine ratio precedes the development of brain atrophy (Tsai and Coyle, 1995), even though a persuasive explanation for this decrease is still missing.
After establishing an immunohistochemical method of examining neuronal integrity and astrocytic reactivity by using antibodies against tubulin and its associated proteins and an antibody against GFAP, respectively (Yanagihara, 1990), we developed a procedure that simultaneously assesses immunohistopathologic changes and alterations of various metabolites related to energy metabolism in small regions of interest in the brain (Ueda et al., 1999). We subsequently added to this combined immunohistochemical/HPLC procedure a method that measures NAA (Nakano et al., 1998). In the current study, we added a method for creatine measurement that allowed us to follow changes in NAA, phosphocreatine, and creatine levels and simultaneously follow the neuronal integrity and astrocytic reactions using immunohistochemistry. We tested the hypothesis that not only neuronal damage but also astrocytic gliosis could reduce the NAA/total creatine ratio in the hippocampal CA1 sector of gerbil brains after transient forebrain ischemia. We also measured the degree of shrinkage of the CA1 sector to determine the relationship between tissue atrophy and the NAA/total creatine ratio. A portion of the current study has been reported in abstract form (Konaka et al., 2002).
MATERIALS AND METHODS
Animals
Experiments were conducted according to Osaka University Medical School's Guidelines for the Care and the Use of Laboratory Animals. Male Mongolian gerbils (Meriones unguiculatus) weighing 50 to 80 g were kept at a constant temperature (25°C) in an air-conditioned room with a 12-hour light/dark cycle for at least 7 days before surgery, and were allowed free access to food and water before and after surgery. Gerbils were given ether anesthesia, and the common carotid arteries were exposed bilaterally through a midline incision in the neck and occluded with miniature aneurysmal clips. After 5 minutes, the clips were released and patency of the arteries was ascertained before closing the skin incision. The rectal temperature was kept at 37.0°C ± 0.5°C by means of a heating pad. Gerbils were assigned to one of three groups with a reperfusion period of 7 days, 1 month, or 6 months. Sham-operated gerbils were used as controls. Each group consisted of five gerbils.
Measurement of metabolites by high-performance liquid chromatography
At a prescheduled time, hair over the skull was removed using ether anesthesia and each brain was frozen in situ by dipping the head into liquid nitrogen (Ueda et al., 1999). The brain was isolated in a −25°C icebox and cut coronally into 10-or 20-μm-thick sections by using a cryostat at the level of the hippocampus (i.e., 1.4–1.8 mm caudal to bregma) (Loskota et al., 1974). The 20-μm sections were prepared for NAA, phosphocreatine and creatine assays and lyophilized overnight. The whole CA1 sector, delineated by the adjacent immunohistochemical section, was dissected from each lyophilized section under a stereo-zoom microscope in a low humidity (50%) room at 20°C and weighed with a microbalance scale (CAHN-32; CAHN Instruments, Cerritos, CA, U.S.A.) (Ueda et al., 1999). Brain tissue weighting 60 to 150 μg was collected in a polyethylene centrifuge tube, homogenized by sonication in 0.5-mol/L perchloric acid at 4°C, and centrifuged at 12,000g for 10 minutes at 4°C. After neutralization of the supernatant with 1-mol/L potassium hydroxide, each sample was frozen with liquid nitrogen and stored at −80°C until analysis (Ueda et al., 1999).
On the day of biochemical analyses, each sample was thawed and centrifuged at 12,000g for 10 minutes at 4°C. The supernatant was collected for analyses using a HPLC system (Shimadzu, Kyoto, Japan), and NAA (Nakano et al., 1998) and phosphocreatine (Ueda et al., 1999) levels were determined as described previously using an anion exchange column (DEAE-2SW: 4.6-mm inside diameter, 250-mm long; TOSOH, Tokyo, Japan) with a mobile phase of 80-mmol/L sodium phosphate buffer (pH 6.0) and a flow rate of 0.8 mL/min. Monitoring of the absorbance at 210 nm showed elution of NAA and phosphocreatine at 19.5 and 13.0 minutes, respectively. The creatine level was determined using a previously described method (Wiseman et al., 1992), but using a strong cation exchanger (TSK gel Amino-pak column: 4.6-mm inside diameter, 120-mm long; TOSOH) with a mobile phase of 25-mmol/L sodium phosphate buffer (pH 7.8) at a flow rate of 0.3 mL/min. The absorbance was monitored at 210 nm with an absorbance unit full scale of 0.005 for each sample. The retention time for creatine was 5.5 minutes. Authentic NAA, phosphocreatine, and creatine (Sigma Chemical, St Louis, MO, U.S.A.) in distilled water were used as standards. Concentrations were expressed as picomoles per microgram dry weight.
Histopathology
Adjacent 10-μm sections were mounted on a slide, fixed in chilled acetone solution at −20°C for 10 minutes, and air-dried. For analysis of neuronal and astrocytic response, we performed a previously established immunohistochemical procedure (Hatakeyama et al., 1988) with peroxidase-antiperoxidase complex using an antibody against MAPs (Yanagihara, 1990) or GFAP (Dako, Tokyo, Japan), respectively. The final chromogenic reaction was accomplished using diaminobenzidine and hydrogen peroxide. Cell nuclei were visualized using hematoxylin counterstaining. The number of surviving pyramidal neurons in the CA1 sector was counted in a blind fashion by one investigator (J-Y. L.) who was unaware of the origin of each specimen. Two microscopic fields (×400) were examined and averaged. Only those neurons with a sharply delineated nucleus and a clearly distinguishable nucleolus were counted as described elsewhere (Nakano et al., 1998). The neuronal density was expressed as count per millimeter of length. The number of reactive astrocytes in the CA1 sector was similarly counted in a blind fashion. Cells with obvious processes and a well-defined nucleus were counted. The density of reactive astrocytes was expressed as count per square millimeter.
The width of the CA1 sector was calculated from the maximum distance between the alveus and the stratum lacunosum moleculare perpendicular to the alveus as described elsewhere (Kondo et al., 1995). Measurements were performed using photographs taken from the sections stained with MAPs and hematoxylin, and calculations were performed using Pictrograb 2500 Version 1.0 (Fuji Photo Film, Tokyo, Japan) and Adobe Photoshop 6.0 software (Adobe Systems, San Jose, CA, U.S.A.).
Statistical analysis
The statistical significance of the differences among levels of NAA, phosphocreatine, creatine, and total creatine (phosphocreatine + creatine), the phosphocreatine/creatine and NAA/total creatine ratios, neuronal density, astrocytic density, and width of the CA1 sector was tested by one-factor analysis of variance followed by Bonferroni multiple comparison test. The correlation between total creatine and astrocytic density or between NAA/total creatine ratio and astrocytic density was analyzed by using the Pearson correlation coefficient. P values less than 0.05 were considered to represent a significant difference. StatView 4.1 J software (Abacus Concepts, Berkeley, CA, U.S.A.) was used for statistical analysis. All data are presented as mean ± SD.
RESULTS
All gerbils behaved normally several hours after reperfusion for up to 6 months, with the exception of one animal that died 7 days after reperfusion. No gerbil that showed seizure or severe respiratory failure during ischemia and the reperfusion period was included in this study.
An area showing a loss of the immunohistochemical reaction in response to MAPs developed in the entire CA1 sector of the hippocampus after 5-minute ischemia and 7-day reperfusion. The extent of damage was essentially the same as that reported previously (Hatakeyama et al., 1988; Nakano et al., 1998). The damaged area did not extend further after 1 and 6 months (data not shown). Examination at higher magnification revealed dendritic and cytoplasmic damages at all reperfusion periods (Figs. 1B–1D) as compared to the control (Fig. 1A).
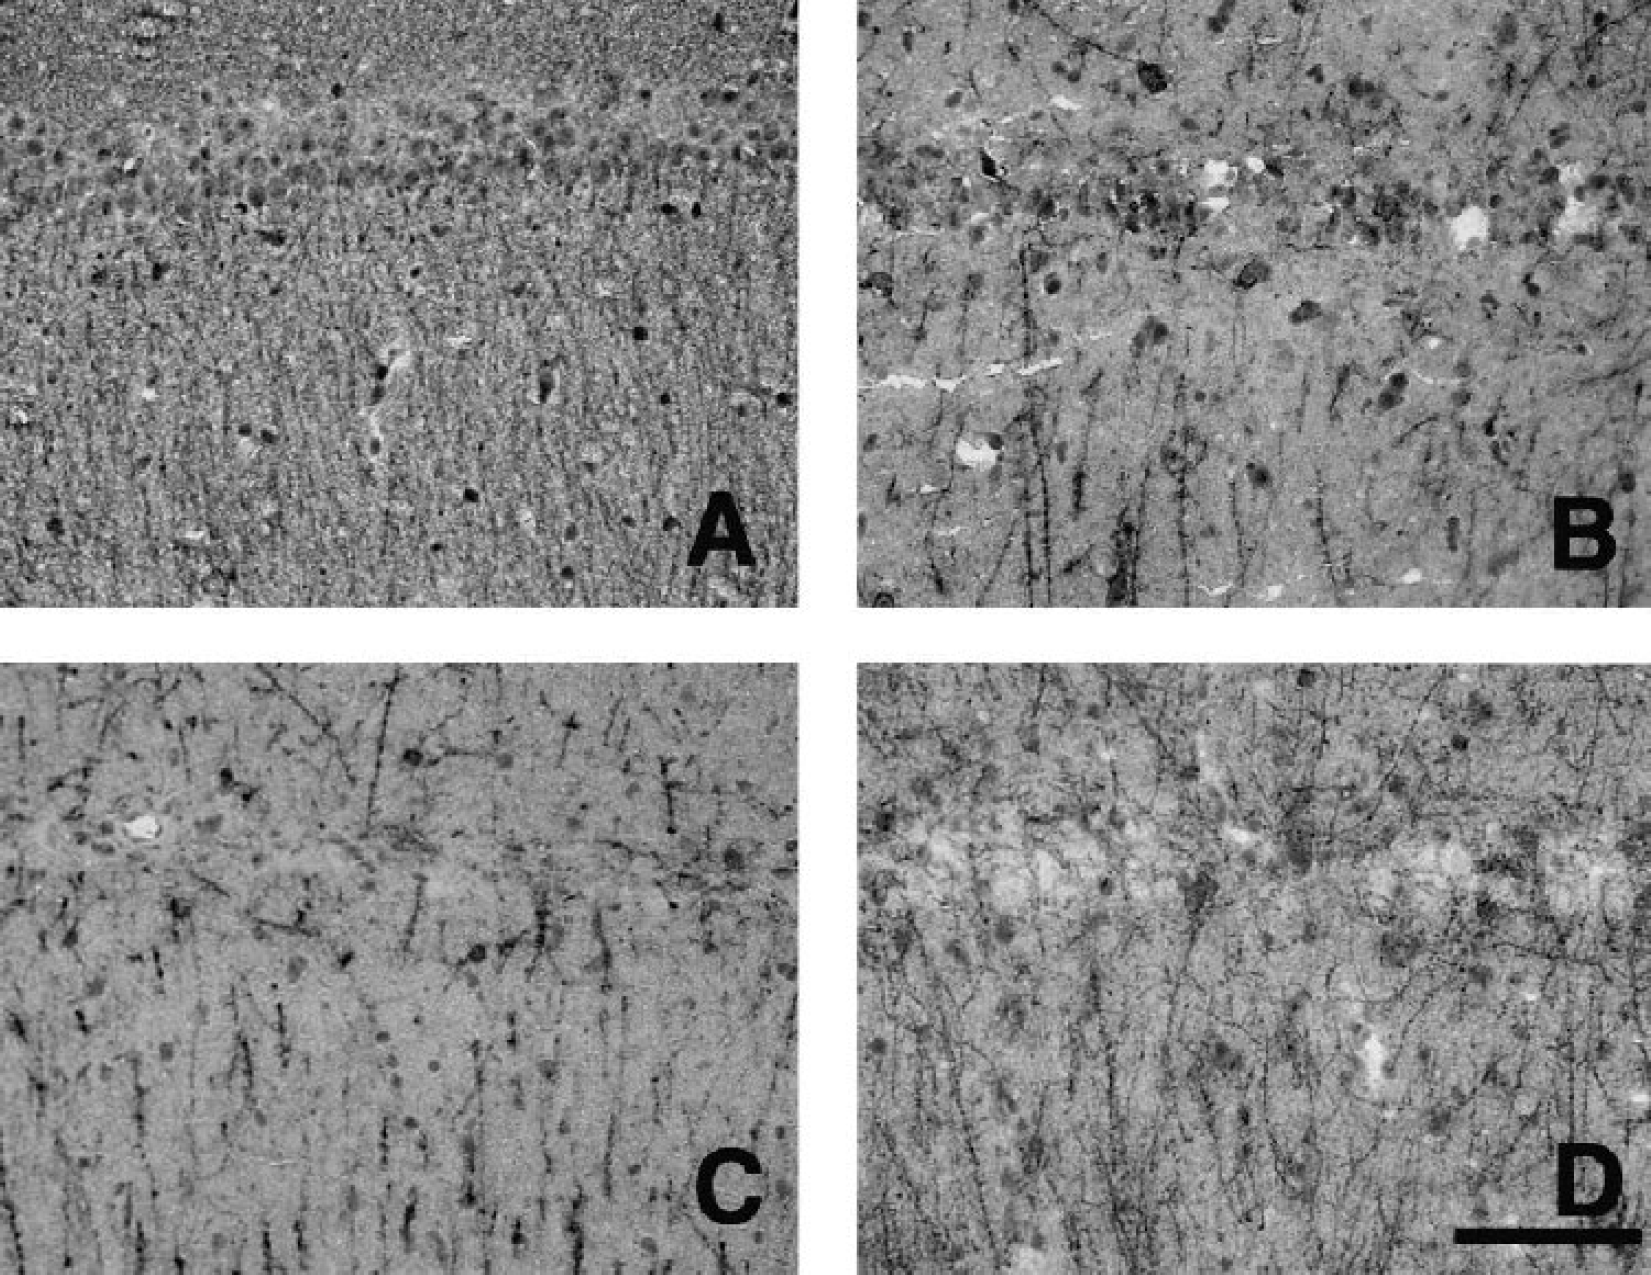
Immunohistochemical reaction to MAPs in the CA1 sector of the hippocampus before (
The neuronal density (cells/mm) in the CA1 sector was 228 ± 31 in the control group, but significantly decreased to 15 ± 8, 8 ± 5, and 22 ± 7 after 7-day, 1-month, and 6-month reperfusion, respectively (all P<0.001 vs. control) (Fig. 2). These results are consistent with our previous findings (Nakano et al., 1998, 2001). There was no significant difference in the neuronal density among the three reperfusion periods.
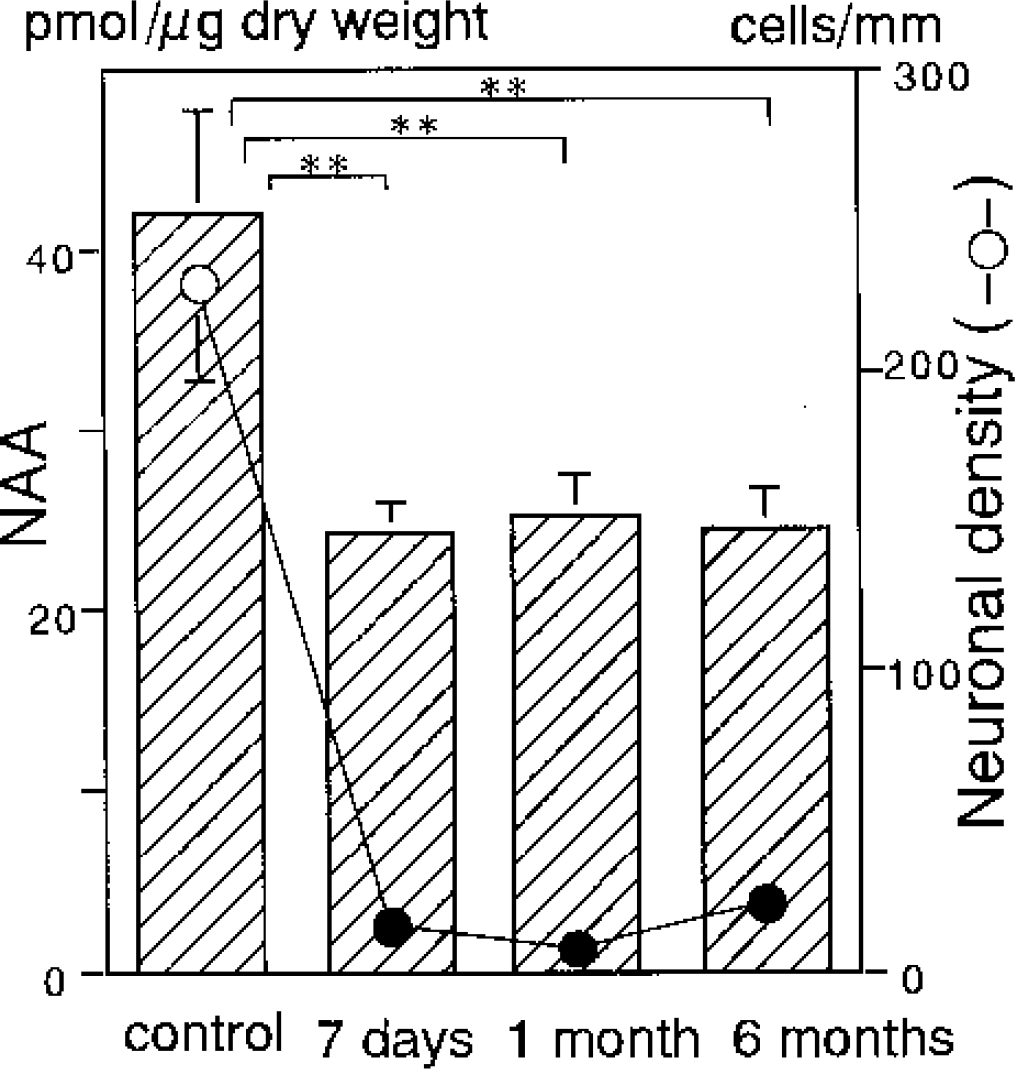
Temporal profile of the regional NAA level (bar) and the neuronal density (circle) in the CA1 sector of the hippocampus before and after 5-minute transient forebrain ischemia with subsequent reperfusion for 7 days, 1 month, and 6 months. Asterisks and filled circles indicate a significant difference (P<0.01) from the control group values.
The NAA level (picomoles per microgram dry weight) in the CA1 sector was 42.1 ± 5.7 in the control group, which was in good agreement with our previous studies (Nakano et al., 1998, 2001). During reperfusion, it significantly decreased to 24.4 ± 1.6 after 7 days, 25.3 ± 2.1 after 1 month, and 24.4 ± 2.4 after 6 months (all P<0.01 vs. control) (Fig. 2). There was no significant difference in the NAA level among the three reperfusion periods.
The total creatine level (picomoles per microgram dry weight) in the control group was 42.6 ± 4.2 (Fig 3A), with a phosphocreatine level of 24.2 ± 2.8 and a creatine level of 18.9 ± 4.8. After reperfusion, the total creatine level decreased significantly to 34.4 ± 3.8 after 7 days and 35.3 ± 2.6 after 1 month (P<0.05, each). After 6 months, the level significantly increased to 44.5 ± 4.4, an approximation of the control level (P<0.05 vs. 1 month) (Fig 3A). The temporal profiles of the phosphocreatine and creatine levels were similar to that of the total creatine level but less prominent. The phosphocreatine level was 17.5 ± 3.3 after 7 days, 20.6 ± 3.2 after 1 month, and 23.6 ± 3.1 after 6 months. Significant differences in the phosphocreatine level were observed between control and 7-day reperfusion and between 7-day and 6-month reperfusion (P<0.05, each). The creatine level was 16.8 ± 3.8 after 7 days, 14.7 ± 1.8 after 1 month, and 20.9 ± 1.8 after 6 months. A significant difference in the creatine level was observed between 1-month and 6-month reperfusion (P<0.05). The phosphocreatine/creatine ratio fluctuated during reperfusion but was not significantly different from that of controls (Fig. 3A).
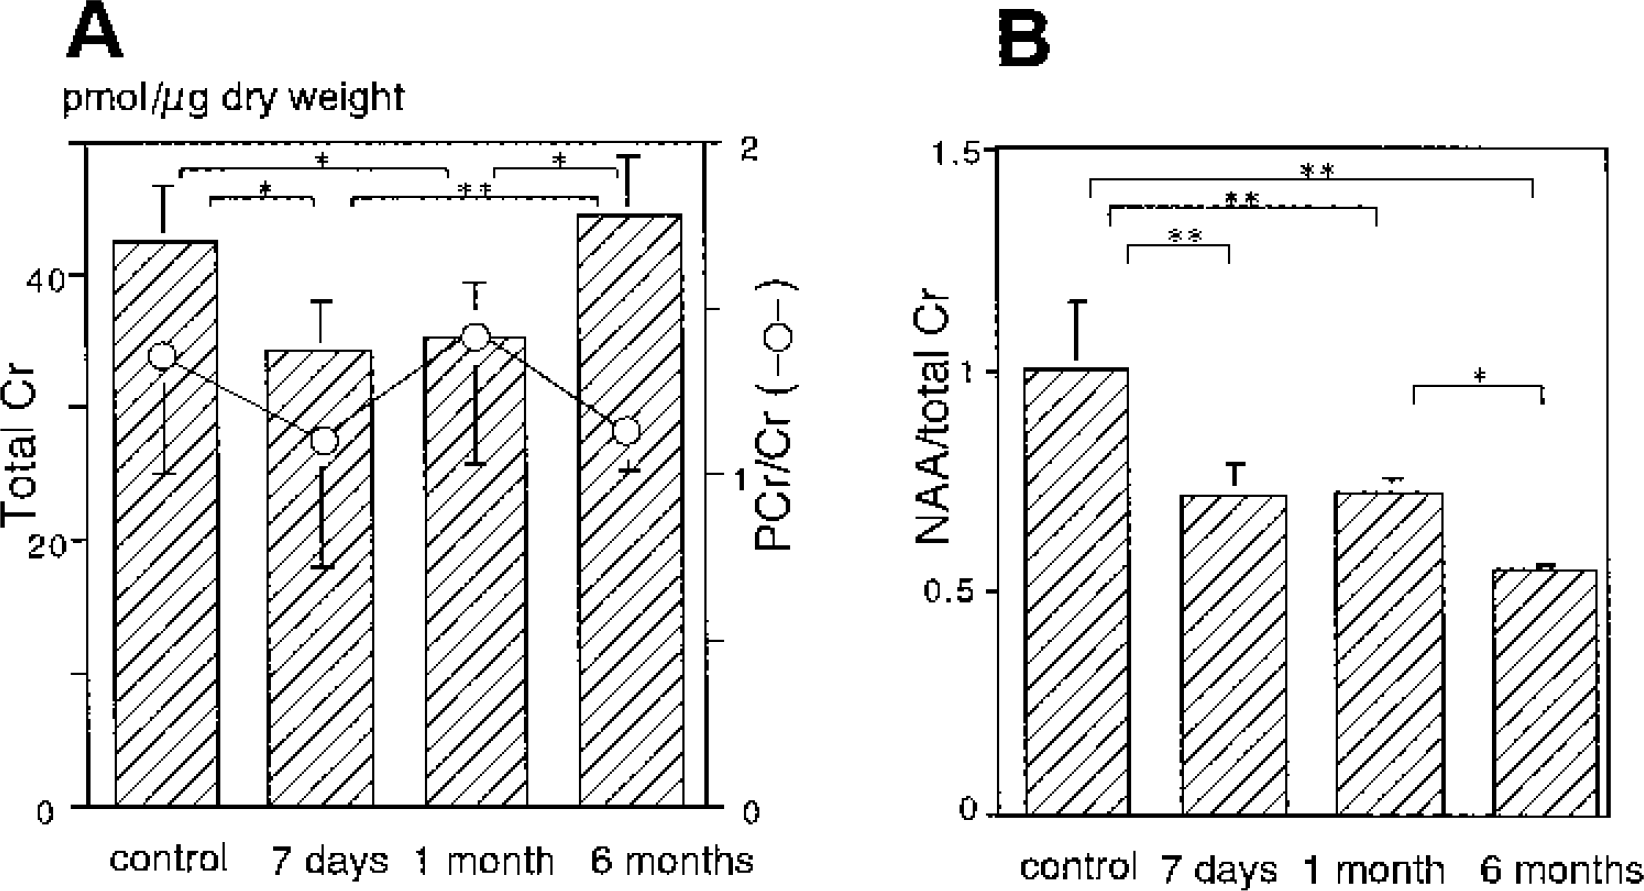
Temporal profile of the regional total creatine level (bar) with phosphocreatine/creatine ratio (circle) (
Even in the presence of a decrease in the total creatine level after 7-day and 1-month reperfusion, the NAA/total creatine ratio also decreased from 1.00 ± 0.16 in the control group to 0.71 ± 0.08 and 0.72 ± 0.04 after 7 days and 1 month, respectively (both P<0.01). After 6 months, the NAA/total creatine ratio further decreased to 0.55 ± 0.02 (P<0.05 vs. 1 month) as the total creatine level returned to the control level (Fig. 3B). The profile of the NAA/total creatine ratio was different from that of the NAA level shown in Fig. 2, suggesting that the NAA/total creatine ratio may not reflect neuronal damage alone.
In order to find possible explanations for the observed difference, we examined the correlation between the NAA/total creatine ratio and proliferation of reactive astrocytes. The immunohistochemical reaction to GFAP showed considerable activation of astrocytes after 7-day reperfusion (Fig. 4B). Although the extent of astrocytic reaction was similar after 1 month (Fig. 4C), it progressed further after 6 months with hypertrophied astrocytes possessing stout processes (Fig. 4D). The astrocytic density increased gradually during the reperfusion period (Fig. 5). The astrocytic density (cells/mm2) after 1 month (276 ± 38) was significantly higher than that after 7 days (214 ± 10) (P<0.05). After 6 months it further increased to 540 ± 83 (P<0.01 vs. 7 days and 1 month).
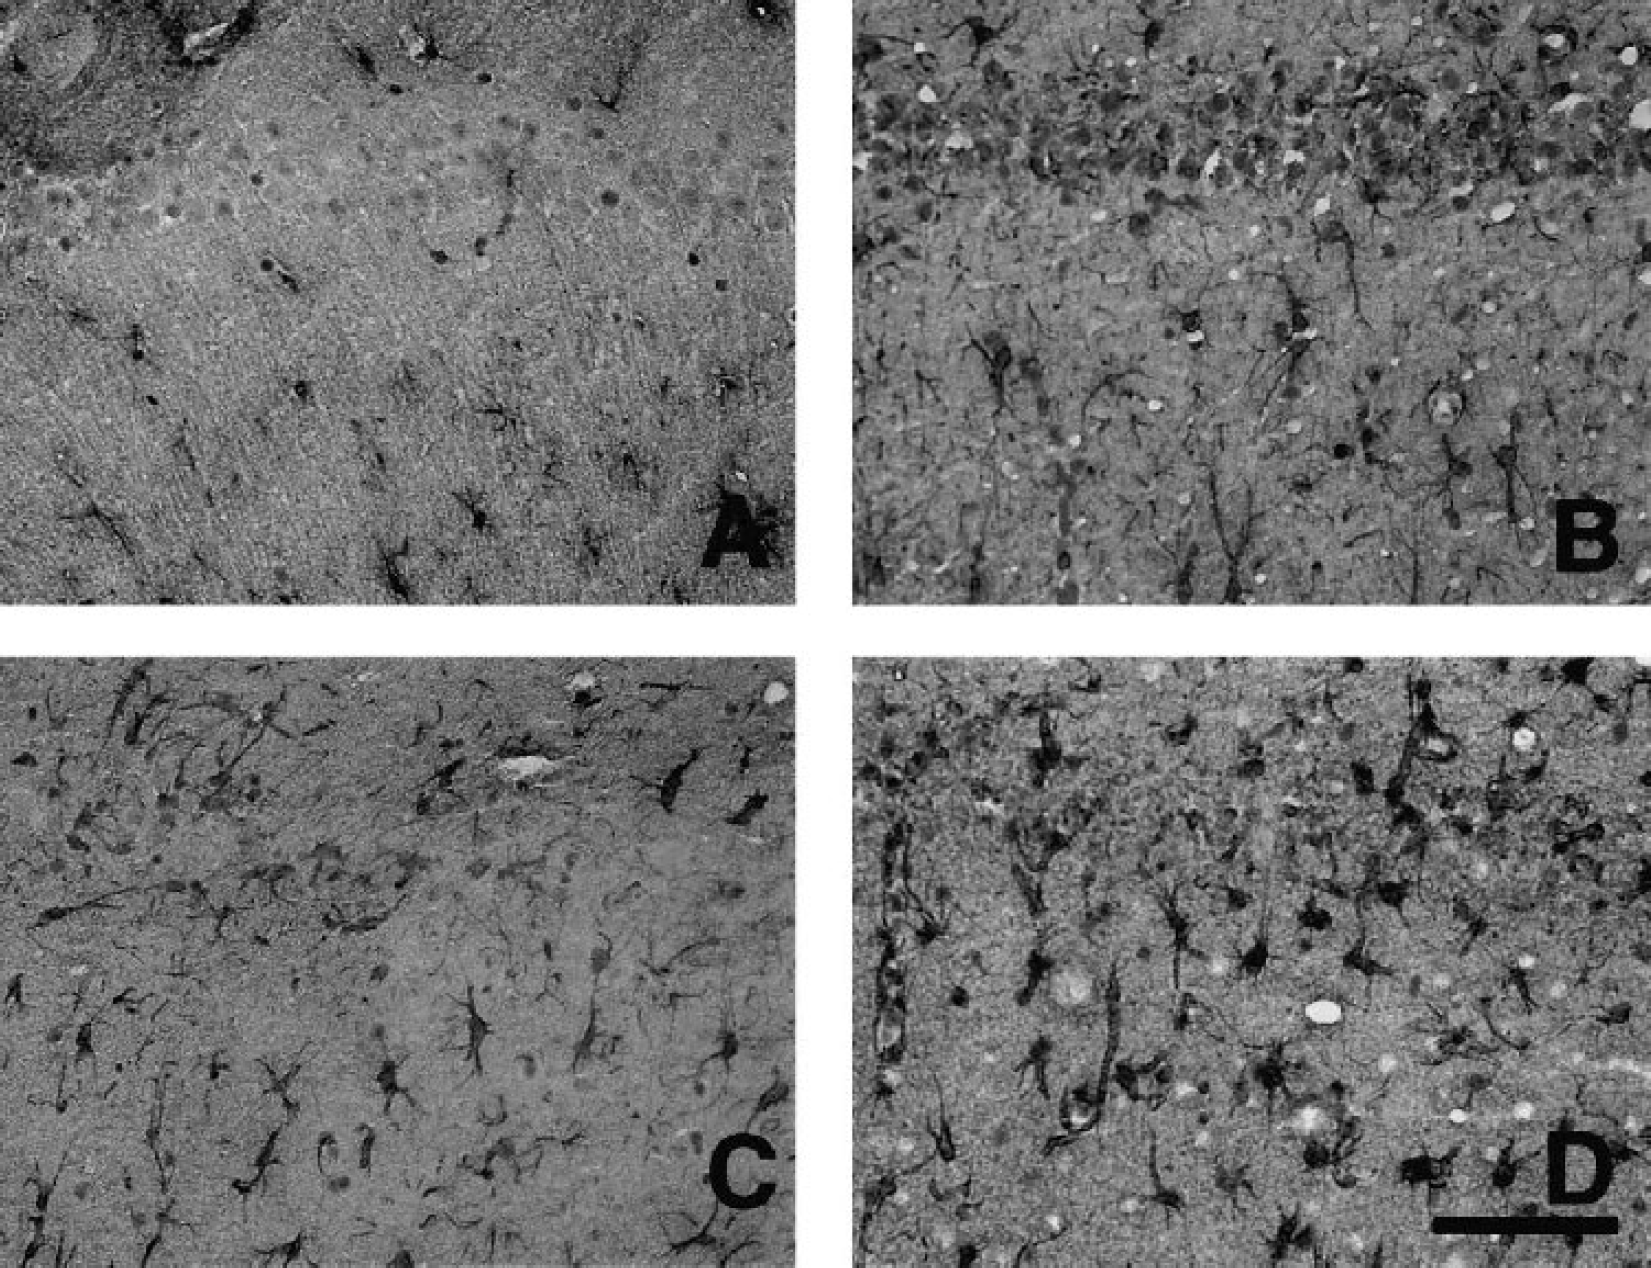
Immunohistochemical reaction to GFAP in the CA1 sector of the hippocampus before (
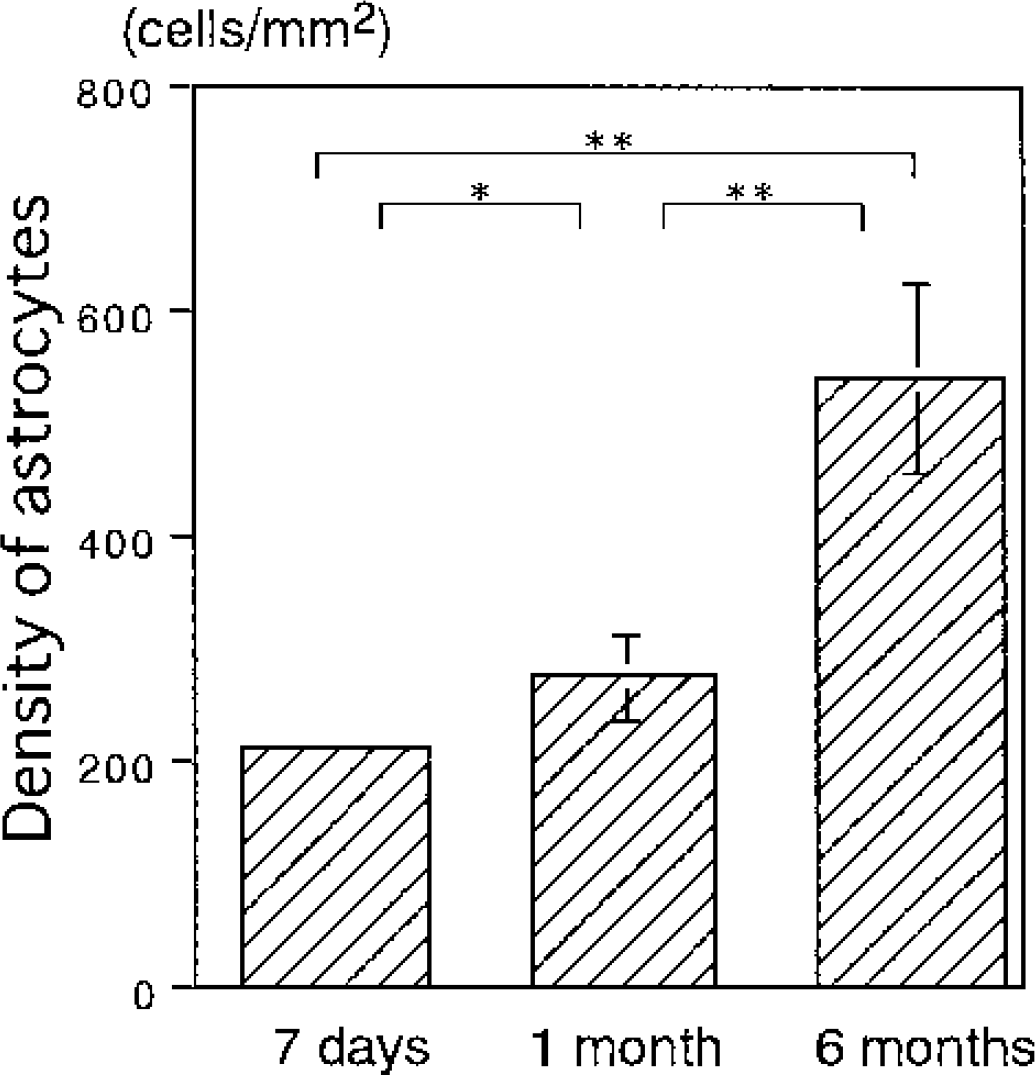
Density of astrocytes in the CA1 sector of the hippocampus after transient forebrain ischemia. The astrocytic density increased gradually during the reperfusion period. Asterisks indicate a significant difference (*P < 0.05, **P < 0.01) between groups.
Regression plots between the total creatine level or NAA/total creatine ratio and astrocytic density in all reperfusion groups are shown in Figure 6. A good linear correlation (P<0.01) was observed between the total creatine level and astrocytic density with y = 26.8 + 0.032 χ (r = 0.819) (Fig. 6A). Consequently, a linear correlation (P < 0.01) was also observed between the NAA/total creatine ratio and astrocytic density with y = 0.833 − 0.091 χ (r = 0.775) (Fig. 6B), because the NAA level was relatively constant. These results indicated that the increment of the astrocytic density reduced the NAA/total creatine ratio by increasing the total creatine level.
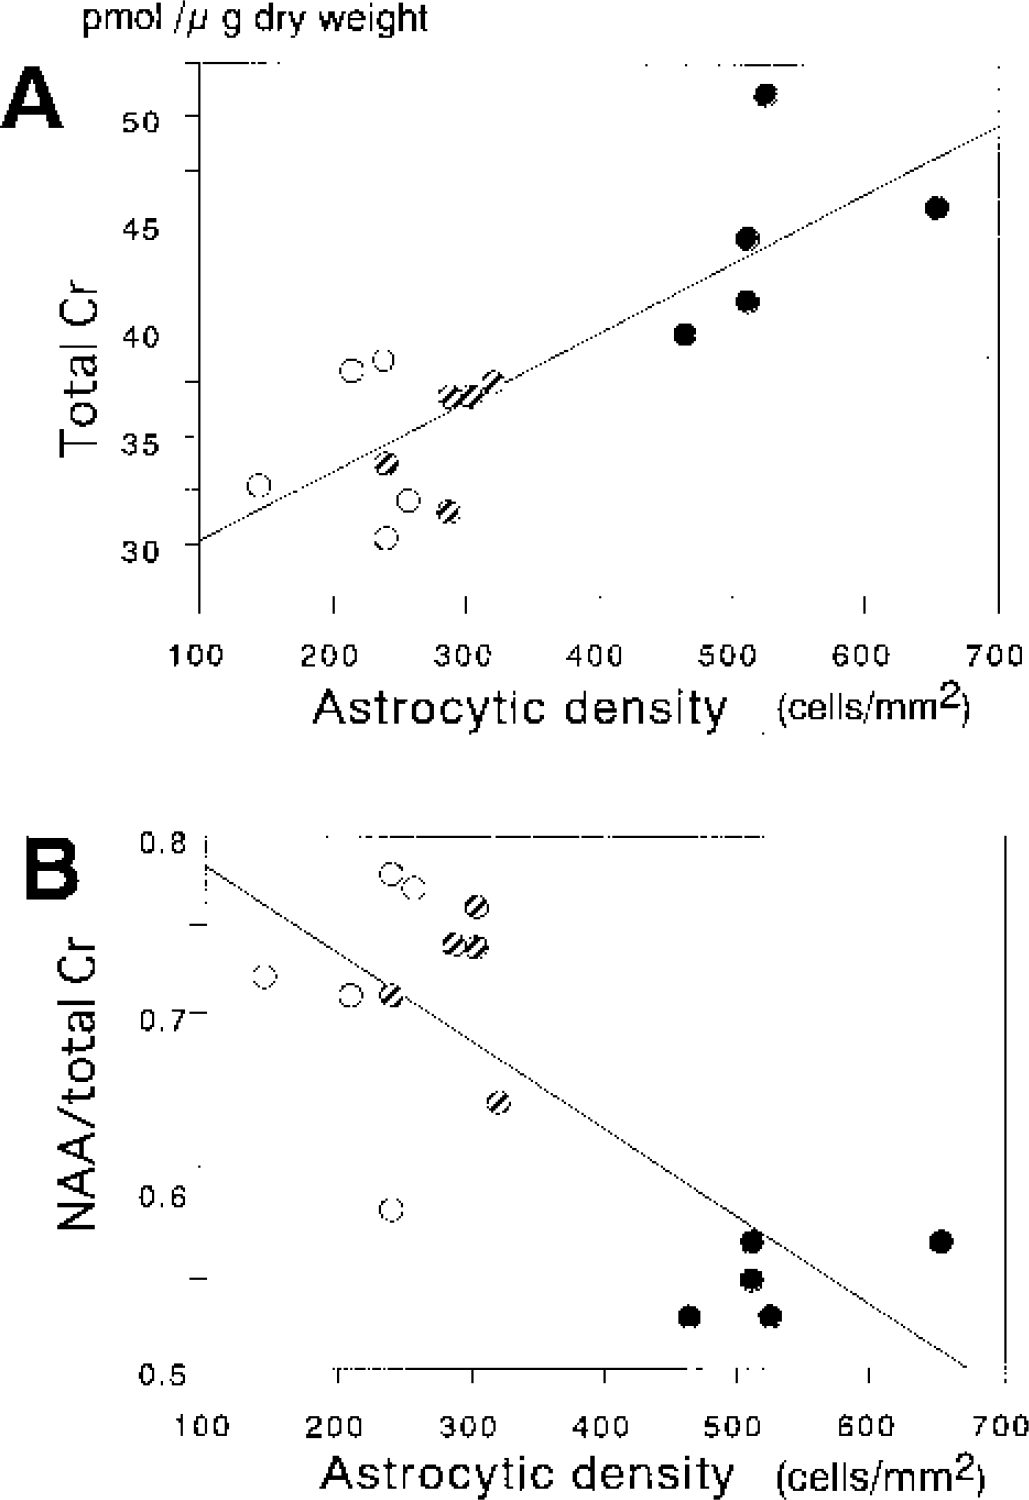
Regression plots between total creatine (
Since reactive astrocytosis is thought to be closely related to the scar formation (Fawcett and Asher, 1999), we also sought correlation between the NAA/total creatine ratio and the width of the CA1 sector reflecting tissue atrophy (Fig. 7A). The width of the CA1 sector (μm) was unchanged after 7 days (699 ± 67) compared to controls (667 ± 67), even though the NAA/total creatine ratio was significantly reduced. After 1 month, the width of the CA1 sector (590 ± 25) became significantly smaller than that of controls (P<0.05) and that after 7 days (P<0.01), but the NAA/total creatine ratio after 1 month was unchanged compared to that after 7 days. The width of the CA1 sector further decreased after 6 months (444 ± 26) compared to that of controls, and those after 7 days and 1 month (p < 0.01, each), along with further reduction of the NAA/total creatine ratio. These results indicated that shrinkage of the CA1 sector developed after reduction of the NAA level and the NAA/total creatine ratio became apparent.
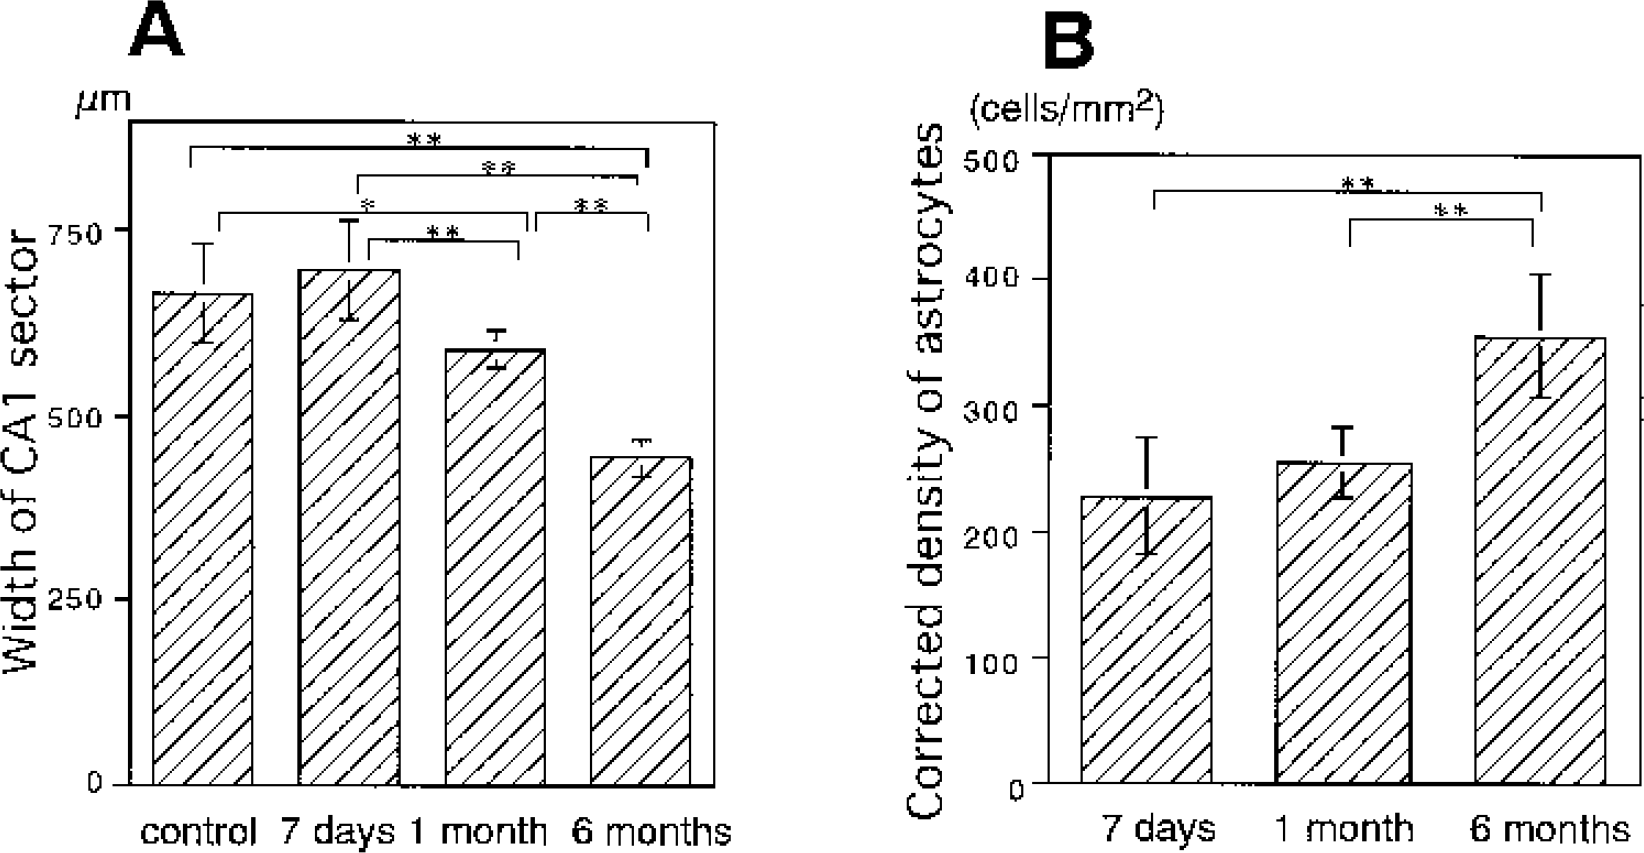
Time course of the width of the CA1 sector of the hippocampus (
To minimize the shrinkage effect from the density of reactive astrocytes, we determined the corrected density of astrocytes (cells/mm2) based on the assumption that CA1 shrinkage occurred linearly in the direction perpendicular to the striatum pyramidale (Kirino, 1993). After 6 months (356 ± 48), the corrected density of astrocytes increased significantly compared to that observed at 7 days (228 ± 46) and 1 month (255 ± 27) (both P<0.01) (Fig. 7B). The profile during reperfusion was still akin to the profile of the total creatine (Fig 3A) and inverse of the NAA/total creatine ratio profile (Fig 3B). Furthermore, a similar correlation was observed between the total creatine level or NAA/total creatine ratio and corrected density as shown in Fig. 6 (data not shown). These results again support the effect of astrocytic reaction on the NAA/total creatine ratio.
DISCUSSION
In the current study, we found that both the NAA level and NAA/total creatine ratio significantly decreased in the vulnerable CA1 sector of the hippocampus after transient cerebral ischemia. The decrease of these parameters was observed at 7 days, the reperfusion period when extensive neuronal damage was already apparent. However, the decrease of the NAA level was constant for 6 months, in good agreement with histologic evidence of no further progression of neuronal damage. We confirmed the reliability of the regional NAA level as a marker of neuronal integrity even after an extended reperfusion period of up to 6 months (Fig. 2). A decrease in the NAA/total creatine ratio was also observed after 7 days, and the ratio slightly but significantly decreased further at 6 months. These results indicate that the NAA/total creatine ratio may reflect neuronal integrity, as was shown in many clinical studies, but may be influenced by the increase in the number of astrocytes after an extended reperfusion period, when tissue atrophy becomes evident.
The present immersion-freezing method for brain tissue preparation could degrade phosphocreatine to creatine (Pontén et al., 1973). However, previous studies (Arai et al., 1986; Nowak et al., 1985; Ueda et al., 1999) and the current study (Fig. 3B) indicate that such changes, if any, are minimal in the hippocampus of the gerbil brain. NAA appears to be a stable substance (Sager et al., 1995). The NAA and total creatine levels and the NAA/total creatine ratio found in the current study are comparable to previously reported NAA (Davies et al., 1995; Jenkins et al., 2000; Koller et al., 1984; Nakano et al., 1998, 2001; Sager et al., 1995, 1999) and total creatine (Jenkins et al., 2000; Nowak et al., 1985; Pontén et al., 1973; Whittingham et al., 1995) levels and NAA/total creatine ratio (Jenkins et al., 2000) assessed using biochemical methods. However, the NAA/total creatine ratio in our control group was smaller than the reported values obtained using MRS (Cendes et al., 1994; Duijin et al., 1992; van Walderveen et al., 1999). Since a previous report indicated that the NAA value with 1H-MRS was higher than that with HPLC (Sager et al., 1999), it is possible that the contribution of other factors such as N-acetyl-aspartyl glutamate to the signal at 2.02 ppm (Davies et al., 1995; Higuchi et al., 1996; Sager et al., 1999), or changes in the mobility and relaxation time (Higuchi et al., 1996; Sager et al., 1999; van Walderveen et al., 1999) of each metabolite could affect MRS measurements. Regional and species differences in these metabolites (Koller et al., 1984; Whittingham et al., 1995) may be other reasons.
The current study showed a decrease in the levels of total creatine and NAA after reperfusion for 7 days and 1 month. As both this study (Fig. 3A) and previous reports on the adenine nucleotides ratio indicate (Arai et al., 1986; Ueda et al., 1999), this decrease was not due to the energy derangement. It is likely that the significant decrease in phosphocreatine and total creatine levels at 7 days observed in the present study reflected neuronal damage, where dispersion of intracellular soluble elements (including creatine kinase) into the extracellular space might have taken place (Tomimoto et al., 1993). However, the extent of this decrease was smaller than that of NAA, and thus the NAA/total creatine ratio was decreased. Since neurons contain NAA, phosphocreatine, and creatine (Brand et al., 1993; Urenjak et al., 1992), the discrepancy in the extent of decrease between NAA and total creatine levels cannot be attributed to neuronal loss alone. Furthermore, the reason for recovery of the total creatine level after 6-month reperfusion cannot be explained by neuronal elements alone.
It is well known that an astrocytic reaction develops in association with neuronal damage (Fawcett and Asher, 1999). Temporal profiles of responses of neurons and astrocytes in the current study were consistent with findings of previous reports dealing with transient global ischemia in gerbils (Bonnekoh et al., 1990; Hatakeyama et al., 1988; Yanagihara, 1990) or rats (Kondo et al., 1995; Lin et al., 1998; Sugawara et al., 2002). Previous reports indicated that astrocytes possess creatine kinase (Yoshimine et al., 1984) and creatine (Urenjak et al., 1992), but not NAA (Brand et al., 1993; Urenjak et al., 1992). The presence of creatine kinase has been demonstrated immunohistochemically in reactive astrocytes using light microscopy (Hatakeyama et al., 1988; Yoshimine et al., 1985) and electron microscopy (Tomimoto et al., 1993). Thus, reactive astrocytes in the area with neuronal loss may increase the total creatine level with little alteration of the NAA level. It is likely that an increase in the total creatine level by reactive astrocytes was incomplete or masked by the decrease in the neuronal element at 7 days and 1 month, but it became apparent at 6 months in the presence of more densely populated hypertrophic astrocytes. Indeed, there was a good linear correlation between the total creatine level and astrocytic density (Fig. 6A), and between the NAA/total creatine ratio and astrocytic density (Fig. 6B). While such an increase in the density of astrocytes seemed to account for the increase in the total creatine level and the decrease in the NAA/total creatine ratio after 6 months, it is also possible that morphologic changes in astrocytes (Fig 4) contributed to changes in the creatine content.
In order to assess the contribution of other cellular components, we also analyzed the temporal profile of microglial response using lectin histochemical analysis (Streit, 1990). As previous reports indicated (Gehrmann et al., 1992; Kondo et al., 1995; Lin et al., 1998; Sugawara et al., 2002), microglial proliferation peaked at 7 days and subsided thereafter (data not shown). Although microglia contain phosphocreatine and creatine (Macouillard-Poulletier de Gannes et al., 1998) and might have contributed to the tissue level of total creatine up to 7 days, their contribution is very limited in later reperfusion periods. We also analyzed oligodendrocytic response using immunohistochemical analysis (Trapp et al., 1988). As shown in a previous report (Sugawara et al., 2002), the number of oligodendrocytes was small in the control hippocampus and proliferation was not clearly observed (data not shown). Although oligodendrocytes have been reported to contain NAA, phosphocreatine, and creatine (Bhakoo and Pearce, 2000), their contribution seemed very limited in the CA1 sector of the hippocampus in control animals and after transient ischemia. Other cells that are recruited during gliosis include meningeal cells, oligodendrocyte precursors, and multipotential progenitor cells (Fawcett and Asher, 1999). Metabolite profiles of these cells (Urenjak et al., 1992) indicate that although they may have some effect, these cells are unlikely to be the major contributors.
Gradual shrinkage of the hippocampal CA1 sector has been observed during reperfusion after transient global ischemia in gerbils (Bonnekoh et al., 1990; Kirino, 1993) and rats (Kondo et al., 1995). We also directly measured the width of the CA1 sector using frozen brain surfaces in the cryostat before preparation of 20-μm sections, but the result was very similar to that obtained with fixed tissue sections (data not shown). The removal of damaged neurons and cell debris by microglia and the repair process by reactive astrocytes seem to be the main factors for tissue shrinkage or glial scar formation (Fawcett and Asher, 1999).
The discrepancy between the extent of decrease in NAA (∼50%) and that of neuronal density (<10%) in the pyramidal layer of CA1 has not been clearly explained. As our regression analyses indicated (Nakano et al., 1998, 2001), there is a constant fraction (30–40%) of NAA remaining, which might correspond to neuronal elements tolerant to ischemia, such as the presynaptic terminals and interneurons (Johansen et al., 1983). Sager et al. (2000) reported such discrepancy after focal ischemia, where 10% to 20% of the control value remained in cortical infarct, but speculated that NAA was trapped in cell debris and periinfarct areas. We believe that the contribution of other cells such as mast cells (Burlina et al., 1997) to the tissue NAA level in ischemia was very limited.
In summary, the current study showed that the NAA level and the NAA/total creatine ratio decreased along with the development of neuronal damage and before overt tissue atrophy became evident in global cerebral ischemia. However, the NAA/total creatine ratio appeared to be influenced by reactive astrocytes, especially in the later reperfusion period.