
Abstract
The authors describe a new ultrasonographic method for analysis of global cerebral blood volume (CBV) and its application under controlled hyperventilation. CBV was determined as the product of global cerebral blood flow volume (CBF) and global cerebral circulation time. CBF was measured by duplex sonography and calculated as the sum of flow volumes in both internal carotid arteries and vertebral arteries. Extracranial Doppler assessed cerebral circulation time by determining the time interval of echo-contrast bolus arrival between internal carotid artery and contralateral internal jugular vein. Forty-four healthy volunteers (mean age 45 ± 19 years, range 20–79 years) were studied. Mean CBV was 77 ± 13 mL. CBV did not correlate with age, end-tidal carbon dioxide level, heart rate, or blood pressure. Hypocapnia was induced in 10 subjects by controlled hyperventilation. Mean reduction of end-tidal carbon dioxide values by 9 ± 1 mm Hg led to a significant increase in cerebral circulation time (6.1 ± 0.9 to 8.4 ± 1.1 second, P < 0.0001) and a significant CBF decrease (742 ± 85 to 526 ± 77 mL/min, P < 0.0001), whereas CBV remained unchanged (75 ± 6 to 73 ± 10 mL).
The main focus of cerebral ultrasonography is the analysis and characterization of cerebral hemodynamics under physiologic and pathologic circumstances. The development of Doppler and duplex ultrasound techniques over the last two decades led to the current routine application of extracranial and transcranial blood flow velocity measurements for the detection of stenoses, vessel occlusions, or hyperemic states. Modern duplex scanners additionally allow to determine the blood volume flow (in milliliters per minute) in an extracranial vessel by combination of mean blood flow velocity and vessel diameter assessments. Applied to both internal carotid arteries (ICA) and vertebral arteries (VA), this technique measures global cerebral blood flow volume (CBF), which has been shown to be a precise and reliable approach (Dörfler et al., 2000; Scheel et al., 2000; Schöning and Scheel, 1996; Schöning et al., 1994). Recently, an ultrasonographic technique for the assessment of a global cerebral circulation time (CCT) in healthy volunteers was described (Hoffmann et al., 2000; Schreiber et al., 2002, 2003). The authors used an echo-contrast bolus tracking method, analyzing the time interval of a Levovist®-bolus arrival between the distal extracranial ICA and the dominant internal jugular vein. Following the central volume principle (Celsis et al. 1985; Hedlund et al. 1965;Meier and Zieler, 1973) an ultrasound derived global cerebral blood volume (CBV) can be calculated as the product of CBF and CCT.
Currently, global CBV can be exclusively analyzed using positron emission tomography (PET) or single-photon emission computed tomography approaches; however, most reports only present regional CBV data. Recently developed magnetic resonance imaging and near-infrared spectroscopy techniques have so far only been able to measure regional CBV values (Table 1). Despite great pathophysiologic interests concerning various clinical conditions like stroke, head trauma, or raised intracranial pressure, none of these methods has been established routinely in clinical practice.
CBV values from the literature obtained by other methods
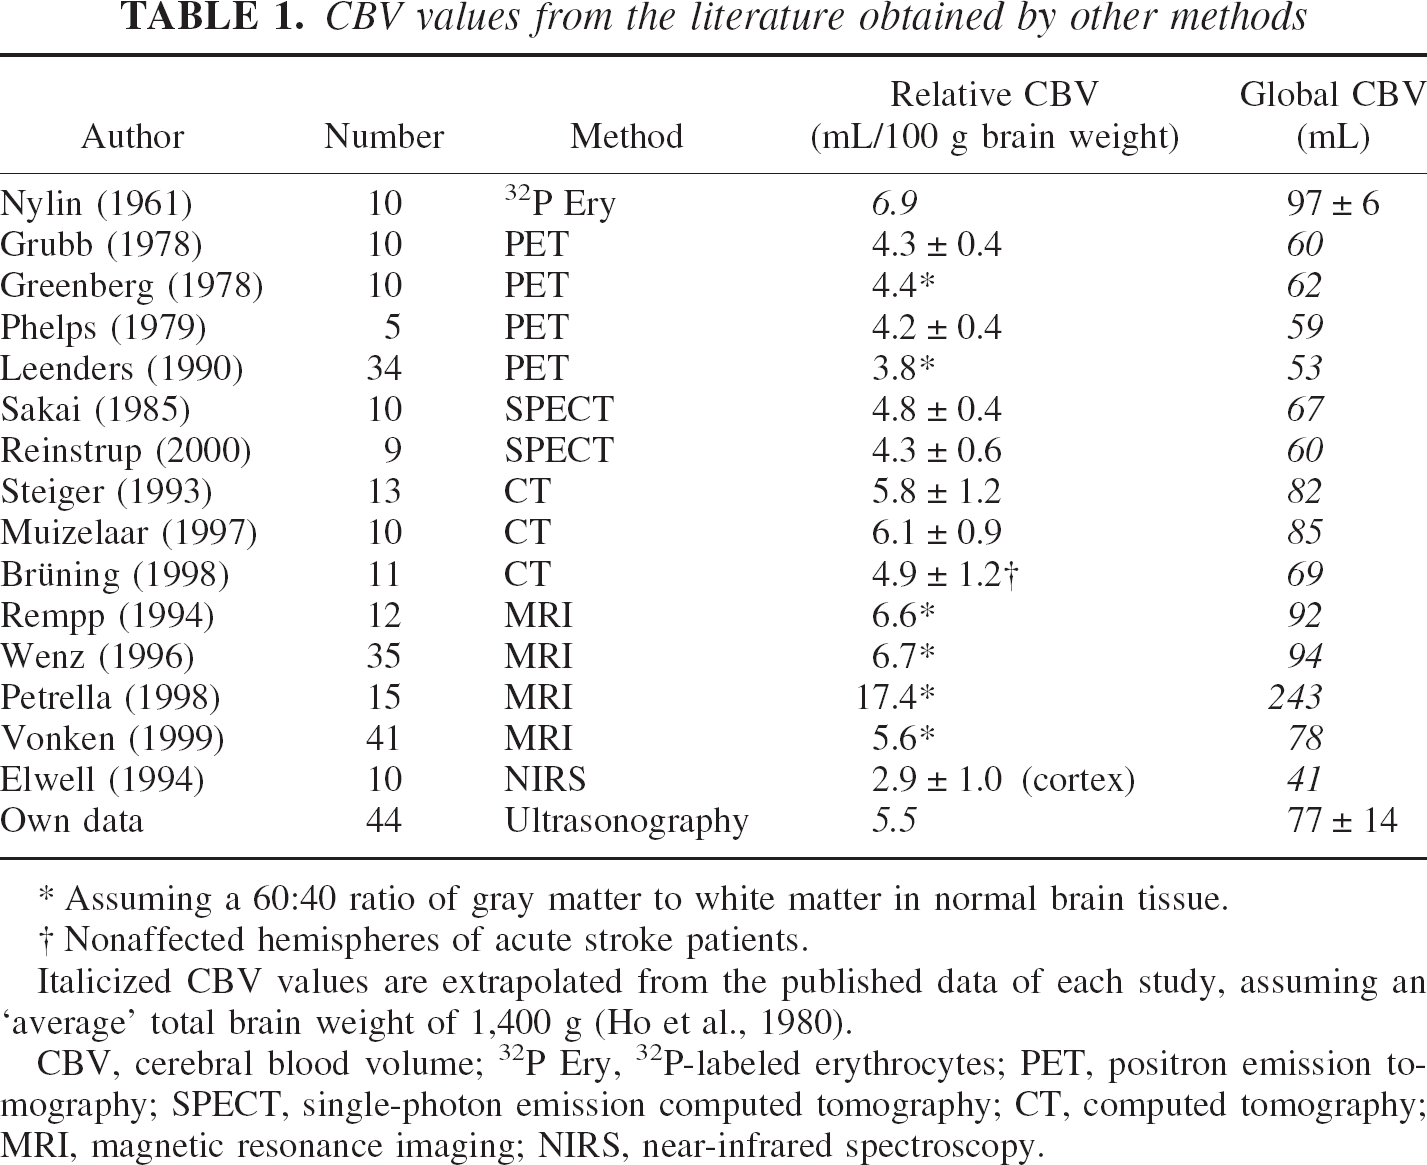
Assuming a 60:40 ratio of gray matter to white matter in normal brain tissue.
Nonaffected hemispheres of acute stroke patients.
Italicized CBV values are extrapolated from the published data of each study, assuming an ‘average’ total brain weight of 1,400 g (Ho et al., 1980).
CBV, cerebral blood volume; 32P Ery, 32P-labeled erythrocytes; PET, positron emission tomography; SPECT, single-photon emission computed tomography; CT, computed tomography; MRI, magnetic resonance imaging; NIRS, near-infrared spectroscopy.
The current study describes a new, simple ultrasonographic approach to CBV analysis based on global CBF and CCT measurements, analyses changes in these values during a hyperventilation paradigm, and compares the results with data gathered using other techniques.
MATERIALS AND METHODS
Study population
Forty-four healthy volunteers (17 women, 27 men) were included in the study and examined by the same investigator. Age was homogeneously distributed between 20 and 79 years (mean ± SD: 45 ± 19 years). All subjects were free of any medication and none had a history of cardiovascular disease or central nervous system disorders. Arteriosclerotic plaques and stenoses of the brain supplying arteries were excluded by extracranial and transcranial Duplex ultrasonography. Informed consent was obtained from all subjects before the examination. The local ethics committee approved the study.
Ultrasound setup
Volunteers were examined in the supine position after a 10-minute rest period. End-tidal carbon dioxide (Etco2) levels, blood pressure, and heart rate were recorded during the procedure. Blood flow volume in the ICA and VA was measured using a 7.0-MHz linear array transducer of a color-coded duplex ultrasound system (Toshiba Powervision 6000, Tokyo, Japan). ICA flow was determined with the head of the subject rotated by 25° to 40° to the opposite side and at least 1.5 cm away from the carotid bifurcation. VA flow was examined in the V2-segment between the transverse vertebral processus C4 and C5 with the head in a 0° to 10° neutral position. Using the integrated software of the duplex machine, the intravascular flow volume of each artery was calculated from the time-averaged velocity over at least four cardiac cycles and the cross-sectional area of the vessel as described previously (Dörfler et al., 2000; Scheel et al., 2000; Schöning et al., 1994). Three consecutive measurements of the cross-sectional area and the angle-corrected time-averaged flow velocity were performed in each vessel, and the mean value of both ICA and VA flow was added to determine the individual global CBF (Fig. 1).
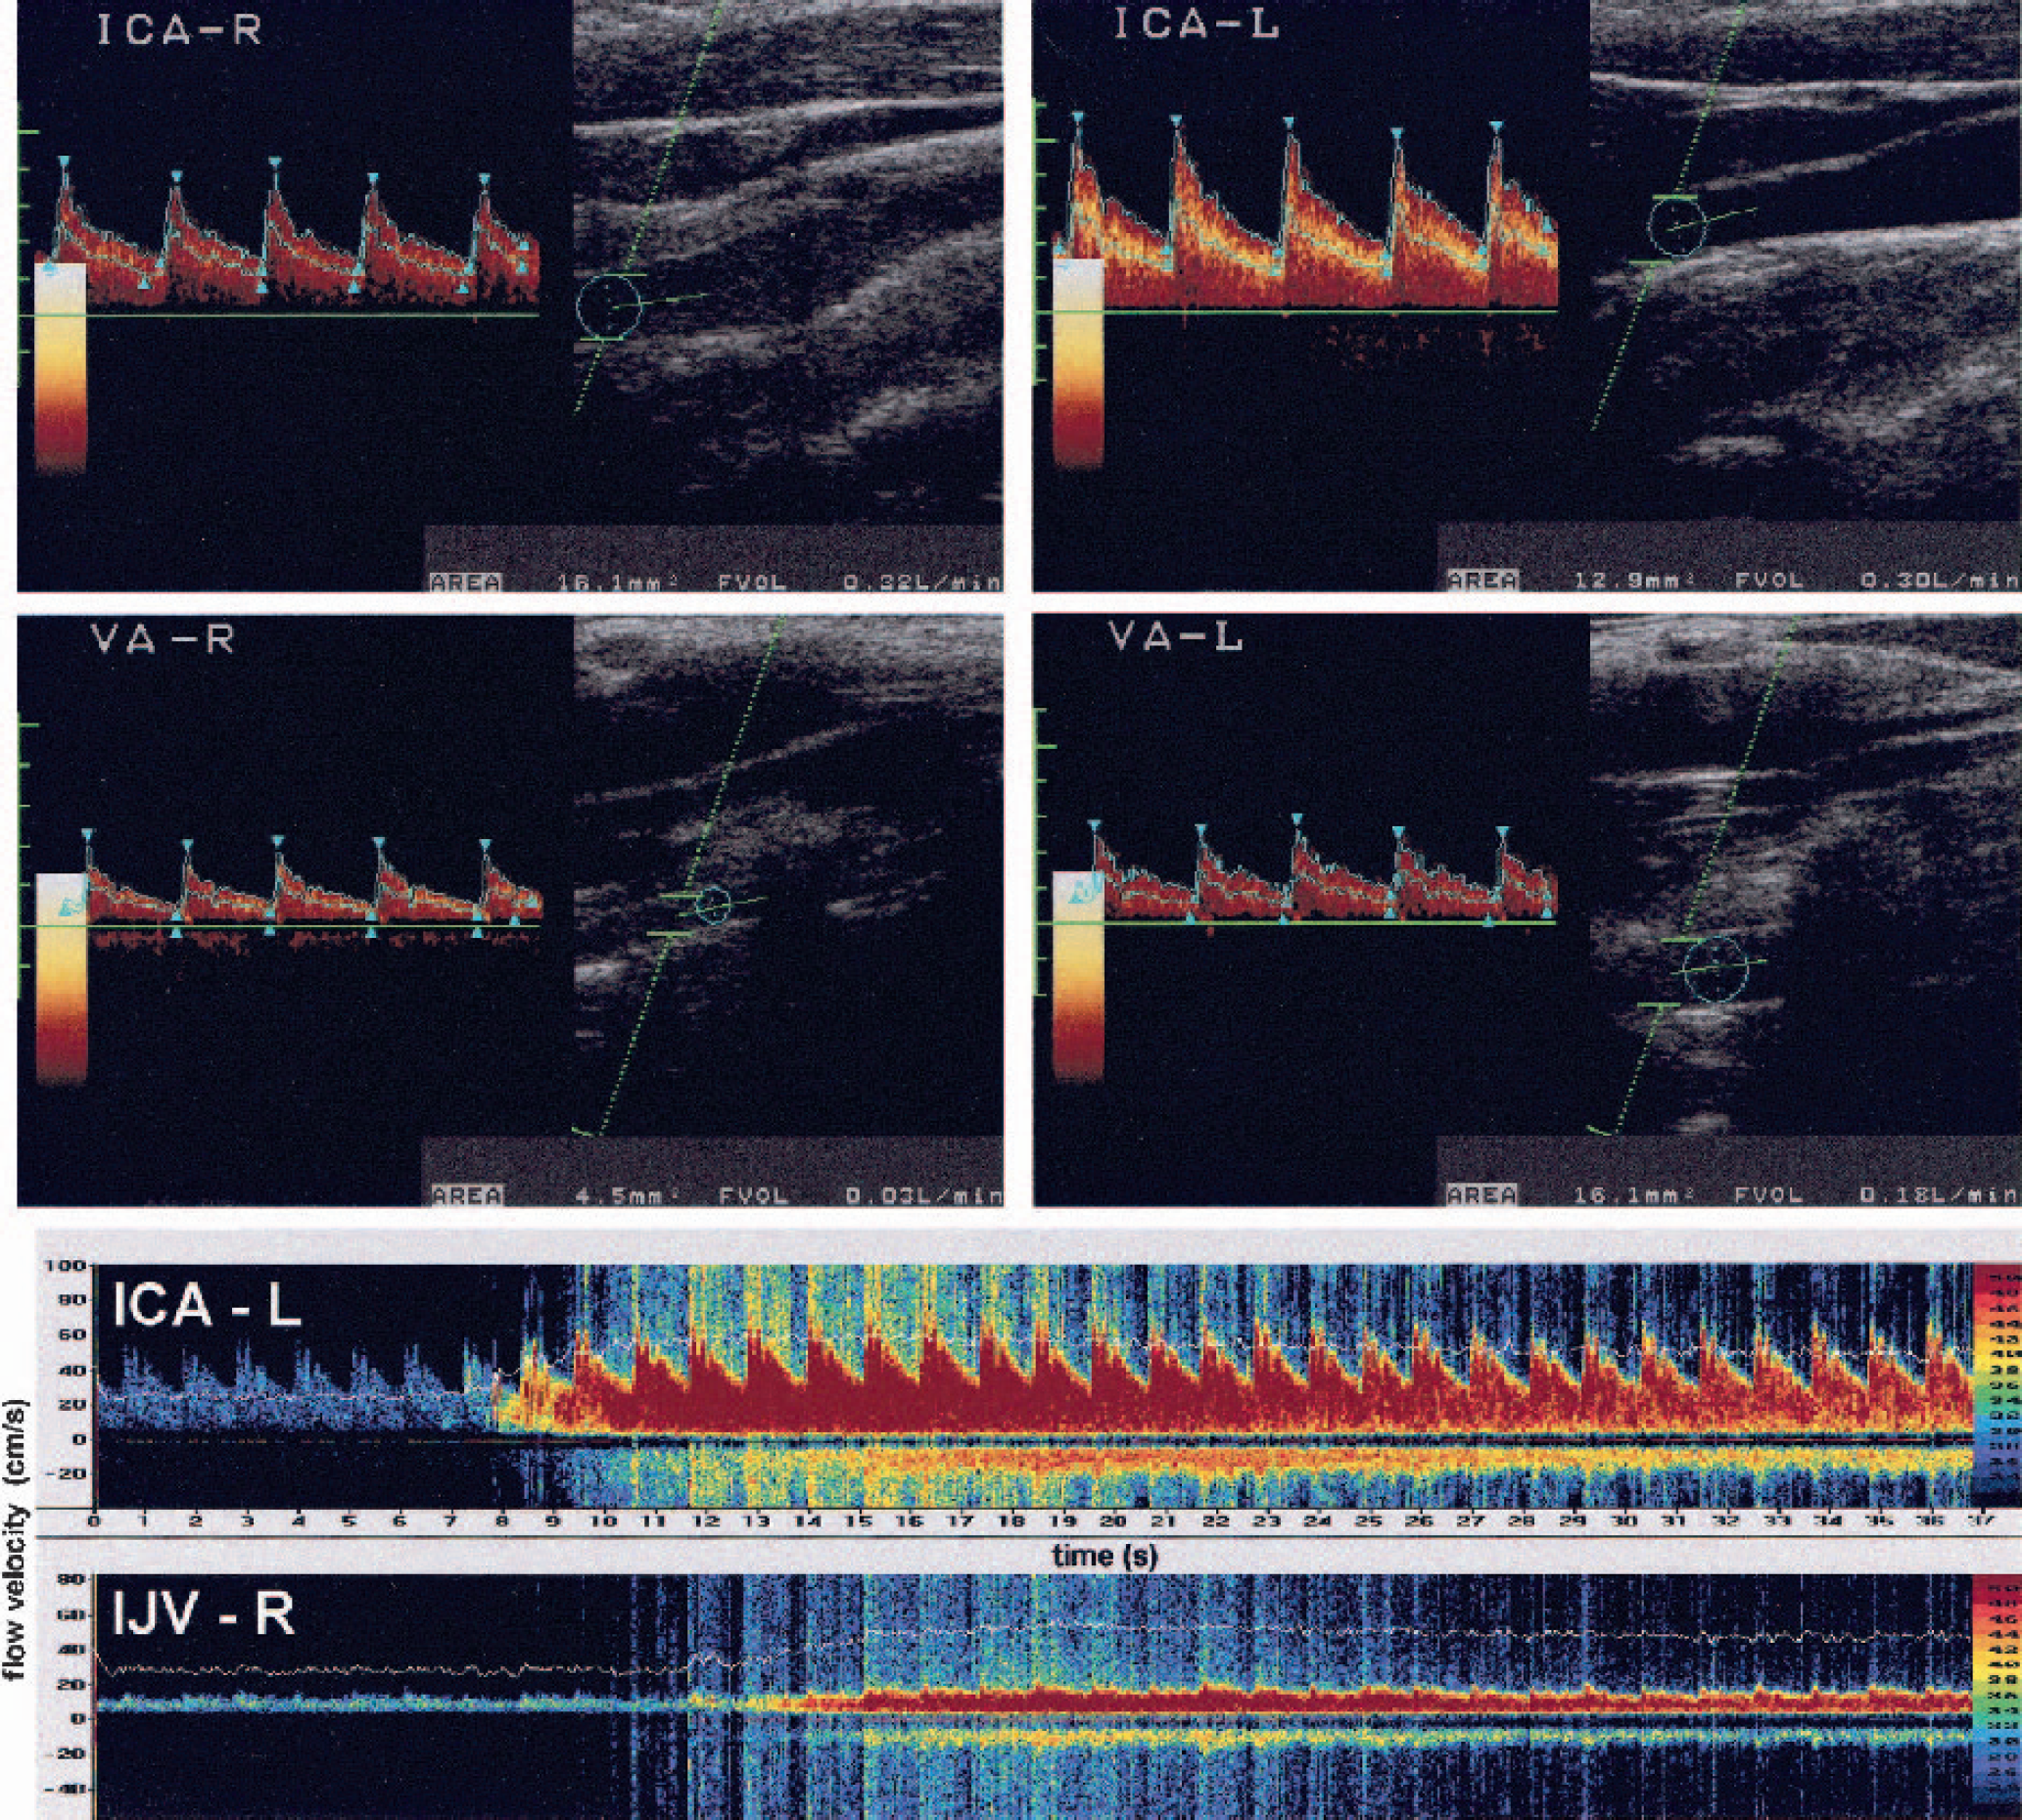
Assessment of global cerebral blood volume in one healthy subject. Top, Blood volume flow in both internal carotid arteries (ICA) and vertebral arteries (VA) are added, yielding a global cerebral blood flow of 830 mL/min. Bottom, Doppler spectra of the right internal jugular vein (IJV, lower spectrum) and the left ICA (upper spectrum). Time delay of contrast bolus arrival yields a global cerebral circulation time of 5.4 seconds. CBV = CBF × CCT = 830 mL/min × 0.09 minutes = 74.7 mL.
CCT analysis was performed immediately after CBF measurements without changing the subject's body position using a previously described Dopplersonographic approach (Schreiber et al., 2002). In brief, two pulsed 2-MHz Doppler probes of a dual-channel Doppler system (TCD X4, DWL, Sipplingen, Germany) were used for continuous extracranial signal detection of the dominant internal jugular vein and the contralateral ICA. Then, a 4-mL Levovist bolus (300 mg/mL, Schering AG, Berlin, Germany) was injected into a cubital vein using an infusion pump with an injection speed of 3 mL/s (Medrad Pulsar, Indianola, PA, U.S.A.). Bolus arrival in the ICA and internal jugular vein was monitored and the time interval between the turning points of a fitted time–intensity curve was defined as the global CCT (corresponding to CCT2 in Schreiber et al., 2002).
The product of CCT (in minutes) and CBF (in milliliters per minute) in each subject was calculated and defined as the ultrasonographic global CBV (in milliliters) (Fig. 1). In addition, a measure of total cerebral blood turnover (CBV/minute) was defined as the quotient of CBF and CBV. Repeated measurements were performed in eight subjects after 2 to 4 weeks and in four subjects after 1 hour.
In 10 additional subjects (three women, seven men; mean ± SD age: 29.0 ± 4.9 years), ultrasonographic testing was performed two times, at rest and during controlled hyperventilation. Etco2 was monitored continuously with an infrared analyser (Datex SC-103, Hoyer, Bremen, Germany). Individual Pco2 values were lowered to a steady-state level, the extent depending on the individual ability to hyperventilate.
Statistical evaluation
Calculations were performed using the SPSS software for Windows (SPSS 10, Chicago, IL, U.S.A.). The Pearson correlation coefficient was used to analyze the correlation among the three determined ultrasound parameters and age, Etco2 values, blood pressure, and heart rate. Differences between normoventilation and hyperventilation studies were tested using two-tailed, paired t-tests. A P value < 0.05 was considered to represent a significant difference.
RESULTS
Measurements were successful in all subjects. The time required for the entire procedure ranged from 30 to 60 minutes. Individual CBF values ranged from 563 to 1,004 mL/min (mean ± SD: 733 ± 99 mL/min) and CCT values from 4.4 to 9.3 seconds (mean ± SD: 6.4 ± 1.2 seconds). Mean Etco2 was 40 ± 5 mm Hg (range: 28–50 mm Hg). The subsequently calculated ultrasonographic CBV ranged from 45 to 108 mL (mean ± SD: 77 ± 13 mL). CBF was negatively correlated with age (r = −0.43, P = 0.004, Fig. 2) but not with Etco2, heart rate, or blood pressure (data not shown), while CCT and CBV was not correlated with age (Fig. 2) or any of the other parameters (data not shown). The total turnover of CBV ranged from 6.5/min to 13.6/min (mean ± SD: 9.7 ± 1.8/min).
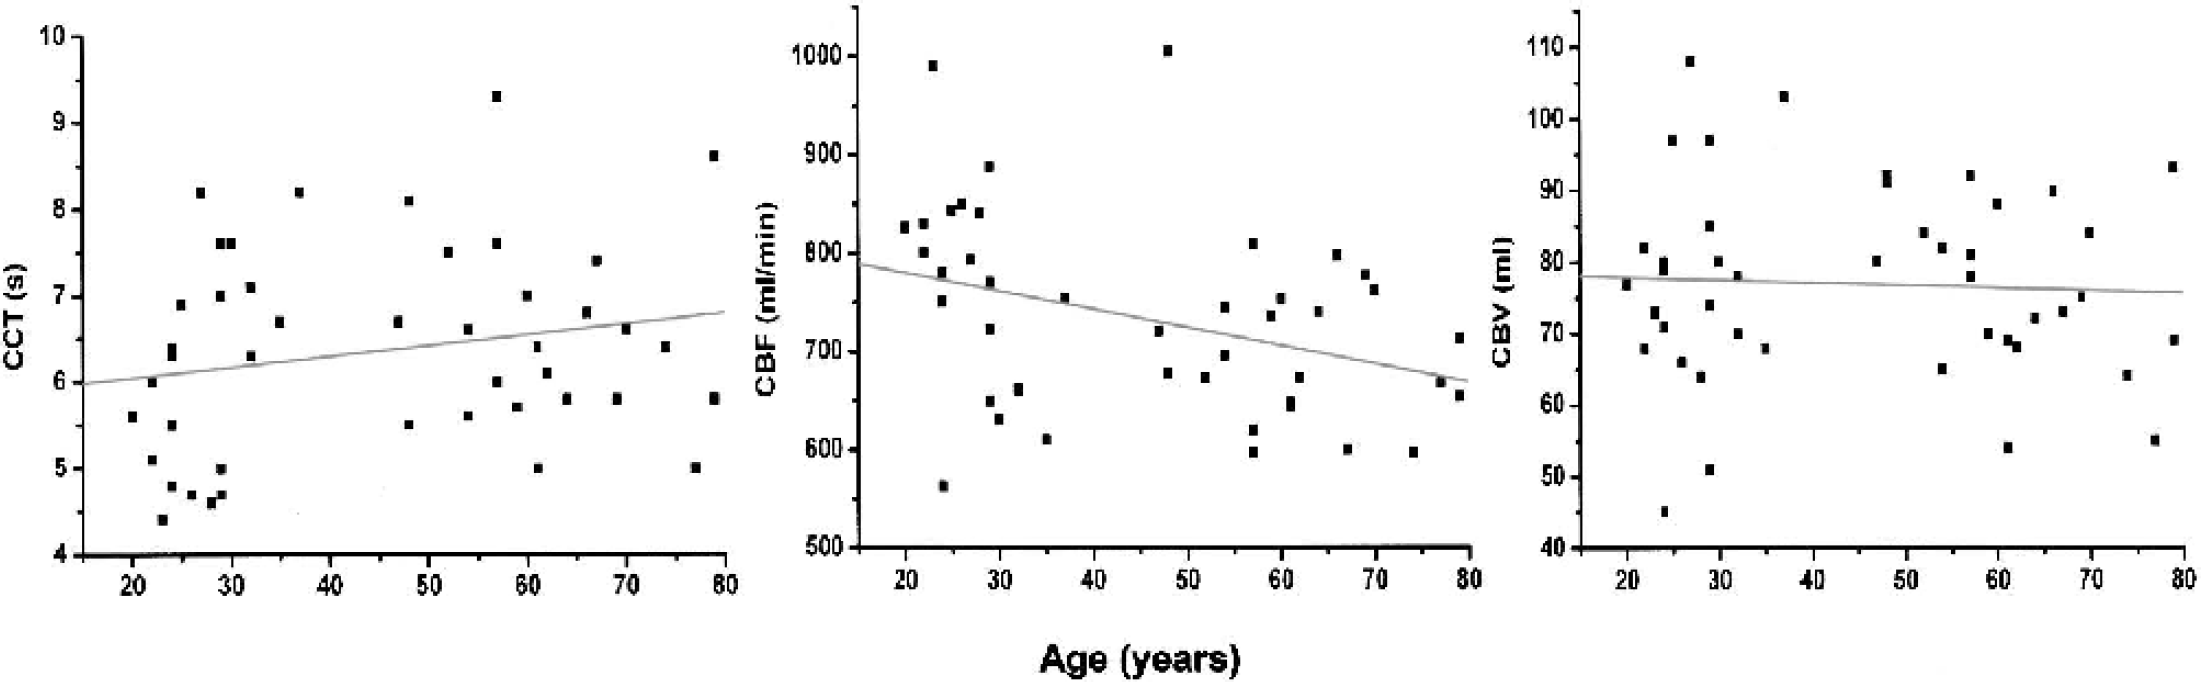
Age dependence of global cerebral circulation time (CCT) (r = 0.24, P = 0.12), global cerebral blood flow (CBF) (r = −0.43, P = 0.004), and global cerebral blood volume (CBV) (r = −0.03, P = 0.83) in 44 healthy volunteers (Spearman rank correlation).
Long-term repeated measurements in eight subjects (Etco2 variability between testings < 2 mm Hg) showed an initial mean CBF, CCT, and CBV of 741 ± 89 mL/min, 6.8 ± 1.1 seconds, and 83 ± 11 mL. Follow-up values were 746 ± 74 mL/min, 6.1 ± 0.8 seconds, and 75 ± 9 mL, resulting in mean differences of 66 ± 55 mL/min, 0.9 ± 0.6 seconds, and 12 ± 10 mL, respectively. Short-term repeated measurements in four subjects showed an initial mean CBF, CCT, and CBV of 702 ± 69 mL/min, 6.5 ± 0.8 seconds, and 77 ± 13 mL. Follow-up values were 710 ± 80 mL/min, 7.0 ± 1.8 seconds, and 82 ± 21 mL, resulting in mean differences of 9 ± 12 mL/min, 0.9 ± 0.9 seconds, and 11 ± 9 mL, respectively.
Hyperventilation led to a mean Etco2 decrease of 9 ± 1 mm Hg (range: 7–11 mm Hg). Mean CCT increased significantly from 6.1 ± 0.9 seconds to 8.4 ± 1.1 second (P < 0.0001) and CBF decreased from 742 ± 85 to 526 ± 77 mL/min (P < 0.0001), but mean CBV values were not significantly different (75 ± 6 vs. 73 ± 10 mL, P = 0.47, Fig. 3). The resulting carbon dioxide (CO2) reactivities (in 1/mm Hg) for CCT, CBF, and CBV were +0.26 seconds (+4.0%), −24 mL/min (−3.3%), and −0.2 mL (−0.3%), respectively. The total cerebral blood turnover decreased significantly during hypocapnia from 10.0 ± 1.5/min to 7.3 ± 0.9/min (P < 0.0001).
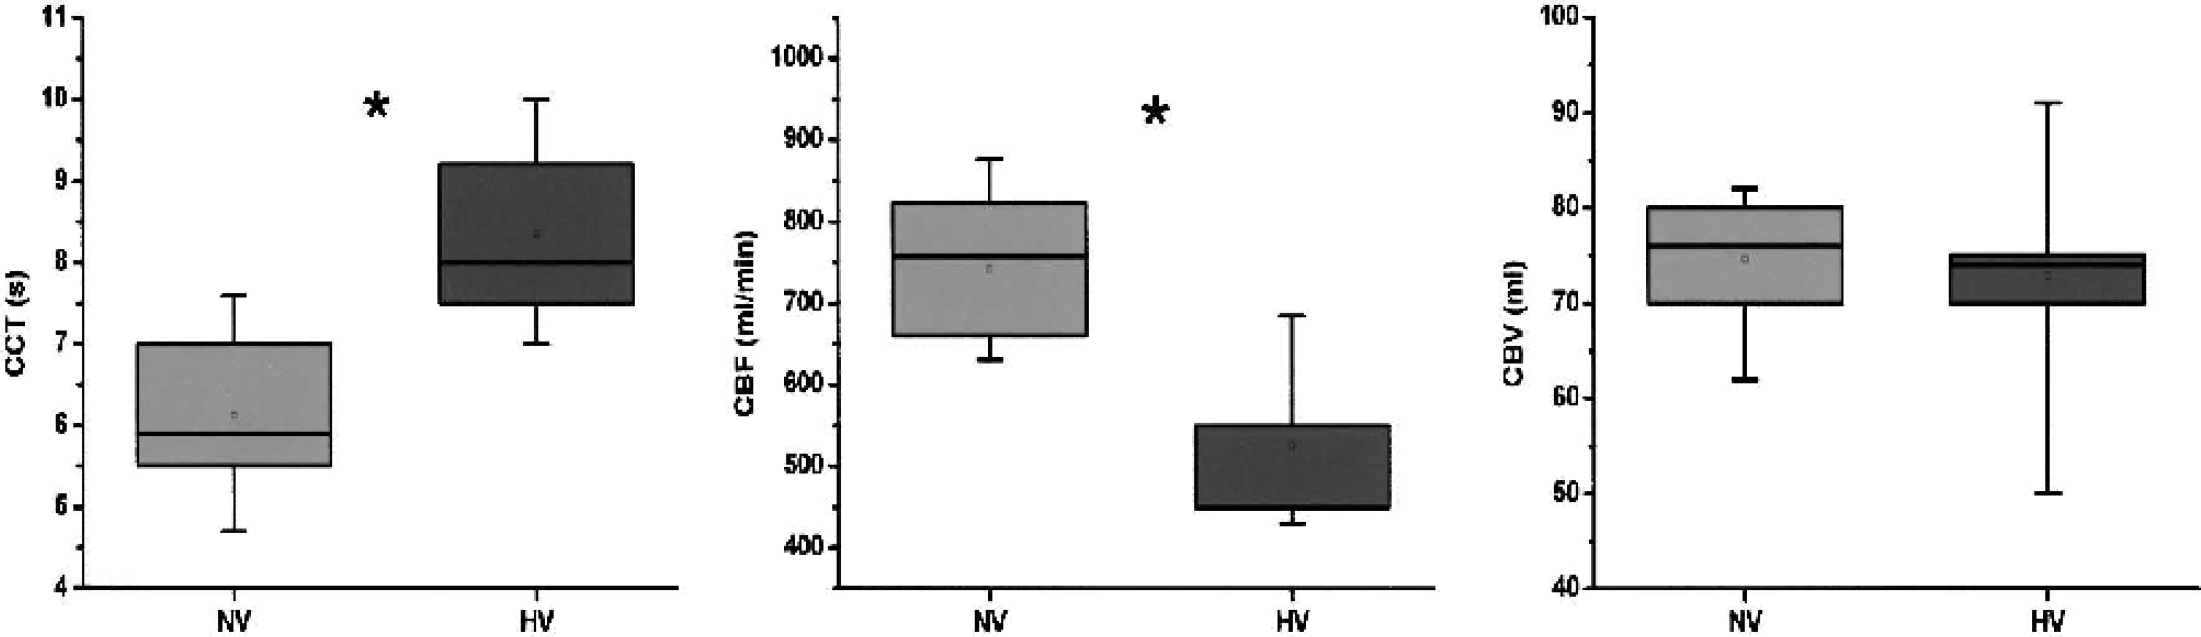
Box plots showing data during normoventilation (NV) and hyperventilation (HV) in 10 subjects. Mean ± SD cerebral circulation time (CCT, in seconds) was 6.1 ± 0.9 for NV (median: 5.9, quartiles: 5.5 and 7.0) and 8.4 ± 1.1 (median: 7.9, quartiles: 7.5 and 9.3) for HV. Mean ± SD cerebral blood flow (CBF, in milliliters per minute) was 742 ± 85 (median: 754, quartiles: 659 and 824) for NV and 526 ± 77 (median: 530, quartiles: 450 and 560) for HV. Mean ± SD cerebral blood volume (CBV, in milliliters) was 75 ± 6 (median: 75, quartiles: 70 and 80) for NV and 73 ± 10 (median: 73, quartiles: 70 and 76) for HV. Asterisk indicates a significant difference (P < 0.0001, two-tailed paired t-test).
DISCUSSION
The current study demonstrates a new, ultrasonographic bedside approach for global CBV analysis. The method is based on the central volume principle, which states that CBV can be calculated as the product of the total cerebral blood flow and the time needed for the cerebral blood passage (Celsis et al. 1985; Hedlund et al. 1965;Meier and Zieler, 1973). The first human in vivo approaches to use this principle were reported by Nylin et al. in 1961, who used intraarterial and intravenously injected P32-labeled erythrocytes to determine cerebral blood flow and cerebral circulation time in volunteers. Mean calculated global CBV in their subjects was 97 ± 6 mL. Since then a variety of studies applying different techniques have been published, mainly reporting regional CBV data (Table 1). The cerebral distribution of radioactive-labeled blood has been used for direct CBV assessment in PET and single-photon emission computed tomography studies. Dynamic contrast computed tomography and dynamic-contrast magnetic resonance imaging use a bolus-tracking technique to estimate regional CBV from the time–density curves of a contrast bolus within a region of interest compared to a vascular reference (Brüning et al., 1998; Petrella et al., 1998; Rempp et al., 1994; Steiger et al., 1993; Vonken et al., 1999; Wenz et al., 1996; Wintermark et al., 2001). Near-infrared spectroscopy can detect regional cortical CBV data analyzing the oxyhemoglobin and deoxyhemoglobin changes at rest during a small change in blood oxygen saturation (Elwell et al., 1994).
Our ultrasonographic approach allows the calculation of a global CBV based on global CBF and CCT measurements. Both techniques have previously beendescribed and evaluated. Duplexsonographic CBF measurements have been shown to deliver reliable and reproducible flow values well within the range of reported PET data (Dörfler et al., 2000; Scheel et al. 2000; Schöning and Scheel, 1996; Schöning et al. 1994). Reported mean CBF in the ultrasound studies ranged from 567 ± 125 (Dörfler et al., 2000) to 727 ± 102 mL/min (Scheel et al., 2000) depending on the investigated age groups, while we found a mean CBF of 733 ± 99 mL/min. Ultrasonographic measurement of global CCT has recently been demonstrated in healthy volunteers (Hoffmann et al., 2000; Schreiber et al., 2002, 2003). Despite different technical approaches used, mean CCT values were within a narrow range of 5.6 ± 1.7 to 7.0 ± 1.3 seconds (own data: 6.3 ± 1.2 seconds) for Dopplersonographic and 7.5 ± 1.1 second for duplexsonographic techniques, corresponding well with historic angiographically determined CCTs of 4.9 to 5.6 seconds (Gilroy et al., 1963). In our study, the approach reported by Schreiber et al. (2002) was used. The authors described three different mathematical CCT definitions, of which the CCT2, defined as the time interval between the turning points of the ICA and internal jugular vein time–intensity curves, yielded the lowest variabilities and best reproducibility results (Schreiber et al., 2002). Therefore, this definition was used for the presented CBV calculation. Following the central volume principle, individual CBV values can now be calculated, if CBF and CCT analysis are performed directly one after another without changing external study conditions to assure an unchanged hemodynamic status. The resulting ultrasonographically derived global CBV values of 77 ± 14 mL (or approximately 5.5 mL/100 g brain weight, assuming a total brain weight of 1,400 g) are in very good accordance with previous data (Table 1), supporting the applicability of our approach. Considering the addition of reproducibility variations from two ultrasound tests—the CBF and CCT analysis—the presented mean CBV variations of 12 ± 10 mL for long-term and 11 ± 9 mL for short-term repeated measurements are rather low. To our knowledge, the literature lacks comparable reproducibility studies for other techniques. Analyzing different studies that use the same technique, PET and single-photon emission computed tomography investigations seem to yield the lowest discrepancies of less than 10 mL global CBV. However, values gained by noninvasive magnetic resonance imaging studies vary by more than 100% in magnitude, depending on the applied magnetic resonance sequences and mathematical models (Table 1).
For further evaluation of the robustness of our proposed method and to test the effect on global CBV, 10 additional subjects were studied under hypocapnia, known to significantly increase CCT and decrease CBF and CBV (Fortune et al., 1995; Reinstrup et al., 2001). The observed CCT increase of 0.26 s/mm Hg (4%/mm Hg) in our study corresponds well with the previously reported ultrasonographically derived CO2 reactivity of 0.3 s/mm Hg (5%/mm Hg) (Schreiber et al., 2002). Duplexsonographic assessments of hypocapnia-induced CBF changes were reported by Fortune et al. (1995), who analyzed the blood volume flow of one ICA as a measure of global CBF. A mean Etco2 reduction of 15 mm Hg led to a mean flow decrease of 107 mL/min (2%/mm Hg). Similar ranges of 1.9%/mm Hg to 3.5%/mm Hg were shown by dynamic CT and PET studies (Bednarczyk et al., 1990; Ito et al., 2002; Reinstrup et al., 1994) while our study found a CO2 reactivity of 3.2%/mm Hg. CBV in our study did not change significantly during hypocapnia. However, the trend analysis of our data suggests a CO2 reactivity of 0.4%/mm Hg. Few data exist on CO2-dependent changes in global CBV in healthy human subjects. Fortune et al. (1995) reported a CBV reduction of 0.2% per mm Hg using a scintigraphic method that detects 99m-Tc–labeled red blood cells, and Reinstrup et al. (2001) found a significant relative CBV decrease of 0.9%/mm Hg. These findings suggest that the effective magnitude of global CBV change that can be achieved by a 10-mm Hg reduction in CO2 reactivity is very small, at least under physiologic circumstances. Considering the common policy to hyperventilate patients with raised intracranial pressure for CBV reduction, e.g. in patients with severe head trauma or intracranial hemorrhage, it would be of great interest to know if CBF and CBV react to the same extend as under physiological conditions.
Neither of the up-to-date reported ‘classical’ techniques can be used as a routine method as they are not easily available, expensive, time consuming, potentially hazardous, or require the patient to be frequently moved, which might be difficult for those who need intensive care. In contrast, our proposed simple method has the potential for routine application, and can be used to directly monitor treatment effects in the previously mentioned clinical conditions at the patient's bedside.
However, some potential limitations of our approach have to be considered. Our technique only allows for the calculation of global CBV data, and it is well known that CBV is not homogeneously distributed within the brain (Reinstrup et al., 2001; Smith et al., 2000). As small regional changes of CBV may not be detectable, it is likely that a sensible application of the method is possible only in conditions that globally affect the cerebral hemodynamics. The technique can only be applied after exclusion of an arteriovenous malformation, as an arteriovenous shunt and the resulting shortened CCT would lead to a ‘false’ reduction in the calculated CBV value. Likewise, limited extracranial insonation conditions (e.g., extensive atherosclerotic plaque) lead to unreliable estimations of global CBF. Considering the potential application for serial investigations and the presentedreproducibility studies, the method would benefit from a reduced intraindividual variability or will probably fail to detect small CBV changes.
In conclusion, we describe a new, simple ultrasonographic approach to calculate global CBV in healthy volunteers under normocapnia and hypocapnia. The presented values are well within the expected range if compared with data from previously published technical approaches. The proposed method has the potential to be applied for the presentation of physiologic data as well as for bedside study of various clinical conditions that cause globally altered cerebral hemodynamics.