
Abstract
Markov chain Monte Carlo simulation was used in a reanalysis of the longitudinal data obtained by Harris et al. (J Cereb Blood Flow Metab 20:28–36) in a study of the direct current (DC) potential and apparent diffusion coefficient (ADC) responses to focal ischemia. The main purpose was to provide a formal analysis of the temporal relationship between the ADC and DC responses, to explore the possible involvement of a common latent (driving) process. A Bayesian nonlinear hierarchical random coefficients model was adopted. DC and ADC transition parameter posterior probability distributions were generated using three parallel Markov chains created using the Metropolis algorithm. Particular attention was paid to the within-subject differences between the DC and ADC time course characteristics. The results show that the DC response is biphasic, whereas the ADC exhibits monophasic behavior, and that the two DC components are each distinguishable from the ADC response in their time dependencies. The DC and ADC changes are not, therefore, driven by a common latent process. This work demonstrates a general analytical approach to the multivariate, longitudinal data-processing problem that commonly arises in stroke and other biomedical research.
After the demonstration that diffusion-weighted (DW) imaging can be used to detect an ischemic lesion at an early state in its development (Moseley et al., 1990), this imaging modality has become established as a method for investigating central nervous system (CNS) disease (van Bruggen et al., 1994; King et al., 1997). Although DW imaging is used extensively in both clinical diagnosis and experimental stroke research, a consensus view of the processes involved in the DW image sensitivity to stroke remains elusive, despite more than a decade of research. Numerous investigations into the extracellular DC potential response to ischemia have also been performed, and its temporal behavior is well documented. Furthermore, the cellular electrophysiology of the ischemic response is well established. In this article, we examine the temporal relationship between the extracellular direct current (DC) potential and apparent diffusion coefficient (ADC) changes that occur during an ischemic episode, since this is expected to lead to an improved understanding of the biophysics that underlies the ADC response.
CEREBRAL ISCHEMIA BIOPHYSICS
Several hypotheses have been advanced to account for the appearance of ischemic lesions in DW images. Latour et al. (1994b) and Norris et al. (1994) both suggested, for example, that DW image changes occur as a result of reduced extracellular water diffusivity. This is attributed to a reduction in extracellular volume driven, in turn, by the cell swelling that occurs when water moves into the intracellular space. [Hoehn-Berlage et al. (1995) and references therein document the extracellular space changes that occur in ischemia.] An increase in the tortuosity of the extracellular space has also been implicated (Latour et al., 1994a; van der Toorn et al., 1996). [Helmer et al. (1995) provide an introduction to tortuosity and related measures in biologic systems.] It should be noted, however, that Krizaj et al. (1996) have examined the sensitivity of water compartmentation and extracellular tortuosity to changes in osmolarity and have shown that the resulting changes in volume fraction are not accompanied by substantial changes in tortuosity (see Fig. 6 in Krizaj et al., 1996). They argue, therefore, that a change in tortuosity may not be pivotal in the DW imaging response to ischemia, and suggest that the extraand intracellular volume changes are themselves the primary driving force, except under conditions of extreme tortuosity. Similarly, Anderson et al. (1996) have argued that extracellular volume changes are a principal cause of the observed shifts in ADC. A decrease in extracellular volume is known to occur in anoxic depolarization (see, for example, Hansen and Olson, 1980, and Hansen, 1985). Alternative explanations for diffusion changes in ischemia include a reduction in cell membrane permeability (Helpern et al., 1992) and a decrease in intracellular diffusivity, the latter of which is based on intracellular metabolite (Wick et al., 1995) and 133Cs diffusion measurements (Neil et al., 1996). A tight coupling between the ADC response and ATP depletion has been suggested (Busza et al., 1992).
Clearly, a general theory for the DW image changes that occur in stroke remains to be established. A key to making progress towards a fuller understanding of the biophysical chemistry underlying the DW image response is the acquisition of more detailed information concerning the temporal relationship between the diffusion changes and the primary biophysical and biochemical events. Numerous multivariate longitudinal studies have been performed, but relatively little progress has been made. In part, this might be due to limitations in the statistical methods that have been used. In particular, there has been a tendency to ignore the fundamentally longitudinal nature of the problem. Thus, many researchers have focused on the relationship between two or more key variables but have not always performed a rigorous analysis of the temporal relationship between them. Furthermore, mean statistics do not provide a complete characterization of the temporal response, since important information is contained in the between-subject differences in temporal behavior.
STATISTICAL METHODS FOR LONGITUDINAL DATA ANALYSIS
A huge literature now exists on the statistical analysis of longitudinal data (see, for example, Hand and Crowder, 1996), but these methods have been somewhat ignored by the magnetic resonance (MR) research community. The seminal paper of Laird and Ware (1982) marked the beginning of a period of intense research activity during which major advances have been made. Mixed model regression provides a framework for modeling longitudinal data. A considerable degree of model flexibility is possible, including a wide range of error structures (correlated errors, autoregressive error structure, etc.). Random coefficients can be included to take account of between-subject variability in the response. The latter is particularly important in the present analysis since a formal characterization of the temporal relationship among the key events within individual subjects is central to understanding the pathophysiology of cerebral ischemia. Recent developments in the simulation approach to statistical inference (Gilks et al., 1996), particularly in the context of mixed model regression problems, have had a major impact on longitudinal data analysis, and this approach has been adopted in this study.
The main purpose of the present study was to determine whether a more detailed examination of existing longitudinal data can provide new information concerning the relationship between the various pathophysiologic changes that occur during an ischemic insult. Given the central role attributed to tissue depolarization in cerebral ischemia [see, for example, Balestrino (1995) and references therein and the review papers by Hansen (1985), Lipton (1999), and Somjen (1990)] together with the well-established relationship between diffusion changes and tissue pathology, it was decided to focus on the DC potential and ADC data obtained in a series of experiments performed by Harris et al. (2000) in which simultaneous measurements were made over a period of time before, during, and after an ischemic insult. Extracellular glutamic acid measurements were also made, but these data are not used in this analysis. We show that by adopting a more formal analytical method and by taking advantage of the simulation approach, new information can be extracted from the data, information that is key to gaining an insight into the pathophysiology of cerebral ischemia. Particular attention is paid to the within-subject temporal relationship between the DC and ADC responses. This is central to the common latent process question. A latent variables model assumes that, among a set of observations, several are directly related to some common underlying process. Direct proportionality is usually assumed, although some nonlinear relationship might apply. Indistinguishable response characteristics are a necessary condition for the involvement of a linear common latent process. It has been argued that the ADC is one of several MR observables that can be used as a surrogate marker of pathophysiology. A formal analysis of the ADC response is a prerequisite to adopting this approach.
MATERIALS AND METHODS
Experimental methods
Focal ischemia was induced in rats by intraluminal occlusion of the middle cerebral artery as outlined previously (Roussel et al., 1994; Harris et al., 2000). DC potential and MR data were acquired simultaneously and continuously during an observation period consisting of a preocclusion phase, followed by a postocclusion phase and subsequent recovery period. Echo planar spin-echo images were acquired with a temporal resolution of 15 seconds, whereas the DC potential sampling interval was 4 seconds. All other experimental details, including the MR data acquisition and DC recording details, are given in Harris et al. (2000). One of the 11 animals was excluded from the present analysis since the observed ADC was unusually high during both the preocclusion and postocclusion phases.
Data analysis
Longitudinal data analysis
As a prelude to this section on longitudinal data analysis, we summarize a few key concepts concerning Bayes theorem, since it forms the basis of the analytical approach. Bayes theorem states that posterior probability is proportional to the product of the likelihood of the observed data and the prior probability (Lee, 1989). The specification of a prior probability distribution for each model parameter is, therefore, mandatory. To ensure that the posterior probability distribution is dominated by the data and that the priors exert little influence, uninformative priors were adopted in the present analysis (details provided below). The likelihood encompasses a deterministic model for the observations and a statistical model for the between-individual variability in response and the behavior of the within-individual random errors. In the present context, the deterministic part of the likelihood models the ADC and DC responses to ischemia. The posterior probability distribution forms the basis for Bayesian statistical inference. For example, 95% posterior intervals can be used in a manner analogous to the 95% confidence intervals that arise in a traditional frequentist analysis, although important conceptual differences exist (Lee, 1989). In the present study, the individual-specific posterior probability distributions for the DC and ADC transition rates and half-response times permit a statistical assessment of the temporal relationship between the two responses. Thus, in contrast to the usual interest in population-average statistics, the main focus of the present analysis is the individual posterior medians and 95% intervals that characterize the within-animal temporal relationship between the DC and ADC responses (see next section for details). A simulation implementation is adopted because an exact analytical approach to the present type of problem does not exist (Gelman et al., 1995). The simulation was performed using a Markov chain Monte Carlo (MCMC) approach (Gelman et al., 1995; Gilks et al., 1996). This was implemented using the Metropolis algorithm (Gelman et al., 1995; Gilks et al., 1996) in a program written in SAS IML (SAS Institute, Cary, NC, U.S.A.). A formal description of the statistical model is given in the following section, a main feature of which is the logistic function used to model the ADC and DC potential responses. A single logistic term was used for the ADC data, whereas a sum of two logistic terms was used for the DC response. A full random coefficients model was adopted as described below. Uniform prior distributions were used for all parameters except for the variance components, for which priors of the form p(α) ∞ α−1 were adopted. Three parallel chains were generated, each consisting of 9.6 × 10⁶ samples. Convergence was assessed using the CODA implementation (available at URL http://www.mrc-bsu.cam.ac.uk) of the Geweke, Raftery&Lewis and Gelman&Rubin diagnostics (Gelman et al., 1995; Carlin and Louis, 1996). In addition, the parallel chains obtained for each model parameter were inspected for signs of convergence failure.
Statistical model
The following model was adopted:
where
The subscripts ij(dc) and ij(adc) indicate the jth DC potential and jth ADC observation in the ith animal, respectively. αk, k = 1,2, …, 11 are the so-called fixed-effect parameters that characterize the population response behavior. (In this context, the population is a hypothetical population; the 10 animals are treated as a random sample from this population.) γki, k = 1,2, …, 11, are the random coefficients and allow between-animal variation in each of the parameters, subject to the random normal distributional constraint indicated by N(.|σ2). Thus, the model allows the ith animal, i = 1,2, …, 10, to take on its own individual value in each of the eleven parameters that characterises the combined DC and ADC responses. The random coefficients are crucial to the present study in which individual-specific rate and half-response time estimates are required. The individual-specific half-response times are given by –(αk + γki), i = 1, …, 10, k = 4 (ADC response), 8 (DCfast response) and 11 (DCslow response). The individual-specific normalized rates (rate of change at half-maximum response) were calculated using β4i/4, β8i/4 and β11i/4 for the ADC, DCfast, and DCslow transitions, respectively. This amounts to an individual-specific rescaling of each of the three rate coefficients to a unitary transition, i.e., a transition between the initial and final asymptotic levels of 1 and 0, respectively, as shown in Figs. 1 and 2. This is necessary when testing for compatibility with a common latent process. The above reparameterization of the logistic function (i.e., the transformation from the β-parameter space to the α-parameter space seen by the Metropolis algorithm) was adopted to reduce the degree of correlation between parameters. In addition, parameter exponentiation confers a log-normal distribution on each of the rate parameters, βki, k = 4, 8, 11.
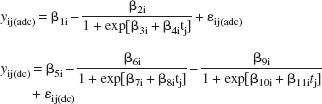
Observed and estimated posterior median apparent diffusion coefficient (ADC) and direct current (DC) potential response profiles obtained for two individual animals (animals 2 and 3 in the left and right columns, respectively).
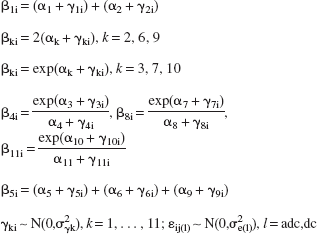
Posterior median apparent diffusion coefficient (ADC) and direct current (DC) potential component response profiles obtained from selected individual animals.
A likelihood of the form
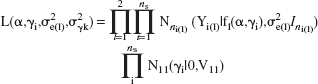
was adopted where α is the vector [α1,α2, …, α11]T, γi the vector of random coefficients for the ith subject, [γ1i,γ2i, …, γ11i]T, ns is the number of animals, ni(1) is the number of observations acquired for the lth response variable in the ith animal, l = (dc, adc), Yi(1) is the vector of observations for the lth response variable in the ith subject, Nk(.|μ,Σ) is a k-dimensional normal distribution with mean μ and covariance matrix Σ, Ik is the k-dimensional identity matrix, V11 is diag(σ2γk), k = 1,2, …, 11, and f1(α,γ1) is the nonlinear model (logistic function) given above for l = (dc, adc).
RESULTS
Figure 3 shows the DC and ADC responses acquired from each of the 10 individual animals, together with the estimated population median DC and ADC responses. The estimated population transition parameter medians are listed in Table 1. These estimates were calculated using the posterior fixed-effect parameter medians obtained from the random coefficients regression model outlined in the Materials and Methods section.
ADC and DC transition parameter population medians and 95% posterior intervals
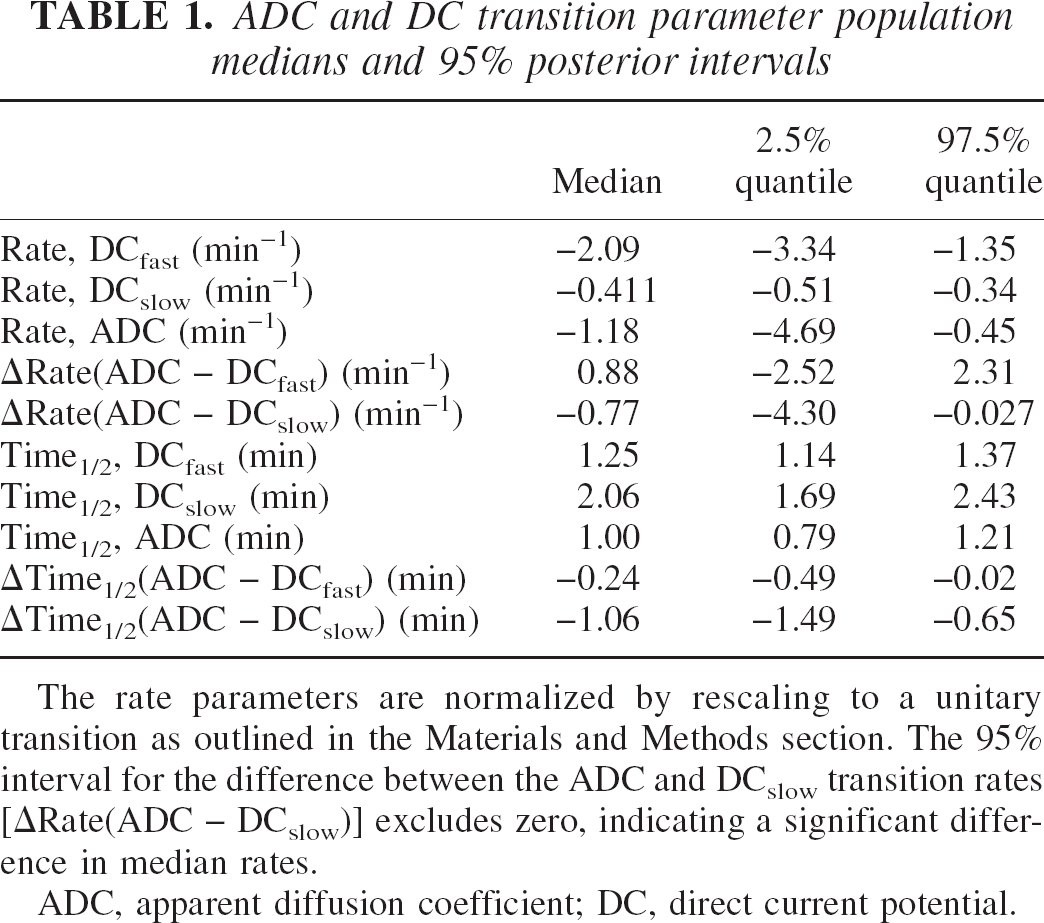
The rate parameters are normalized by rescaling to a unitary transition as outlined in the Materials and Methods section. The 95% interval for the difference between the ADC and DCslow transition rates [ΔRate(ADC − DCslow)] excludes zero, indicating a significant difference in median rates.
ADC, apparent diffusion coefficient; DC, direct current potential.
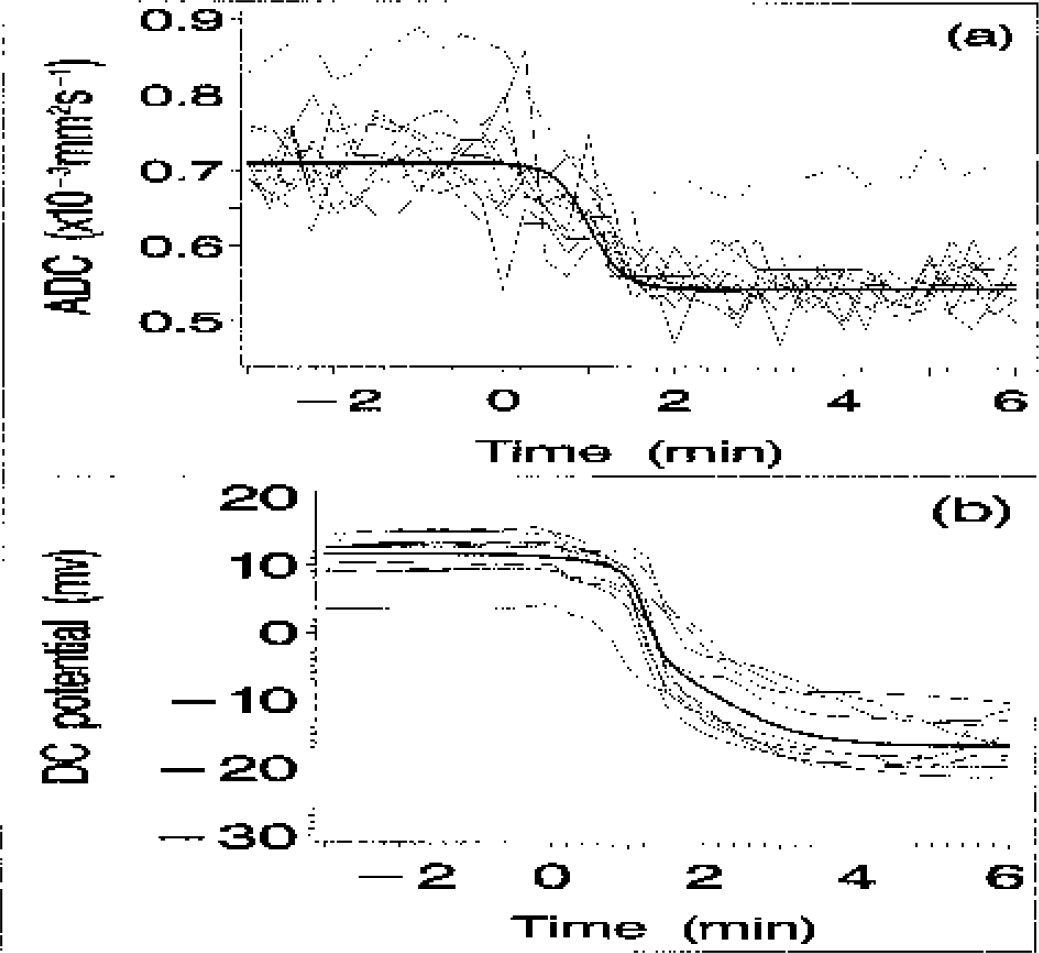
Individual apparent diffusion coefficient (ADC) and direct current (DC) potential responses from 10 animals (thin lines) with the population median response profiles superimposed (bold lines). The data acquired from an eleventh animal were excluded because of the unusually high ADC associated with both the preand postocclusion phases (shown using a broken line).
Figure 1 focuses on the DC potential and ADC results obtained for 2 of the 10 animals (animal 2 and 3 in the left and right columns, respectively). These two animals were selected to show the substantial degree of between-subject variation in the observed ADC transition characteristics. Figures 1A and 1B show the observed DC and ADC pair of response profiles obtained for these two animals, after normalization. Figures 1C and 1D show the corresponding individual median response profiles, together with a cluster of profiles obtained by sampling the posterior distribution. A visual inspection of these four plots (observed data in Figs. 1A and 1B; individual-specific median profiles in Figs. 1C and 1D) suggests an absence of any obvious and consistent relationship between the DC and ADC transitions. Figures 1E and 1F show the individual-specific median and sampled posterior DC response profiles with the observed data superimposed, while Figs. 1G and 1H show the corresponding median and sampled posterior ADC response profiles with the ADC observations superimposed. The two-term logistic function provides a good fit to the observed DC responses (Figs. 1E and 1F), while a single logistic term provides an adequate fit to the ADC data (Figs. 1G and 1H). (The need to include two logistic terms in the model for the DC response is indicated by the observation that the population and individual-specific fast- and slowcomponent weighting coefficient 95% posterior intervals all exclude zero.) The immediate visual impression provided by Figs. 1E–1H is a marked between-animal difference in ADC transition rate (compare Figs. 1G and 1H) despite the relative similarity of the DC response profiles (Figs. 1E and 1F). In both animals, the ADC transition tends to precede the DC response (Figs. 1A–1D).
A visual impression of the relationship between the two-component DC response and the ADC response is given in Fig. 2. Figures 2A and 2B focus on the fast-DC component responses in animals 2 and 3, respectively. Similarly, Figs. 2C and 2D focus on the slow-DC responses. Thus, Figs. 2A and 2B each show an individual fast-DC response profile with the ADC response superimposed, whereas Figs. 2C and 2D show the corresponding slow-DC profiles, again with the ADC responses superimposed. Neither of the two DC components exhibits a consistent temporal relationship with the ADC response. Figures 2E and 2F each show an individual pair of slow- and fast-DC response profiles (from animals 1 and 8), again selected to show the substantial degree of between-animal variation in response characteristics. The fast-DC transition rates obtained for these two animals are significantly different (see 95% posterior intervals shown for animals 1 and 8 in Fig. 4, top left panel).
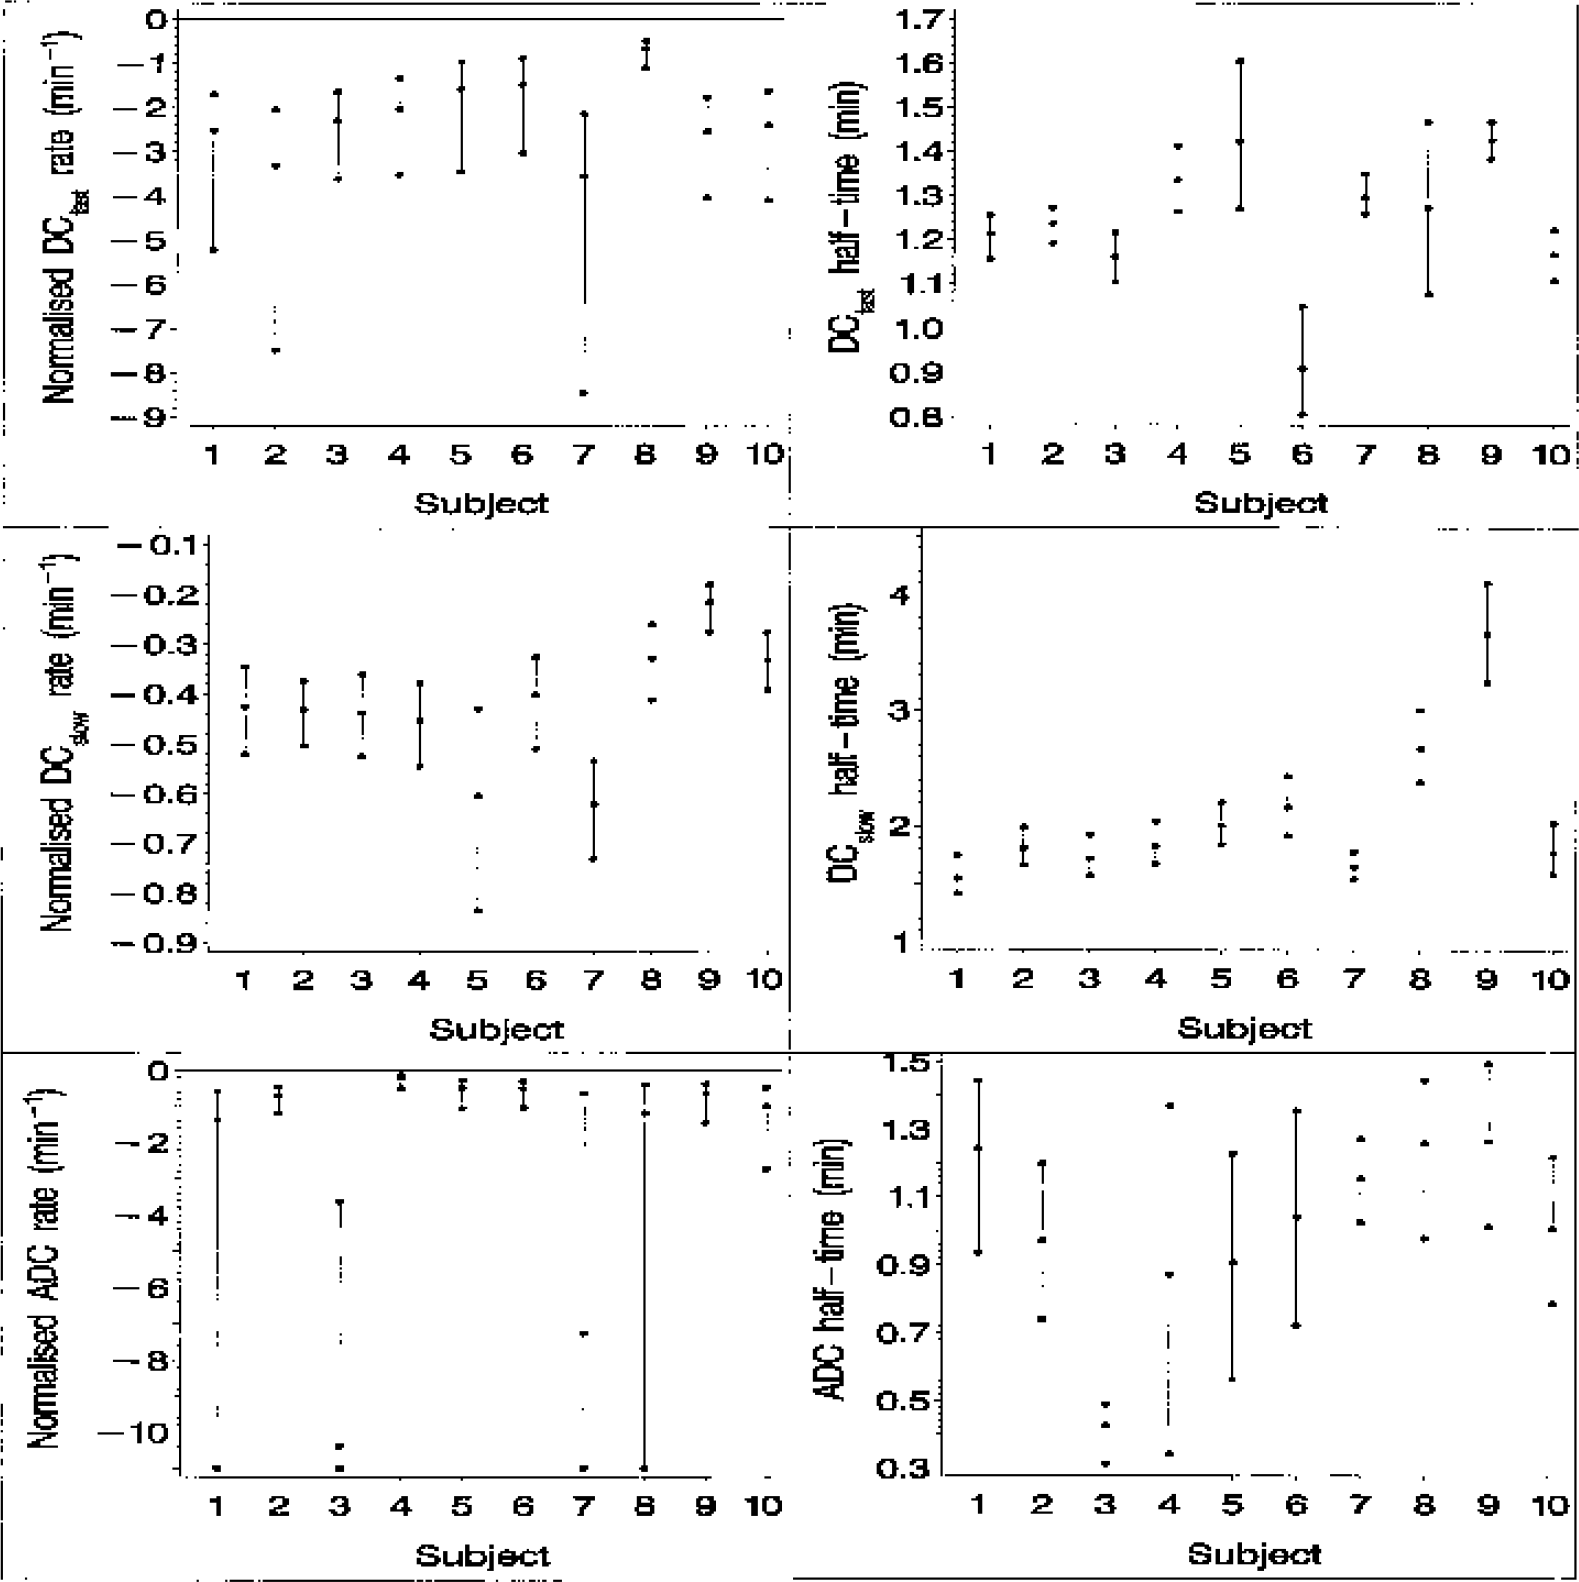
Direct current (DC) potential and apparent diffusion coefficient (ADC) normalized transition rate and half-response time posterior medians and 95% intervals generated for each of the 10 animals. The top two panels show the fast-DC component results, whereas the middle two panels relate to the slow-DC component. The lower limit of the ADC transition rate posterior interval for animals 1, 3, 7, and 8 is large and negative, indicating a near step change in ADC. For display purposes, these have been truncated at −11.
The 10 individual DCfast, DCslow, and ADC transition rate medians are displayed in Fig. 4 together with the 2.5% and 97.5% quantiles. Figure 4 also displays the individual transition half-response time medians and quantiles. All six parameter medians (transition rate and half-response time for each of the three responses, i.e., DCfast, DCslow, and ADC responses) exhibit a considerable degree of between-subject variability. Four animals yield ADC transition-rate distributions that are heavily skewed, indicating that in these individuals the ADC transition sampling is insufficient to rule out a near step change in ADC. The 10 individual ADC-DCfast transition rate median differences and quantiles are shown in Fig. 5 together with the transition half-response time median differences and quantiles. Six of the 10 individual ADC-DCfast rate difference 95% posterior intervals exclude zero (Fig. 5A), indicating a significant difference in rates in these subjects. Five of these six median differences are positive and one is negative. Four of the difference distributions are heavily skewed, this being a reflection of skewness in the corresponding ADC transition-rate distributions mentioned above. Four of the 10 posterior intervals for the ADC-DCfast difference in half-response time lie below zero (Fig. 5B), indicating that the ADC half-response time occurs before the DCfast half-response point in these individuals, with the difference achieving statistical significance.
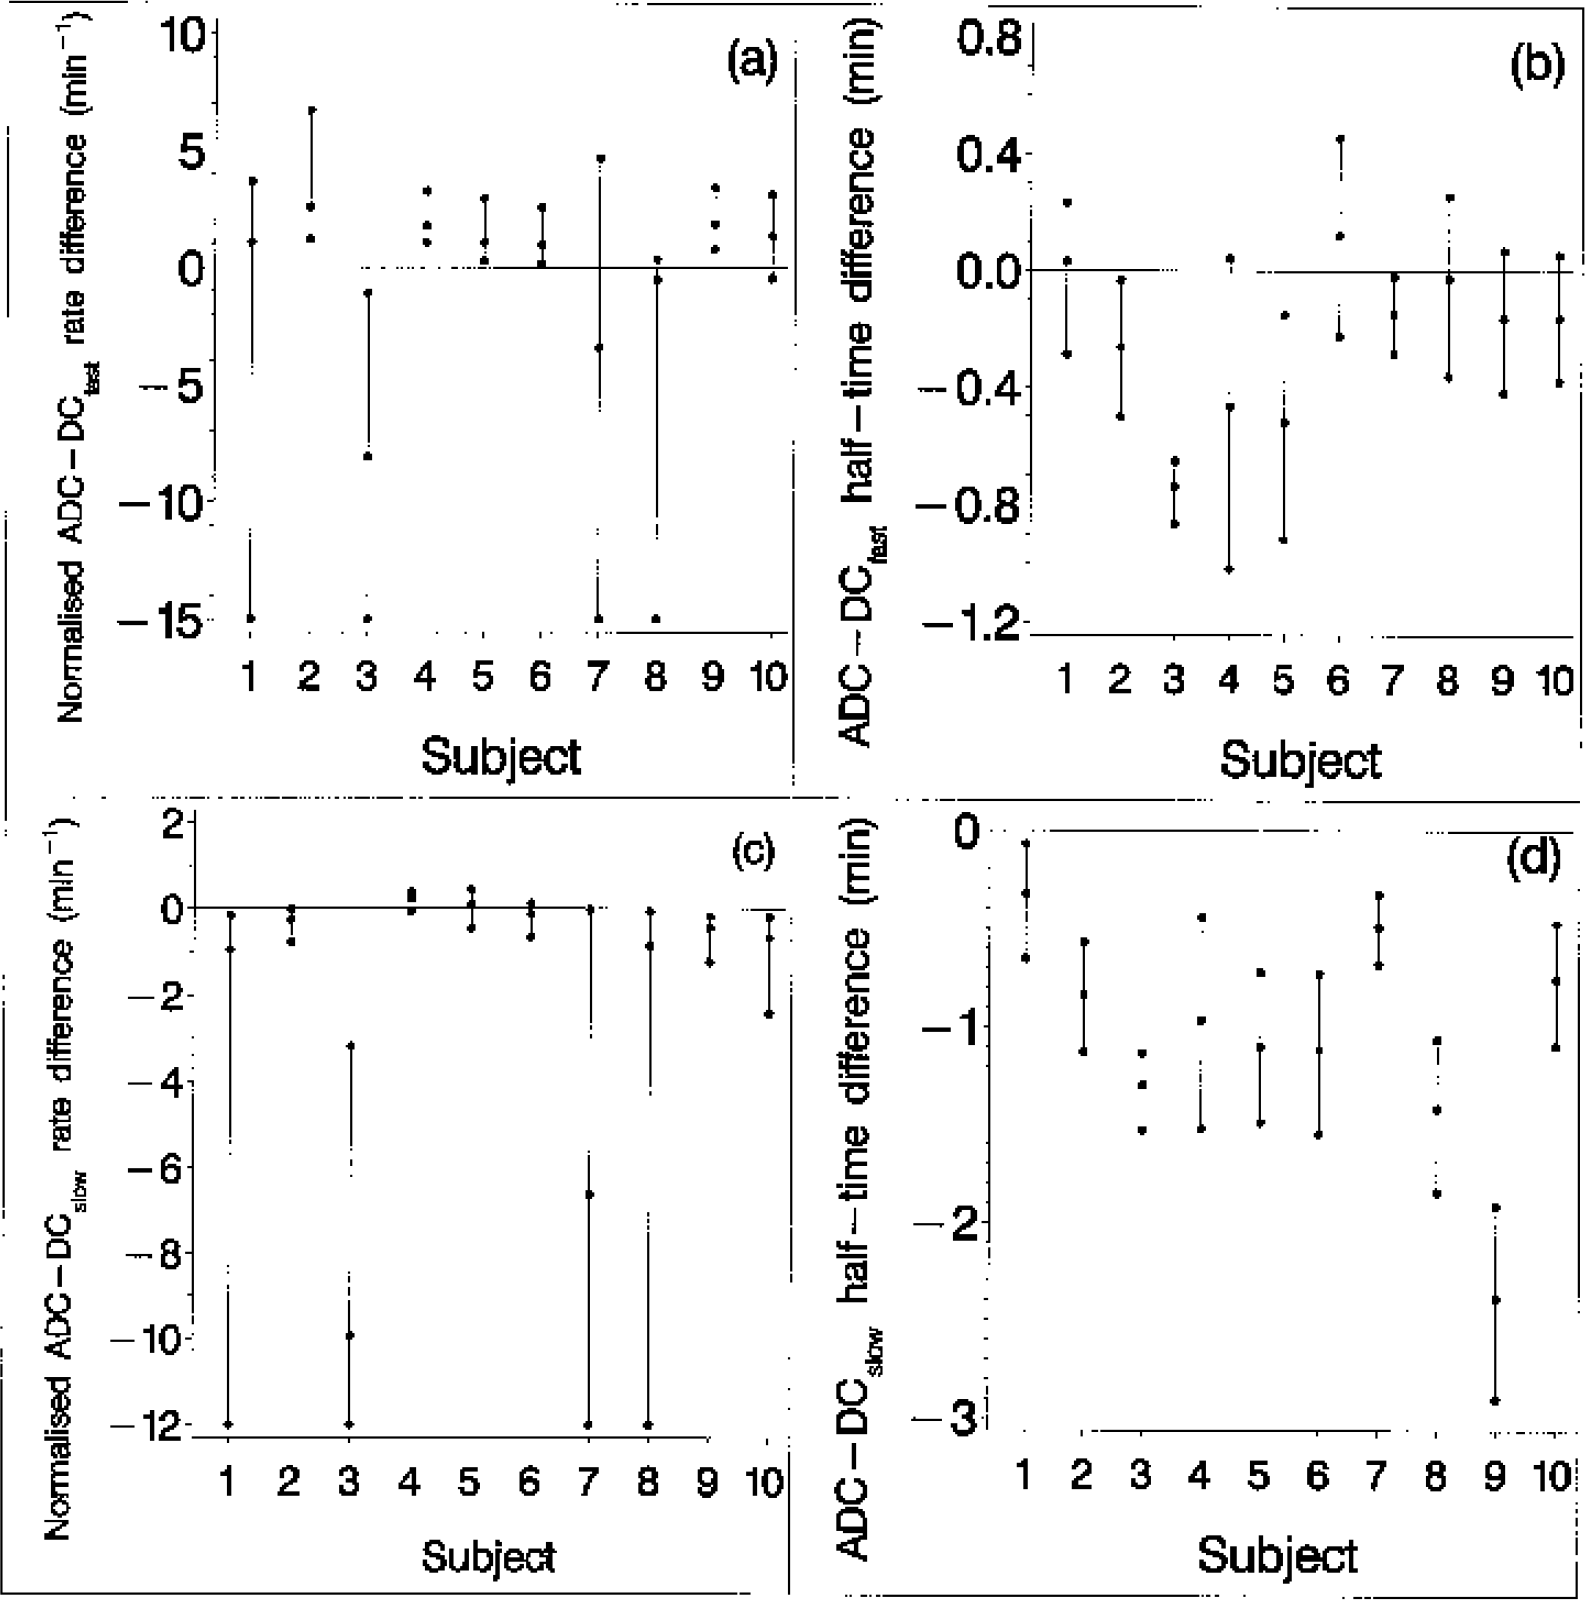
Apparent diffusion coefficient (ADC)-direct current (DC) potential transition parameter difference medians and 95% posterior intervals for each of the 10 individual animals. These data were obtained from the posterior sample by performing subtractions using the relevant normalized transition rate or half-response time parameters. The lower limit of the ADC-DCfast/slow rate difference posterior intervals obtained for animals 1, 3, 7, and 8 are large and negative, reflecting a near step change in ADC (see Fig. 4). For display purposes, these intervals have been truncated at −15 and −12 in
Figure 5 also shows the ADC-DCslow transition rate and half-response time median differences and quantiles. Seven of the 10 intervals for the difference in rate lie below zero (Fig. 5C), indicating a significant difference in these individuals, whereas one interval is close to excluding zero with a positive median. All 10 ADC-DCslow half-response time difference intervals lie below zero, indicating that the ADC transition half-response time is consistently early relative to the DCslow half-response time. Finally, we note that subjects 1 and 8 differ from the remaining subjects; in these two subjects, the ADC and fast-DC component are similar in terms of both their transition rate and half-response time medians (Figs. 5A and 5B). We note that, in addition to these two animals, subject 10 also yields transition rate and half-response time difference 95% intervals, both of which span zero (Figs. 5A and 5B). Animals 4 and 5 differ from the remainder of animals with respect to their slow-DC transition rate median, which is fast relative to the ADC transition. Furthermore, the 95% interval for subject 4 is close to excluding zero (Fig. 5C).
DISCUSSION
Despite the established role of diffusion imaging in stroke research and diagnosis, many aspects of the ADC response to an ischemic insult are poorly understood. It is generally believed that anoxia-induced brain damage is the result of a cascade of events, but the relationship between these events and the ADC response remains to be determined. In the present article, we have focused on the temporal relationship between the ADC and DC responses to transient focal ischemia. Until recently, a rigorous analysis of this type of longitudinal data was barely feasible. Although useful statistical models were available by the early 1980s (Laird and Ware, 1982), it is only with the more recent availability of substantial computing power that a proper modeling of longitudinal data has become routine. In this study, we have used a Markov chain Monte Carlo simulation implementation of a full random coefficients model of the ADC and DC responses to an ischemic insult. Random coefficients are required to model adequately various features of the between-animal variation in the DC potential and ADC responses. For example, the greater between-animal variance in baseline ADC, compared with the between-animal variance in the asymptotic postocclusion ADC level, is a striking feature of the ADC profiles (Fig. 3A). This behavior is captured by the full random coefficients model. Among the other advantages of the random coefficients modeling approach is its applicability to sparse data. This is particularly important in the present application because the ADC transition is undersampled and it is difficult to obtain precise estimates of the transition parameters by fitting individual data. Undersampling was unavoidable since signal-to-noise ratio considerations placed an upper limit of the order of 4 min−1 on the image acquisition rate. Undersampling is a common problem in pharmacokinetics, and this prompted the development of methods for dealing with sparse data (Wakefield, 1996; Gelman et al., 1996; Roe, 1997). Improved individual parameter estimates (random coefficients) are obtained by adopting a formal random coefficients analysis because every individual contributes information to each of the individual random coefficient estimates. This information-borrowing behavior is a central feature of Bayesian hierarchical modeling.
MCMC simulation offers several advantages over the more traditional mixed-model/random-coefficients regression methods. First, statistics can be generated without resorting to large-sample approximation, an obvious advantage given the relatively small number of animals used in this study. Furthermore, full nonlinear random-coefficients models can be adopted, again without resorting to approximation. [Wakefield (1996) and Gelman et al. (1996) both discuss the advantages of the simulationbased Bayesian approach to the analysis of sparse data with reference to nonlinear hierarchical models.] Finally, the present study focuses on transition rate and half-response time estimates, and nonlinear functions of model parameters are involved. The need to obtain statistics on nonlinear functions would usually complicate the analysis, but presents no difficulty when using MCMC simulation.
The main purpose of this analysis was to determine whether the ADC and DC changes might be driven by some common latent process. If some common process is directly responsible for the DC and ADC responses (i.e., if the ADC and DC potential are immediately and tightly coupled to some underlying driving process, with a linear dependence), the normalized individual-subject ADC and DC transition parameters must be indistinguishable. It might be argued that any attempt to relate the temporal dependence of the ADC and DC response is mistaken because the DC recording electrode is sensitive to a highly localized region of tissue, whereas diffusion imaging is relatively low in resolution. (The present ADC data were acquired from a 1.5-mm2 region within a 2.1mm slice, giving an acquisition volume of approximately 3 mm3.) A high degree of spatial variation in DC potential or ADC might invalidate the comparison. Nevertheless, several studies of this type have been performed, and these have led to disagreement regarding the temporal relationship between the two responses (as discussed by de Crespigny et al. (1999); see below for additional information). The present study attempts to resolve some aspects of the problem by adopting a formal statistical analysis. It is important to stress that a failure to demonstrate that any of the population mean ADC-DC transition parameter differences is nonzero (i.e., a failure to reject any of the null hypotheses) cannot be used as evidence for a common latent process since this might arise because of between-subject variability in transition characteristics. If a common latent process (as defined above) is involved, then the within-subject ADC and DC transition characteristics must be indistinguishable, irrespective of the between-subject variability in transition behavior. Consistent with previous studies [see de Crespigny et al. (1999) Fig. 5, for example], the DC response was found to consist of two components. Accordingly, it is necessary to examine the temporal relationship between the ADC response and each of the two DC components.
An adequate modeling of the DC data is obtained using a sum of two logistic terms, whereas a single logistic term is sufficient with respect to the ADC response. However, we note that a poor signal-to-noise ratio causes a reduction in power to detect model failure in the latter case. The observation that a sum of logistic terms provides a convincing description of the DC and ADC responses is particularly interesting, given the classic logistic form of the relationship between binding-site saturation and log concentration, as expressed by the Langmuir adsorption isotherm (Michaelis-Menton equation). An underlying binding process may be implicated, although this does assume an exponential ligand concentration dependence on time. The results obtained from this MCMC analysis rule out the possibility that either of the two DC components and the ADC response to an ischemic insult are driven directly by some common latent process. This assertion is based on the following observations: 6 of the 10 animals yielded distinguishable ADC and fast-DC transition rates; six animals yield distinguishable ADC and slow-DC transition rates. We have focused on the transition rate parameters because it might be argued that differences in transition time might be an artifact of poor synchronization between the MR and DC recordings. Nevertheless, the transition time statistics are consistent with the assertion that the ADC and DC responses are driven independently. In 4 of the 10 animals, the ADC half-response time preceded the fast-DC half-response time with a difference that achieves significance. All 10 animals reached significance with respect to the difference between the ADC and slow-DC transition times. At this stage, it is important to consider the possibility that these differences might arise as an artifact caused by “shrinkage” in individual parameter estimates towards the population estimate. Shrinkage towards the population mean is a characteristic of Bayesian hierarchical models [see, for example, page 133 in Gelman et al. (1995)], and this is important in the present context because of the differing precision of the ADC and DC measurements and the differing transition rates. The ADC data were acquired with a lower sampling rate and lower precision. The ADC transition rate estimates are, therefore, more susceptible to shrinkage, especially when the transition is undersampled because of its rapidity. One can imagine a situation in which a within-animal pair of ADC/DC transitions with near identical rates appear to have differing rates because of shrinkage in the estimated ADC rate, whereas the DC estimate remains close to its sample value. An inspection of the data indicates that estimation shrinkage does indeed take place but, with one exception, this occurs only when the ADC transition is fast relative to both the DC transition and the population median ADC rate. Thus, when it occurs, ADC parameter shrinkage reduces the estimated ADC-DC transition rate difference rather than creating a difference in rates as an artifact. The one exception, referred to above, is the ADC-DCfast rate difference in Animal 1. In this instance, the 95% posterior interval includes zero, and so shrinkage is not a concern.
To summarize, the main finding in this study is that the observed ADC and DC changes are not driven by a common latent process. Furthermore, the statement (Harris et al., 2000) that the mean ADC half-response time is shorter than the mean DC half response time is consistent with the population median half-response statistics given in Table 1; thus, this assertion is not altered when the biphasic nature of the DC response is taken into consideration. The fundamental question is how the failure to find evidence for a common latent process relates to the known physiology of the anoxic/ischemic response.
Many aspects of the biophysical responses to cerebral ischemia/anoxia resemble those observed in spreading depression and, since there is a considerable literature on the latter, it is useful to draw on this information. Contradictory results appear to have been obtained concerning the temporal relationship between the ADC and DC potential responses to spreading depression and cerebral ischemia/anoxia. Thus, while it has been reported that the transient ADC response to spreading depression and ischemia/anoxia appears simultaneously with the DC shift (Gyngell et al., 1994; de Crespigny et al., 1998), others report that the ADC response to cerebral ischemia occurs before anoxic depolarization (Huang et al., 1997; de Crespigny et al., 1999; Harris et al., 2000). de Crespigny et al. (1999) point out, however, that despite the earlier onset of the ADC response, a larger and more rapid ADC change occurred during depolarization. It should be noted that technical limitations typically restricted the temporal resolution of early DW imaging work (scan times of 10 minutes or more), with the result that any existing DC-ADC response mismatches may have been missed.
Reference has been made in the introduction to early studies into the etiology of stroke-induced ADC changes (Busza et al., 1992; Norris et al., 1994; Latour et al., 1994b; Szafer et al., 1995; Hoehn-Berlage et al., 1995; Anderson et al., 1996). Several researchers have suggested that cell swelling (cytotoxic edema) is responsible for the observed reduction in ADC (Norris et al., 1994; Latour et al., 1994a; Latour et al., 1994b; Anderson et al., 1996). van der Toorn et al. (1996) state that there is a close correlation between the ADC time course and both the tortuosity and extracellular:intracellular volume fraction changes that occur in global ischemia. They suggest, therefore, that these processes are mechanistically linked. However, this conclusion is based on sampleaverage behavior. A formal analysis of the within-subject temporal relationship between responses provides additional information, and this has been the focus of the present article. Nevertheless, it is interesting to note that van der Toorn et al. report a difference between white and gray matter with respect to the latency of the ADC transition, a difference that is reflected in the tortuosity and volume fraction data. They suggest that cell swelling is the common link and that this is triggered by a depletion of phosphocreatine. In this context, it is interesting to note that cell swelling has also been suggested as the direct cause of anoxic depolarization (Balestrino, 1995).
Several researchers have studied the electrophysiology of anoxia and reported a triphasic response [see Hansen (1985) and Lipton (1999) for reviews]. A key feature of the second of these three phases is a rapid increase in extracellular potassium (K+ec) and an associated fast negative decrease in extracellular DC potential (anoxic depolarization). These events are accompanied by a simultaneous movement of NaCl from the extracellular space into the intracellular compartment and an increase in both extracellular impedance and extracellular marker concentration. The impedance and marker concentration changes are both attributed to an osmotically driven movement of water from the extracellular space into the intracellular compartment. Cell swelling and extracellular volume reduction are a manifestation of this process. Lactate and other products of anaerobic metabolism also contribute to the osmotic response. Hansen (1978, 1985) states that the ion movements that occur during this phase of the anoxic process are due to a sudden increase in overall cell membrane ion permeability. He suggests that this permeability change is caused by K+ec-induced cell membrane depolarization, arising from the initial elevation in K+ec that occurs during the first phase of the anoxic response. Similar DC, K+ec, impedance, and extracellular marker responses are observed in spreading depression [see, for example, Collewijn and van Harreveld (1966); Hansen and Olson (1980); Nicholson and Kraig (1981); Hansen (1985)]. Moreover, Nicholson and Kraig (1981) have proposed a working hypothesis for the sequence of events that underlie this process. It provides an explanation for the present results. A key observation is that spreading depression and the associated decrease in Na+ec and Cl−ec persist in the presence of tetradotoxin, indicating that the conventional voltage-dependent channel is not an essential component. Nicholson and Kraig suggested that a chemically mediated neuronal (dendritic) channel is involved, and that the movement of water that accompanies the redistribution of NaCl occurs either via separate aqueous pores or via ion channels. This movement of water is assumed to be associated with the observed decrease in ADC. Nicholson and Kraig further suggest that an accumulation of K+ec causes glial cell depolarization and that this is the cause of the negative extracellular DC potential changes. The assertion that glial cell depolarization and not neuronal depolarization is the essential component of spreading depression had been suggested previously on the basis of experiments in which neuronal and glial cell intracellular DC potential recordings were made in the presence and absence of tetradotoxin (Sugaya et al., 1975). A close temporal relationship between glial depolarization and spreading depression was observed, whereas the neuronal intracellular DC potential failed to show a consistent temporal relationship. Thus, the Nicholson-Kraig interpretation of the sequence of events in spreading depression provides a plausible explanation for the temporal separation of the ADC and DC responses observed in the present study. Furthermore, the notion that the volume and DC components of spreading depression are separate processes has been demonstrated by experiments in which NaCl was replaced by sucrose. The negative potential associated with spreading depression was maintained, while the light-scattering and impedance changes associated with cell swelling were abolished [see Nicholson and Kraig (1981), p. 221 for references]. However, although a simple picture of the sequence of events occurring during anoxic depolarization appears to emerge, a number of experimental observations complicate the issue. Thus, although anoxic depolarization might be attributed to Na+K+-ATPase pump failure, tissue ATP concentrations are relatively unaffected in spreading depression (Hansen, 1985), despite the similarity of the ion concentration and DC potential responses. An additional complication emerges from the demonstration (Obrenovitch et al., 1990) that ischemia-induced depolarization occurs in isolated perfused brain, despite the maintenance of ATP at a significant level (one third of the control concentration). Product inhibition of the Na+K+-ATPase by ADP (Apell et al., 1986) might underlie this finding, in which case a partial depletion of ATP suffices to cause transmembrane ion-gradient disruption.
In this study, we have reexamined the ADC and DC-potential data obtained from a previously published study, with a view to addressing the common latent process issue. The analysis focuses on the ADC and DC transition characteristics (half-response times and associated rates). A simple comparison is valid, provided the biologic system in question behaves as an approximately linear system, i.e., provided the ADC and DC responses are approximately linearly related to the driving process(es). Nonlinearity in the system will give rise to a difference in the ADC and DC transition characteristics unless the dependencies in the two responses are identical. However, identical dependencies are not necessarily expected. If, for example, ion movement is the common driving process, identical DC and ADC dependencies on ion concentration are not expected. Nevertheless, any resulting difference in transition characteristics should be consistent across animals given a common latent process. The present results suggest, therefore, that a common latent process with nonlinear dependence cannot be invoked, since we do not observe a consistent relationship between the ADC and DC transition characteristics. In particular, Fig. 5A shows that the median difference in the ADC and DCfast transition rates is positive in some animals, whereas it is negative in others. Heterogeneity is also observed in the ADC-DCslow median rate differences (Fig. 5C). An inspection of the 10 individual overlaid component DC and ADC posterior cluster plots (of the type shown in Fig. 2A to 2D) lends credence to the conclusion that there is no consistent temporal relationship between the two transitions. A common latent process involving nonlinear responses therefore appears unlikely. Triggering mechanisms are an alternative to common latent process mechanisms and might appear as an extreme form of nonlinearity. In a triggered system, the stimulus for change in one variable is threshold crossing in the value of the driver variable. The threshold in question might be the concentration of some trigger species, for example. A comprehensive analysis of the time course data is required to explore fully the possible involvement of some triggered process. This work is the subject of a separate paper.
The diffusion-DC potential data reported by de Crespigny et al. (1999) are especially interesting in the triggering-process context since their ADC transition latency parameter (τ1 in their Table 1) provides important information. They observed no significant difference between τ1 and the latency in the DC potential response in normal rats. Furthermore, this temporal relationship was maintained in both hypo- and hyperglycemic animals, as expected if anoxia-induced cell swelling is a common component. Equal DC and ADC latencies appear contradictory to the data obtained in the present study (ADC-DC latency data calculated but not shown). This clearly requires further investigation. In particular, within-animal latency difference data obtained under the global ischemic conditions created in the de Crespigny study would be informative. These authors comment on the apparent discrepancy between their study and the earlier work by Huang et al. (1997), the latter of which suggests that the reduction in ADC precedes the DC response. The difference in latency reported by Huang et al. (1997) is, however, based on a comparison of their ADC data and the DC potential information published by Hansen (1978).
To conclude, the present study suggests that the ADC and DC potential responses to ischemia are not driven by a common latent process. The possible involvement of some triggering mechanism remains to be investigated; this also requires an evaluation of individual responses in addition to the mean transition characteristics. We recognize that considerable caution is required in this kind of study, in which the focus is on the between-animal differences in temporal behavior. It is evident, however, that a restricted focus on the mean responses can be misleading. The temporal relationship between the ADC and the established biophysical/biochemical responses to ischemia clearly requires further investigation to fully understand the mechanism underlying the ADC response.