
Abstract
Recent in vitro studies suggest that lactate, rather than glucose, may be the preferred fuel for neuronal metabolism. The authors examined the effect of lactate on global brain glucose uptake in euglycemic human subjects using 18fluorodeoxyglucose (FDG) positron emission tomography (PET). Eight healthy men, aged 40 to 54 years, underwent a 60-minute FDG-PET scan on two occasions in random order. On one occasion, 6.72% sodium lactate was infused at a rate of 50 μmol · kg−1 · min−1 for 20 minutes and then reduced to 30 μmol · kg−1 · min−1; 1.4% sodium bicarbonate was infused as a control on the other occasion. Plasma glucose levels were not different between the two groups (5.3 ± 0.23 and 5.3 ± 0.24 mmol/L, P = 0.55). Plasma lactate was significantly elevated by lactate infusion (4.08 ± 0.35 vs. 0.63 ± 0.22 mmol/L, P < 0.0005. The whole-brain rate of glucose uptake was significantly reduced by approximately 17% during lactate infusion (0.195 ± 0.022 vs. 0.234 ± 0.020 μmol · g−1 · min−1, P = 0.001). The authors conclude that, in vivo in humans, circulating lactate is used by the brain at euglycemia, with sparing of glucose.
Glucose has traditionally been considered the only substrate capable of satisfying the brain's energy requirement (Siesjo, 1978). There is, however, mounting evidence from in vitro experiments that lactate, a nonglucose fuel, is an efficient energy substrate for neurons and may be used preferentially by neurons to maintain synaptic transmission, particularly during periods of intense activity. For example, neurons bathed in a medium containing 5-mmol/L glucose and 5- to 10-mmol/L lactate generate significantly more cellular energy from lactate than glucose (Larrabee et al., 1995; Taberno et al., 1978). Lactate alone can support synaptic function in rat hippocampal slices (Schurr et al., 1988; Stittsworth and Lanthorn, 1993) and is the preferred energy substrate for recovery of neuronal function after prolonged oxygen deprivation (Schurr et al., 1997).
Lactate is produced locally within the brain by astrocytes, in an activity-dependent glutamate-mediated manner (Pellerin and Magistretti, 1994). The excitatory neurotransmitter glutamate stimulates glycolysis within the astrocyte to generate and release lactate, which is then taken up by neurons as an aerobic energy substrate that enables neurons to endure activation. Blood-borne lactate was not thought to be a significant source of brain lactate as there was early evidence that it does not cross the blood–brain barrier easily (Pardridge and Oldendorf, 1977). However, mammalian brain does contain transport mechanisms that allow lactate to cross the blood–brain barrier via specialized monocarboxylate transporters (MCT) (Dringen et al., 1995; Price et al., 1998; Tildon et al., 1993). The efficiency of passage of lactate across the blood–brain barrier has been estimated to be between 25% and 50% that of glucose (Cremer et al., 1979; Knudsen et al., 1991). Although there are few data in vivo in humans, clinical studies do support the hypothesis that, when glucose is in short supply, circulating lactate can support cortical and other brain functions. Elevated circulating lactate levels reduce the symptoms, cognitive impairment and counterregulatory hormone responses to acute hypoglycemia, whether created endogenously by strenuous exercise (Coyle et al., 1986; Felig et al., 1982) or by infusion of exogenous lactate (King et al., 1997; Maran et al., 1994; Veneman et al., 1994). However, there are no human in vivo data examining the brain's ability to use lactate outside the setting of glucose deprivation.
Global and regional brain glucose metabolism can be examined in vivo in humans using neuroimaging techniques, such as [18F] fluorodeoxyglucose (FDG) positron emission tomography (PET). FDG is an analog of natural glucose (deoxyglucose) labeled with a positron emitter (18F). Deoxyglucose is taken up by the cells and phosphorylated, but then proceeds no further along the intracellular glucose metabolic pathway. Accumulation of labeled deoxyglucose in tissue cells has long been used as a way of measuring glucose uptake and initial metabolism in many tissues, including the brain in human subjects in vivo (Phelps et al., 1979). To investigate the hypothesis that healthy human brain will use lactate in preference to glucose even when glucose is readily available, we measured global and regional brain glucose uptake using FDG PET in healthy human volunteers at normal fasting plasma glucose levels.
MATERIALS AND METHODS
Research design
Eight healthy male volunteers aged 40 to 54 years (mean ± SD age, 45.0 ± 5.48 years) were studied. None was taking any medication or had a history of cardiovascular disease or a personal and family history of diabetes mellitus. The protocol was approved by the ethics committee of Guy's and St. Thomas' Hospital trust and ARSAC (Administration of Radioactive Substances Advisory Committee) and conducted in accordance with the principles of the Helsinki declaration. All subjects gave written informed consent before participating. Each subject was studied twice (2–8 weeks apart) with an FDG-PET scan to measure global and regional brain glucose uptake. Magnetic resonance imaging (MRI) scans for anatomic detail were performed once in each subject on a separate occasion and were coregistered with the PET images.
Study protocol
Positron emission tomography was performed at the Clinical PET Center, St. Thomas' Hospital (London, U.K.) using an ECAT 951R PET scanner (CTI/Siemens, Knoxville, TN, U.S.A.). The scanner has an axial field of view of 10.8 cm and an intrinsic in-plane spatial resolution of 6.2 mm transaxially and 4.5 mm axially.
Subjects were admitted to the PET Center before 9 a.m. They had avoided alcohol for the previous day and had fasted from 10:30 p.m. the previous evening. An intravenous catheter was inserted in a large vein in the antecubital fossa of the dominant arm, using full aseptic techniques and local anesthetic (intradermal 1% lidocaine) for infusion of lactate or sodium bicarbonate. After ensuring the patency of a collateral circulation, a second catheter was inserted in the radial artery of the nondominant hand, again aseptically and with local anesthetic. This catheter was used for rapid arterial sampling during the study.
At time = 0 minutes, an intravenous infusion of either a 0.6-mmol/mL sodium lactate (diluted and sterilized in the hospital pharmacy and tested for pyrogens before infusion) or sodium bicarbonate was started. The lactate was infused via a sterile μm filter at a rate of 50 μmol · kg−1 · min−1 via a 20-μm filter for 20 minutes, and was reduced thereafter to a rate of 30 μmol · kg−1 · min−1 for the remainder of the study.
In the control study, sodium bicarbonate was infused instead of sodium lactate, to mimic the pH changes in the blood induced by sodium lactate. The first three subjects were infused with 1.24% sodium bicarbonate (Polyfusor; Fresenius, Warrington, U.K.), whereas the remaining 5 received 1.4% sodium bicarbonate (Polyfusor; Fresenius). The dose of the bicarbonate was calculated as 0.25 times the lactate dose in mmol/h. Studies were done in random order and subjects were blinded to the nature of the infusion.
Arterial blood samples for plasma glucose and lactate were taken every 5 minutes and analyzed at the bedside (Yellow Springs 2300 STAT Plus glucose analyzer; Yellow Springs Instruments, Yellow Springs, OH, U.S.A.). Arterial samples for pH were collected in a 2-mL heparinized syringe at 30-minute intervals, placed on ice, and immediately measured in an arterial blood gas machine (AVL Omni 9; Roche Diagnostics, Graz, Austria).
With the lactate–bicarbonate infusion running, the volunteer was positioned comfortably in the PET scanner with his head movement restrained by a headband. Head position within the scanner was aligned axially to the orbitomeatal line and checked periodically by means of two laser beams on the camera gantry. Sensory disturbance was standardized by studying subjects with their eyes shut and in the background scanner noise. A 10-minute transmission scan was made to correct for photon attenuation. At time = 40 minutes, approximately 125 MBq FDG was injected intravenously over 20 seconds. Dynamic scanning of 23 frames of variable duration was begun 10 seconds before the injection of tracer and continued for the following 60 minutes. Continuous online sampling to detect 18FDG tracer levels in arterial blood was started 1 minute before tracer injection and continued for 30 minutes, with arterial blood drawn at 5 mL/min for 15 minutes, then 2 mL/min for 15 minutes (IVAC572 peristaltic pump; Lily Industries, San Diego, CA, U.S.A.) through a Bismuth Germinate Oxalate Crystal Fluid Analyzer (Allogg, Stockholm, Sweden). Timed 2-mL hand-drawn arterial blood samples were taken at 5-minute intervals throughout the period of the scan. One milliliter was used for measurement of plasma glucose and lactate, and the other milliliter was used to measure the plasma tracer radioactivity concentration in a well counter. The well-counter measurements were used to calibrate the online fluid analyzer data appropriately for subsequent analysis.
At the end of the 18FDG scan, the infusion was stopped and both arterial and intravenous lines removed. Before conducting second scans, the previous arterial cannulation site was examined and the hand was reexamined for collateral circulation.
On separate occasions, each subject also underwent a standard magnetic resonance imaging brain scan for anatomic detail for later coregistration with the PET images to obtain data from brain regions of interest.
Data analyses
All images were reconstructed by filtered back-projection and smoothed with a Hanning filter, such that the spatial resolution was 8.5-mm full-width at half maximum both transaxially and axially. Reconstructed images were displayed in a matrix of 128 × 128 × 31-voxel format, each voxel measuring 2.0 × 2.0 × 3.43 mm. FDG uptake images were formed by summation of images acquired between 30 and 60 minutes postinjection.
Whole-brain rate of glucose uptake with and without lactate
For each PET study, the dynamic PET image data and the arterial input function were combined to produce a parametric image of the rate of glucose utilization using the generic method described by Patlak et al. (1983). This method requires that concentrations of unbound FDG in plasma and tissue rapidly reach equilibrium, and that phosphorylated FDG remains trapped in tissue for the duration of the study. The work of Phelps et al. (1979) has shown that these assumptions are valid for FDG in the brain. This procedure provides a measure of the rate of glucose utilization that is independent of changes in the arterial tracer and glucose concentration between subjects and between studies. To provide a quantitative value for the rate of glucose uptake it is necessary to apply a “lumped constant” (LC), which accounts for the difference in behavior between FDG and native glucose. We used the value of 0.52 for LC (Reivich et al., 1985) because this has been commonly used in the literature. More recent measurements suggest that the true value of LC at normoglycemia is probably in the range 0.8 to 0.9 (Hasselbalch et al., 2001, Graham et al., 2002), and we also give the global rates of glucose utilization calculated with a LC of 0.8. The value chosen for LC is applied as a simple scaling factor and does not affect the statistical significance of our results. The average whole-brain rate of glucose uptake was calculated for the two different conditions (i.e., with lactate or with bicarbonate) by addition of all brain image slices after application of a 40% threshold to exclude noncerebral tissue activity.
The SPM analysis was performed on the 30- to 60-minute summed uptake images, which have superior signal-to-noise properties to the quantitative Patlak images. Each subject's scan was transformed into standard stereotactic space using a 12-parameter linear transformation, followed by a nonlinear deformation using basis functions to allow for intersubject averaging and comparisons (Friston et al., 1995, 1996). Smoothing using a Gaussian kernel of 20 mm was performed to allow for intraindividual differences in gyral anatomy and to increase the signal-to-noise ratio. The effect of variation in whole-brain FDG uptake among different scans from differing injected activities, plasma glucose concentrations, and plasma FDG concentrations was removed by scaling voxel values to the mean whole-brain uptake.
Comparisons to determine the effect of lactate or bicarbonate infusion were made by definition of the appropriately weighted linear contrasts within SPM99, and SPM t maps of voxel-byvoxel t statistics were generated. In this exploratory analysis, clusters of voxels surviving an equivalent threshold Z score >3.09 (omnibus threshold P < 0.001), uncorrected for multiple comparisons, were considered to show significant differences (Friston et al., 1996). To enhance anatomic localization, the locations of volumes of change were displayed by rendering the maximum intensity map onto orthogonal planes of a high-resolution T1-weighted MRI brain scan in Talairach space provided with the SPM99 software (Studholme et al., 1997).
To investigate potential differential changes between gray and white matter in particular, a region of interest (ROI) analysis was also performed. Ten-millimeter-diameter ROIs were placed over cortical gray matter, the basal ganglia, and white matter on the MR scans and than transferred to coregistered PET images. The analysis was done on both the Patlak data and on the raw FDG uptake data, as the signal to noise ratio is greater with the latter.
Statistical analysis
Data are presented as mean ± SD unless otherwise stated. Metabolic data were compared between the lactate and bicarbonate groups by analysis of variance (ANOVA) with repeated measures design. Whole-brain FDG uptake data were compared using paired t tests. These analyses were carried out using SPSS for Windows 10.5 (SPSS, Chicago, IL, U.S.A.).
RESULTS
Biochemical changes
There was no difference in plasma glucose concentration at baseline or during the studies between lactate and bicarbonate (5.3 ± 0.23 vs. 5.2 ± 0.54, P = 0.62; 5.3 ± 0.24 vs. 5.2 ± 0.21 mmol/L, P = 0.55). The coefficient of variation of the plasma glucose during each study was 1.04% and 0.87% respectively (Fig. 1). As shown in Fig. 2, the plasma lactate concentration rose significantly, resulting in marked hyperlactemia during the lactate infusion compared with the bicarbonate study (0.62 ± 0.12 to 4.08 ± 0.35 vs. 0.85 ± 0.24 to 0.63 ± 0.22 mmol/L, P < 0.0005). pH values were not different between the two groups at baseline (7.39 ± 0.03 vs. 7.39 ± 0.01, P = 0.39) and increased significantly in both groups during infusion (7.39 ± 0.03 to 7.47 ± 0.03, P = 0.0007; 7.39 ± 0.01 to 7.42 ± 0.01, P = 0.0004). The rise in pH was greater in the lactate group, P = 0.004.
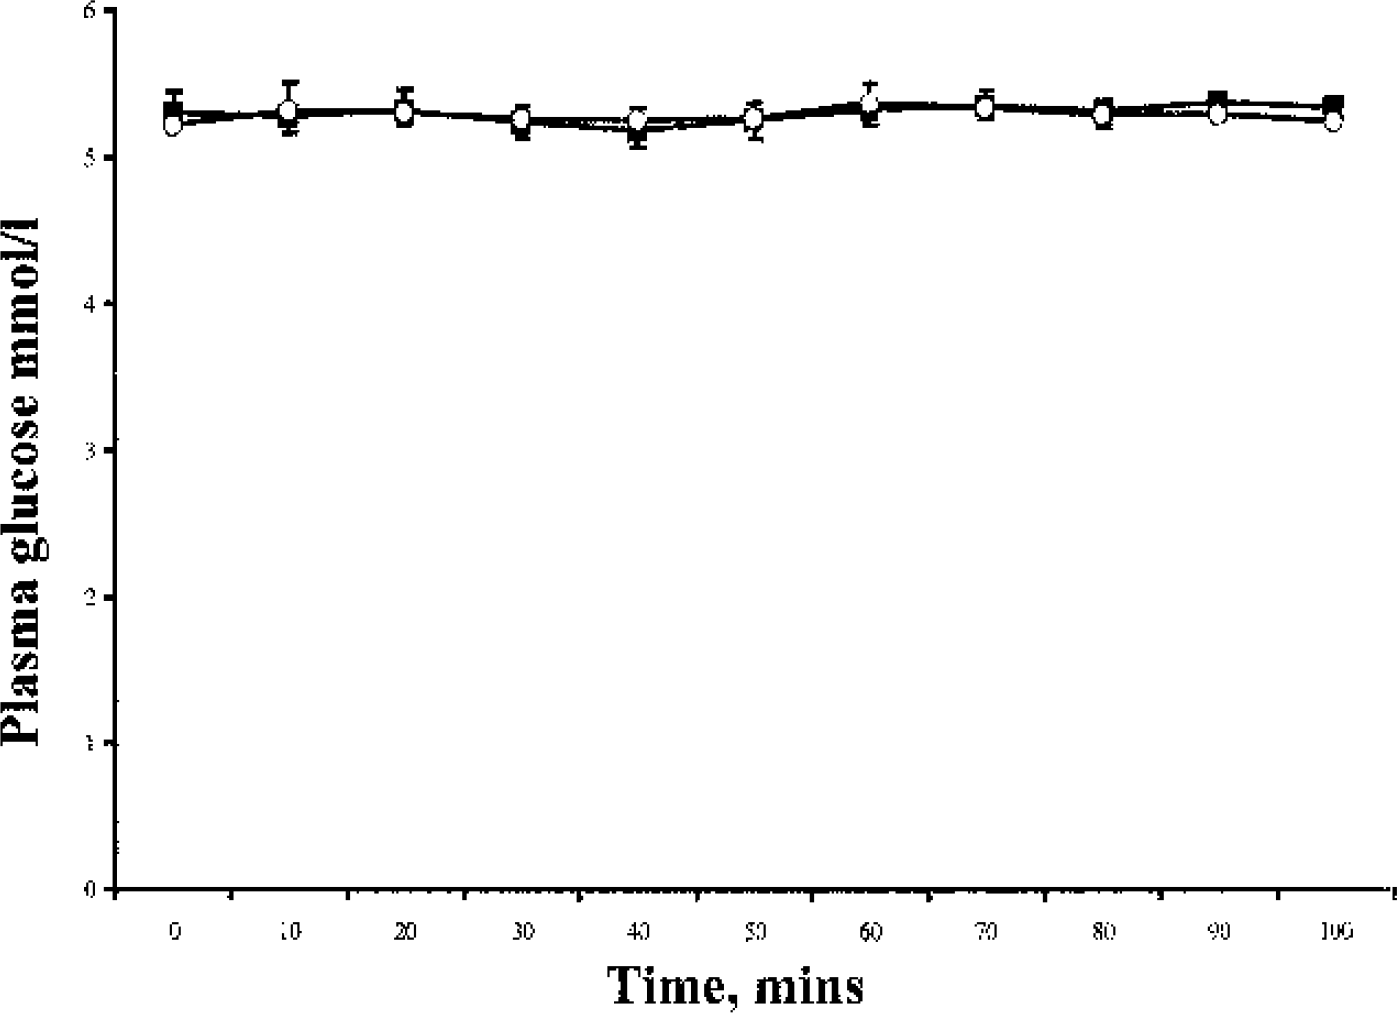
Plasma glucose concentration during the lactate and bicarbonate infusions. Data are expressed as mean ± SE. Open circles, bicarbonate; Solid squares, lactate study.
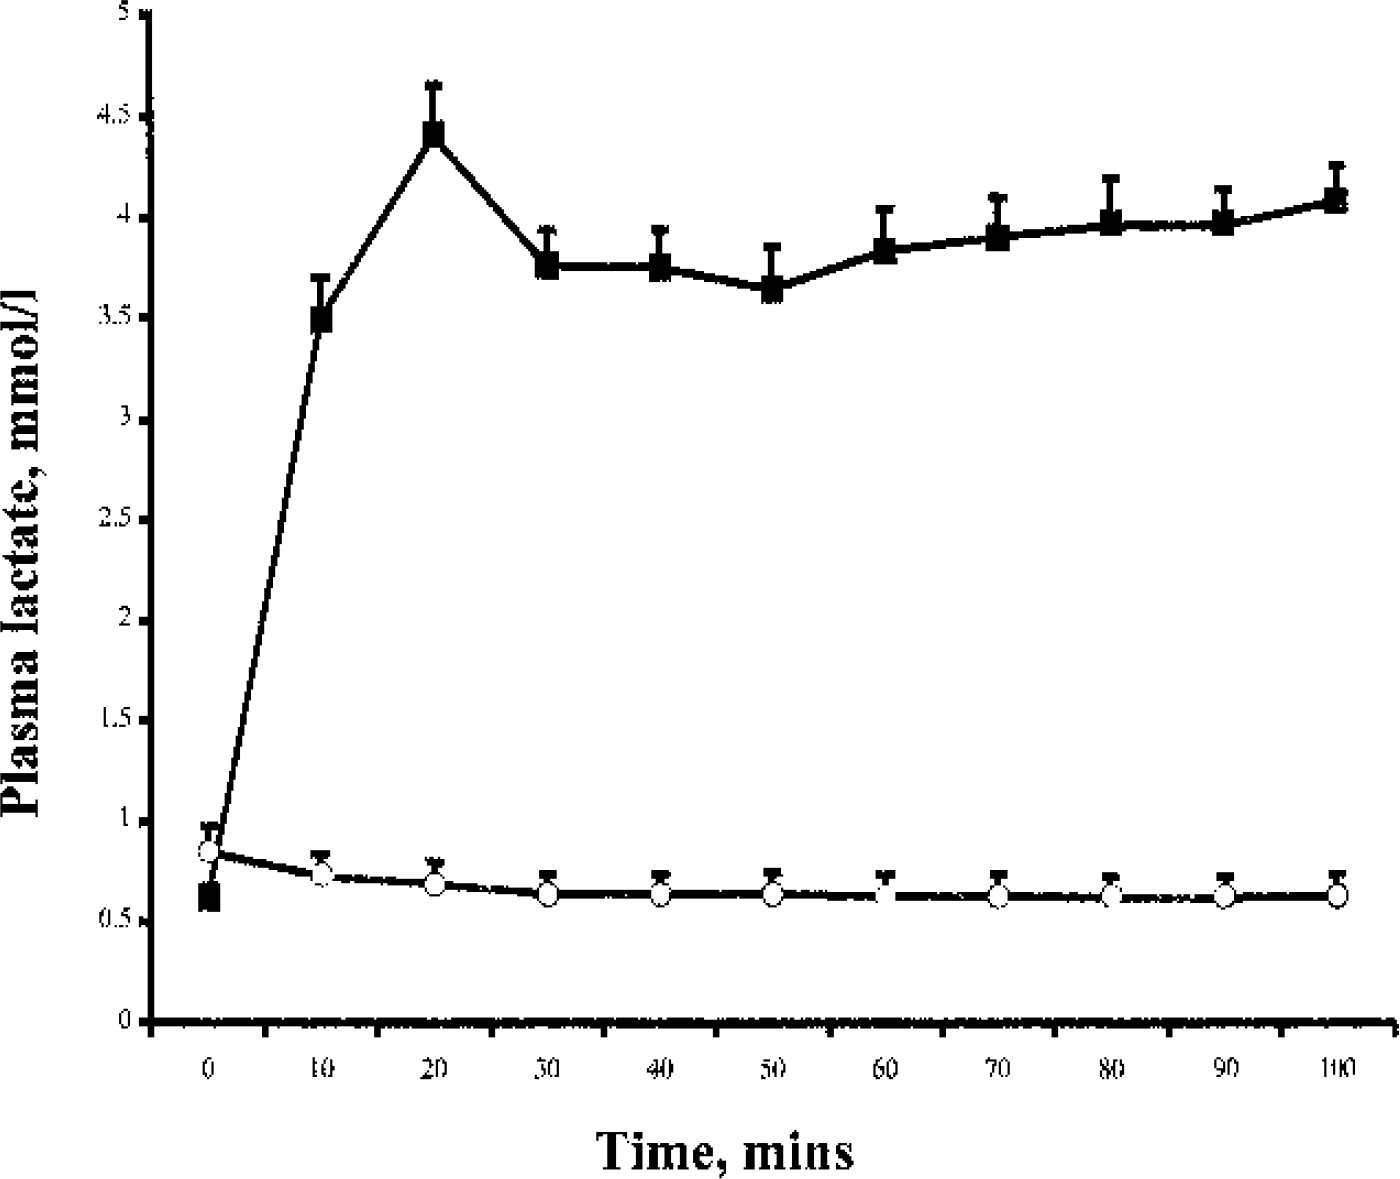
Plasma lactate concentrations during the lactate and bicarbonate infusions. The arrow represents the time of injection of the 18FDG tracer. Data are expressed as mean ± SE. The symbols are the same as those used in Fig. 1.
Whole-brain rate of glucose uptake
Whole-brain rate of glucose uptake was significantly lower in the lactate group with a 17% reduction in brain FDG uptake compared with the bicarbonate group (0.195 ± 0.02 and 0.234 ± 0.02 μmol · g−1 · min−1, P < 0.001). As shown in Fig. 3, all eight subjects showed a reduction in brain glucose uptake; this ranged between 11% and 30% in seven subjects, but was only 3% in the eighth subject. It should be noted that if a LC of 0.8 is used, the data for global CMRglu translate to 0.127 ± 0.014 and 0.152 ± 0.012 μmol · g−1 · min−1 (P < 0.001).
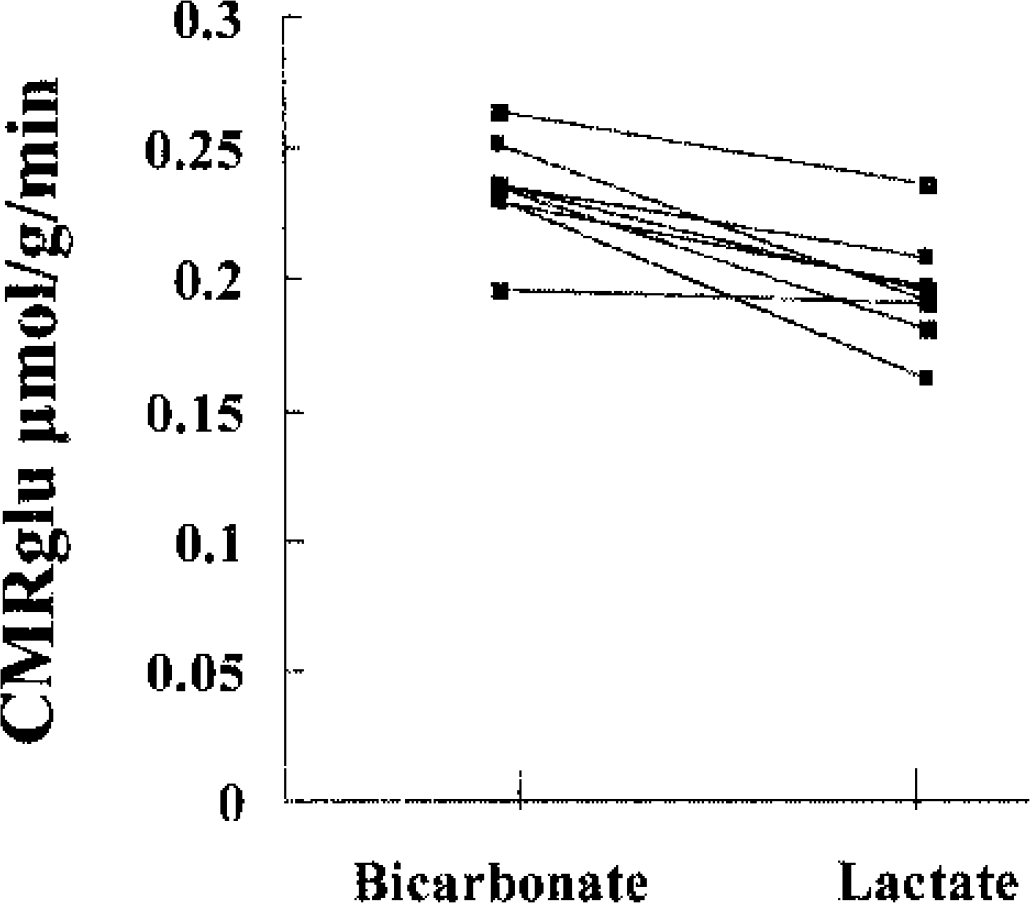
Calculated cerebral glucose uptake (μmol · g−1 · min−1) in individual subjects. The bicarbonate infusion data are displayed on the left, while the lactate data can be found on the right.
Regional changes
Figure 4 shows the result of the SPM analysis. No significant regional differences between the lactate and bicarbonate studies were identified. With the display set as in the Figure (SPM height threshold t + 1.89), a large area in the center of the brain and excluding cortical gray matter is seen. This is consistent with there being a larger fall in CMRglu in gray matter than in the white matter during lactate infusion; however, the region does not reach significance.
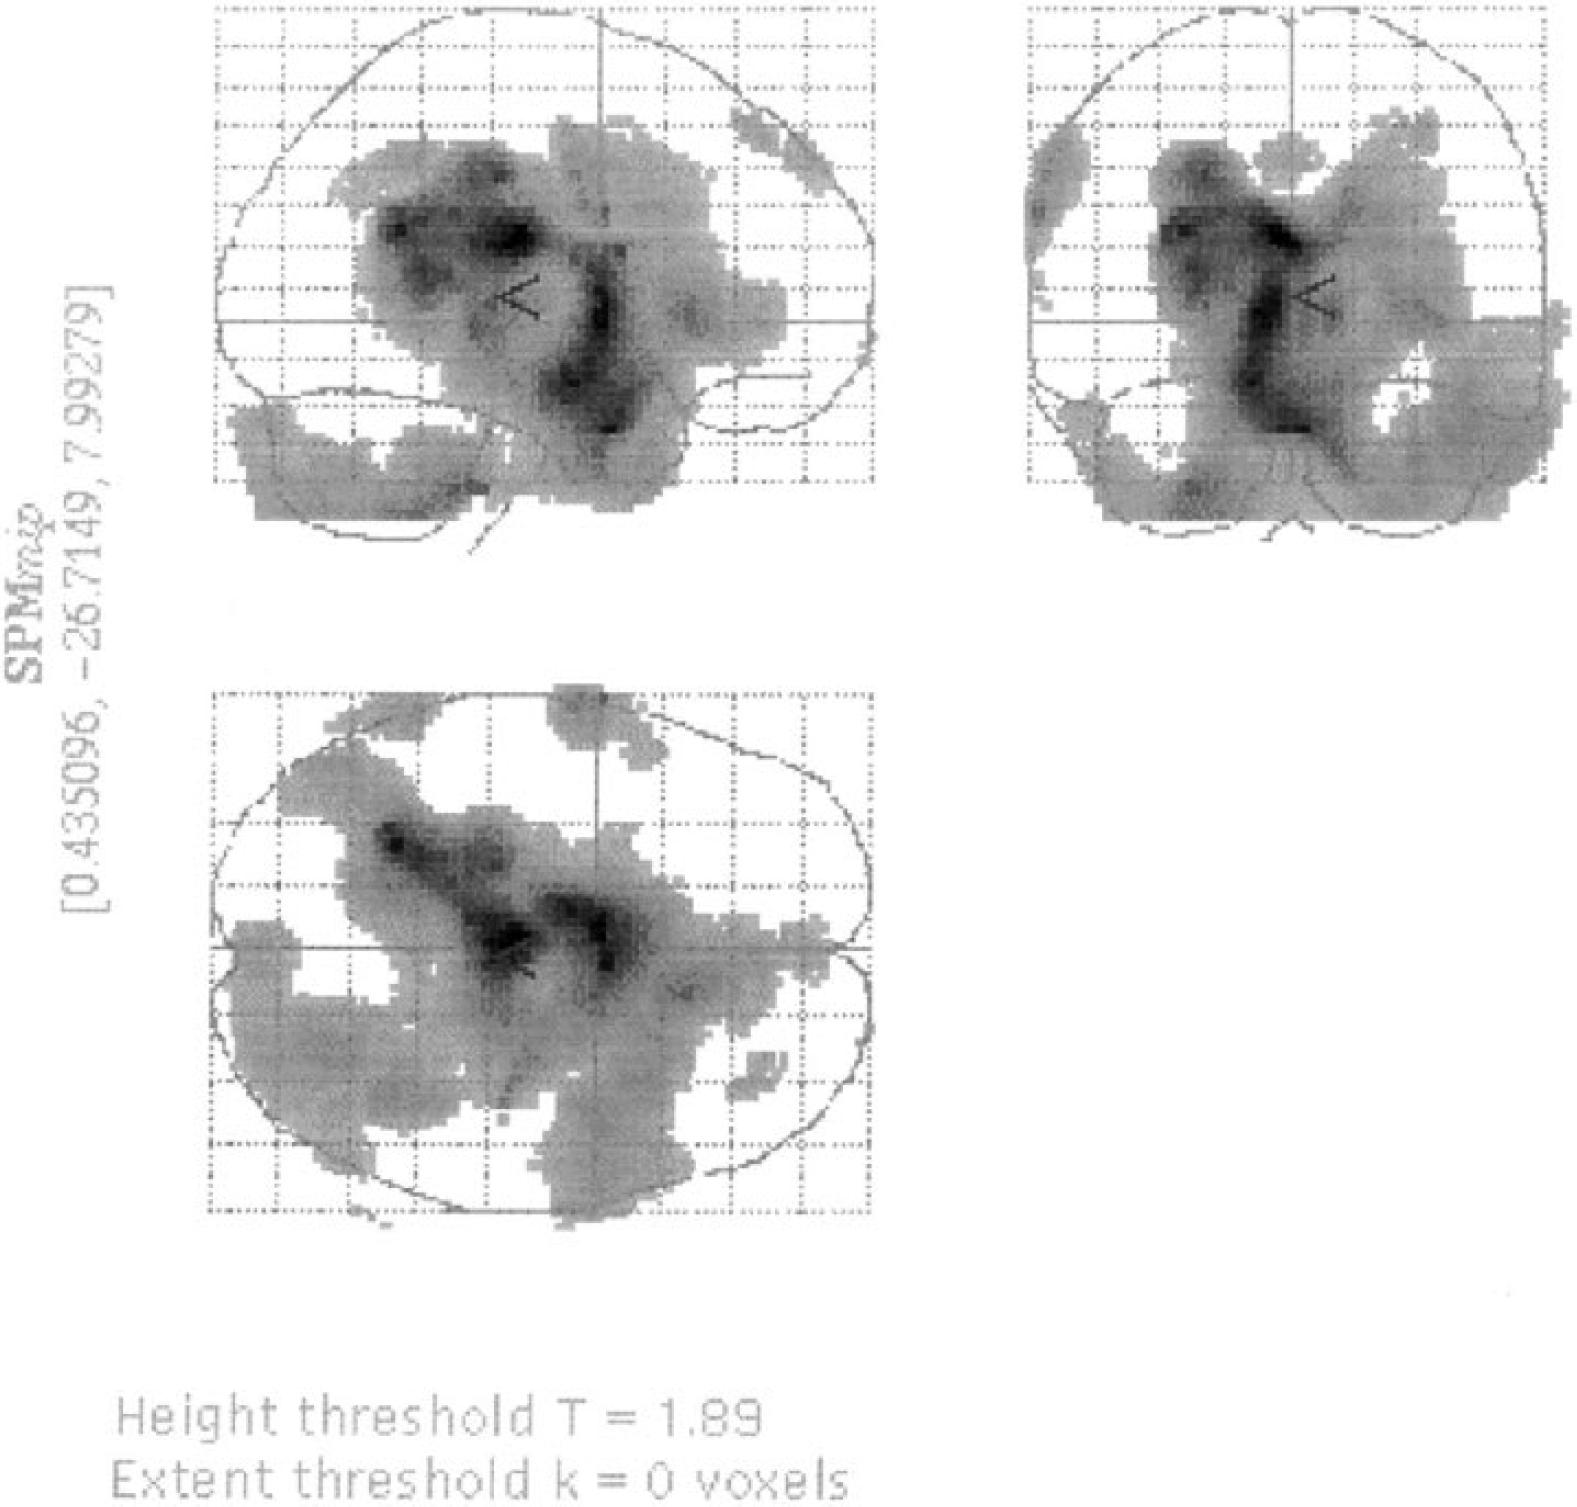
Statistical parametric maps indicating regional differences between the lactate and bicarbonate studies. All areas indicated are below the level of significance.
Regional CMRglu values obtained in the ROI analysis are shown in Table 1. Both gray and white matter regions showed lower values of CMRglu with lactate than with bicarbonate (cortical gray matter, 0.225 ± 0.030 vs. 0.273 ± 0.027 μmol · g−1 · min−1, P = 0.0013; basal ganglia, 0.221 ± 0.029 vs. 0.258 ± 0.030 μmol · g−1 · min−1, P = 0.021; white matter, 0.125 ± 0.023 vs. 0.158 ± 0.022 μmol · g−1 · min−1, P = 0.0045). The average differences (bicarbonate-lactate) observed in the ratio between gray and white matter were −5.1% (P = 0.44) for the Patlak data and 2.4% (P = 0.22) for the raw FDG uptake data, neither being significant.
Regional CMRglu values in umol/g/min
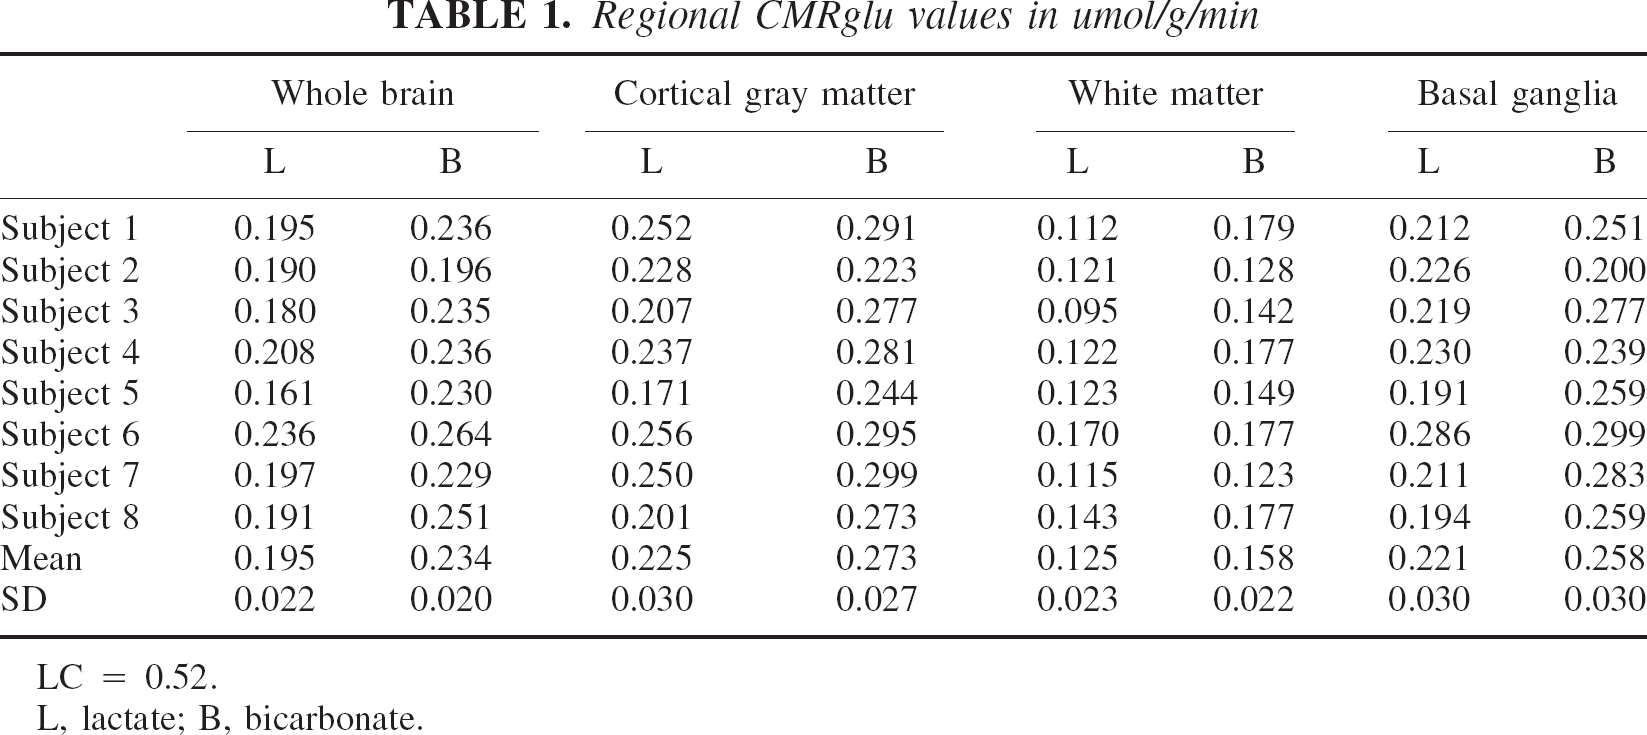
LC = 0.52.
L, lactate; B, bicarbonate.
DISCUSSION
Lactate can cross the blood–brain barrier with a permeability about 50% that of glucose (Knudsen et al., 1991) and is capable of sustaining cerebral function during times of glucose deprivation (King et al., 1997, 1998; Maran et al., 1994; Veneman et al., 1994). However, its potential to act as an alternate or preferred fuel to glucose in sustaining neuronal function at normal blood glucose concentrations in humans is unknown. Using FDG-PET we have shown a 17% reduction in whole-brain rate of glucose uptake during a systemic infusion of lactate at euglycemia. This is compatible with the hypothesis that the human brain can access circulating lactate and then use it in preference to glucose as a metabolic fuel.
The global reduction in CMRglu in the presence of lactate could be related to generalized feedback inhibition secondary to increased availability of pyruvate for oxidation. The observation of a greater effect in gray matter would indicate a selective effect of lactate on neuronal metabolism; however, we cannot conclude this from our data. Owing to contamination of small white matter regions by gray matter, it is difficult to obtain reliable values for white matter alone, and so it may be that the increase in white matter that we observed is artefactual. It is interesting that a central region largely excluding gray matter was seen with the SPM map, but it was below the commonly accepted significance threshold for SPM. Our observations may still therefore be compatible with an increase in CMRglu for gray matter alone, but the quality of the data is not adequate to confirm this.
Recent in vitro evidence shows that, even when glucose is fully available, neurons use lactate in preference to glucose to sustain function, particularly during times of neuronal activation (Larrabee, 1995; Schurr et al., 1988, 1999). The astrocyte-neuron lactate shuttle hypothesis states that neural activity increases the extracellular concentration of the excitatory neurotransmitter glutamate, the uptake of which by brain astrocytes stimulates astrocyte Na+ − K+ ATPase, glucose uptake, and aerobic glycolysis, with consumption of glucose and production of lactate (Magistretti and Pellerin, 1997; Pellerin and Magistretti, 1997). The lactate then leaves the astrocyte and is taken up by neurons as an aerobic energy substrate (Schurr et al., 1999). In the neuron, the lactate enters the tricarboxylic acid cycle (TCA) via pyruvate, such that one lactate molecule entering the TCA cycle can yield 17 ATP molecules in the presence of normal oxygen and glucose (Magistretti and Pellerin, 1997). The conversion of lactate to pyruvate for entry into the TCA cycle is preferred thermodynamically over the conversion of glucose to pyruvate because the latter requires the investment of ATP, whereas the former does not (Magistretti and Pellerin, 1997). Exogenous lactate from the peripheral circulation, crossing the blood–brain barrier, would provide lactate directly for entry into the neuron to serve as the primary fuel for neural activity. Such a mechanism would explain our data.
Traditionally it has been thought that systemic lactate could not act as an energy substrate for neurons (Pardridge and Oldendorf, 1977). The blood–brain barrier contains the messenger RNA for the MCTs necessary for the transport of lactate across cellular membranes (Hanu et al., 2000; Price et al., 1998) and is permeable to lactate (Knudsen et al., 1991). The ability of elevated circulating lactate to reduce the symptoms, cognitive dysfunction, and centrally mediated counterregulatory hormone responses to acute hypoglycemia, when elevated either by exercise (Coyle et al., 1986; Felig et al., 1982) or by infusion (King et al., 1998; Maran et al., 1994; Veneman et al., 1994) in human studies, attests to the ability of the lactate to cross the blood–brain barrier in humans and replace glucose as a neuronal metabolic fuel when glucose supplies from the circulation are reduced. However, the present study is the first to show a reduction in brain glucose metabolism during normal glucose availability in humans. In our study, lactate concentrations rose to a similar degree observed during moderate exercise (Hirsch et al., 1989; Stanley et al., 1985) and in the acute hypoglycemia studies of Veneman et al. (1994) and King et al. (1998).
Might there be another explanation for the reduction in rate of glucose uptake observed in our lactate-infusion study? We used sodium bicarbonate as a control to mimic the changes in acid–base balance induced by lactate infusion. Although we achieved a significant rise in pH during both studies, the rise was greater in the lactate group. There are data to show that extracellular acidification increases lactate uptake into cells both in vitro (Lomneth et al., 1990; McKenna et al., 1998; Walz and Mukerji 1990) and in vivo (Knudsen et al., 1991). Therefore, the raised pH of our study may have inhibited cell lactate uptake, reducing the observable effect on glucose metabolism. In other words, the change in pH could have only reduced the magnitude of the effect observed. Might changes in cerebral blood flow account for the reduction in rate of glucose uptake? Infusion of hypertonic sodium lactate in a porcine model of focal cryogenic brain injury increased cerebral blood flow and oxygen delivery compared with placebo (Shackford et al., 1992). Cerebral blood flow was not measured in this study; however, an increase in cerebral blood flow alone (i.e., without an accompanying increase in the rate of glucose uptake) would not explain the observed change in rate of glucose uptake. Owing to the low permeability surface area product for glucose and FDG, the rate of glucose uptake as determined by PET is very insensitive to changes in blood flow (Huang and Phelps, 1986).
Although different isoforms of MCT transporters and the enzyme lactate dehydrogenase may predominate in different brain cells and regions, both are found in astrocytes and neurons throughout the brain, supporting the concepts of the lactate shuttle and the use of lactate by the whole brain. MCT2, found in tissues that take up rather than release lactate (Pellerin et al., 1998; Pierre et al., 2002), and LDH5, which preferentially catalyzes the conversion of lactate to pyruvate (Bittar et al., 1996), are both characteristic of neurons.
In conclusion, our data support the hypothesis that the human brain uses circulating lactate, at least to some extent in preference to glucose to sustain metabolism at normal blood glucose concentrations. This finding helps us understand more about human brain glucose metabolism and illustrates the potential therapeutic benefits of lactate in protecting and sustaining normal brain function.
Footnotes
Acknowledgments:
The authors thank Paul Forsey (Pharmacy Department, St. Thomas' Hospital) for preparing the sodium lactate used in these experiments, and the staff of the St Thomas Clinical PET Center for their invaluable support in running these studies.