
Abstract
To evaluate the true meaning of N-acetyl-aspartate (NAA) measurements in ischemic stroke, the authors followed the temporal changes in brain NAA content in rats subjected to permanent focal ischemia. Ischemia was induced by photothrombotic cortical occlusion. At 1, 3, 8, and 30 d after onset of ischemia, NAA was measured in the infarct by high-performance liquid chromatography coupled to ultraviolet detection and histologic damage was examined. Cerebral content of NAA was markedly reduced in the lesioned tissue, reaching −90% after 3 d, a time at which viable neurons were no longer detected. N-Acetyl-aspartate concentrations after 8 and 30 d were higher than that observed after 3 d. This metabolic change coincided with an important microglial and astroglial activation. The results of this study raise questions regarding the use of NAA as a specific neuronal marker in chronic stage of stroke.
Keywords
N-Acetyl-aspartate (NAA) contributes to the most prominent signal in proton magnetic resonance spectroscopy (1H-MRS) and is conventionally considered to be exclusively located in neurons in the adult brain (Moffett et al., 1991; Simmons et al., 1991). Therefore, NAA has largely been used as a biochemical marker to investigate the neuronal pathologic state in various kinds of injuries, including brain ischemia, epilepsy, Parkinson disease, and multiple sclerosis (for a review, see Bonavita et al., 1999; Burlina et al., 2000). In stroke patients, a marked decrease in NAA concentration occurs in the early stage of ischemia. This decrease has generally been considered as an indication of neuronal loss; this interpretation, however, is too simplistic because cerebral dysfunction in the absence of neuronal death also causes important NAA depletion that can be reversed spontaneously or after therapeutic interventions (Dautry et al., 2000; Demougeot et al., 2001; De Stefano et al., 1995; Kalra et al., 1998).
Furthermore, when scrutinizing the individual data of the few existing longitudinal studies on the temporal changes of NAA in stroke patients, one finds that several patients exhibited long-term NAA recovery (Gideon et al., 1992, 1994; Graham et al., 1992; Saunders et al., 1995; Wardlaw et al., 1998). One explanation for this observation might be that the increase in NAA in the lesioned tissue was artifactual (Wardlaw et al., 1998) because the signal amplitude in 1H-MRS can be influenced by the modified molecule mobility due to the change in their environment (Malisza et al., 1998). To evaluate the true meaning of NAA measurements in ischemic stroke, we followed the temporal changes in brain NAA content in rats subjected to permanent focal ischemia. NAA was measured in the infarct by high-performance liquid chromatography coupled to ultraviolet detection, and the kinetics of the subsequent changes were followed over a period of 30 d.
MATERIALS AND METHODS
The experiments were carried out on male Wistar rats (300 to 320 g; Depré, Saint-Doulchard, France) and were conducted according to French Department of Agriculture guidelines (license no. 21CAE035). All measurements were made 1, 3, 8, and 30 d after the onset of ischemia.
Brain ischemia
Permanent focal ischemia was induced by photothrombotic cortical occlusion (Watson et al., 1985). This model is well adapted to both spatial and temporal investigations because it produces reproducible lesions and permits excellent long-term survival. The technique was the same as that previously described in detail (Oubidar et al., 1994) with few modifications. Briefly, chloral-anesthetized rats were infused for 20 seconds with the photosensitizer dye rose bengal (20 mg/kg, intravenously) and a laser beam was focused through the skull on the right hemisphere (1 mm posterior and 3 mm lateral relative to the bregma) by means of an optic fiber (1-mm interior diameter, emerging power 90 mW), using a diode-pumped solid-state laser (LCS-DLT-312; Opton Laser International, Orsay, France) working at 532 nm. The skull was irradiated for 5 minutes, the irradiation beginning 30 seconds before the dye injection.
Histology
Animals were transcardially perfused with saline and, in some studies, further perfused with FAM (formol 37%, acetic acid 100%, methanol 1:1:8 volume) solution.
Assessment of lesion size.
The size of the cortical lesion was determined on brains perfused only with saline. The removed brains were frozen in isopentane at −40°C and stored at −80°C. Coronal sections (50-μm thick) were cut in a cryostat at −13°C at 200-μm intervals, collected on slides, and stained with cresyl violet (0.4%). Injured cortical areas were measured using an image analyzer (Scion Image; NIH, Bethesda, MD, U.S.A.) and the distances between respective coronal sections were used to calculate a linear integration for the lesion volume.
Microglia, astroglia, and mast cell detection.
Microglia, astroglia, and mast cell detection were performed on brains perfused with the fixative FAM solution. The removed brains were postfixed in the same fixative for 1 week, dehydrated in ethanol, and embedded in paraffin. Coronal sections (10-μm thick) including the lesion were deparaffinized, rehydrated, and treated simultaneously.
Microglial and astroglial activation was detected as previously described in detail (Garnier et al., 2001) by isolectin B4 (ILB4) histochemistry and glial fibrillary acidic protein (GFAP) immunohistochemistry, respectively. Mast cell infiltration was detected after toluidine blue staining (0.5%, pH 2.5) at room temperature for 10 minutes. The sections were then incubated with ammonium molybdate (1%) for 10 minutes, dehydrated in ethanol, and coverslipped in Eukitt (O. Kindler, GmbH, Freiburg, Germany) mounting medium. Some sections were only stained with hematoxylin.
N-Acetyl-aspartate measurements
The NAA measurements were performed in two cortical punched regions (∼20 mg of tissue) of rats transcardially perfused with saline. The brains were quickly removed and the cerebral cortices dissected and spread on a glass slide at 0°C. One punch was centered on the infarct that was macroscopically readily observable. Indeed, recent or old petechial hemorrhages were visible in the center of the lesion until day 8, whereas the lesion appeared as a circular hollow at day 30. The second punch was performed in the contralateral hemisphere, symmetrically to the lesion. The interior diameter of the punch (2.8 mm) was determined from the histologic assessment of the lesion obtained on postischemia day 30, so that edema had regressed and the matured lesion was minimal; this was designed to avoid inclusion of periinfarct tissue in the punch. Control values were obtained from nonoperated rats transcardially perfused with saline.
The NAA analysis was performed by high-performance liquid chromatography coupled to ultraviolet detection at 206 nm after anion exchange separation, as previously described in detail (Demougeot et al., 2001). The values were expressed as nanomoles per milligram protein. Total protein was measured by the method of Lowry et al. (1951). Differences between groups were determined by analysis of variance (one-way ANOVA) followed by the Bonferroni test. Values are given as mean ± SD.
RESULTS
Temporal changes in lesion volume
Serial coronal slices used to calculate the lesion volume indicated that the cortical lesion was truncated, cone shaped, and well demarcated, with circular upper and bottom sections. The diameter of the upper section was 1.5-fold that of the bottom. As illustrated in Fig. 1, the volume of the lesion was maximal at postictus day 1 (73.4 mm3) and regressed to 17.5 mm3 after 30 d (Table 1). At this time, the upper and bottom diameters of the lesion were 4.5 ± 0.6 and 3.1 ± 0.7 mm, respectively.
Evolution of infarct volume after laser irradiation
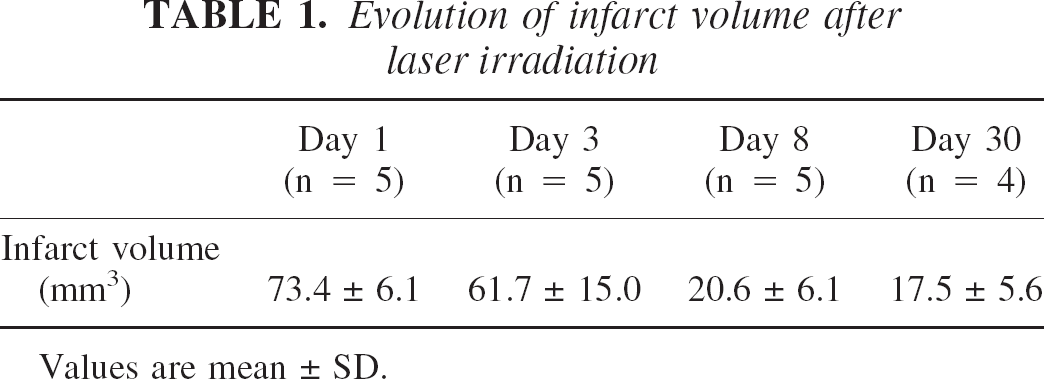
Values are mean ± SD.
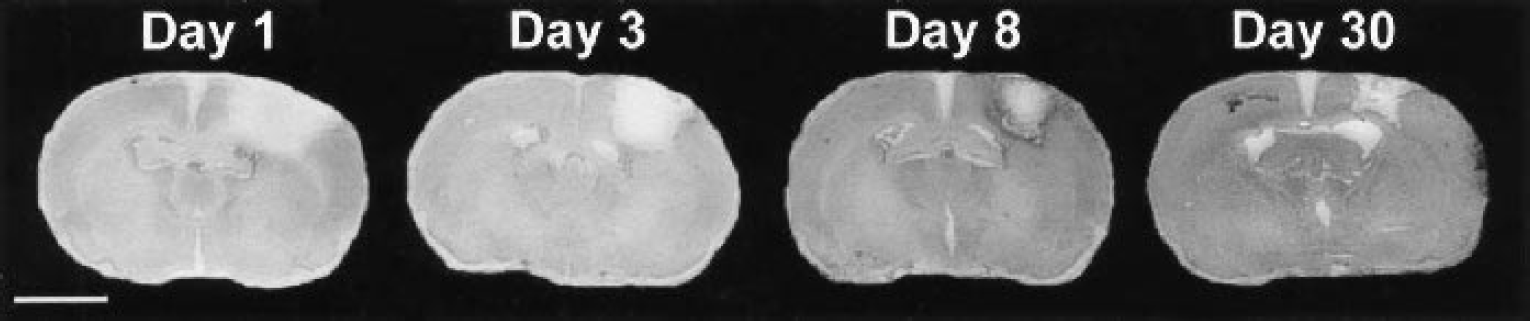
Coronal sections of ischemic brain at day 1, 3, 8, and 30 after irradiation. Sections (50-μm thick) were stained with cresyl violet. Scale bar = 6 mm.
Histologic damage
Histologic damage was examined on paraffinized sections obtained from brains perfused with the fixative FAM solution (five rats at each time). Such histologic processing led to severe tissue shrinkage, and the size of the lesion appeared smaller than that observed on slices stained with cresyl violet.
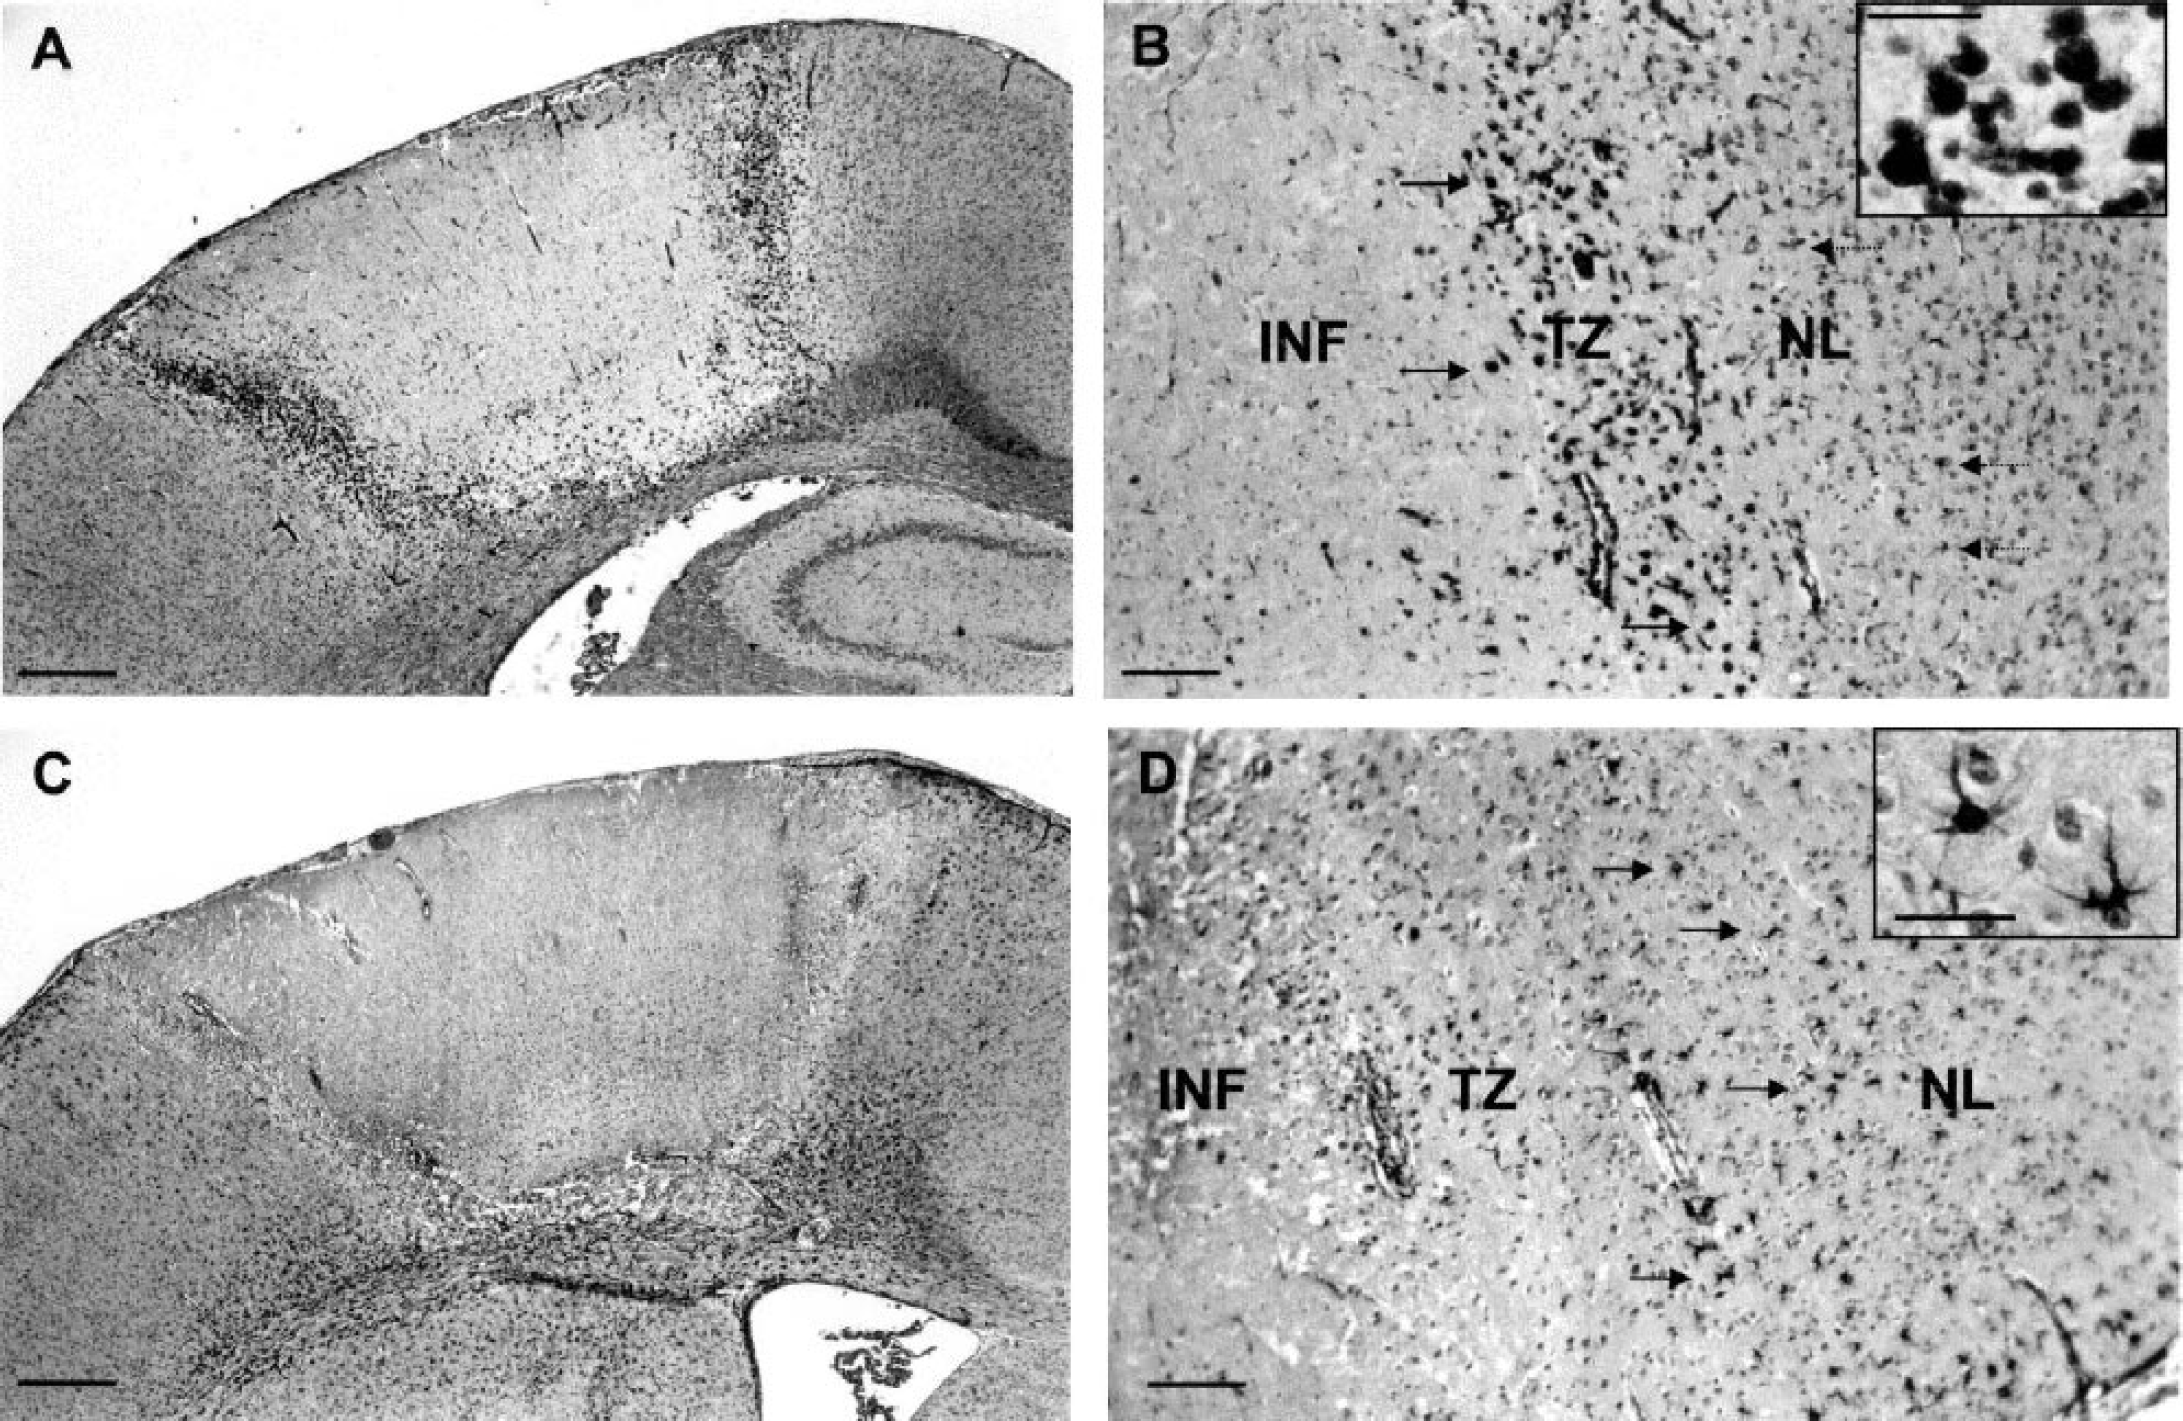
By day 1 after photothrombosis (Fig. 2), the cortical infarcted area appeared as a sharply demarcated pale region. Massive neuronal loss was found throughout the infarct and the few remaining neurons exhibited pyknotic and shrunken nuclei. The transition zone surrounding the infarcted region consisted of a mixed of morphologically normal and abnormal neurons. In the nonlesioned tissue adjacent to the transition zone, a few stellate microglial cells but no reactive astrocytes were observed. By day 3 (Fig. 3), only ghost neurons were observed in the infarct in which there was a marked infiltration of neutrophils (not shown). The transition zone consisted of a large number of ameboid microglial cells, whereas reactive astrocytes and stellate microglial cells now formed a ring around this zone. By day 8 (Fig. 4), the edges of the infarct were well demarcated because the transition zone had disappeared. At this stage, phagocytic microglia–macrophages had fully invaded the infarct in which we noticed the presence of ILB4- and GFAP-negative cells exhibiting small nuclei. Some mitotic cells were visible at the edges of the infarct (not shown). Moreover, the number of reactive astrocytes was increased around the lesion. By day 30 (Fig. 5), the infarct had undergone considerable changes. The lesion consisted of atrophic tissue containing cystic cavities and amorphous deposits of fibrinlike material. At this stage, the density of phagocytic microglia–macrophages was tremendously reduced, but ILB4- and GFAP-negative cells were still present. As compared with day 8, the number of reactive astrocytes was enhanced at the bottom of the infarct but decreased in the right and left border zones. Whatever the time studied, no mast cells were detected within the ischemic lesion (not shown).
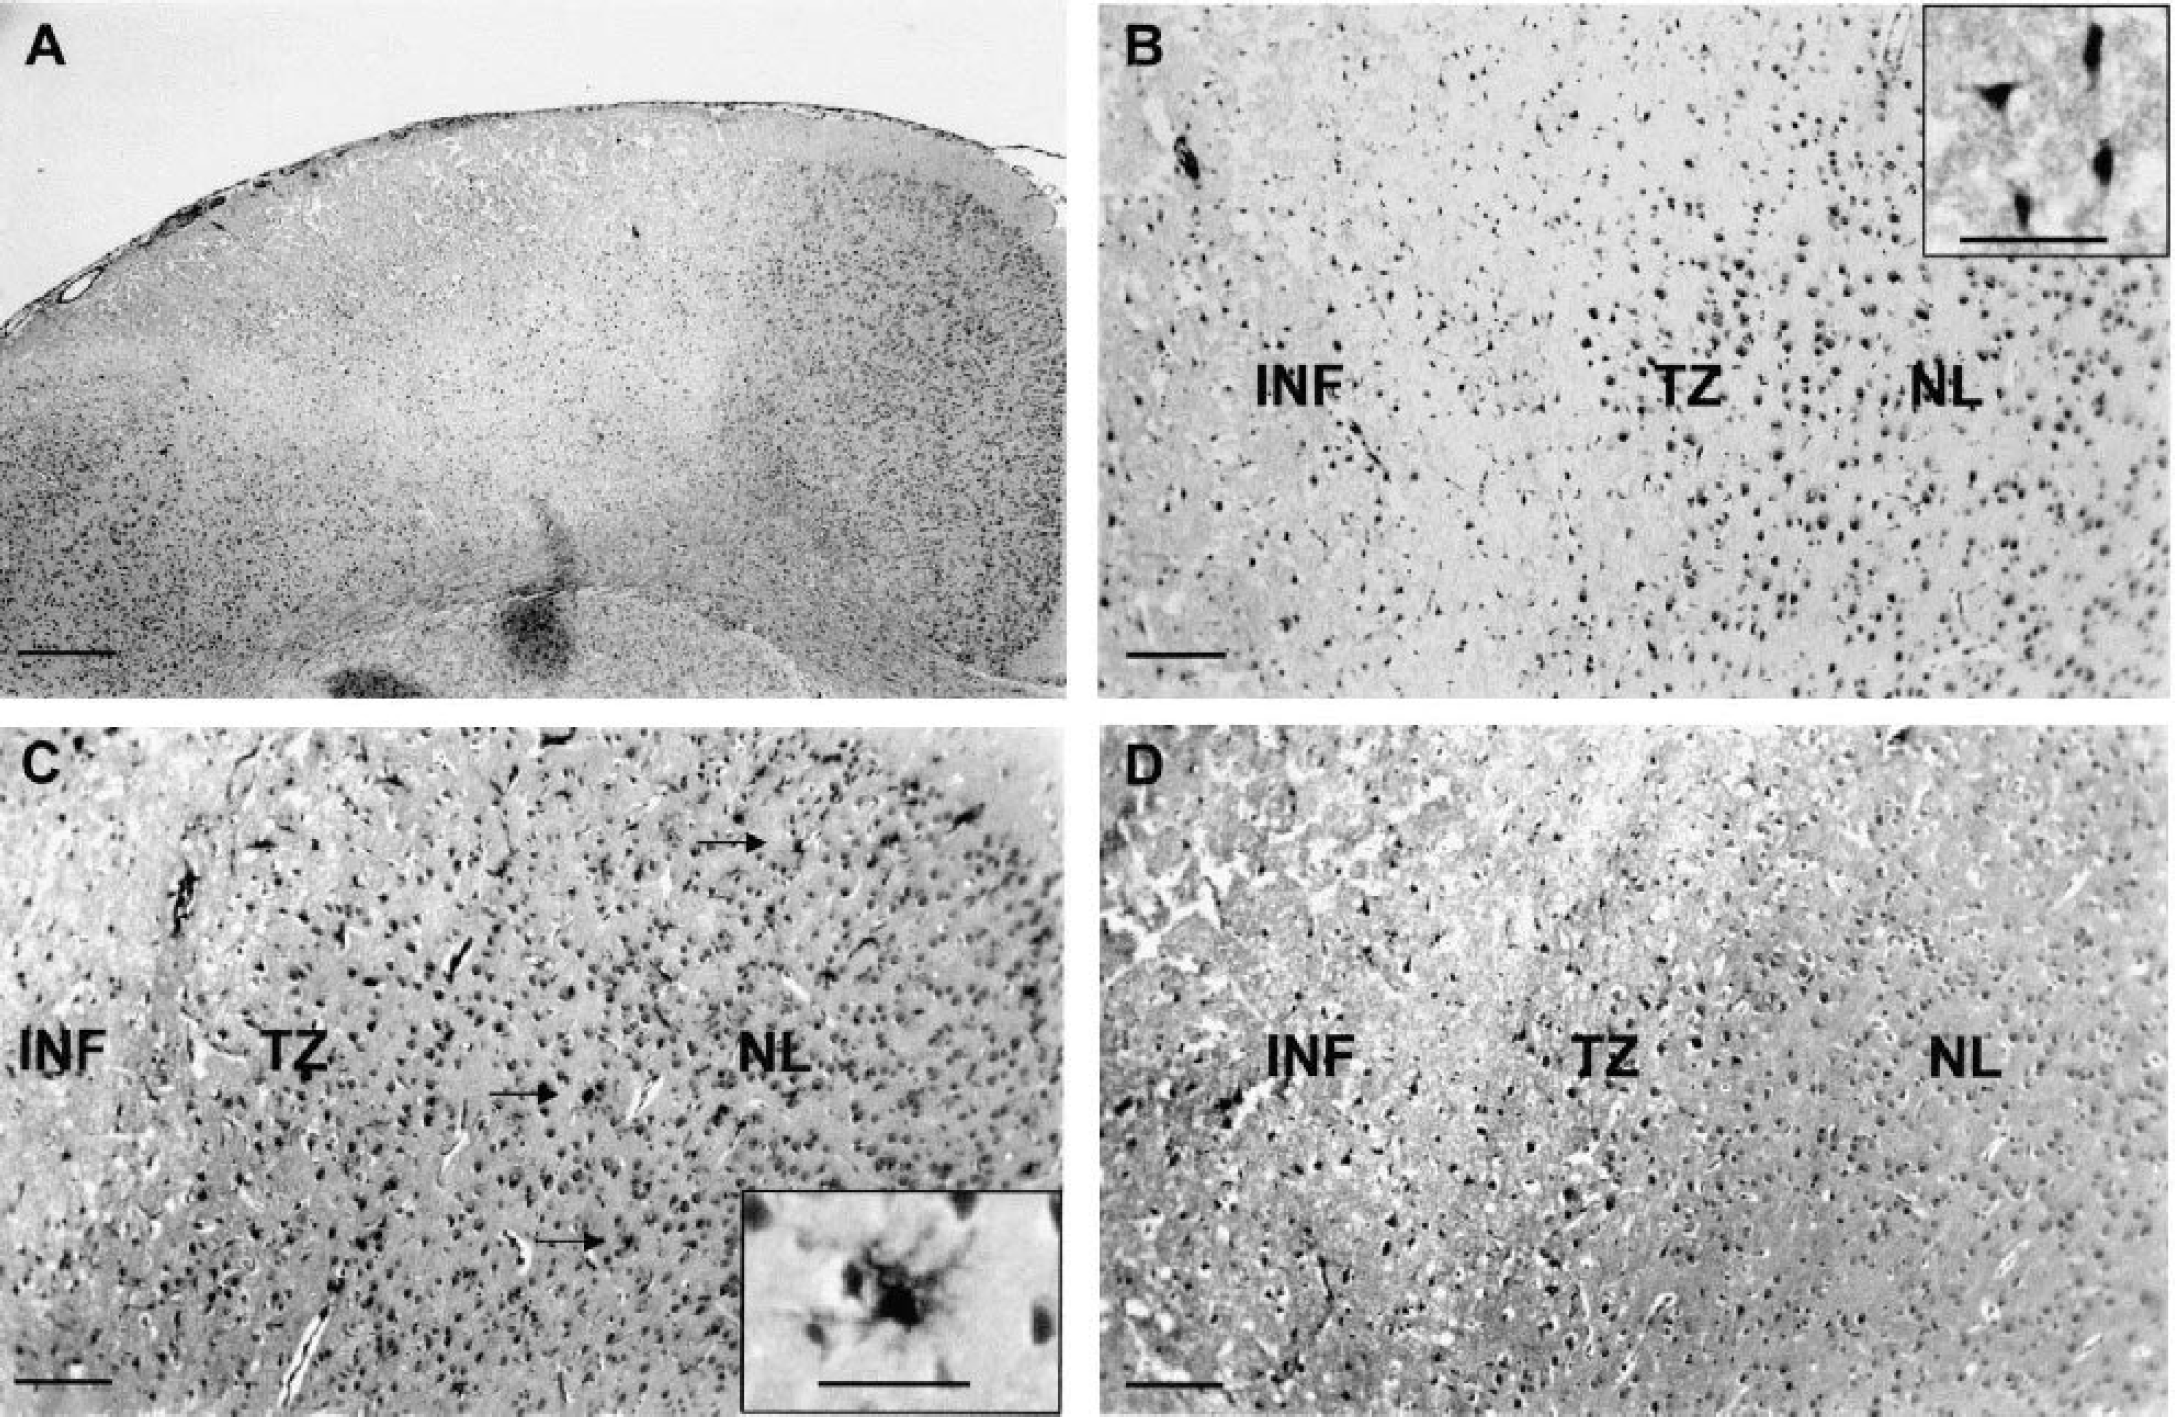
Cortical damage in the infarcted area at day 1 after irradiation. Sections were stained with hematoxylin
Cortical damage in the infarcted area at day 3 after irradiation. Sections were stained with isolectin B4 (ILB4;
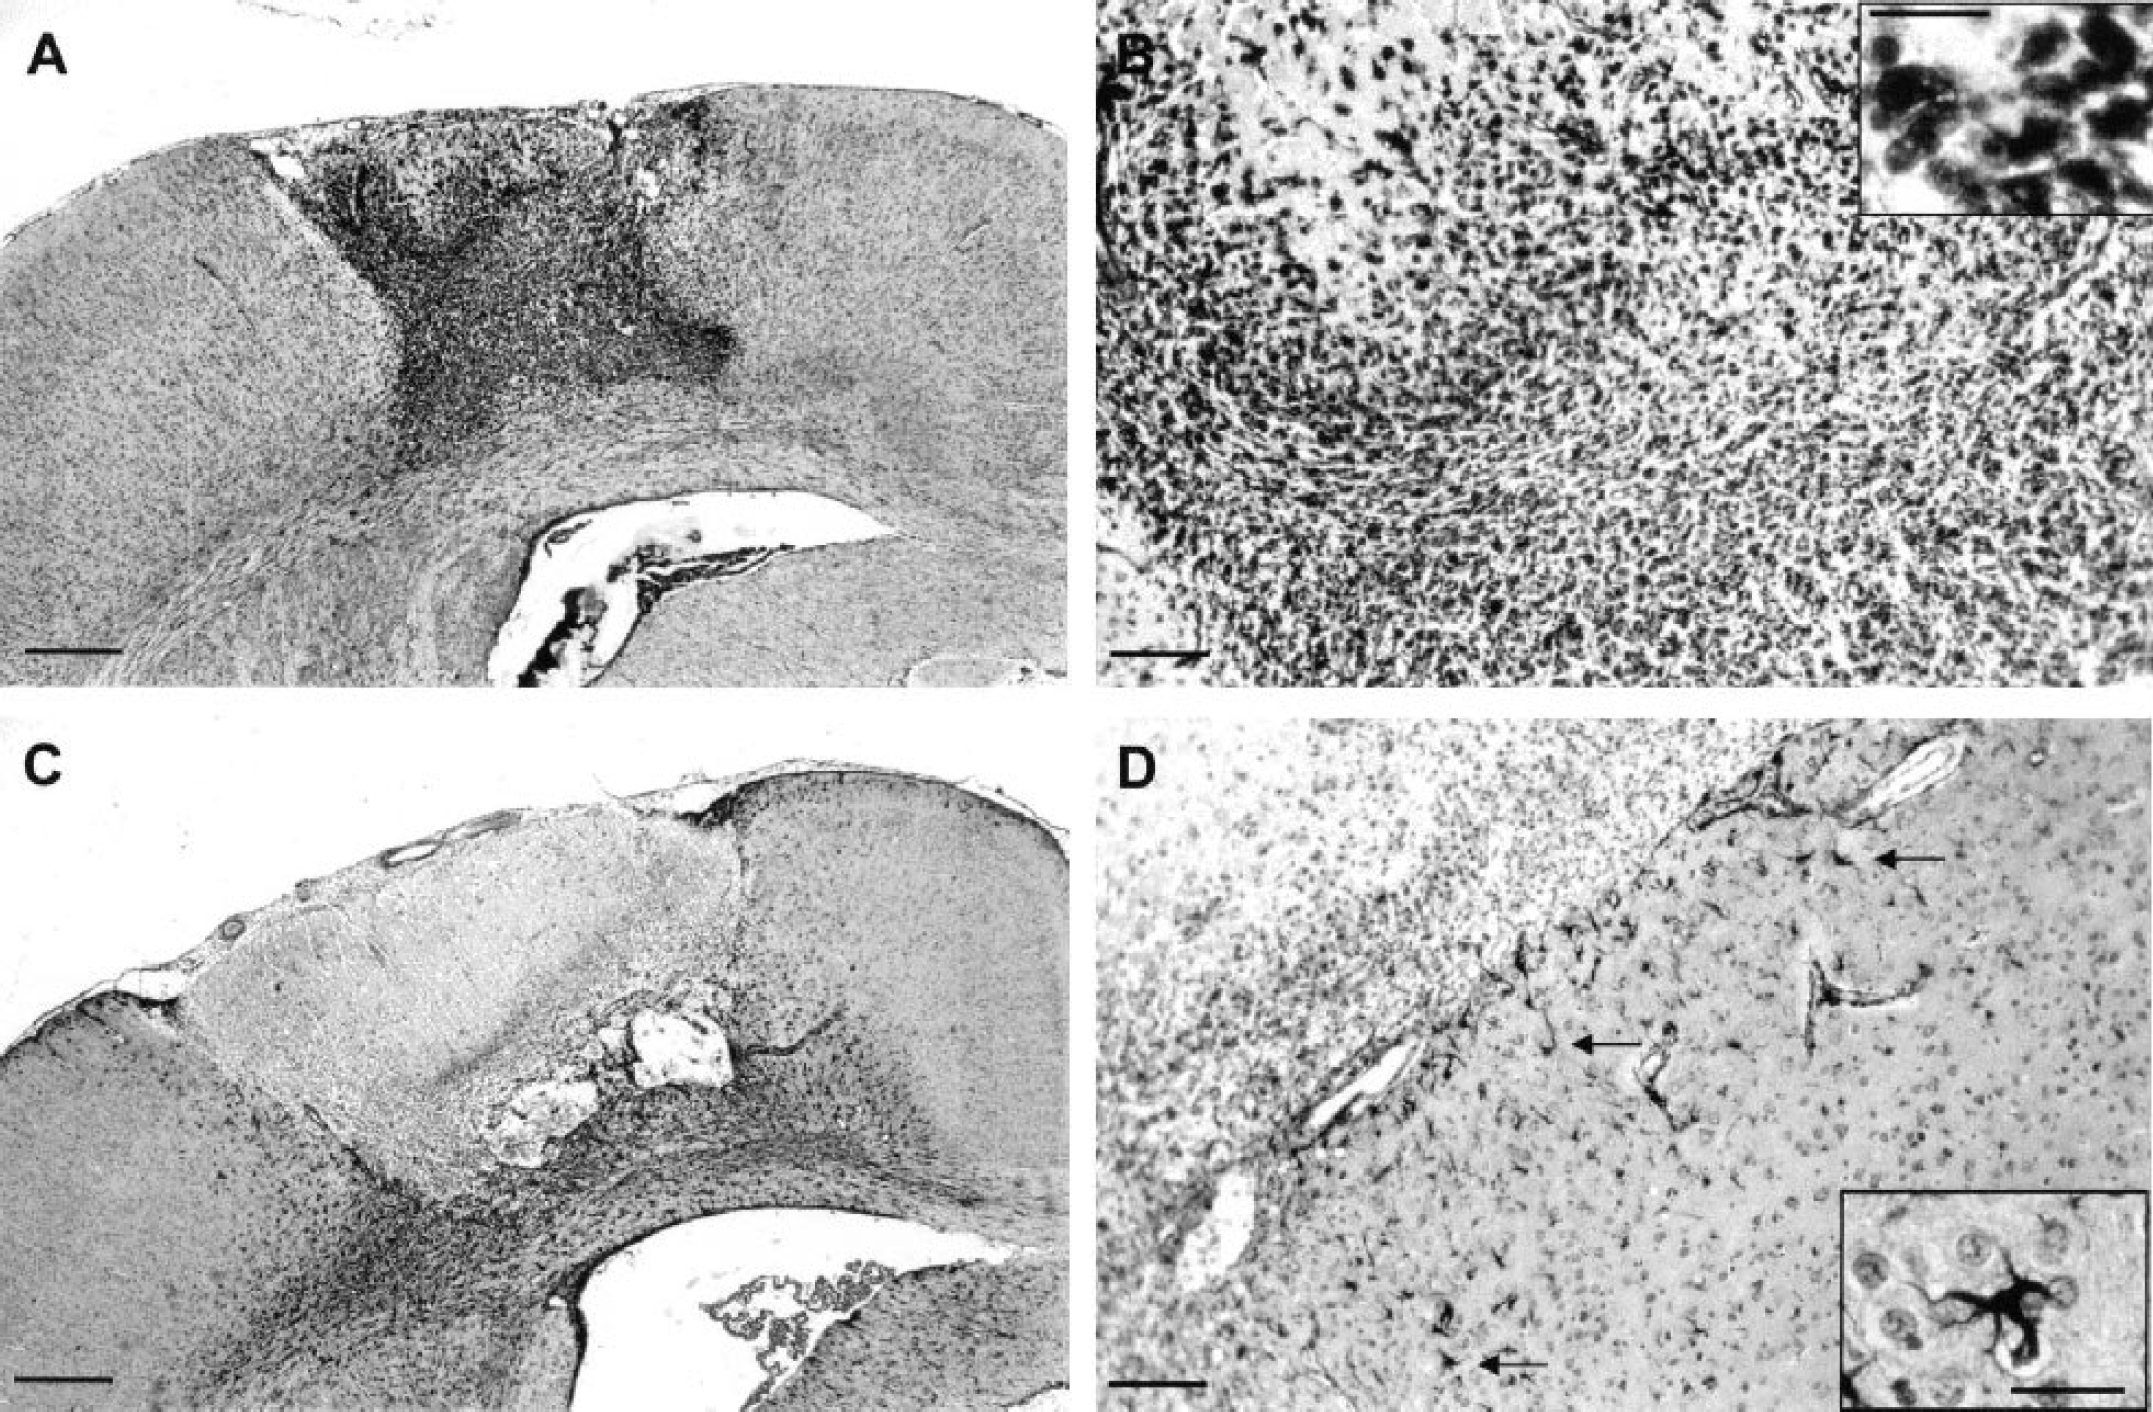
Cortical damage in the infarcted area at day 8 after irradiation. Sections were stained with isolectin B4 (ILB4;
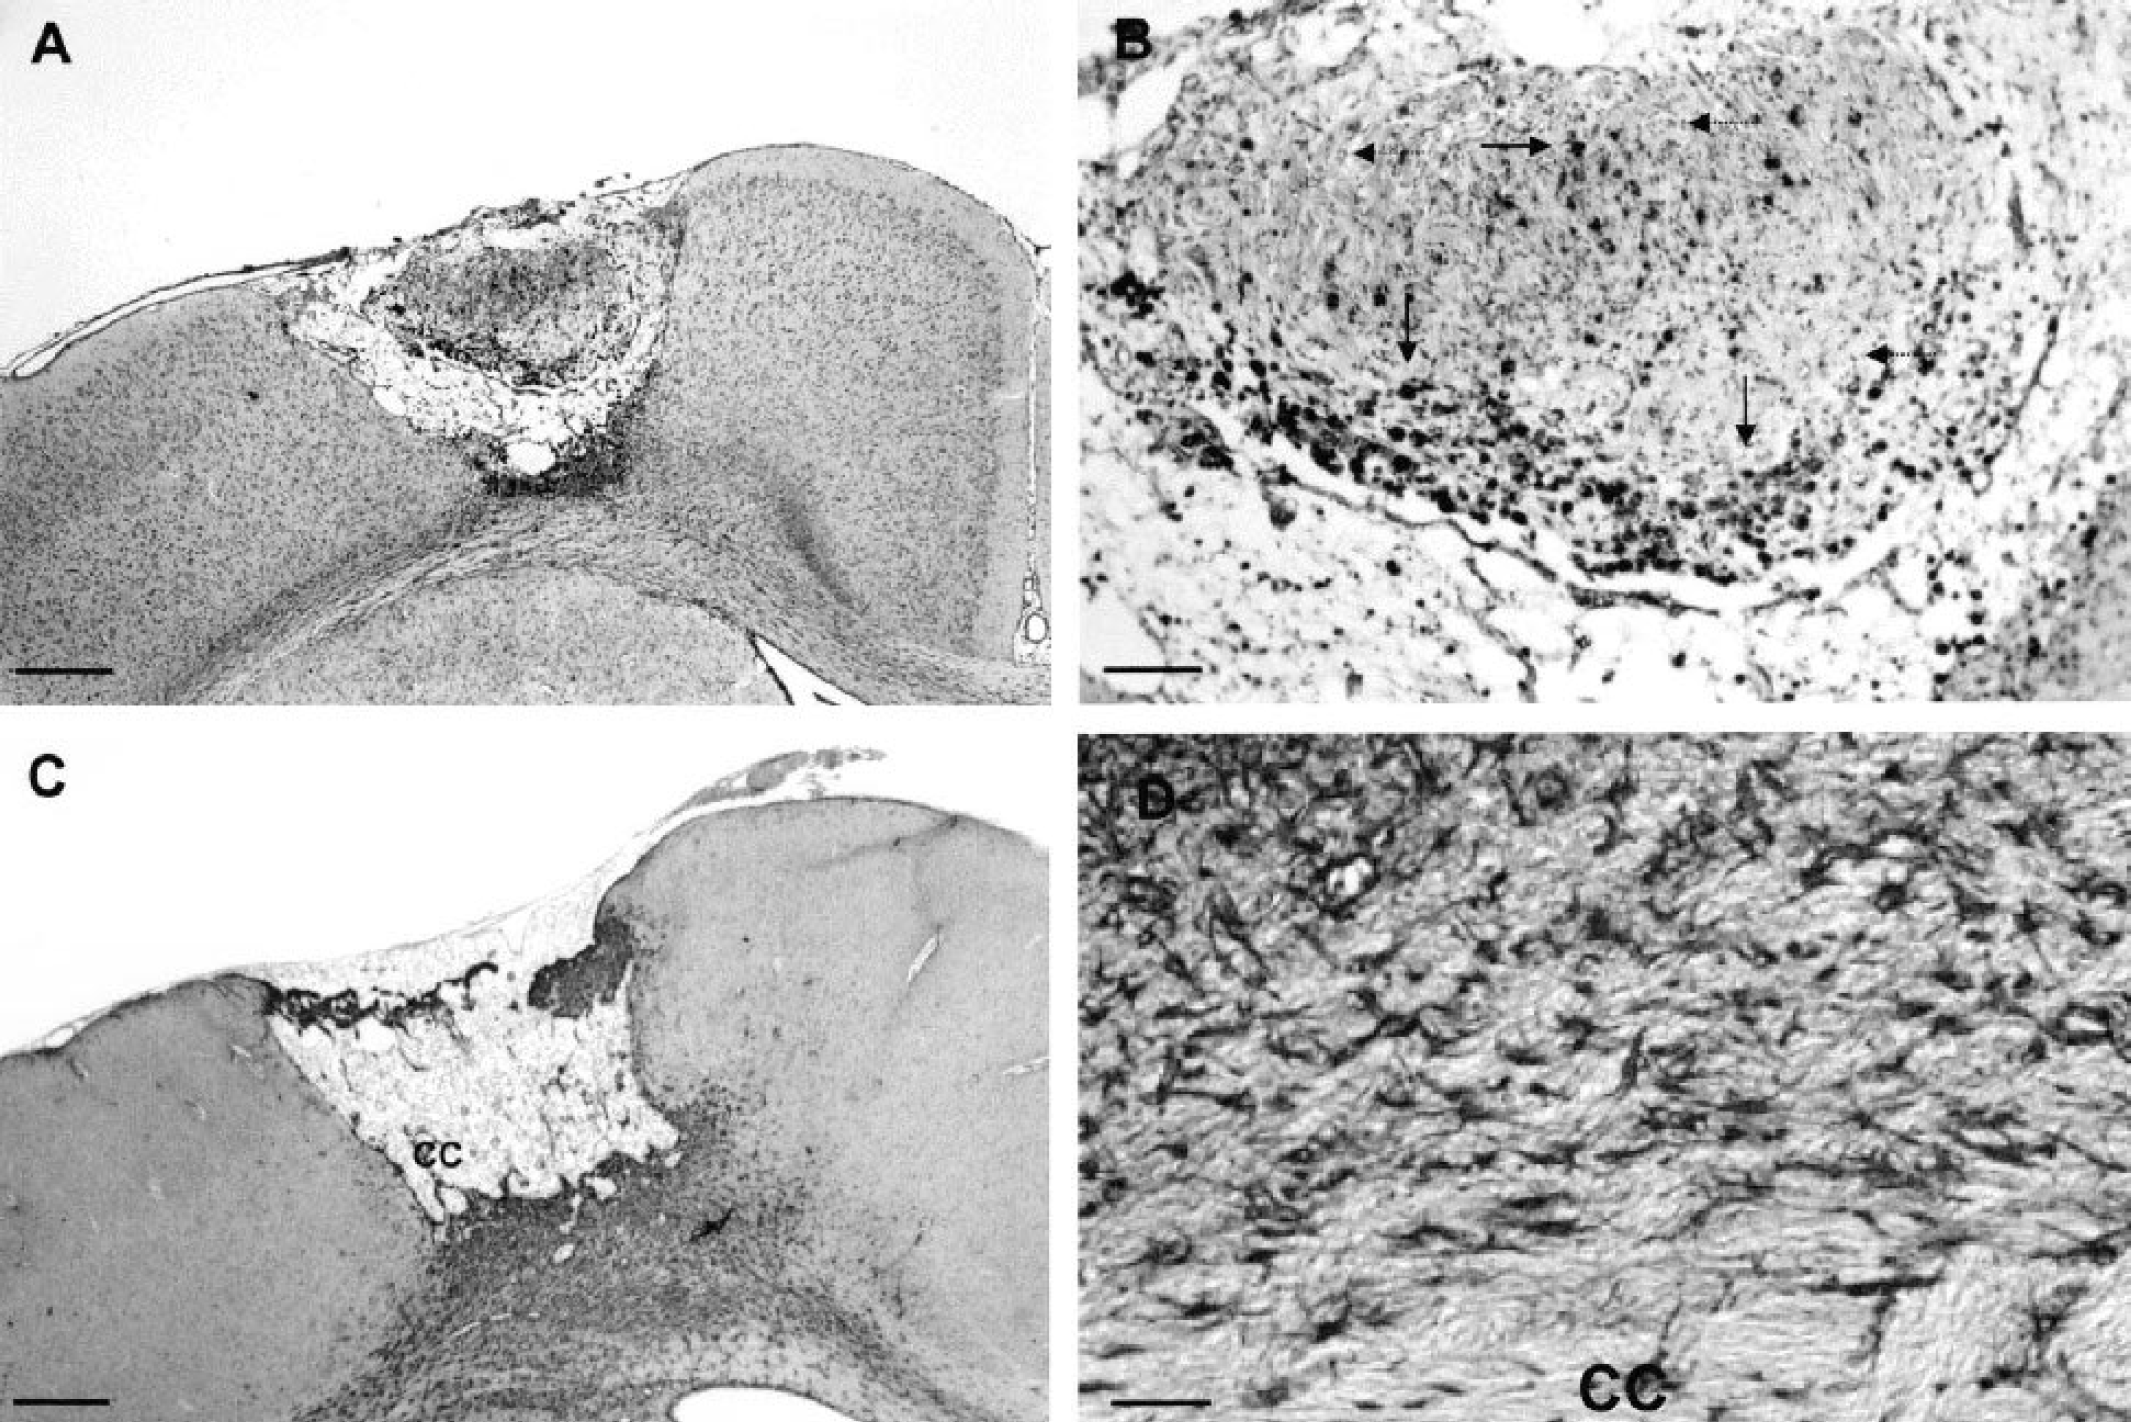
Cortical damage in the infarcted area at day 30 after irradiation. Sections were stained with isolectin B4 (ILB4;
Temporal changes in N-acetyl-aspartate level
The NAA levels in the contralateral hemisphere of ischemic rats were not different from control values at all times studied (not shown). As shown in Fig. 6, ischemia was associated with a reversible decrease in NAA concentrations within the lesion. The values dropped from 73.9 ± 3.9 (control) to 24.6 ± 12.3 nmol/mg protein at postictus day 1. The reduction was maximal after 3 d (8.2 ± 3.5 nmol/mg protein) and appeared reversible with time. NAA values reached 41.0 ± 13.6 nmol/mg protein after 8 d, and were no longer different from control after 30 d (68.8 ± 4.3 nmol/mg protein). The large increase between days 8 and 30 led us to suspect a periinfarct NAA contamination in some samples due to the smaller infarct size after 30 d. Additional NAA measurements were therefore performed at that particular time using two concentric punches (n = 5); that is, an inner punch of 2-mm interior diameter (3.5 ± 2.1 mg tissue) and a surrounding rim of 2.8 mm (13.7 ± 5.5 mg tissue). Tissue weight in the inner punch may appear low as compared with the former because the thickness of the cerebral cortex was markedly reduced in the center of the lesion. N-Acetyl-aspartate values in the inner punch were somewhat lower (41.2 ± 13.8 nmol/mg protein) than those in the surrounding rim (63.4 ± 7.6 nmol/mg protein) but were still fivefold higher than those observed at postictus day 3.
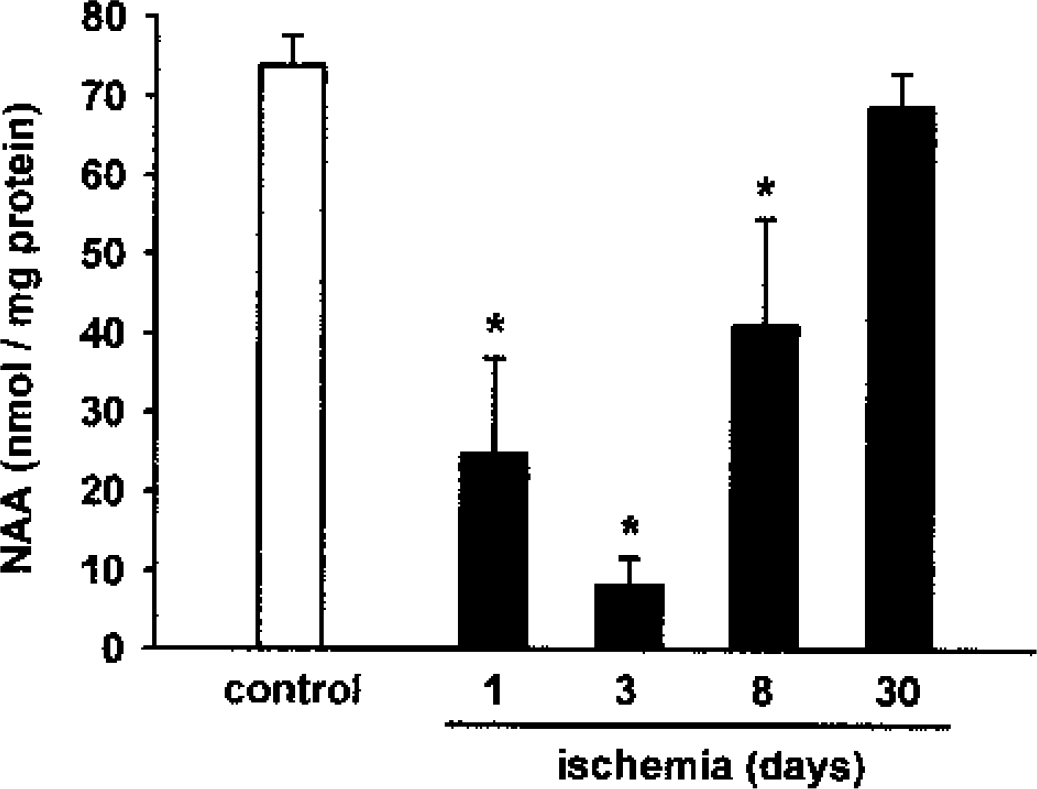
Time course of N-acetyl-aspartate (NAA) level in the infarct. N-Acetyl-aspartate cortical levels were measured in control rats (n = 6) and in the infarcted area of ischemic animals 1 d (n = 8), 3 d (n = 5), 8 d (n = 8), and 30 d (n = 6) after ischemia. *P < 0.05 (significant difference) compared with control values after one-way ANOVA followed by the Bonferroni test.
DISCUSSION
The present study reports the temporal changes in brain NAA concentration in the infarct core after photothrombotic focal ischemia in rats. In accordance with the selective neuronal location of NAA and as previously reported from other stroke models, our data confirm that brain ischemia is initially associated with a marked decrease in NAA (Demougeot et al., 2001; Gyngell et al., 1995; Higuchi et al., 1996; Peres et al., 1992; Sager et al., 1995, 2000). In contrast, the prolongation of ischemia led to a progressive NAA recovery in the infarct core.
Tissue sampling
We used the photothrombotic cortical model because it produces reproducible, well-demarcated lesions with a distinct transition between normal and infarcted tissue. Great care was taken to sample only infarcted tissue for NAA measurements. First, the interior diameter of the punch (2.8 mm) in which NAA was measured was smaller than the diameter of the bottom section (3.1 mm) obtained on postischemia day 30. Second, additional NAA measurements were performed after 30 d with two concentric punches. We found that the NAA values in the inner punch were lower than those in the surrounding rim. One reason might be the contamination by periinfarct tissue of some samples at that particular time due to smaller infarct sizes. Accordingly, NAA immunoreactivity was increased in the periinfarct region, at least at day 7 after middle cerebral artery occlusion in mice (Sager et al., 2000). Another explanation, however, could be the existence of a gradient of NAA concentration inside the infarct. Indeed, as evidenced from clinical data, the reduction of NAA level was greater in the core than in the peripheral area of the infarcted region (Wild et al., 2000). Finally, the NAA concentration in the inner punch was still fivefold higher at day 30 than that observed at day 3, a time at which sample contamination by periinfarct tissue cannot be suspected, given the large infarct size. Altogether, our results clearly show the presence of NAA in the 30-d infarct.
Mechanisms potentially involved in N-acetyl-aspartate recovery after ischemic stroke
According to the current knowledge about NAA metabolism in normal brain (Baslow, 2000), NAA is formed from aspartate and acetyl-CoA through the action of
Based on immunochemical studies, NAA has been suggested to be neuron specific (Moffett et al., 1991; Simmons et al., 1991). Moreover, neurons contain high amounts of NAAG compared with other brain cells (Moffett et al., 1991). Thus, the neuron seems to be the best candidate to explain NAA recovery. A first possibility is that surviving neurons recovered their ability to synthesize NAA and NAAG. As evidenced by our results, however, NAA started increasing at postischemia day 8, a time at which neurons were no longer detected within the lesion by conventional histology. This observation is in agreement with a previous report showing the presence of surviving neurons (10%) at day 2 after photothrombotic ischemia, all of which exhibited a shrunken morphology and pyknotic nuclei (Lee et al., 1996). A second possibility is the occurrence of neuronal stem cell differentiation. Indeed, recent studies have shown that the mature brain has the capacity for neurogenesis in response to focal ischemia (Gu et al., 2000; Jiang et al., 2001). Nevertheless, the density of newborn neurons was low compared with that of other proliferating cells. Moreover, in these studies, the scattered generated neurons were located outside the infarct, making the contribution of neurogenesis to NAA recovery unlikely or at best of minor importance. This raises the possibility that nonneuronal cells produce NAA and/or NAAG.
First, the increase in NAA concentration after stroke may reflect the ability of nonneuronal cells to express NAA. Indeed, immature or even mature oligodendrocytes were reported to express high level of NAA in vitro (Bhakoo and Pearce, 2000; Urenjak et al., 1992, 1993). Furthermore, some oligodendrocytes have been found to survive within the lesion, and oligodendrocyte proliferation was observed inside the infarct in mice and rats subjected to permanent focal ischemia (Mabuchi et al., 2000; Mandai et al., 1997). In addition, although astrocytes do not contain NAA (Urenjak et al., 1992, 1993), reactive astrocytes might have the ability to express NAA. Indeed, on the one hand, reactive astrocytes have been shown to express fetal characteristics of progenitor cells (Lin et al., 1993; Lin and Matestic, 1994), and, on the other hand, cultured oligodendrocyte-type 2 astrocyte progenitors express NAA (Urenjak et al., 1992, 1993). In support of the contribution of reactive astrocytes to NAA recovery, our histologic study shows that numerous reactive astrocytes were found at the margin of the lesion 8 d after ischemia, whereas reactive astrocytes were present within the infarct after 30 d, with the highest density facing the corpus callosum. Finally, other nonneuronal cells (e.g., mast cells) also express high level of NAA (Burlina et al., 1997), but no mast cell infiltration was detected under our experimental conditions.
Second, the NAA recovery in the infarct may be indicative of the production of NAA from NAAG secreted by glial cells present in the infarct core. Indeed, evidence exists that cultures of oligodendrocytes, microglia, and to lesser extent astrocytes, contain low to moderate micromolar concentration of NAAG (Cassidy and Neale, 1993; Passani et al., 1998). Moreover, NAAG expression is enhanced in activated microglia (Passani et al., 1998) and we found that ILB4-positive cells had entirely invaded the lesion at day 8. Furthermore, microglial activation was reported to peak at day 14 after photothrombotic ischemia (Schroeter et al., 1999). Thus, despite the low number of ILB4-positive cells observed in our study at day 30, it is conceivable that the NAAG previously secreted by ILB4-positive cells is transformed into NAA by the enzyme NAALADase, which is considered to be primarily expressed by astrocytes (Berger et al., 1999). Finally, we observed ILB4- and GFAP-negative cells in the infarct at days 8 and 30. These cells might be oligodendrocytes, fibroblasts derived from the meninges (Schroeter et al., 1995), or endothelial cells (Grome et al., 1988). Whether these two latter types of cells contain NAA or NAAG has not been investigated.
A last hypothesis to explain the presence of NAA in the infarct involves the diffusion of NAA from the perilesional region into the infarcted region. Indeed, cells present outside the infarct including neurons, oligodendrocytes, and activated astrocytes might exhibit increased synthesis and release of NAA or NAAG. Accordingly, NAA immunoreactivity was reported to increase at the periphery of the infarct 7 d after middle cerebral artery occlusion in mice (Sager et al., 2000). Nevertheless, such an increased NAA immunoreactivity was not associated with an enhanced NAA content in the infarcted tissue, which may refute our last hypothesis. The lack of NAA recovery in the infarcted area at day 7 after middle cerebral artery in mice contrasts with our results obtained at day 8 after cortical photothrombosis. Stroke model or species differences in the kinetics of astromicroglial response to ischemia and in the enzymes involved in the presence of NAA may account for the difference between our results and those obtained in mice.
In summary, by using cortical photothrombosis as model of brain infarction, we report for the first time that prolongation of ischemia leads to reproducible NAA recovery in the infarcted area. This observation is in agreement with the discarded clinical data mentioned in the Introduction showing long-term NAA recovery in certain stroke patients. Two reasons may be proposed to explain why some patients exhibited reduced NAA in chronic infarct and others did not. First, individual differences in astromicroglial response may exist owing in particular to the presence or the absence of spontaneous recirculation or to a variable pattern of the infarct neovascularization. Second, MRS methodologic considerations cannot be excluded (e.g., changes in the molecule environment that are susceptible to mask NAA recovery or technical difficulties in repositioning the voxel during longitudinal studies).
Finally, although our results indicate that long-term NAA measurements do not indicate neuronal loss even in necrotic regions, it is important to keep in mind that ischemia was initially associated with a marked decrease in NAA concentration. This is in accordance with the numerous data obtained by MRS in stroke patients (Ricci, 1998). Therefore, our study does not question the usefulness of MRS to evaluate neuronal loss or dysfunction in early stroke. However, the capacity of cultured nonneuronal cells to express NAA or NAAG, as well as the evidence of glial activation in the infarcted area, strongly question the use of NAA as a specific neuronal marker in the chronic stage of stroke. Further studies on NAA metabolism in pathologic brain are required before considering NAA measurement as a promising tool to investigate glial reaction and infarct maturation in chronic stroke.
Footnotes
Acknowledgments:
The authors thank Mr. J. M. Hlubina for his technical assistance in the preparation of paraffinized brains.