
Abstract
In patients with acute ischemic stroke, early recanalization may save tissue at risk for ischemic infarction, thus resulting in smaller infarcts and better clinical outcome. The hypothesis that clinical and diffusion- and perfusion-weighted imaging (DWI, PWI) parameters may have a predictive value for early recanalization and final infarct size was assessed. Twenty-nine patients were prospectively enrolled and underwent sequential magnetic resonance imaging (1) within 6 hours from hemispheric stroke onset, before thrombolytic therapy; (2) at day 1; and (3) at day 60. Late infarct volume was assessed by T2-weighted imaging. At each time, clinical status was assessed by the National Institutes of Health Stroke Scale (NIHSS). Twenty-eight patients had arterial occlusion at day 0 magnetic resonance angiography (MRA). They were classified into two groups according to day 1 MRA: recanalization (n = 18) versus persistent occlusion (n = 10). Any significant differences between these groups were assessed regarding (1) PWI and DWI abnormality volumes, (2) relative and absolute time-to-peak (TTP) and apparent diffusion coefficient within the lesion on DWI; and (3) day 60 lesion volume on T2-weighted imaging. Univariate and multivariate logistic regression analysis showed that the most powerful predictive factors for recanalization were lower baseline NIHSS score and lower baseline absolute TTP within the lesion on DWI. The best predictors of late infarct size were day 0 lesion volume on DWI and day 1 recanalization. Early PWI and DWI studies and day 1 MRA provide relevant predictive information on stroke outcome.
Diffusion-weighted (DWI) and perfusion-weighted (PWI) magnetic resonance imaging are useful in evaluating patients with acute brain ischemia (Neumann-Haefelin et al., 2000a). Diffusion-weighted magnetic resonance imaging lesion growth has been correlated with clinical severity and final infarct size (Baird et al., 2000, 2001; Lovblad et al., 1997; Oppenheim et al., 2001; Thijs et al., 2000). Acute perfusion deficits have also been correlated with initial stroke severity, clinical outcome, and final infarct volume (Barber et al., 1998; Parsons et al., 2001; Thijs et al., 2000, 2001; Tong et al., 1998; Warach et al., 1996).
The assessment, however, of acute magnetic resonance imaging (MRI) factors that influence recanalization, tissue outcome, and clinical status in patients who receive thrombolytic therapy remains poorly documented because there have been few prospective studies using pre- and posttreatment MRI performed within the 6-hour time window (Kidwell et al., 2000; Parsons et al., 2002; Schellinger et al., 2001). Indeed, most MRI data that assess clinical and tissue outcome have been collected retrospectively (Baird et al., 2000; Lovblad et al., 1997; Oppenheim et al., 2001, Thijs et al., 2000, 2001), and are based on various MRI methods and delays from stroke onset.
Early recanalization has been correlated with better clinical outcome (Alexandrov et al., 2001; Jansen et al., 1999; Lev et al., 2001; Molina et al., 2001a, b ; Ringelstein et al., 1992; Von Kummer et al., 1995) and may influence perfusion and diffusion parameters (Barber et al., 1999; Marks et al., 1999; Schellinger et al., 2001; Straroselskaya et al., 2001). The aim of this prospective work was to determine which early MRI parameters are predictive for recanalization and final infarct size in patients who receive thrombolytic therapy.
PATIENTS AND METHODS
Inclusion and exclusion criteria
Patients with symptoms of acute hemispheric stroke and treated with recombinant tissue plasminogen activator were recruited for this prospective study.
Inclusion criteria were as follows: (1) acute cerebral ischemia involving the carotid artery territory; (2) patients with a measurable clinical deficit (National Institutes of Health Stroke Scale [NIHSS] score >4 [Brott et al., 1989]); (3) absence of cerebral hemorrhage on computed tomography (CT) scan; (4) baseline MRI scan performed before therapy and within 6 hours of stroke onset, which was defined as the last time the patient was known to be without neurologic deficits; (5) no contraindications to thrombolysis; and (6) written informed consent obtained from the patient or his or her relatives.
Exclusion criteria were as follows: (1) preexisting neurologic, psychiatric, or other illness that would confound the neurologic evaluation; (2) general contraindications to MRI; (3) movement artifacts precluding MRI interpretation; (4) lacunar syndromes were excluded according to (a) clinical picture, (b) diffusion lesion volume less than 2 cm3, and (c) no corresponding perfusion deficit; (5) hemodynamically relevant stenosis of the extracranial arteries of the contralateral hemisphere that would be likely to affect the time-to-peak [TTP] analysis (Neumann-Haefelin et al., 2000b) (at duplex Doppler sonography performed within the first week); (6) patient withdrew consent or could not adhere to the study.
Patients
From March 2001 to March 2002, 510 patients were admitted to the stroke unit of our hospital. Magnetic resonance imaging was performed within 6 hours of stroke onset for suspected acute ischemic stroke involving the carotid artery territory in 61 consecutive patients. Thirty-two patients fulfilled the inclusion criteria. Three patients were excluded because movement artifacts precluded interpretation of day 0 MRI scans. Magnetic resonance imaging data analysis involved 29 patients. Neurologic impairment was assessed using the NIHSS score at baseline, and at days 1 and 60. All clinical assessments were performed by a trained neurologist without knowledge of the MRI results. After MRI completion, patients received intravenous recombinant tissue plasminogen activator (rt-PA; 0.8 mg/kg body weight) according to a protocol published elsewhere (Trouillas et al., 1998).
Computed tomography
Baseline plain CT scan was performed on all patients before rt-PA therapy with a fourth-generation CT at day 0. Baseline CT scan was performed either before the MRI (n = 19), or after it (n = 10).
Magnetic resonance imaging
All patients had a day 0 MRI at admission, before therapy, and a day 1 MRI within the subsequent 24 hours, with the same protocol. T2-weighted lesion volume was obtained at day 60 (±7 days) in 28 patients. Identical positioning was obtained on follow-up MRI. For patient safety, a stroke neurologist experienced in neurologic critical care was present throughout the MRI examination at day 0 and day 1.
Day 0, day 1, and day 60 MRI studies were obtained using a 1.5-T Magnetom Vision whole body MR imager (Siemens, Erlangen, Germany). The following sequences were performed.
Three-dimensional time-of-flight turbo magnetic resonance angiography (MRA); repetition time: 35 ms; echo time: 6.4 ms; flip angle: 20°; matrix: 160 × 512; field of view: 240 mm; 1 excitation; acquisition time: 6 minutes 14 seconds). Three axial slabs (thickness: 31.9 mm; partitions: 24; distance factor: −0.38) were placed over the circle of Willis and covered the intracranial internal carotid artery (ICA), M1 to M3 (or M4) segments of the middle cerebral artery (MCA), and A1 and proximal A2 segments of the anterior cerebral arteries.
Echoplanar imaging isotropic diffusion (repetition time: 5,000 ms; echo time: 137 ms; 19 axial slices; thickness: 5 mm, interslice gap: 0.5 mm; matrix: 96 × 128; field of view: 240 mm; 1 excitation; acquisition time: 23 seconds). Three values of diffusion sensitization (b-values = 50, 500, and 1,000 s/mm2), were used to calculate the apparent diffusion coefficient (ADC).
Perfusion MRI was performed with a T2*-weighted gradient-echo echo-planar imaging sequence, using the bolus passage of contrast agent (repetition time: 2,000 ms; echo time: 60 ms; 7 slices; slice thickness: 5 mm; interslice gap: 0.5 mm; field of view: 240 mm; matrix 128 × 128 pixels; 30 measurements obtained at intervals of 2 seconds). The slice position was obtained from the DWI scan and was matched to the center of the diffusion lesion area. The contrast injection (15 mL of Gd-DTPA) was performed at the start of the fourth scan, using a power injector at a rate of 5 mL/s via access through an antecubital vein; the bolus of contrast medium was followed by a 15-mL bolus of saline solution at the same injection rate. Mean duration of an MRI examination was 15 minutes with a 5- to 10-minute additional time for patient preparation and positioning.
The mean delay between symptom onset and day 0 MRI was 3 hours 30 minutes (range: 1 hour 58 minutes to 5 hours 54 minutes).
T2-weighted imaging (T2WI) was performed at day 60 using a dual fast-spin-echo sequence (echo time: 16–98 ms; repetition time: 3,000 ms; 19 axial slices; thickness: 5 mm; slice gap: 0.5 mm; matrix: 512 × 512, field of view: 230 mm; acquisition time: 5 minutes).
This protocol was approved by the local ethical committee for clinical investigations (CCPPRB Lyon B). Informed consent was obtained from the patients or their authorized representative.
Postprocessing analysis
The main objective was to analyze the factors predicting early recanalization, and final infarct size at day 60. In addition, we assessed the changes in lesion volume based on the day 1 arterial pattern. The baseline, day 1, and day 60 MRIs were interpreted masked to the MRI findings from the other time points. The measurement of volumes, absolute and relative time-to-peak, and ADC were performed on a dedicated MR workstation. Abnormal DWI and PWI areas were measured by a trained senior neuroradiologist, unaware of the clinical data. To define initial DWI lesion volume, we used the trace images obtained at the highest b value (b = 1,000 s/mm2). The global lesion volume was determined by multiplying the area of diffusion hyperintensity by the sum of the slice thickness and the interslice gap thickness. Apparent diffusion coefficient maps were generated by software using three values of b (b = 50, b = 500, and b = 1,000 s/mm2). Perfusion maps were generated from the concentration—time curve. A gamma variate fit was used on a pixel-by-pixel basis to compute parameter images for absolute TTP of signal drop. Absolute TTP (absTTP) referred to the delay between the first measurement of the PWI sequence and the maximal signal drop due to contrast bolus concentration peak (including the 6-second delay between first acquisition and contrast injection). Relative TTP (rTTP) referred to the difference in seconds between (1) absTTP value within the abnormal area and (2) absTTP value within the normal-appearing mirror area. Apparent diffusion coefficient and TTP values were measured by manually placing regions of interest (ROI) within the lesion on DWI, the lesion on PWI, and the symmetrical contralateral areas. Areas of abnormality were defined as hyperintensity on DWI, or hyperintensity on absTTP maps (Marks et al., 1999). At day 0 and at day 1, the images were coregistered on a voxel-to-voxel basis to allow proper superimposition of the diffusion and perfusion ROIs. A careful attempt was made to obtain identical positioning at follow-up MRI. Apparent diffusion coefficient values were obtained by placing ROIs on ADC maps, with attempt to exclude cerebrospinal fluid voxels. Patients were considered to have a significant perfusion-diffusion mismatch if the PWI/DWI volume ratio was greater than 1.2 (Schellinger et al., 2001). The difference between PWI and DWI abnormality volumes was considered absolute mismatch volume. Regions of interest correlated with the abnormal area edges. The minimal ROI value was 1 cm2.
The final infarct volume was calculated following manual contouring of day 60 T2-weighted hyperintensity.
Maximum intensity pixel projection reconstructions were used for postprocessing MRA data. Occlusion was categorized as located to the intracranial ICA, confined to the M1 segment of the MCA, confined to the M2 segment, localized in the distal segments of the MCA, or located in the A1 and A2 segments of the anterior cerebral artery.
Patients were classified into two groups according to vessel recanalization (no recanalization versus complete or partial recanalization) at day 1 MRA. Recanalization was considered as complete if a normal pattern of the cerebral arteries was achieved on day 1 MRA. Recanalization was considered as partial if a stenosis or an occlusion distal to the initial occlusion site remained at day 1 MRA.
Reproducibility measurement
Two experienced observers (M. H., Y. B.) blinded to the severity of clinical deficits measured the DWI, PWI, and T2 lesion volumes on two occasions and the average value was used. The intra- and interobserver reliability (r) in measured DWI, PWI, and T2 lesion volumes was r > 0.90, with a mean deviation of less than 10% for intraobserver reproducibility.
Statistical analysis
Time intervals and the descriptive statistics of the NIHSS score and MRI characteristics are given as mean values with standard deviation or median absolute deviation and range. Student's t-test was used if assumptions of normality were met. For parameters that clearly deviated from normal distribution, the nonparametric Mann—Whitney U test was used. The Spearman rank correlation coefficient was calculated to determine the correlation of MRI parameters and clinical score with recanalization and with final infarct size. Univariate and multivariate logistic regression analysis was performed to identify the parameters predicting day 1 recanalization. Multiple linear regression analysis was used to identify the parameters most closely associated with late infarct volume. The regression for each of the imaging variables was performed separately to determine the relation of each of the variables to (1) recanalization at day 1 and (2) final infarct volume. A stepwise multiple regression analysis was made to see which combination of variables provided the most predictive power. All statistical tests were two-tailed; a P value less than 0.05 was considered statistically significant. Statistical analysis was performed with the SPSS 11 (SPSS Science, Chicago, IL, U.S.A.) and LogXact4 (Cytel Software Corp., Cambridge, MA, U.S.A.) statistical software packages for Windows.
RESULTS
Descriptive analysis
Clinical characteristics.
Sixteen men and 13 women (mean age 65 ± 14 y) underwent MRI before therapy. Median baseline NIHSS score was 15 (range, 6–27). The mean time from symptom onset to treatment was 412 hours ± 1 hour 16 minutes. According to the Trial of Org 10172 in Acute Stroke Treatment (TOAST) classification (Adams et al., 1993), stroke was caused by large vessel disease in 8 patients, cardioembolic event in 13 patients, and small vessel disease in 1 patient. Stroke mechanism remained unknown in 7 patients. One patient died during the first week. No recurrent stroke was observed during follow-up.
Magnetic resonance angiography data.
Among the 29 patients included in this study, MRA at admission identified an arterial occlusion in 28 patients, with the following distribution: distal ICA (n = 7); M1 (n = 16); M2 (n = 3); or distal MCA branch (n = 1), and A2 occlusion (n = 1). The patient without a demonstrated baseline occlusion had an infarct within the anterior choroidal artery territory. Eighteen patients experienced total (n = 10) or partial (n = 8) recanalization at day 1; 10 patients had persistent occlusion.
Magnetic resonance imaging parameters between day 0, day 1, and day 60.
Day 0 DWI mean lesion volume was 56 cm3 (standard deviation: 63 cm3; range: 4–213 cm3). Diffusion-weighted imaging lesion volume increased in 28 of the 29 patients at day 1. Twenty-five patients had a mismatch (PWI/DWI volume ratio >1.2) at day 0. Mismatch disappeared in 14 patients at day 1. Ten patients had no residual delayed perfusion area at day 1. The changes in DWI, PWI volumes, and PWI/DWI ratio were statistically significant between day 0 and day 1 according to recanalization. The prevention of lesion growth by early recanalization was evident at both acute and chronic stages, as demonstrated by sequential volume analysis. The changes in MRI parameters based on the arterial pattern at day 1 (recanalization versus occlusion) are described in Table 1. A case example of MRI images is given in Fig. 1. The course of lesion volume over time based on recanalization is illustrated in Fig. 2.
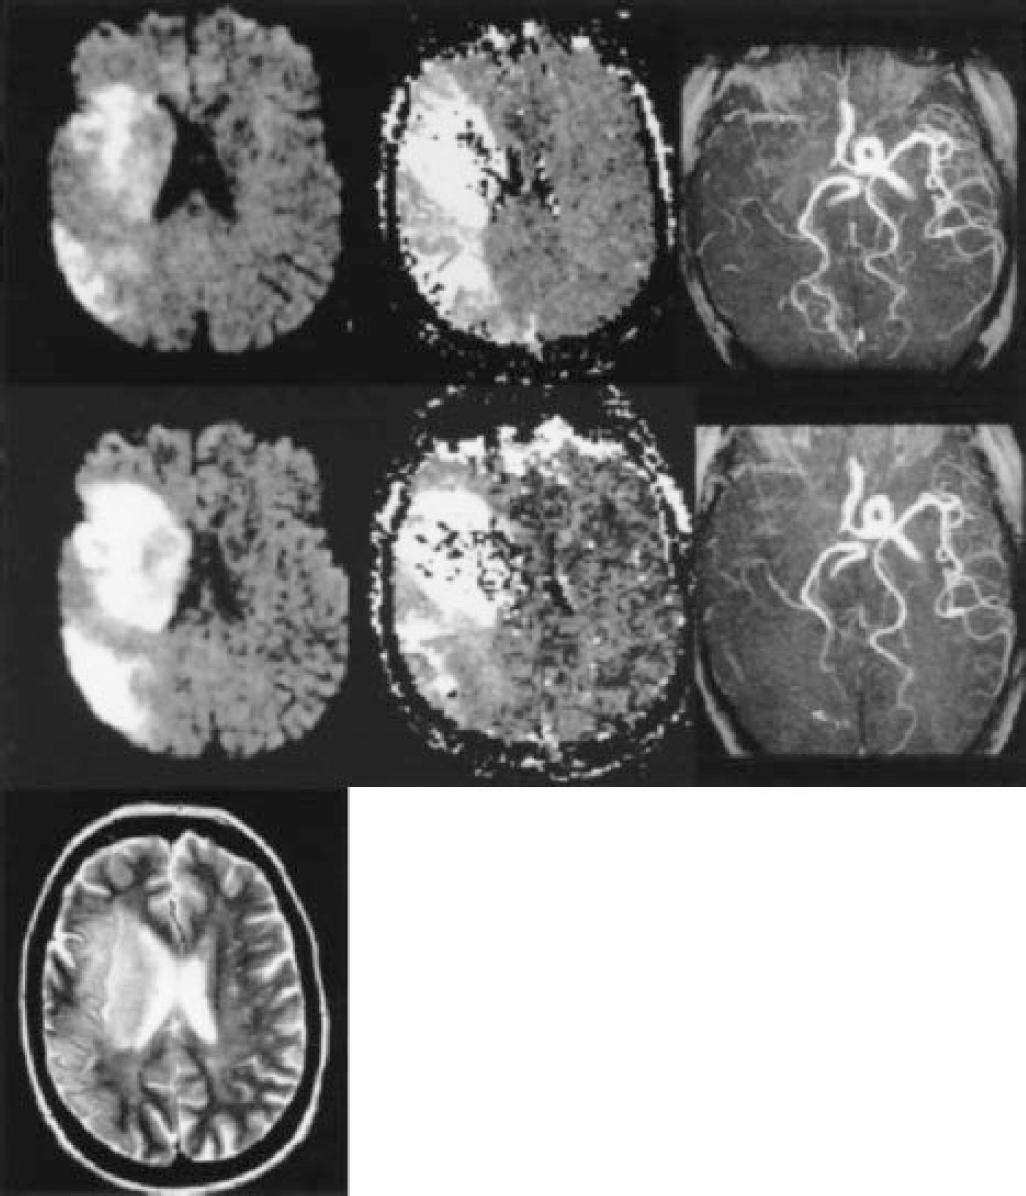
Imaging findings
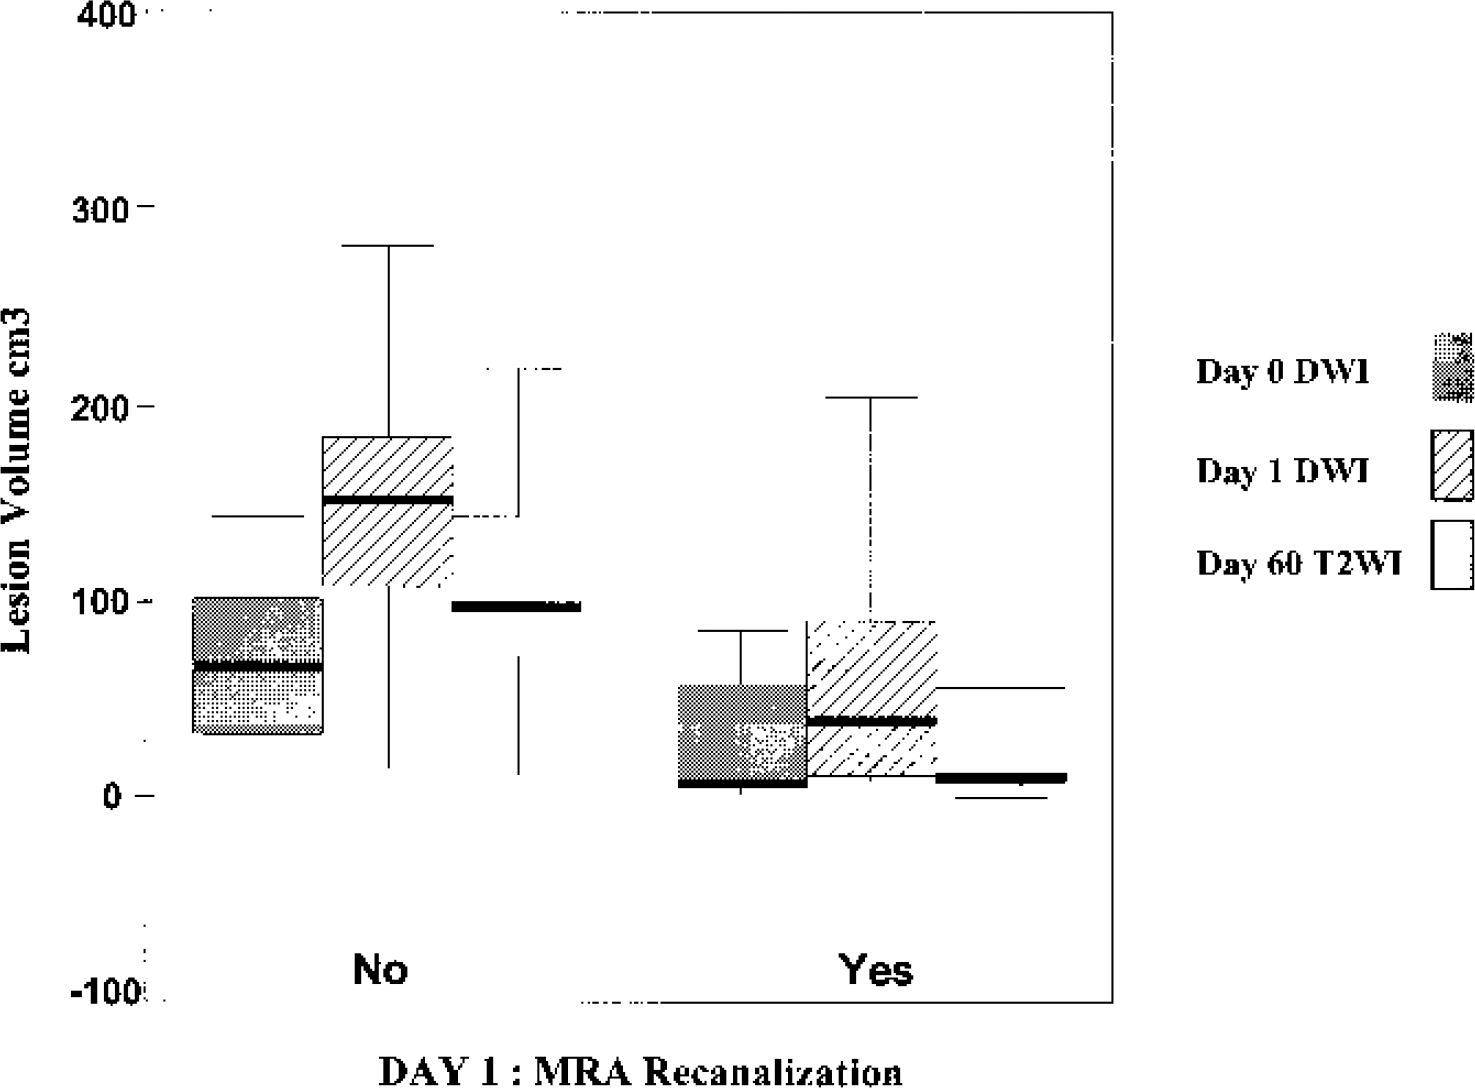
Box-plot diagram showing day 0 diffusion-weighted imaging (DWI), day 1 DWI, and day 60 T2-weighted imaging (T2WI) lesion volumes in the two groups of patients based on day 1 magnetic resonance angiography (MRA) recanalization. The horizontal line within the box represents the median lesion volume. The upper and lower limits of the box correspond to the 25th and 75th percentiles. The upper and lower ranges are given at the end of the vertical lines extending from the box. The median lesion volumes were significantly lower in the recanalization group (n = 18) at day 1 (P = 0.010) and at day 60 (P = 0.003) when compared with the nonrecanalization group (n = 9: data from the patient who died within the first week are not included). The median lesion volumes were very close at days 0 and 60 in the recanalization group. Median lesion volume increased between day 0 and day 60 in the nonrecanalization group. The best predictors of late infarct size were day 0 lesion volume on DWI and day 1 recanalization.
Changes in magnetic resonance imaging parameters between day 0 and day 1, based on recanalization
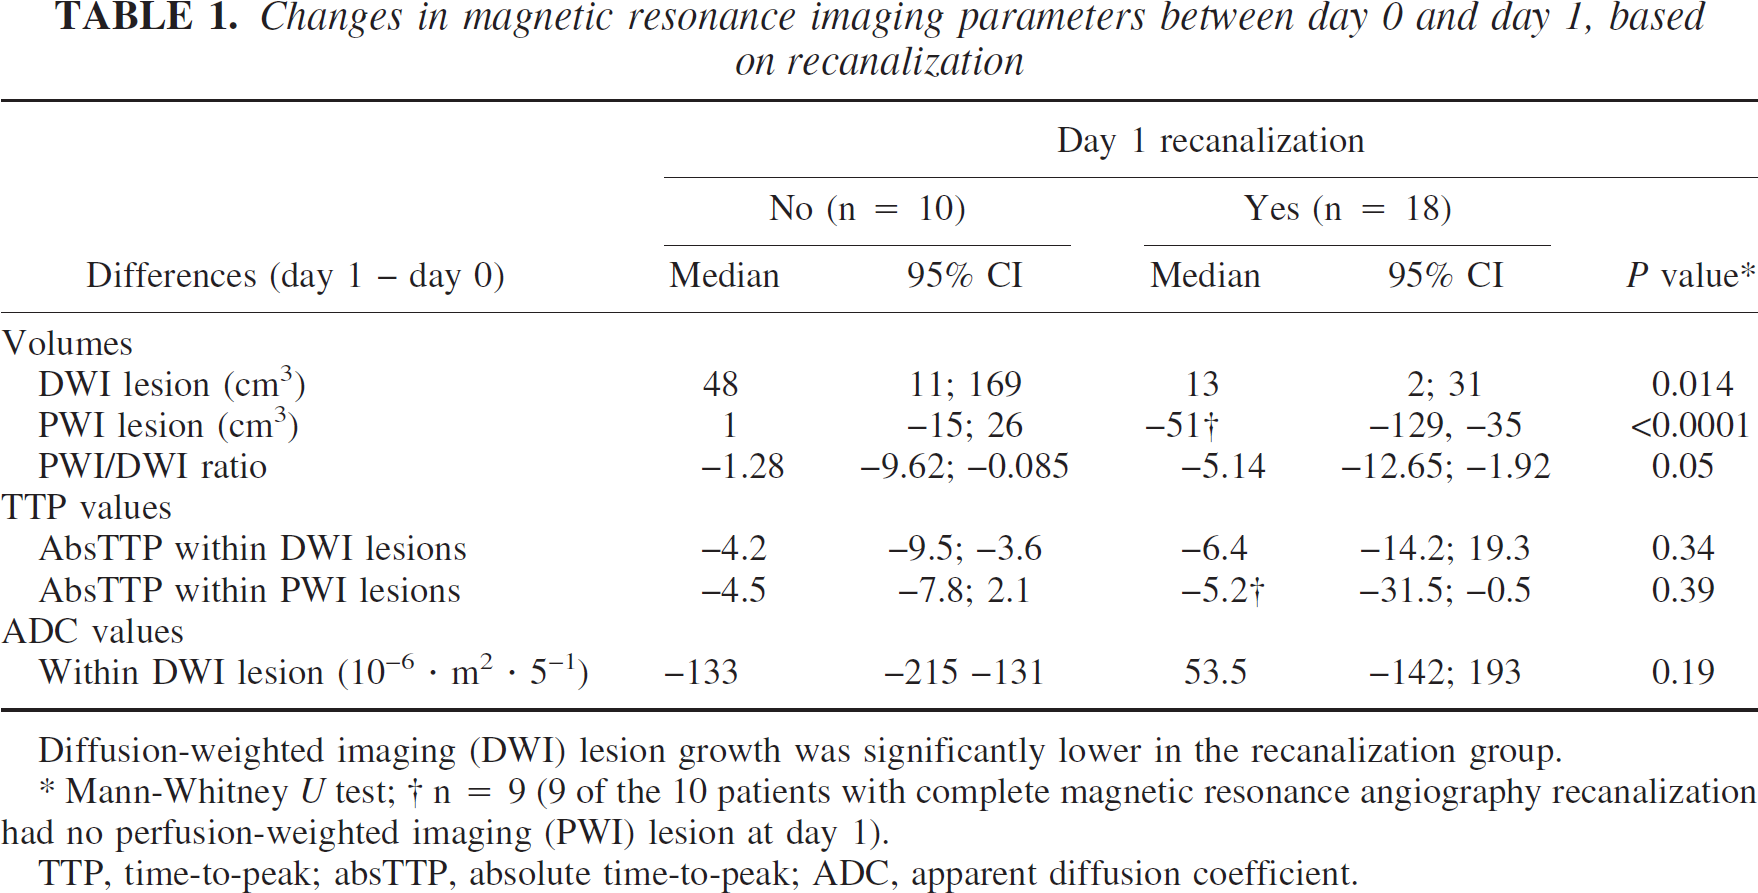
Diffusion-weighted imaging (DWI) lesion growth was significantly lower in the recanalization group.
Mann-Whitney U test
n = 9 (9 of the 10 patients with complete magnetic resonance angiography recanalization had no perfusion-weighted imaging (PWI) lesion at day 1).
TTP, time-to-peak; absTTP, absolute time-to-peak; ADC, apparent diffusion coefficient.
Diffusion-weighted imaging lesion volume growth between day 0 and day 1 was significantly lower in patients with recanalization (P = 0.014), with a median volume growth of 13 cm3 versus 48 cm3 in patients who remained occluded. The median lesion volume at day 60 in patients with recanalization was lower (14 cm3; mean: 40 cm3; range: 2–208) than for those who remained occluded (100 cm3; mean: 111 cm3; range: 10–220) (P = 0.017).
CORRELATION ANALYSIS AND PREDICTIVE FACTORS
Recanalization
Correlation between NIHSS score and recanalization.
Patients with recanalization had a lower mean baseline NIHSS score (13 ± 5.3) compared with those who had a persistent occlusion at day 1 (18.5 ± 5) (r = −0.50, P = 0.007). Patients with an NIHSS score <15 had a higher rate of recanalization (P = 0.046). Recanalization was correlated with a better clinical outcome at day 1 (r = −0.58; P = 0.001) and day 60 (r = −0.56, P = 0.007).
Correlation between day 0 time-to-peak and recanalization.
Time-to-peak within the day 0 lesion on diffusion-weighted imaging. The absTTP within the lesion on DWI was correlated with early recanalization (r = −0.50; P = 0.007). Mean absTTP within the DWI lesion was 35.8 ± 6 seconds in the recanalization group versus 42.9 ± 5.5 seconds in the nonrecanalization group.
Recanalization occurred in 13 (92.9%) of the 14 patients who had an absTTP less than or equal to 36.9 seconds and in 5 (35.7%) of the 14 patients with absTTP greater than 36.9 seconds. Figure 2 provides the distribution of recanalized versus occluded patients at day 1 MRA according to NIHSS and mean absTTP within the lesion on day 0 DWI.
Although a trend was observed, the mean rTTP was not significantly correlated with recanalization; mean rTTP was 9.2 ± 3.8 seconds within the recanalization group, versus 11.5 ± 5 seconds in the nonrecanalization group (P > 0.10).
Time-to-peak within the day 0 perfusion abnormality area. The mean absTTP within the day 0 PWI abnormality was significantly shorter in patients with recanalization at day 1 than in patients who had persistent occlusion (34.1 seconds versus 39.3 seconds, respectively) (r = −0.44, P = 0.02). We did not find a significant relation between the site of occlusion and the absTTP value (P = 0.672, F test).
There was no significant correlation between rTTP within the day 0 PWI abnormality and recanalization (P > 0.10).
Correlations between day 0 MRI parameters and day 1 MRA recanalization are listed in Table 2.
Correlations between day 0 magnetic resonance imaging parameters and day 1 recanalization (n = 28)
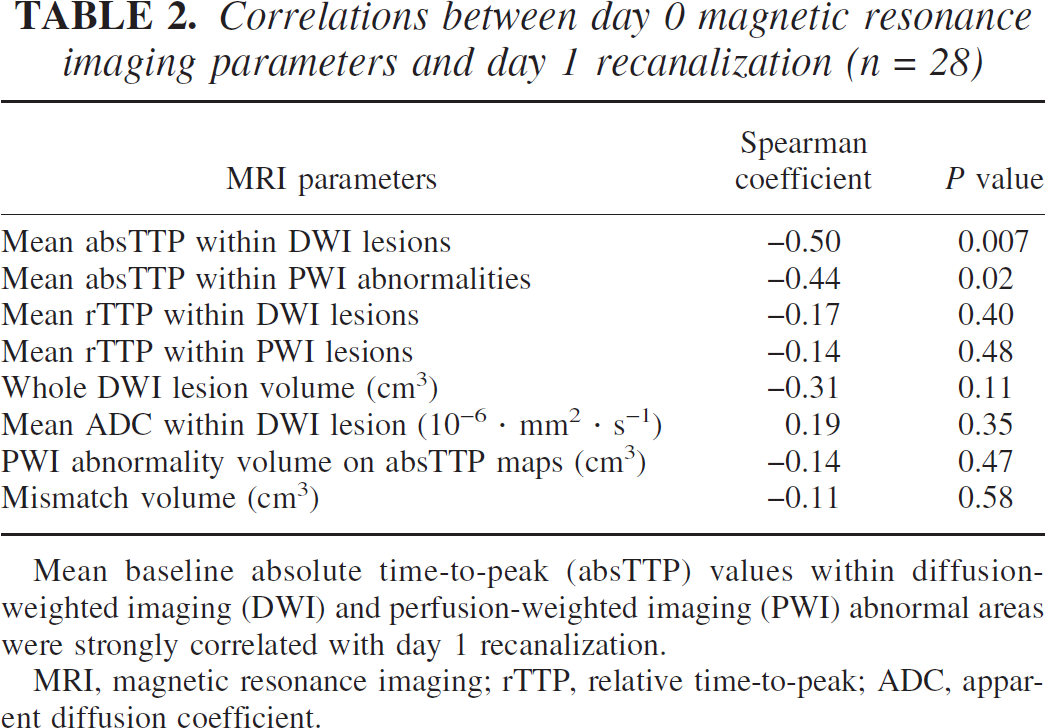
Mean baseline absolute time-to-peak (absTTP) values within diffusion-weighted imaging (DWI) and perfusion-weighted imaging (PWI) abnormal areas were strongly correlated with day 1 recanalization.
MRI, magnetic resonance imaging; rTTP, relative time-to-peak; ADC, apparent diffusion coefficient.
Correlation between site of occlusion and recanalization.
No significant correlation was found between the site of arterial occlusion at day 0 MRA and recanalization at day 1.
Univariate and multivariate logistic regression analysis.
The most powerful factors at day 0 that predict recanalization were baseline NIHSS score and mean absTTP within the lesion on DWI (Table 3). A scatterplot diagram of recanalization versus occlusion according to NIHSS score and mean absolute TTP within day 0 lesion on DWI is given in Fig. 3.
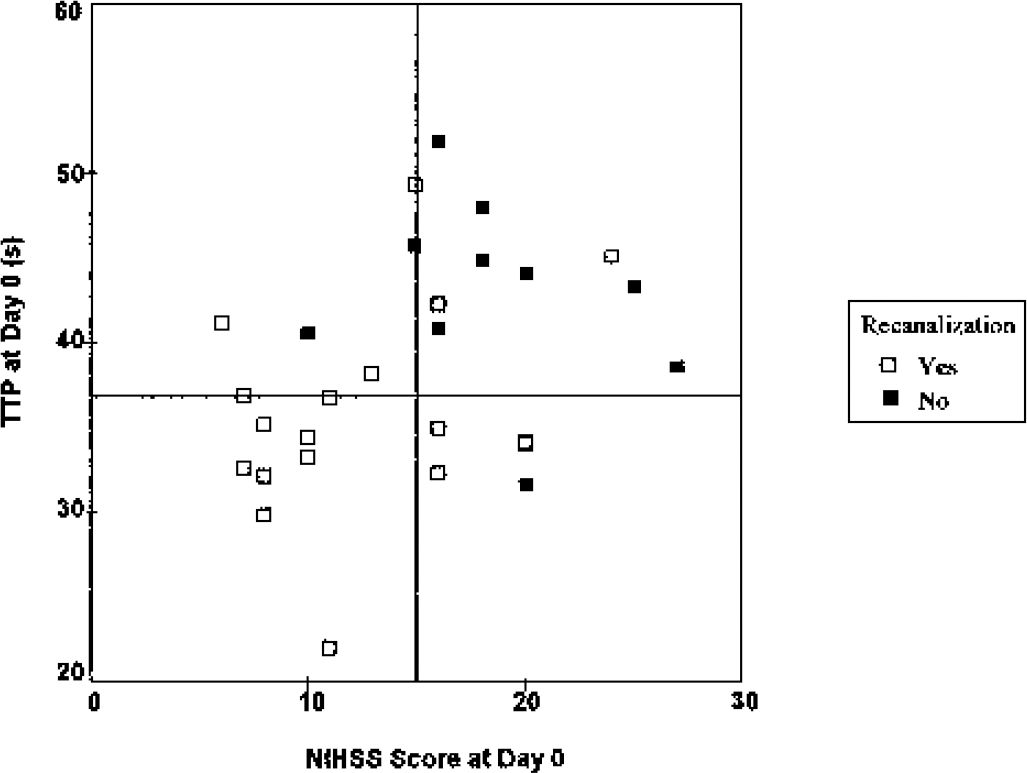
Recanalization versus occlusion according to National Institutes of Health Stroke Scale (NIHSS) score and mean absolute time-to-peak (absTTP) within day 0 lesion on diffusion-weighted imaging (n = 28). The horizontal line depicts the median (36.9 seconds) of absTTP values obtained within lesions on day 0 diffusion-weighted imaging. Recanalization was expected to be below this median value (P = 0.004). The vertical line depicts the median day 0 NIHSS score. Patients with an NIHSS score less than 15 had a higher rate of recanalization (P = 0.046) than patients with more severe baseline clinical status. All patients with a day 0 NIHSS less than 15 and an absTTP less than 36.9 seconds experienced recanalization.
Day 0 factors predicting day 1 recanalization
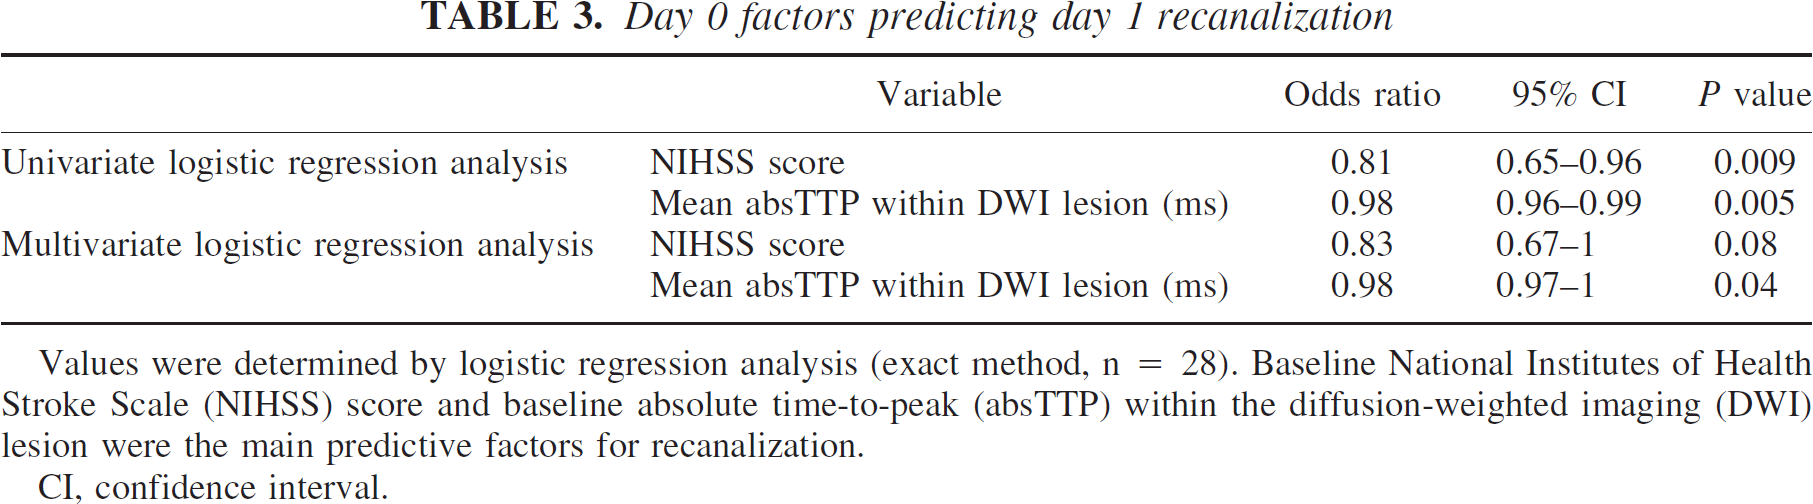
Values were determined by logistic regression analysis (exact method, n = 28). Baseline National Institutes of Health Stroke Scale (NIHSS) score and baseline absolute time-to-peak (absTTP) within the diffusion-weighted imaging (DWI) lesion were the main predictive factors for recanalization.
CI, confidence interval.
Final infarct size
Correlations of clinical and MRI parameters with day 60 T2WI infarct size are listed in Table 4.
Correlation of day 0 clinical and magnetic resonance imaging factors and recanalization, with day 60 T2-weighted imaging lesion volume (n = 28)
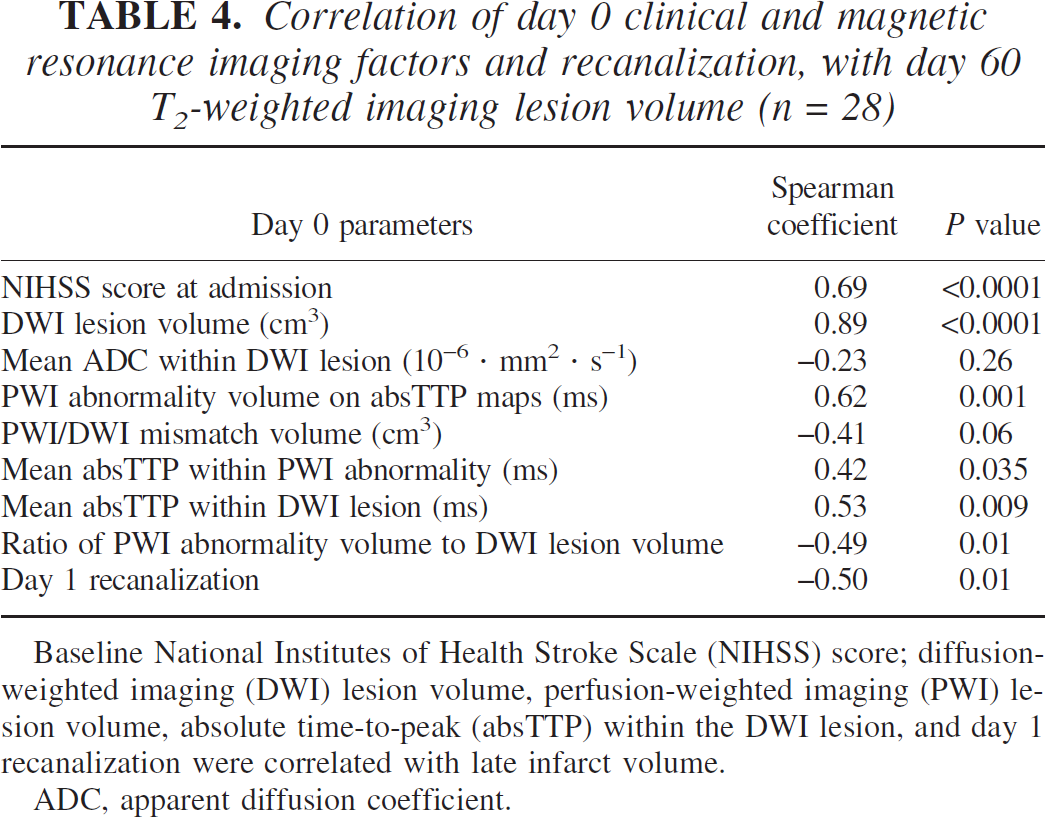
Baseline National Institutes of Health Stroke Scale (NIHSS) score; diffusion-weighted imaging (DWI) lesion volume, perfusion-weighted imaging (PWI) lesion volume, absolute time-to-peak (absTTP) within the DWI lesion, and day 1 recanalization were correlated with late infarct volume.
ADC, apparent diffusion coefficient.
Correlation between final infarct size and clinical status.
Final infarct size was highly correlated with initial clinical severity (r = −0.50, P = 0.007). At day 60, a strong correlation was observed between T2WI lesion volume and NIHSS score (r = 0.82, P < 0.0001).
Correlation between final infarct size and magnetic resonance imaging parameters.
Day 0 DWI lesion volume was highly correlated with final infarct size (r = 0.82, P < 0.0001).
Mean absTTP within the lesion on DWI (r = 0.53, P = 0.001) and within the lesion on PWI (r = 0.66, P = 0.001) were also correlated with final infarct size.
The day 0 PWI/DWI mismatch ratio was significantly correlated with day 60 T2WI lesion volume (r = −0.49, P = 0.01). Recanalization at day 1 MRA was correlated with final infarct size (r = −0.50, P = 0.01).
Multiple linear regression analysis.
Day 0 and day 1 factors predicting late lesion volume are listed in Table 5. The main independent MRI factors predicting final lesion volume (R2 = 0.86) were the day 0 DWI lesion volume (r = 0.546, P = 0.004), and arterial recanalization (r = −0.920, P = 0.015).
Day 0 and day 1 factors predicting late lesion volume (n = 28)
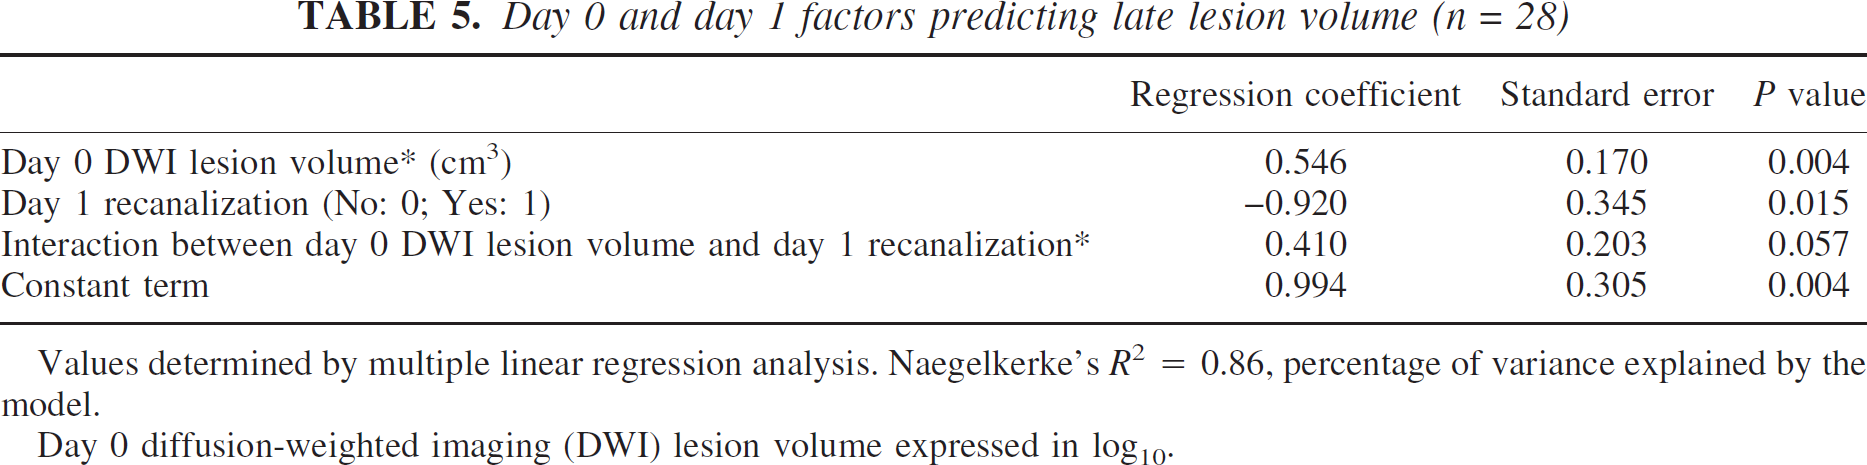
Values determined by multiple linear regression analysis. Naegelkerke's R2 = 0.86, percentage of variance explained by the model.
Day 0 diffusion-weighted imaging (DWI) lesion volume expressed in log10.
DISCUSSION
Acute ischemic stroke is a dynamic and heterogenous phenomenon. To date, the predictive value of early MRI parameters on recanalization and tissue viability has been poorly documented (Parsons et al., 2002).
Factors predicting final infarct size
Diffusion-weighted imaging lesion volume.
The prognostic value of early DWI lesion volume on infarct size has been well documented at the subacute stage (Barber et al., 1998; Lansberg et al., 2001; Schwamm et al., 1998). Late assessment of infarct, however, may provide more accurate information on tissue outcome. As documented at the subacute stage, we found a predictive value for early DWI lesion volume on late T2WI infarct size.
Apparent diffusion coefficient values.
The prognostic value of the severity of ADC decrease at the acute stage for tissue outcome is debated (Fiehler et al., 2002; Oppenheim et al., 2001). In our study, ADC values obtained within the day 0 DWI lesion were not significantly correlated with recanalization or final infarct size.
Recanalization.
We found significantly smaller infarcts in the recanalization group than in the nonrecanalization group. These results corroborate previous findings obtained with a different imaging protocol (Jansen et al., 1999; Schellinger et al., 2001). In our study, we chose to evaluate tissue outcome at a later date (day 60 instead of day 5 T2WI), because we hypothesized that a potentially reversible edematous component may persist during the first weeks after stroke onset and may hamper the interpretation of lesion volume course.
Factors predicting recanalization
Up to now, the predictive value of early hemodynamic MRI parameters on recanalization has not been clearly assessed. Our study showed that hemodynamic status significantly influences early recanalization. A delayed baseline absTTP value within the lesion on DWI was observed in patients with persistent occlusion. Experimental and clinical studies provide evidence of heterogeneity of collateral flow after carotid artery occlusion (Bozzao et al., 1989; Coyle and Panzenbeck, 1990; Kleiser and Widder, 1992), and the pattern of collateral supply has significant influence on hemodynamic status (Kluytmans et al., 1999). In case of acute occlusion of one main cerebral artery, collateral flow from the anastomotic network and subsequent cerebrovascular reserve may be insufficient in some patients (Bozzao et al., 1989; Kleiser and Widder, 1992; Von Kummer et al., 1995). As a result, this poor collateral network may restrict the access of the contrast agent within the area of infarction, thus accounting for a delayed TTP. This low flow state may favor more organized thrombi that could be less sensitive to therapy.
Arterial recanalization influenced the course of lesion volume. The growth of the lesion on DWI in patients who recanalized is limited (Kidwell et al., 2000; Parsons et al., 2002), thus resulting in a lower median lesion volume at day 60 T2WI. The latter was smaller than the median day 1 DWI lesion volume in patients who recanalized. These data suggest that subacute DWI lesions may partially reverse (Kidwell et al., 2000).
Time-to-peak is a widely available method of perfusion assessment that calculates the time it takes the bolus of contrast to reach its maximum concentration in a given region of the brain. Time-to-peak map abnormalities were shown to correlate with stroke volume and outcome scores in clinical studies (Beaulieu et al., 1999; Fiehler et al., 2001; Karonen et al., 2000; Neumann-Haefelin et al., 1999; Sunshine et al., 1999; Thijs et al., 2001); therefore, these maps are commonly used for the assessment of the perfusion defect. Most studies using mean transit time or TTP maps are based on relative values obtained by comparison of the affected area with the contralateral hemisphere, and a prespecified side-to-side delay (typically 4–6 seconds), is used to provide automated segmentation of the perfusion abnormality. We found that absTTP within the baseline DWI lesion was more predictive than rTTP for recanalization. Absolute TTP is not routinely used, and, to the best of our knowledge, no studies have compared the predictive value of relative and absolute TTP for early recanalization. Absolute time-to-peak may better take into account the factors influencing contrast arrival time into the region of interest, including cardiac output, cerebral perfusion pressure, hemodynamically relevant severe extraand/or intracranial arterial stenosis or occlusion, vessel wall compliance, and blood viscosity.
Absolute time-to-peak within the baseline DWI lesion was more delayed and more predictive for arterial recanalization than absTTP within the whole PWI abnormality. Because the highest variations were expected within the DWI lesion, absTTP within the latter could have been more demonstrative. Although DWI lesion suggests severe damage, tissue perfusion decreases progressively from the periphery toward the ischemic core. This effect is most pronounced on the TTP maps, with a linear association between ADC decrease and TTP increase, as demonstrated by Fiehler et al. (2001).
Limitations of the study
The small sample size did not allow us to correct for multiple comparisons and may be considered a limitation.
The assessment of perfusion parameters was based on only seven PWI slice levels and may have led to an underestimation of the volume of PWI abnormality. A single hemodynamic parameter (TTP) was used to assess hemodynamic status. Moreover, TTP is an indirect measure of tissue perfusion; however, the lesion borders are often more distinct than on regional cerebral blood flow and volume, and TTP maps are easy to obtain at the time of acute stroke MR evaluation (Neumann-Haefelin et al., 1999; Wittsack et al., 2002).
The purpose of our work was not to assess the efficacy of thrombolytic therapy because we had no matched control group of untreated patients. Our rt-PA protocol was different from that of the NINDS study (National Institute of Neurological Disorders and Stroke Study Group, 1995) according to the dose and the therapeutic time window, thus preventing the widespread generalizability of our findings. Although a correlation has been reported between lesion growth and the degree of mismatch (Baird et al., 1997; Beaulieu et al., 1999; Jansen et al., 1999; Schellinger et al., 2001), the extent of day 0 DWI/PWI mismatch had no predictive value for early recanalization. Therefore, the selection of patients for thrombolytic therapy based exclusively on acute PWI/DWI mismatch may be questionable (Albers, 1999; Rohl et al., 2001). Moreover, the value of the PWI/DWI volume ratio used to define the mismatch in clinical studies is not standardized and varies from greater than 1 to greater than 2 (Fiehler et al., 2001; Schellinger et al., 2001; Schlaug et al., 1999; Sorensen et al., 1996), and the incidence of the mismatch is also variable.
The recanalization rate after thrombolysis is known to be better with more distal occlusions (Schellinger et al., 2001; Linfante et al., 2002). In the present study, the site of occlusion was not significantly correlated with recanalization, probably because of the small number of patients included.
The site of the occlusion may influence the NIHSS score. Although we demonstrated a relation between the length of TTP and baseline NIHSS score, our sample size did not allow a robust comparison between TPP distribution according to the site of occlusion.
Day 0 DWI lesion volume and recanalization were more powerful than mismatch in predicting final infarct volume. The latter was highly correlated with the NIHSS score at day 60.
In conclusion, the most powerful predictive factors for early recanalization were the baseline NIHSS score and the absTTP measured within the DWI. Acute DWI lesion volume and early recanalization better predicted tissue outcome. Because of the limited sample of our study, larger MRI studies involving these parameters are required to draw more robust conclusions.
Footnotes
Acknowledgments
The authors thank the Siemens Company, for providing the ADC and TTP processing softwares, and Michèle Canova, for her help in collecting and processing the data.