
Abstract
To evaluate impact of glucose burden on diffusion-weighted imaging (DWI)-lesion evolution according to ischemia duration in stroke. We studied 47 patients with transcranial Doppler (TCD)-documented artery occlusion treated with intravenous tissue plasminogen activator. Hyperglycemia (HG) was defined as glucose > 140 mg/dL. A subcutaneous device continuously monitored glucose during 24 h. Magnetic resonance imaging was performed pretreatment (1) and at 24 to 36 h (2) in 30 patients. We measured initial PWI lesion (PW1) and DWI growth: DW2–DW1 (DWg). Serial TCD during 24 h determined occlusion time (OT). National Institutes of Health Stroke Scale (NIHSS) scores were obtained at baseline and 48 h. Poor short-term clinical course defined as <50% recovery of initial NIHSS. Baseline NIHSS was 18. On admission 10 patients (21.3%) were hyperglycemic and presented similar NIHSS, DW1, and PW1 lesion extension as those without HG. During monitoring 24 patients (51%) had HG, 21 (45%) of them during OT (median OT 12 h). Median 48 h-NIHSS was 10; 15 patients presented poor outcome. 48 h-NIHSS was higher in patients with HG during OT (15 versus 3; P < 0.001). Patients with favorable outcome had shorter OT (8.4 versus 17.4 h; P < 0.001). However, the only independent predictor of poor outcome was HG during OT (OR: 20.3; 95% CI: 3.77 to 108.8; P < 0.001). At 24 h mean DWg was 52 cm3. A receiver operating characteristic curve identified DWg > 14 cm3 best predictor of poor outcome (sensitivity, 85.7%; specificity, 75%). Total OT (P = 0.007) and HG during OT (P = 0.01) showed the strongest correlation with DWg. DWI lesion grew 2.7 times faster in patients with HG than without HG during OT (1.73 versus 4.63 cm3/h of occlusion; P = 0.07). In a regression model the only independent predictor of DWg was HG during OT (OR: 10.83; 95% CI: 1.96 to 59.83; P = 0.006). Hyperglycemia, especially during OT, has a powerful deleterious effect after stroke accelerating brain damage.
Keywords
Introduction
Hyperglycemia (HG) in the acute phase of ischemic stroke is a frequent phenomenon that affects up to 50% of the patients, often without a preexisting diagnosis of diabetes (Kiers et al, 1992). Whether acute HG is causally associated with worse stroke outcome or simply reflects a more severe stroke is still controversial. However, there is growing evidence that HG has a strong deleterious effect during the first hours after stroke onset exacerbating ischemic brain injury, accelerating the molecular processes leading to cell death and resulting finally in larger infarct volumes and poorer outcomes (Bruno et al, 2002; Parsons et al, 2002; Toni et al, 1994). As a result, the relative risk of death in hyperglycemic nondiabetic stroke patients is increased by three times (Capes et al, 2001).
Recent magnetic resonance imaging (MRI)-based studies showed that elevated blood glucose levels are associated with an increased recruitment of ischemic penumbra into irreversible infarction and poor outcome. Furthermore, HG appeared to increase brain lactate production, which also correlated with reduced penumbral salvage (Baird et al, 1997; Parsons et al, 2002). These studies, however, did not take into account arterial recanalization or total time of ischemia, the most powerful predictor of final infarct size and clinical outcome (Arenillas et al, 2002). This is particularly important in these patients as HG has shown to hamper the fibrinolytic processes delaying reperfusion of the hypoperfused at-risk tissue (Ribo et al, 2005a).
Most studies have used a single time point measure of blood glucose (usually on admission) to define glycemia. However, glycemia is an evolving variable that experiences important changes over the first hours after stroke. Continuous monitoring of glycemia through the period during which the ischemic penumbra exists may yield a more robust measure of the influence of HG on infarct evolution (Baird et al, 1997; Wagner et al, 1992).
In a group of tissue plasminogen activator (tPA)-treated stroke patients submitted to active glucose control, we continuously monitored glycemia during 24 h after stroke onset and determined its MRI and clinical impact in relation to the total time of ischemia. We aim to study if DWI lesion grows faster in patients with HG during the occlusion phase of stroke.
Materials and methods
From January 2004 to January 2006, 47 patients with an acute (< 6 h from symptom onset) nonlacunar stroke treated with intravenous tPA and presenting a TCD-documented intracranial arterial occlusion were prospectively studied. Study protocol was approved by the institutional ethics committee and informed consent was obtained from patients or their relatives.
Clinical and Transcranium Doppler Protocol
The study protocol for patient selection for tPA treatment was described elsewhere (Ribo et al, 2005b). A detailed history of vascular risk factors was obtained from each patient. Clinical examination was repeatedly performed during the first hours; short-term outcome was determined at 48 h by means of the National Institutes of Health Stroke Scale (NIHSS) (Brott et al, 1992). Favorable/unfavorable short-term clinical course was defined as ≥ / < 50% recovery of baseline NIHSS at 48 h.
A standard TCD examination was performed in the emergency room before tPA administration using 2-MHz equipment. A set of diagnostic criteria was applied to assess arterial occlusion as described previously (Burgin et al, 2000; Demchuk et al, 2001). Only patients with TCD identifiable intracranial arterial occlusion were included. Continuous TCD monitoring during 2 h after tPA bolus and repeated fast-track TCD exams at 6, 12, 18, and 24 h from symptom onset assessed clot location and recanalization rates as described previously (Ribo et al, 2006). Briefly, recanalization on TCD was diagnosed as partial when blunted or dampened signals appeared in a previously shown absent or minimal flow (i.e., when a proximal occlusion becomes a distal occlusion). Complete recanalization on TCD was diagnosed if the end-diastolic flow velocity improved to normal or elevated values (normal or stenotic signals). No change in the abnormal waveforms indicated that no recanalization had occurred. Total time of occlusion was defined as the elapsed time from symptom onset to the moment when flow improvement was observed, according to first TCD exam (Alexandrov et al, 2001).
Glucose Measurements and Management
We defined HG as glucose levels higher than 140 mg/dL in consistency with our previous studies (Alvarez-Sabin et al, 2003, 2004). On admission, capillary glucose was recorded. An institutional approved fast-acting insulin sliding scale was applied to all patients with the aim to maintain glycemia < 140 mg/dL. Glycemia was then monitored: immediately after tPA bolus, a continuous glucose monitor was placed (MiniMed CGMS System Gold, Medtronic, Northridge, CA, USA). The subcutaneous sensor detected glucose through an electrochemical reaction with glucose oxidase and recorded abdominal interstitial glucose levels every 5 mins during the following 24 h (Mastrototaro 1999). These data were then downloaded to a computer that calculated the following glucose parameters: minimum, maximum, average, area under the curve > 140 mg/dL, and total time of HG (Figure 1). TCD monitoring allowed determination of total occlusion time (OT). The same glucose-related parameters were therefore calculated during time of arterial occlusion. Glycemia at the time of reperfusion was also recorded.
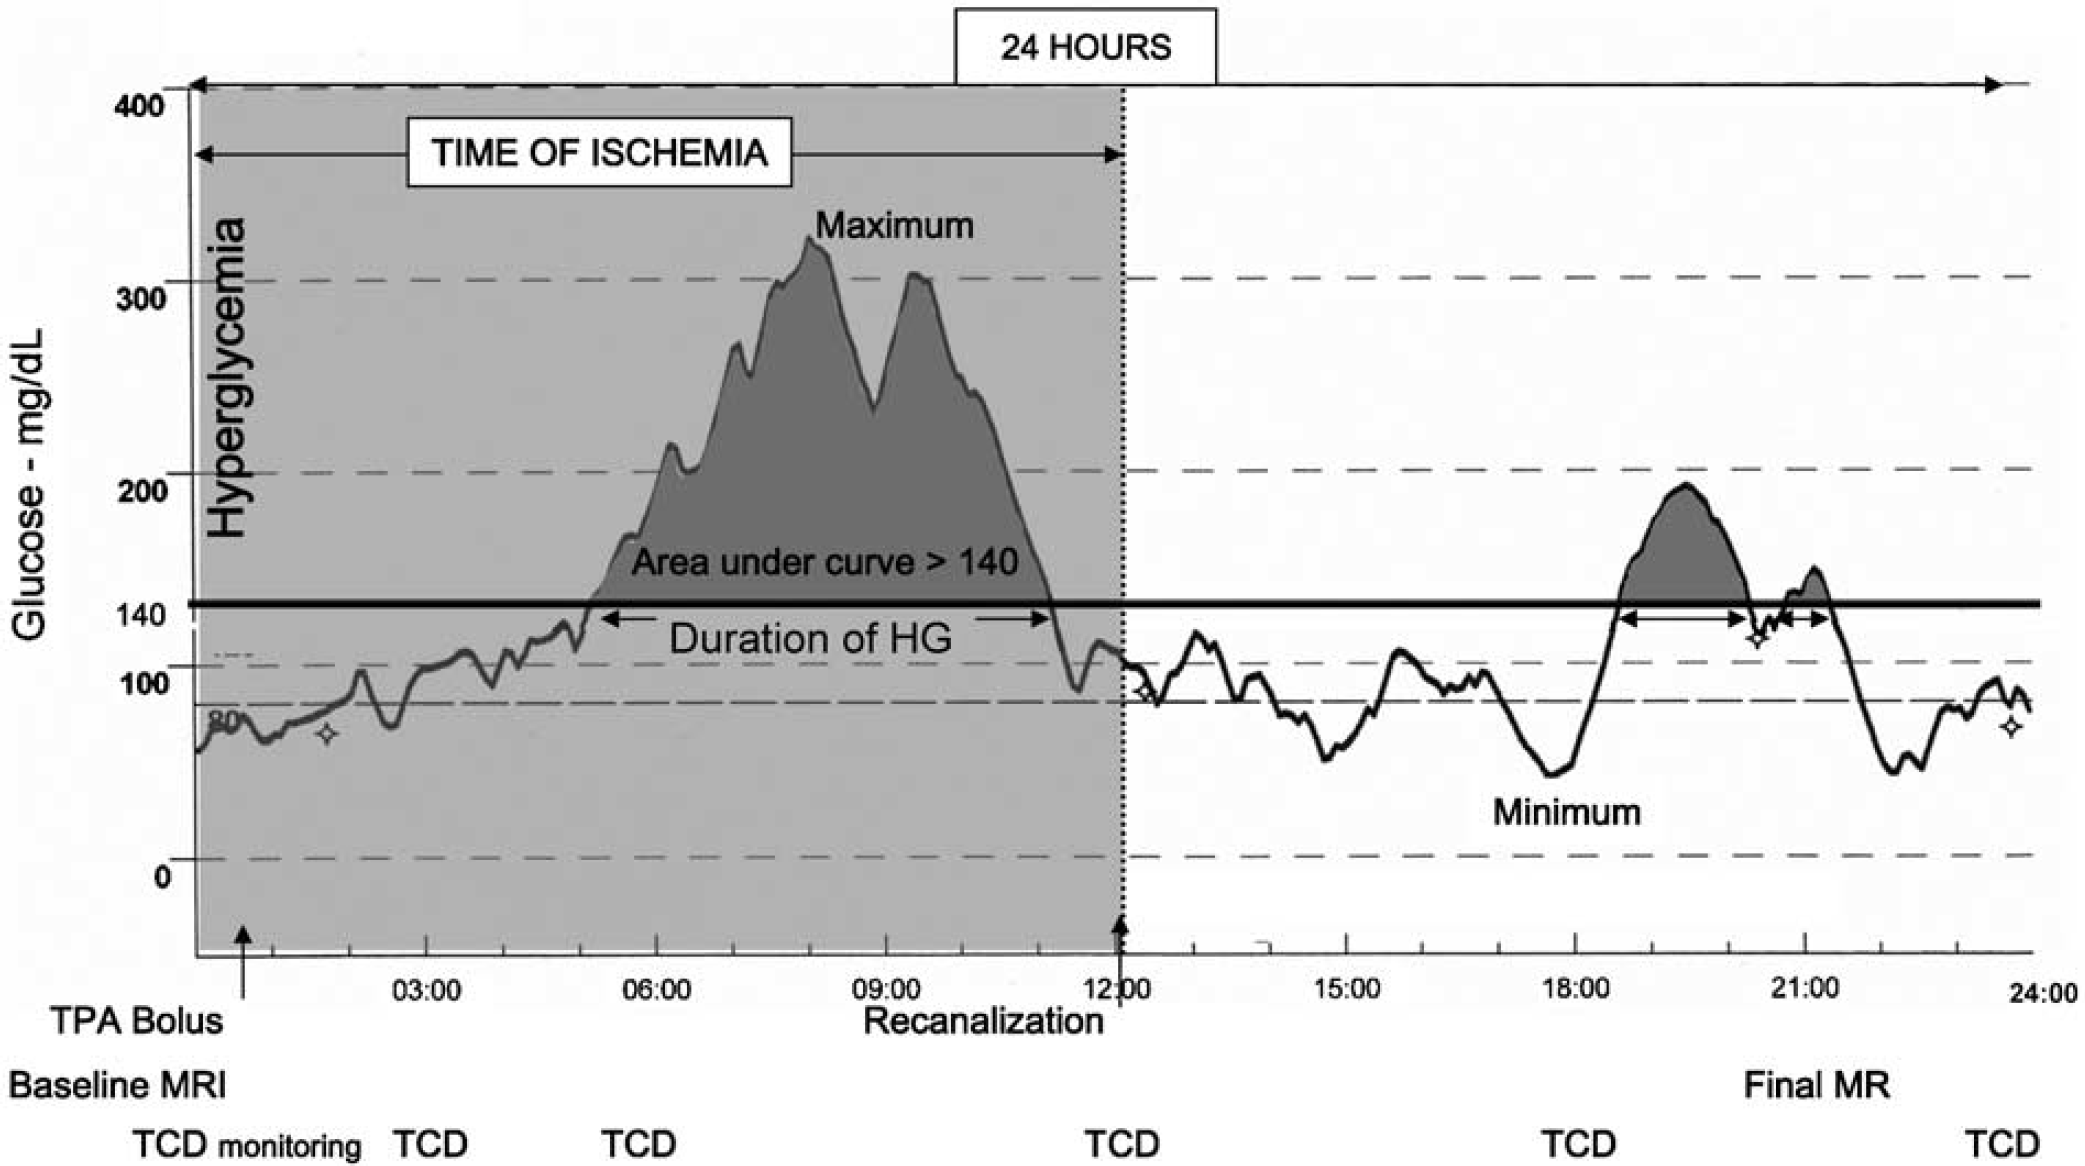
Study design: 24-h continuous glucose level profile, time of ischemia, and timing of diagnostic procedures.
Imaging Protocol and Tissue Plasminogen Activator Treatment Criteria
Thirty patients completed the multiparametric MRI protocol including DWI, PWI (time to peak), and MR-angiography: on admission (1) and at 24 to 36 h (2). All MRI studies were performed with a 1.5-T whole-body imaging system with 24-mT/m gradient strength, 300 ms increase time, and an echo-planar-capable receiver equipped with a gradient overdrive (Magnetom Vision Plus, Siemens Medical Systems, Germany). The images included axial T2-weighted susceptibility-based echo-planar gradient-echo sequence (0.8/29/1 (TR/TE/acquisitions), total acquisition time 2 secs), axial diffusion-weighted echo-planar spin-echo sequence (4000/100/2 (TR/TE/acquisitions), total acquisition time 56 secs), and axial perfusion-weighted echo-planar gradient-echo sequence (2000/60/40 (TR/TE/acquisitions), total acquisition time 80 secs). Detailed MRI protocol and volumetric assessment of lesion size were described previously (Rosell et al, 2005). The measured volumes were DWI and PWI (TTP > 4 secs relative to contralateral side) lesions on admission (DW1, PW1) and DWI lesion at 24 to 36 h (DW2). Infarct growth (DWg) was defined as DW2–DW1. Radiologist was masked for clinical variables.
Statistical Analyses
Descriptive and frequency statistical analyses were obtained, and comparisons were made with the SPSS 12.0 statistical package. Statistical significance for intergroup differences was assessed by Pearson χ2 or the Fisher exact test for categorical variables and Student's t-test and analysis of variance for continuous variables. When indicated, Mann–Whitney U and Spearman tests were used. Pearson's correlation coefficient was used to determine correlations between glucose-related parameters and other continuous variables. To determine the total time of ischemia and DWg volume cut point that better predicted poor outcome, a receiver operating characteristic curve was configured. Multivariate regression analysis was performed to determine factors that could be considered independent predictors of poor outcome or DWI lesion growth. A P-value of <0.05 was considered significant except for multivariate analysis purposes where after adjusting with the Bonferroni correction test, considering the correlation between the different variables, a P-value of <0.01 was considered significant.
Results
A total of 47 patients (mean age 73 years, 28 male patients) with a TCD-documented middle cerebral artery (MCA) occlusion were included in the study. Median NIHSS score on admission was 18 (interquartile range IR: 12 to 21), median time to treatment was 165 mins (ranging from 65 to 360 mins) and median total occlusion time was 12 h (IR 4.7 to 24).
Glucose Measurements
Nine patients (19%) had a previous history of diabetes. Mean baseline glucose level was 124 ± 34 mg/dL. On admission 10 patients (21%) were HG and presented similar baseline median NIHSS (HG 19 versus No HG 17; P = 0.21), DW1 (34 cm3 versus 29 cm3; P = 0.23) or PW1 (250 cm3 versus 220 cm3; P = 0.64) lesion volumes as those without HG. During the first 24 h HG was observed in 24 patients (51%), of them 21 (45%) became hyperglycemic during ischemia time. Thirty-nine percent of the patients who had HG presented normal glucose levels on admission. Main glucose variables are shown in Table 1.
Demographic data, risk factor profile or clinical findings, and comparison according to outcome
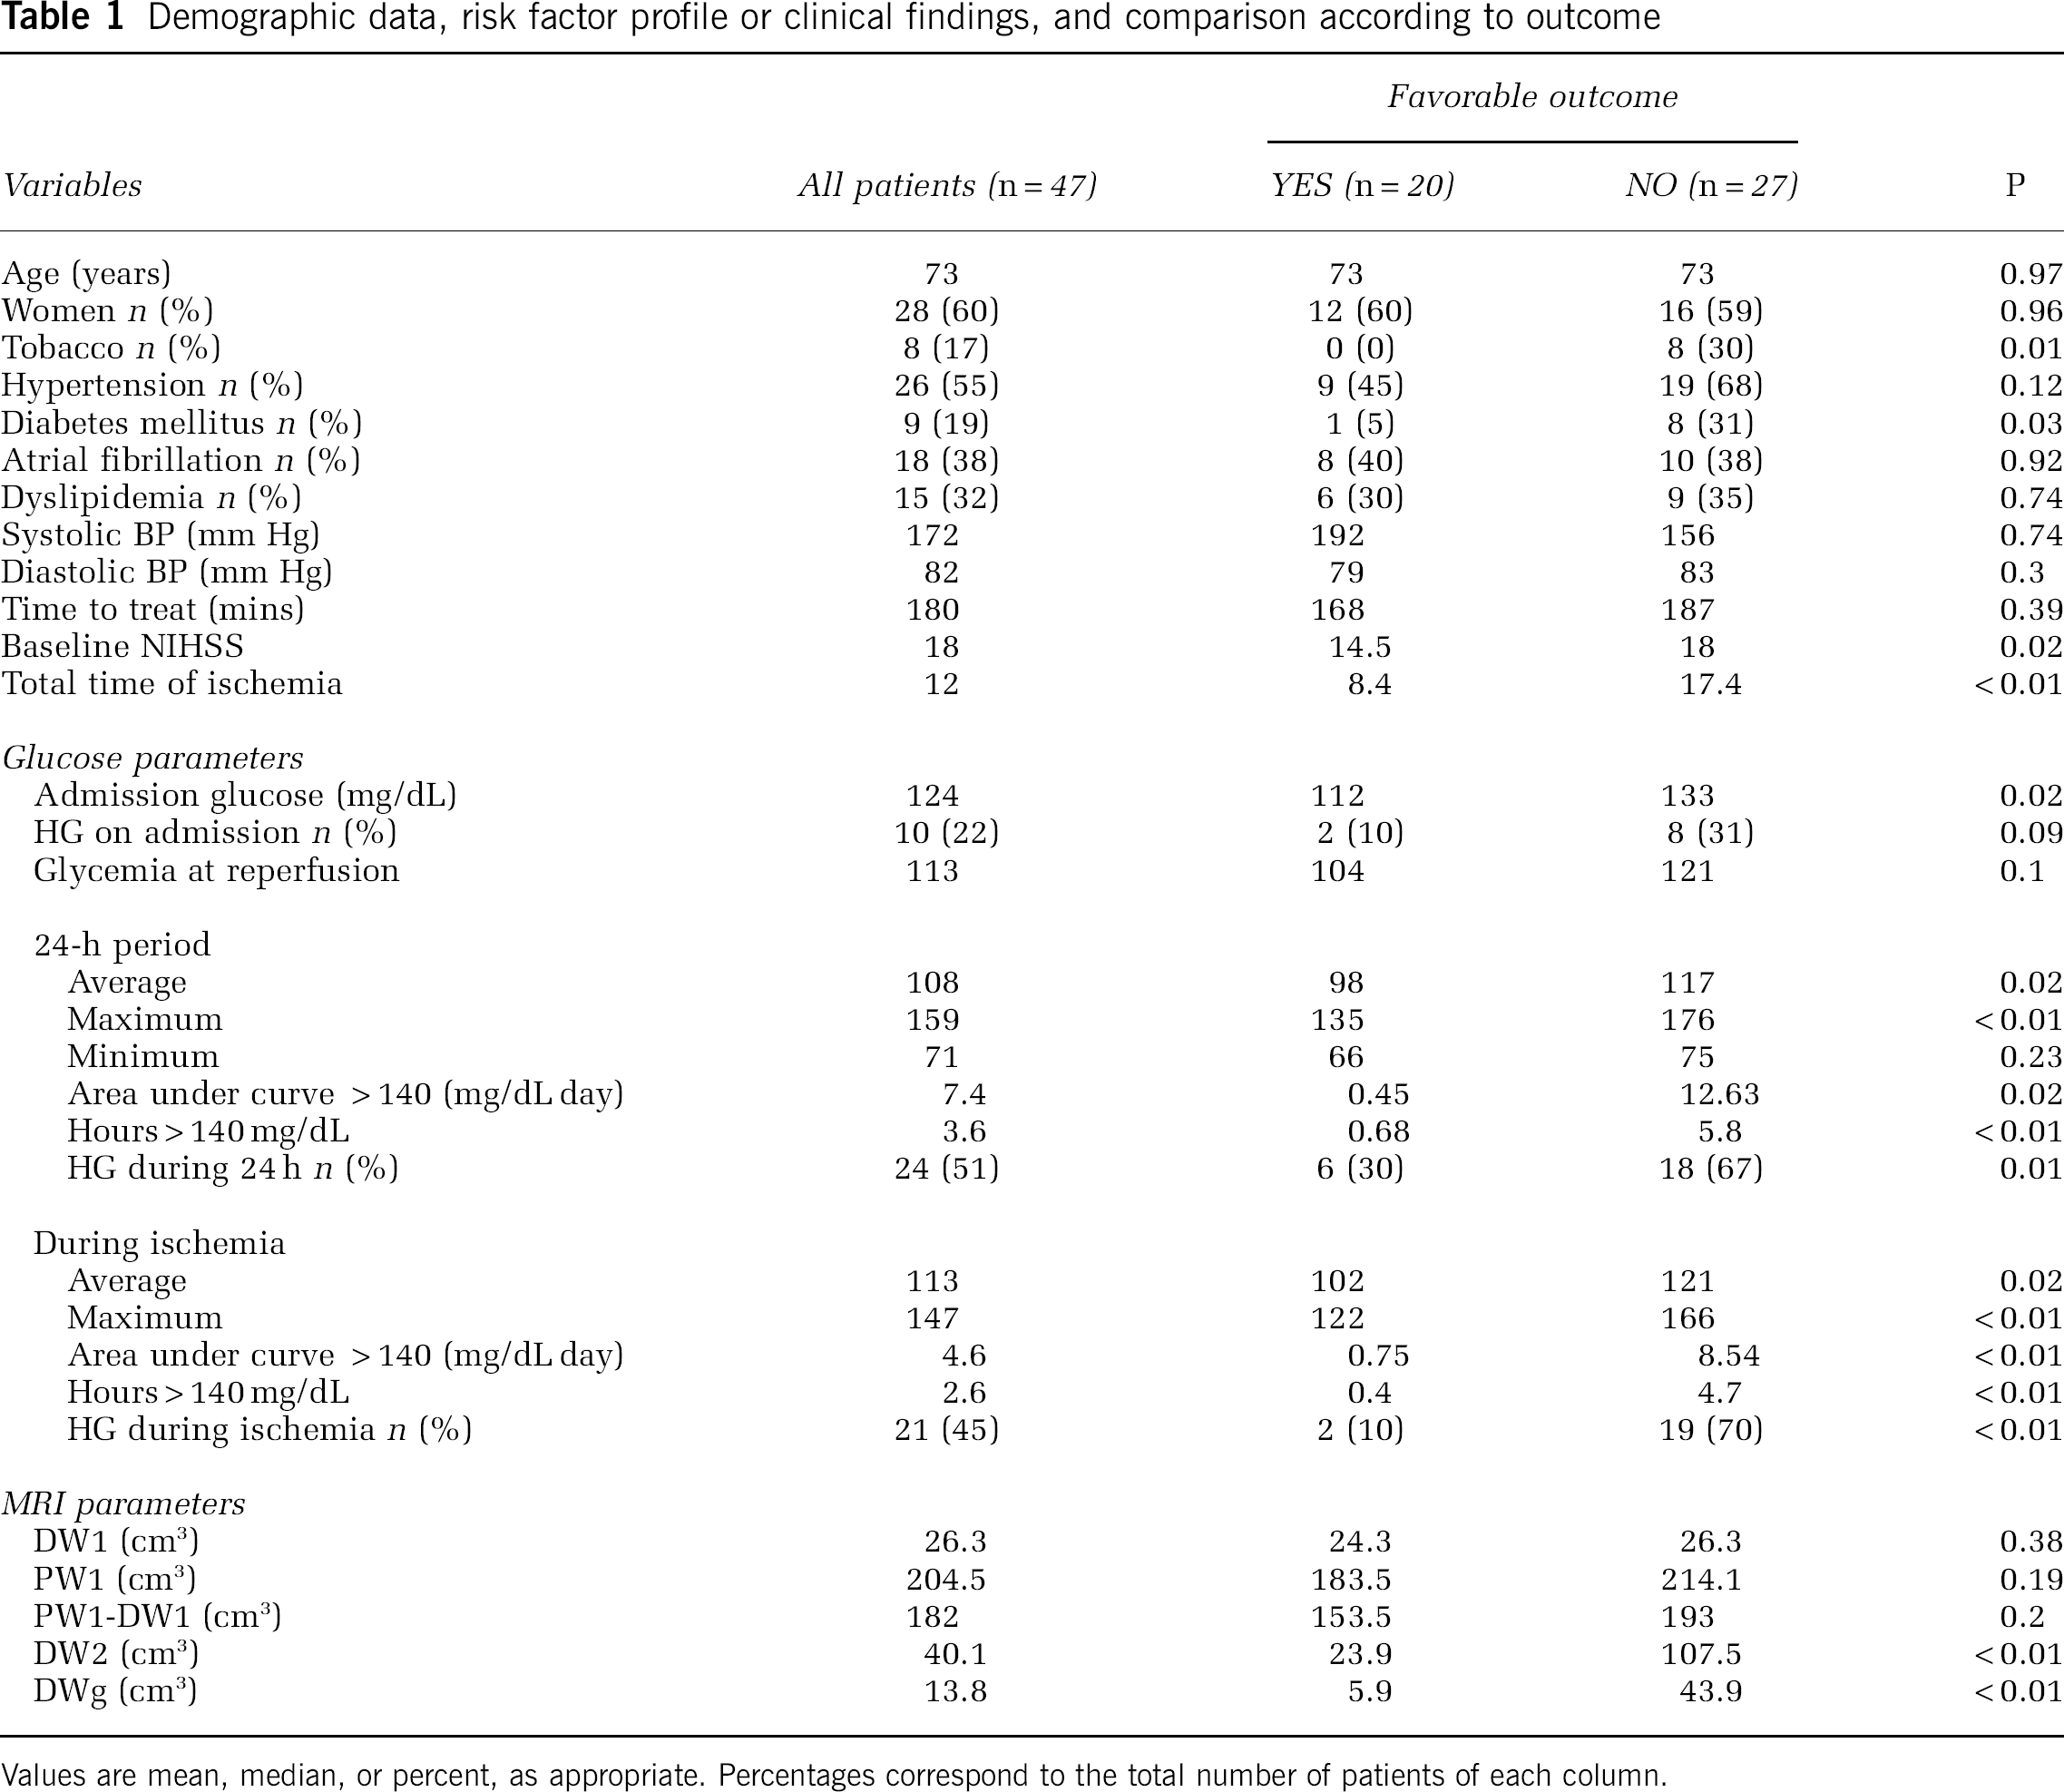
Values are mean, median, or percent, as appropriate. Percentages correspond to the total number of patients of each column.
Clinical Outcome
At 48 h median NIHSS was 10 (IR 3 to 17) and 43% of patients (n = 20) achieved a favorable short-term clinical evolution (median 48 h NIHSS 3 versus 16 for patients with unfavorable outcome, P < 0.001). Several glucose-related parameters were associated with outcome; however, the strongest associations were observed during time of occlusion (Table 1). The area under the curve > 140 mg/dL during ischemia, which indicates HG load including severity and duration, was strongly associated with outcome (P < 0.001) (Table 1).
Those patients with HG during OT presented higher median 48 h NIHSS than those who remained under 140 mg/dL (15 versus 3; P < 0.001). Only two of the patients with HG during occlusion time achieved a favorable clinical evolution (9.5% versus 70.3%; P < 0.001).
Patients with favorable outcome had a shorter time of occlusion (8.4 versus 17.4 h; P < 0.001). When comparing patients according to glucose control, a receiver operating characteristic curve determined that in those patients with HG during OT, the time of ischemia leading to poor outcome was only 3.5 h (sensitivity, 50%; specificity, 100%) versus as long as 7.5 h in those patients with an adequate glucose control (sensitivity, 72%; specificity, 62%). The multivariate analysis showed that the only independent predictor of poor outcome was HG during OT (OR: 20.3; 95% CI: 3.77 to 108.8; P < 0.001).
Magnetic Resonance Imaging Results
Median baseline MRI volumes were DW1: 26.3 cm3 (IR 9 to 48) and median PW1: 204.5 cm3 (125 to 288). Mean time to second MRI was 28 ± 3 h. None of the patients had a symptomatic intracranial hemorrhage. Follow-up MRI showed a median DW2 lesion volume of 40.1 cm3 (23 to 128), leading to a median DWg of 13.8 cm3 (4 to 57). A receiver operating characteristic curve identified a DWg > 14 cm3 as the best predictor of poor outcome (sensitivity, 85.7%; specificity, 75%). Among all studied variables, total OT (P = 0.007) and duration of HG during OT (P = 0.01) showed the strongest correlation with DWg (Figure 2). DWI lesion grew 2.7 times faster in patients with HG during OT than in those without HG during OT (1.73 versus 4.63 cm3/h of occlusion; P = 0.07) (Figure 3). In a regression model the only independent predictor of DWg was HG during OT (OR: 10.83; 95% CI: 1.96 to 59.83; P = 0.006).
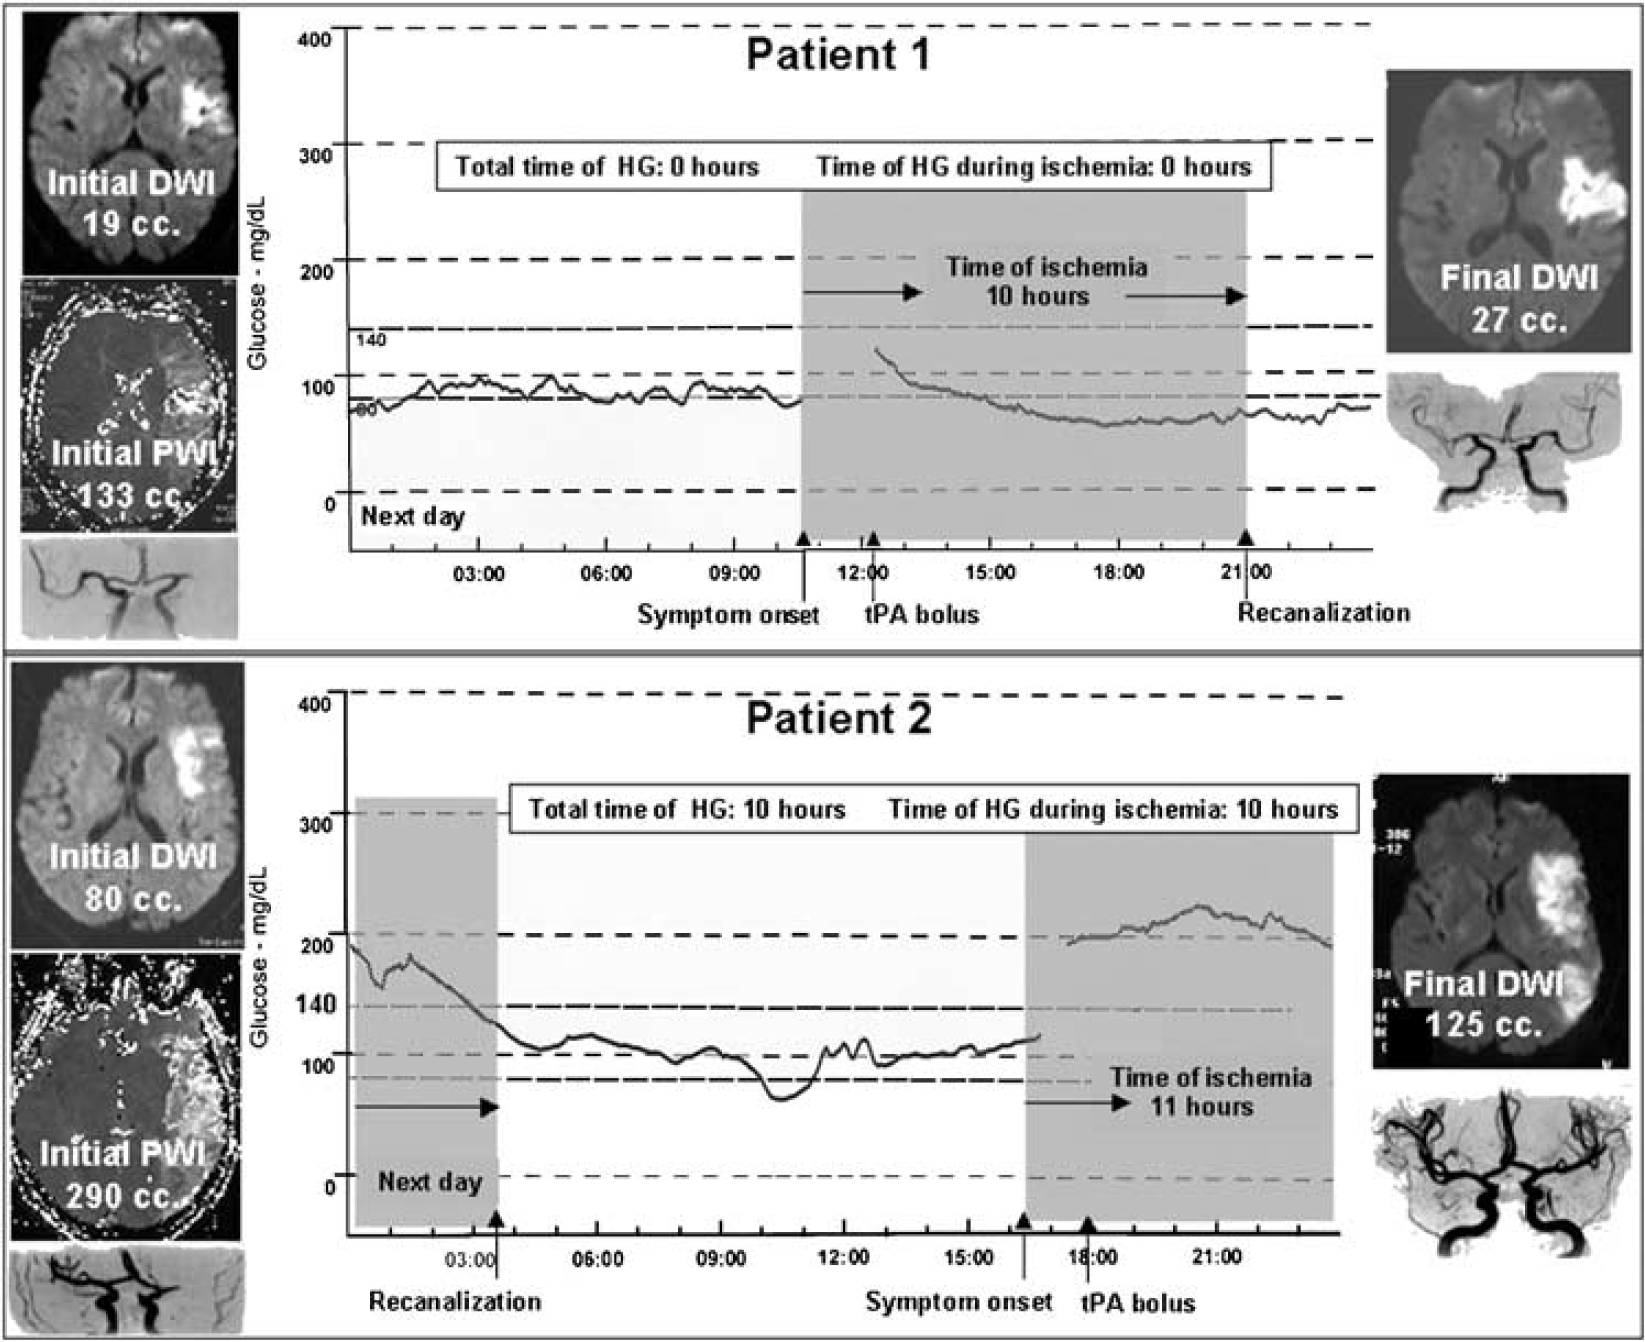
Results observed in two different patients with (1) and without (2) optimal glucose control during ischemia. Despite a similar total time of ischemia, DWI lesion growth was remarkably higher in patient 2.
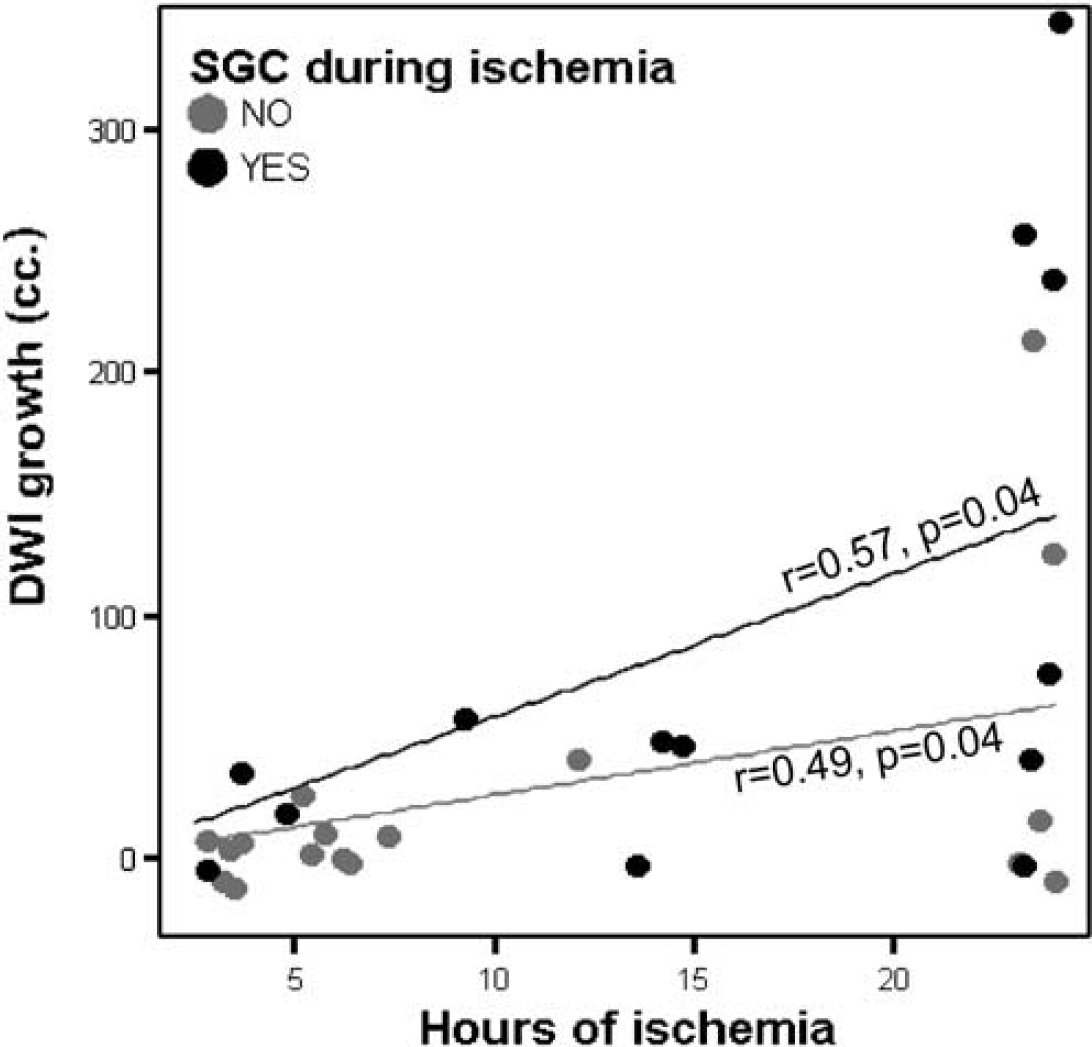
DWI lesion growth according to total time of ischemia in patients with (4.63 cm3/h of occlusion) and without (1.73 cm3/h of occlusion) hyperglycemia during occlusion time (SGC).
Discussion
Our study, for the first time, correlates continuous glucose monitoring and total time of ischemia with brain penumbral evolution. Total OT and HG were both associated with poor outcome; however, the coincidence in time of HG and ischemia showed to be the strongest predictor of bad outcome, either clinically or radiologically. The deleterious effect of each hour of ischemia on lesion growth was almost tripled under hyperglycemic conditions.
Several recent studies in stroke patients treated with thrombolytic therapy demonstrated a profound effect of HG on different outcomes such as hemorrhagic transformation (Tanne et al, 2002), infarct expansion (Baird et al, 2003), or mortality (Williams et al, 2002). These studies however used admission glycemia or did not take into account the total time of ischemia. This last point is particularly important because in hyperglycemic states the fibrinolytic effect of tPA may be hampered delaying the moment of recanalization (Ribo et al, 2005a). Total OT determines DWI lesion growth (Arenillas et al, 2002), and in our study patients with poor outcome had a longer time of ischemia. Determination of the time of reperfusion showed that the detrimental effect of HG is particularly robust during ischemia, suggesting that maximal therapeutic efforts to achieve an optimal glycemic control should be taken in the first hours in aims to slow down the recruitment of ischemic penumbra into fully irreversible infracted tissue. In the lack of an approved neuroprotective drug, and besides strategies oriented to achieve an early reperfusion, glucose control measures emerge as one of the few effective therapeutic options. Maintaining normoglycemia seems to play a neuroprotective role decelerating the ischemic reaction cascade and allowing to ‘buy time’ for reperfusion.
The underlying mechanism of HG after acute stroke is not clear, and the question of whether it is a stress response or not is controversial (Tracey et al, 1993; van Kooten et al, 1993). Independent of its inherent origin, the practical and therefore more important question is to address if aggressive insulin treatment to maintain normoglycemia can improve outcome. At the gates of the glucose insulin in stroke trial (GIST) (Scott et al, 1999) results that will give a definitive answer to this long-standing debate, our study sheds some light on this issue. In our study, baseline glucose levels were not associated with stroke severity on admission or infarct extension. However after adjusting for total time of ischemia, those patients with suboptimal glucose control despite tight insulin treatment experienced a worse clinical outcome; this could be explained by an almost three times higher velocity of the infarct expansion during ischemia, leading to larger final brain lesions.
Interestingly only two of the patients with HG achieved a good neurological outcome at 48 h. Duration of HG showed a stronger association with unfavorable outcome than intensity of HG suggesting again that glucose control measures should be taken immediately on admission to minimize the time of HG. Moreover, glucose monitoring should be maintained over time in all stroke patients despite baseline glycemia as more than a third of the patients who reached HG presented normal glucose levels on admission. A tight subcutaneous insulin sliding scale showed to be insufficient to maintain normoglycemia in as high as 51% of all patients, therefore more intense glucose control measures, such as intravenous insulin, should be considered in future studies.
The multiple mechanisms of HG-mediated brain damage (Garg et al, 2006) could be possibly avoided with an adequate glucose control. However, beyond the potential benefits of HG correction an intensive insulin treatment may offer some neuroprotective effects per se. Insulin and insulin-like growth factor exert an antiinflammatory effect (Dandona et al, 2001) that has shown to reduce ischemic damage in animal models independent of glucose levels (Zhao et al, 2005; Zhu and Auer, 1994). These data provide a rational for rapid restoration of normoglycemia in acute stroke patients as already proved in several other acute clinical conditions (Malmberg et al, 1995; van den Berghe et al, 2001). However, a definitive evidence of the benefits of intensive insulin treatment in acute stroke cannot be warrant until randomized interventional studies will be completed.
The study design does not allow determination of the exact moment of recanalization. Most tPA-induced recanalizations occur during the first hours post-stroke, during that time a continuous TCD monitoring was performed. The timing of recanalization beyond the first hours was approximated with TCD exams performed every 6 h. Grading the response according to initial NIHSS is recommended instead of using the classical definition of improvement (Saver, 2004) (absolute reduction >4 points in NIHSS). Following these recommendations, we defined favorable outcome as a relative improvement according to admission NIHSS.
Conclusions
Hyperglycemia has a powerful deleterious effect in the following hours after acute stroke accelerating brain damage, especially during ischemia time. Correction of HG may offer a neuroprotective effect slowing penumbral recruitment into irreversible infarct. Subcutaneous insulin is often insufficient to achieve an optimal glucose control during the first hours post stroke, therefore aggressive measures should be considered to decrease glucose levels above 140 mg/dL.