
Abstract
Arachidonic acid (AA) is an important second messenger involved in signal transduction mediated by phospholipase A2. The goal of this study was to establish an in vivo quantitative method to examine the role of AA in this signaling process in the human brain. A simple irreversible uptake model was derived from rat studies and modified for positron emission tomography (PET) to quantify the incorporation rate K*of [11C]AA into brain. Dynamic 60-minute three-dimensional scans and arterial input functions were acquired in 8 young healthy adults studied at rest. Brain radioactivity was corrected for uptake of the metabolite [11C]CO2. K* and cerebral blood volume (Vb) were estimated pixel-by-pixel and were calculated in regions of interest. K* equaled 5.6 ± 1.2 and 2.6 ± 0.5 μL · min−1 · mL−1 in gray and white matter, respectively. K* and Vb values were found to be unchanged with data analysis periods from 20 to 60 minutes. Thus, PET can be used to obtain quantitative images of the incorporation rate K* of [11C]AA in the human brain. As brain incorporation of labeled AA has been shown in awake rats to be increased by pharmacological activation associated with phospholipase A2-signaling, PET and [11C]AA may be useful to measure signal transduction in the human brain.
Arachidonic acid (AA, 20:4 ω−6) is an important brain second messenger (Axelrod et al., 1988; Williams et al., 1989; Dumuis et al., 1990; Keros and McBain, 1997; Rapoport, 1999). In the brain, AA is converted to arachidonyl–coenzyme A (CoA) by acyl-CoA synthetase and is subsequently incorporated into neural membrane lipids by acyl-CoA transferase; most of AA is esterified at the stereospecifically numbered (sn)-2 position of phospholipids (Robinson et al., 1992; Rapoport, 1999). AA is subsequently released into cytoplasm through receptor-mediated, G-protein–coupled activation of phospholipase A2 (PLA2) as part of signal transduction. Specific receptors are coupled to this enzyme, including muscarinic M1, M3, and M5, dopaminergic D2, and serotonergic 5-HT2 receptors (Axelrod et al., 1988; Felder et al., 1993; Vial and Piomelli, 1995; Cooper et al., 1996).
An in vivo method to image and quantify the incorporation rate (K*) of intravenously injected radiolabeled AA into rodent brain by means of autoradiography has been developed (Robinson et al., 1992; Rapoport, 1999). Incorporation of AA into neural membranes was found to be very rapid; in awake rats, more than 90% of brain radioactivity was esterified within 1 minute, mostly in the sn-2 position of phospholipids (Washizaki et al., 1994). Radioactivity in neural membrane lipids did not significantly decrease for up to 4 hours after injection (DeGeorge et al., 1989; Rapoport, 1999). These data motivated the use of a simple irreversible uptake model to describe the kinetics of AA incorporation into brain. Consequently, most autoradiographic rodent studies were performed with K* quantification based on a single time-point and the integral of the input function.
Arachidonic acid was found to be a marker of neuronal activity. First, AA incorporation was substantially reduced by pharmacological inhibition of PLA2 (Grange et al., 1998). Decreased K* values were detected selectively in contralateral visual structures after acute unilateral visual deprivation (Wakabayashi et al., 1994). In addition, K* increased in response to arecoline, a muscarinic agonist (DeGeorge et al., 1989). Thus, AA studies have the potential to show changes in second messenger activity resulting from sensory/pharmacological activation.
Alterations in AA-containing phospholipids and/or PLA2 activity have been reported in normal aging and neuropsychiatric disorders (Farooqui et al., 1988; Nitsch et al., 1992; McGahon et al., 1997; Smalheiser and Swanson, 1998; Hudson et al., 1999; Patrick et al., 2000). Studies in rats with a unilateral lesion of the nucleus basalis magnocellularis or of the substantia nigra, animal models of Alzheimer and Parkinson disease, respectively, have also demonstrated alterations in PLA2-mediated cholinergic and dopaminergic signaling (Nariai et al., 1991; Hayakawa et al., 1998). Thus, it would be of interest to develop a reliable positron emission tomography (PET) method to examine PLA2-mediated signaling in the human brain in health and disease (Rapoport, 1999).
With the aim of adapting the rodent method to in vivo human studies, we previously developed a synthesis for [11C]AA (Channing and Simpson, 1993), and used PET to measure its incorporation into the brain of the rhesus monkey (Chang et al., 1997). Here we present the PET kinetic method to quantify regional brain incorporation of [11C]AA in human subjects.
MATERIALS AND METHODS
Subject selection
Eight healthy male volunteers (mean age ± SD: 27 ± 5 years; range: 20 to 36 years) were studied under a clinical protocol approved by the Institutional Review Board of the National Institute on Neurological Diseases and Stroke and the Radiation Safety Committee, National Institutes of Health. Each subject gave informed written consent after the purpose and risks of the study were explained. Exclusion criteria included a past or current medical condition that could interfere with brain function, such as a history of alcoholism or psychiatric illness, head trauma, exposure to central nervous system toxin, hypertension or other cardiovascular disorders, evidence of diabetes, malignancy, and psychopharmacological treatment. All subjects were off medication for 2 weeks, off aspirin for 2 days, and fasted for at least 12 hours before their PET scan. Magnetic resonance imaging of the head was performed to exclude brain pathology.
Radiochemistry
[11C]AA was synthesized as previously described (Channing and Simpson, 1993; Chang et al., 1997). Radio–high-performance liquid chromatography (HPLC) analysis of the formulated final product showed greater than 97.6% (n = 8) radiochemical purity.
Radiation dosimetry
Before use of [11C]AA in humans, radiation absorbed dose estimates were calculated from data obtained in monkey studies performed under a protocol approved by the institutional Animal Care and Use Committee. PET studies, with animals under isoflurane anesthesia, were performed in two adult male rhesus monkeys (weights: 5.0 and 5.8 kg) after an overnight fast. Animal preparation included endotracheal intubation and insertion of intravenous and urinary bladder catheters. Scans were obtained with a Posicam tomograph (Positron Corporation, Houston, TX, U.S.A.) with monkeys positioned with their long axis parallel to the detector planes to obtain simultaneous imaging of all organs. After transmission and [15O]water perfusion scans, a 2-hour dynamic scan sequence was collected after administration of 370 to 555 MBq (10 to 15 mCi) of [11C]AA. The bladder was emptied every 20 to 30 minutes. Expired [11C]CO2 was collected in a soda lime trap that was changed and counted for radioactivity every 30 minutes. Urine and soda lime activities were less than 1% and 3% of injected dose, respectively.
To calculate [11C]AA organ residence times, regions of interest (ROIs) were drawn using the transmission, [15O]water, and [11C]AA images. Time–activity curves (TACs) from the ROIs for each organ were averaged and extrapolated by fitting the tail to a monoexponential. Each organ TAC was integrated to infinity, multiplied by organ volume, and divided by injected dose to calculate residence times, which were then scaled to reference man (Kirschner et al., 1973; Roedler, 1980). The residence time for the remainder of the body was obtained by subtracting the sum of the organ residence times from the theoretical maximum residence time for an 11C-labeled radiopharmaceutical, 29.4 minutes. Radiation absorbed doses were calculated from the average residence times with MIRDOSE 3.1 (Stabin, 1996).
Human positron emission tomography procedure
Each subject was scanned with a General Electric Advance Tomograph (Waukesha, WI, U.S.A.), which acquires 35 simultaneous slices with 4.25-mm slice separation, having in-plane and axial resolutions of 6 to 7 mm. Scans were obtained parallel to the orbitomeatal line, while the subject's head was held in place by a thermoplastic face mask fixed to the scanner bed. Scanning was conducted in a quiet, dim room with the subject's eyes open and ears unoccluded.
A transmission scan was acquired to correct for attenuation. Then, cerebral blood flow (CBF) was measured by injecting 370 MBq (10 mCi) of [15O]water as an intravenous bolus. A 60-second scan was acquired in three-dimensional (3-D) mode after arrival of the bolus in the brain. Blood was continuously withdrawn from an indwelling radial artery catheter, using an automated withdrawal and counting system. The scan and the arterial TAC were analyzed together by the autoradiographic method to produce images of CBF (Herscovitch et al., 1983).
Fifteen minutes later, 867 ± 204 MBq (23.4 ± 5.5 mCi) of [11C]AA was infused intravenously for 3 minutes (Harvard Infusion Pump, South Natick, MA, U.S.A.). Serial dynamic 3-D scans (30 seconds to 5 minutes) were acquired over a 1-hour period from the start of infusion. Arterial blood (1 to 3 mL) was sampled at fixed times and whole blood and plasma radioactivity concentrations were determined with a calibrated gamma counter. In addition, samples were processed to determine blood [11C]CO2 and plasma [11C]AA. These analyses were performed at 3, 5, 7, 10, 15, 20, 40, and 60 minutes after injection; two additional samples at 30 and 50 minutes after injection were taken for blood [11C]CO2 measurements.
To measure the concentration of [11C]CO2 (Shields et al., 1992), an aliquot of each blood sample was added to 0.8 mL of 0.5 N NaOH to fix labeled CO2. To a second aliquot of each sample, 0.6 mL isopropanol and 0.2 mL 0.5 mol/L HCl were added and the sample was vortexed, heated to 80°C, and exposed to a stream of N2 for 10 minutes to eliminate the labeled CO2. The concentration of [11C]CO2 was calculated from the difference between the radioactivity concentrations in the two aliquots. Blood [11C]CO2 data were used to predict the tissue [11C]CO2 TAC in the brain.
[11C]AA input function
To separate [11C]AA from the remaining plasma radioactivity, an extraction technique was previously developed (Chang et al., 1997), based on the technique of Belfrage and Vaughn (1969). A rapid extraction approach was necessary owing to the short half-life of 11C. Plasma (300 μL) was extracted in a solvent mixture (6.25 mL) of methanol–chloroform–heptane (1.41:1.25:1.0). Potassium carbonate was added (1.8 mL, pH 10), and the mixture vortexed and centrifuged to separate phases. The upper phase (intermediate aqueous phase) was transferred to another vial, acidified with concentrated H2SO4 (30 μL), and vortexed; heptane (2.0 mL) was added to the solution, which was subsequently vortexed and centrifuged to separate the phases. The new upper layer (final organic phase) was extracted and its radioactivity concentration was determined. In addition to the blood samples, this extraction procedure was also applied to a reference blood sample taken before injection to which approximately 5 μCi of [11C]AA was added. The fraction of counts in the final organic phase (forg) from this two-step procedure was determined by taking the ratio with respect to the counts in plasma. This ratio was then normalized by the ratio for the reference blood sample, assuming that 100% of the injected dose was [11C]AA. Extraction efficiency was 0.55 ± 0.04.
After intravenous administration of radiolabeled AA, it was shown that much of the parent tracer was rapidly converted to radiolabeled AA esters including triglycerides, cholesterol esters, and phospholipids (DeGeorge et al., 1989; Purdon et al., 1997). Since H2SO4 used in the second step of the extraction procedure (Chang et al., 1997) can hydrolyze [11C]AA esters (Sheppard and Iverson, 1975; Spangelo et al., 1986) in the intermediate aqueous phase, thus increasing the AA concentration in the final organic phase, the forg values were expected to overestimate the true unesterified AA fractions. Therefore, HPLC studies were performed to produce a “gold standard” measurement of the plasma [11C]AA fraction (fAA). These data were then used to develop a correction strategy for forg to permit the use of the rapid extraction method instead of HPLC for routine studies.
HPLC experiments (n = 5) were performed using the intermediate aqueous phase. Studies were performed with an HP series 1100 HPLC system (Agilent Technologies Company, Palo Alto, CA, U.S.A.). High-performance liquid chromatography used a Phenomenex LUNA 3μ C18 reversed-phase column (150 × 4.6 mm I.D.; Phenomenex, Torrance, CA, U.S.A.), eluted with water and acetonitrile with 0.25% acetic acid at a 1 mL/min flow rate and a gradient of 65% to 95% acetonitrile over 20 minutes, followed by isocratic elution at 95% for an additional 4 minutes. An aliquot of 0.5 mL of the intermediate aqueous phase was injected onto the column. The entire column eluent was collected by a fraction collector (Model 203; Gilson Inc., Middleton, WI, U.S.A.) (eight samples; 3 minutes per sample) and samples were counted for 5 minutes each. Sample number and counting time were chosen to optimize measurement accuracy. In each subject, HPLC studies could be performed with the 10-minute sample, either the 20-or 40-minute sample, and the reference blood sample. The [11C]AA HPLC fraction was calculated as counts in the parent peak divided by total counts loaded onto the chromatographic column; this fraction equaled 100 ± 1.5% for the reference blood sample. This approach was used because recovery of counts for samples taken at 10, 20, and 40 minutes after injection was lower than that of the reference blood sample. These fractions were subsequently multiplied by the fraction of plasma counts extracted in the intermediate aqueous phase (corrected for efficiency) to yield the HPLC-based [11C]AA fraction (fAA).
To use the HPLC measurements to develop a correction strategy for the organic fractions (forg), we hypothesized that these fractions would include the true [11C]AA fraction plus an unknown fraction (h) of hydrolyzed [11C]AA esters. If all nonparent radioactivity in plasma is esterified, and therefore can be hydrolyzed, forg can be expressed as follows:
Data analysis
The final organic phase fractions were fit to the following function:
To account for the delay between brain radioactivity measured by the scanner and the input function measured from the arterial blood samples, a TAC for the entire brain was extracted from the dynamic PET data. Pixels within brain were chosen if CBF ⩾ 20 mL · min−1 · 100 g−1. Data from the first 10 minutes of the whole brain TAC (Ci(t)) were fit to the following function:
To estimate tissue [11C]CO2 and [11C]HCO−3, the blood [11C]CO2 measurements (nCi/mL) were first fit to the continuous function A(e−bt – e−ct). Plasma [11C]CO2 was determined by scaling the whole blood concentration by the plasma to whole blood ratio of 1.15. Then, the tissue [11C]CO2 concentration Cco2(t) was calculated using a one-tissue compartment model, assuming a gray matter influx rate constant K1 of 0.3 mL · min−1 · mL−1 and a distribution volume K1/k2 of 0.43 mL/mL (Brooks et al., 1984).
Functional image calculation
Reconstructed images of brain radioactivity included corrections for attenuation, scatter, random coincidences, dead time, and decay. Final image resolution was 6 to 7 mm in all three dimensions. The scatter percentage in the data was 35% to 45%. The randoms percentage dropped steadily during the study from 70% at early times to ∼20% at 60 minutes. These high percentages were influenced by activity in the body outside the field of view of the scanner. On a pixel-by-pixel basis, images of K* and Vb were obtained by linearly fitting Eq. 4 to the data acquired over various time durations with Δt fixed to the global value. In performing the fit, pixel data were weighted by the inverse of the pixel variance, estimated from total prompt and delayed coincidences, scatter fraction, decay, and scan duration. Note that the two estimated parameters appear linearly in the model equation. Therefore, the estimates can be rapidly calculated by a weighted average of the image sequence (Appendix A). To assess the time dependency of the parameters, K* and Vb were determined using data from 0 to 20, 0 to 40, and 0 to 60 minutes after injection, and these results were compared.
Region-of-interest measurements
Regions of interest were chosen from a standardized anatomic template of PET brain slices (Kumar et al., 1991). The template, consisting of 475 circular ROIs 8 mm in diameter, was placed visually on CBF images to best overlap anatomically defined brain regions identified from an atlas (Eycleshymer and Shoemaker, 1911). Individual ROIs were grouped into larger anatomic areas corresponding to brain structures, averaging left and right hemispheric regions where appropriate. Regions of interest were applied to K*, Vb, and CBF images. “Global” gray matter values were calculated as the average of the original ROI values.
RESULTS
In the dosimetry studies, [11C]AA activity was prominent in liver; activity was also visualized in heart wall and kidney. The highest absorbed radiation dose estimates (mrad/mCi) were in liver (110), lung (61), kidney (43), and heart (41), with an effective dose equivalent of 26 mrem/mCi. Under Radioactive Drug Research Committee regulations (maximum dose of 5 rad to the critical organ per administration), human research subjects may receive a single dose of 45 mCi [11C]AA. The human study presented here was performed with a maximum dose of 3 rad to the critical organ.
In the HPLC analysis of the human [11C]AA input function, at least one nonparent peak was found (data not shown), which likely represented [11C]AA esters (DeGeorge et al., 1989; Kim et al., 1994). To account for the fraction (h) of [11C]AA esters hydrolyzed by H2SO4 in the second step of the extraction procedure, the HPLC-based estimates of parent fraction (fAA) were compared to the fractions obtained using the final organic phase (forg). Nine HPLC samples acquired from five subjects were analyzed with Eq. 1, and h was estimated to be 0.236 with a standard error of 0.024 (linear regression: P < 0.0001; r = 0.974). This h value was then used to fit the final organic phase fractions (Eq. 2), and the final parent fractions fAA(i) were determined (Eq. 3). To confirm the accuracy of h, the forg data were refit using Eq. 2 with h as a new floating parameter. These h estimates were 0.251 ± 0.056, consistent with the HPLC-based estimate of h.
Figure 1A shows the time course of plasma radioactivity, normalized to injected dose. Activity peaked at the end of the injection period, then declined, reaching 39%, 13%, and 7% of the maximum by 5, 10, and 30 minutes, respectively. The whole-blood–to–plasma ratio increased from 0.64 ± 0.05 at 3 minutes to 0.74 ± 0.12 at 10 minutes, and remained relatively constant thereafter; the mean ratio after 10 minutes was 0.77 ± 0.02 (data not shown). Figure 1B shows the plasma parent fraction as a function of time: 0.76 ± 0.11, 0.51 ± 0.18, 0.23 ± 0.17, 0.11 ± 0.10, and 0.02 ± 0.02 at 5, 10, 20, 30, and 60 minutes, respectively. Figure 1C shows plasma [11C]CO2 concentration during the experiment. Plasma [11C]CO2 accounted for 2.4 ± 1.6, 6.7 ± 3.0, and 6.4 ± 2.6% of plasma radioactivity at 10, 30, and 60 minutes, respectively.
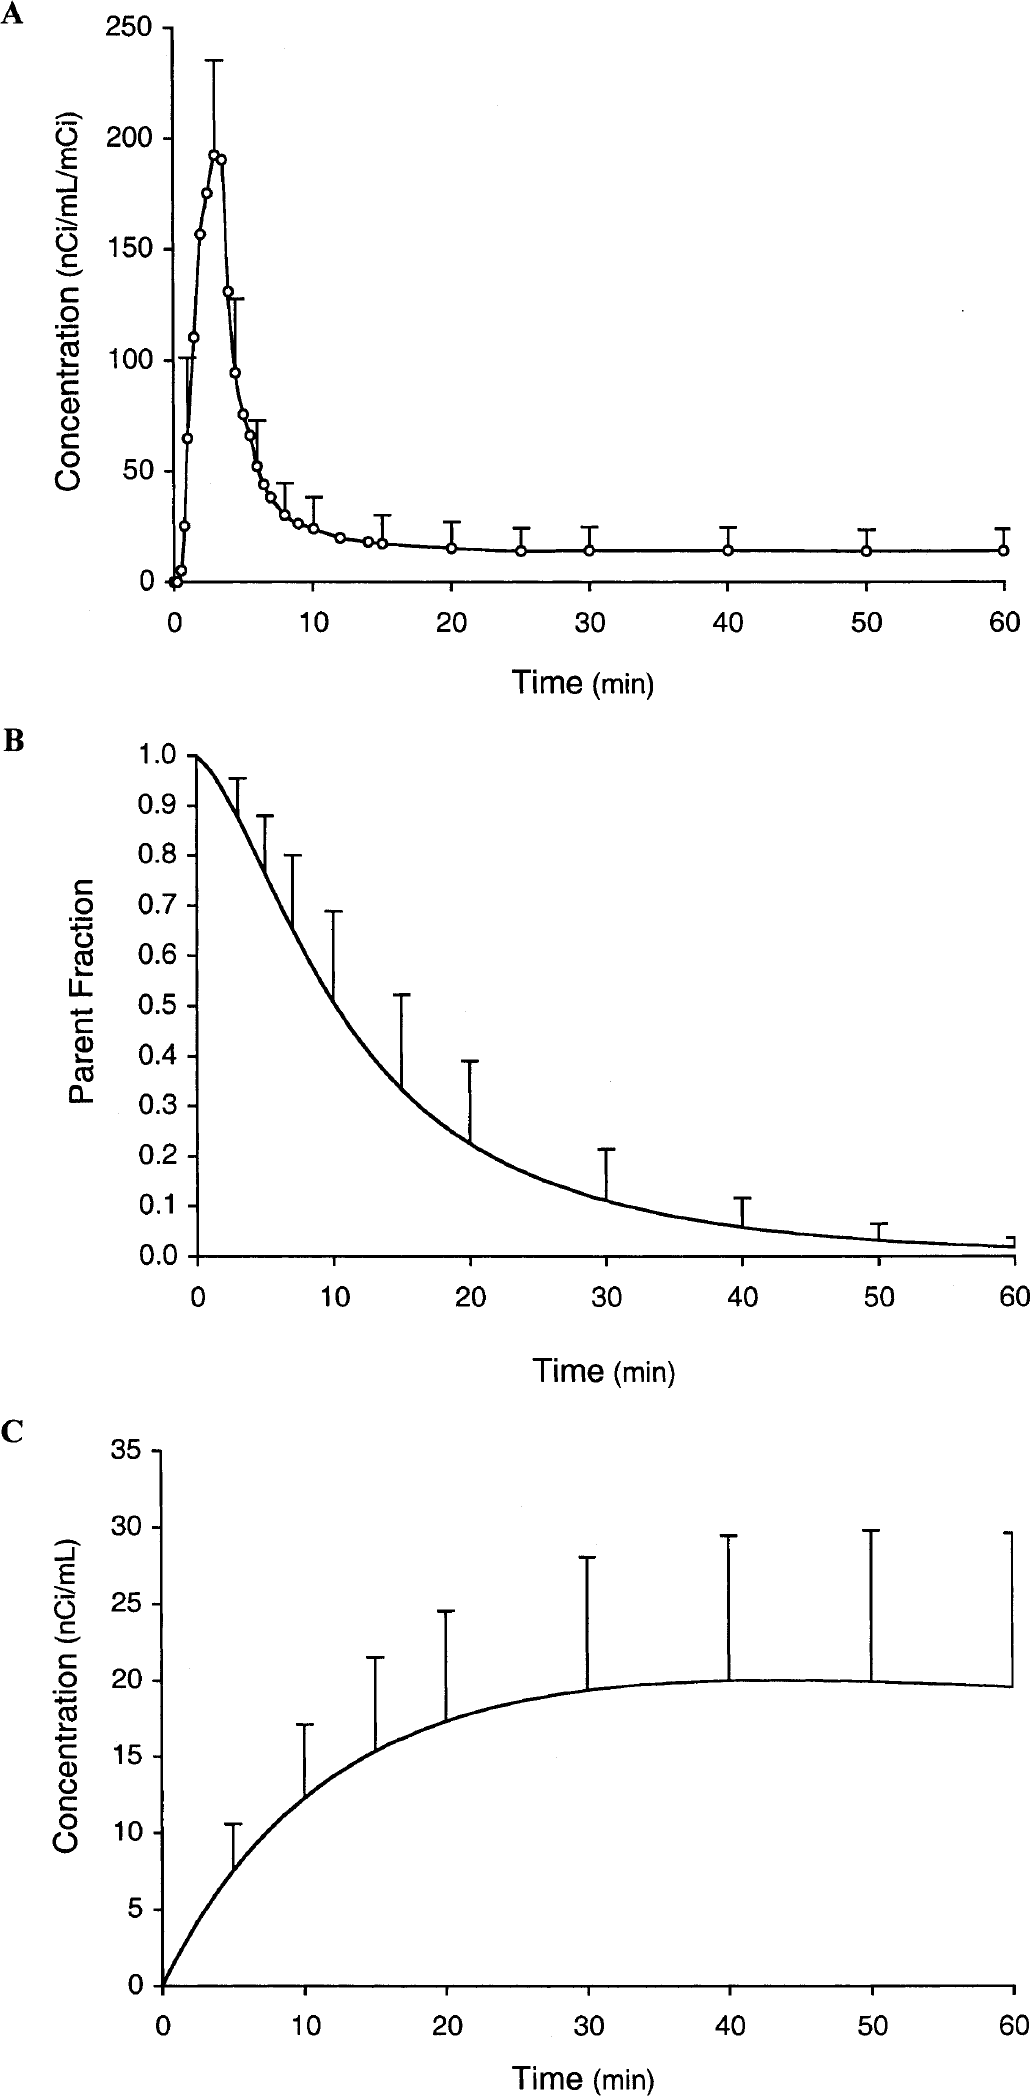
Plasma radioactivity normalized to injected dose after a 3-minute intravenous infusion.
Figure 2 illustrates a typical TAC from superior temporal cortex and the fit with Eq. 4. The figure shows the three components of the fitted TAC, i.e., tissue [11C]AA, vascular, and tissue [11C]CO2 radioactivity. The quality of the fit in Fig. 2 supports the use of the simple irreversible model of Eq. 4. For the first 5 minutes, the model fits show that most of the tracer is located in the vascular component. The predominant vascular radioactivity in the early part of the scan is also evident in Fig. 3A, as indicated by the high activity in the superior sagittal sinus, rectus sinus, and inferior sagittal sinus and the low activity in brain tissue.
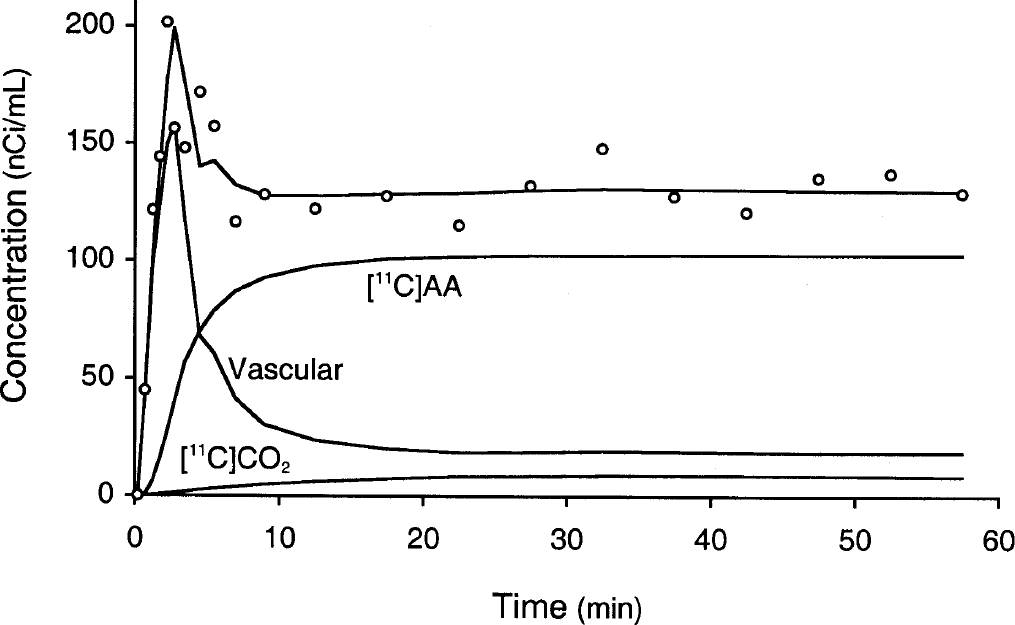
Typical time–activity curve from superior temporal cortex (60 pixels, 2.4 cm2) and fit according to Eq. 4. The three components of the model, vascular activity, [11C]arachidonic acid–associated tissue activity, and [11C]CO2 tissue activity, are shown.
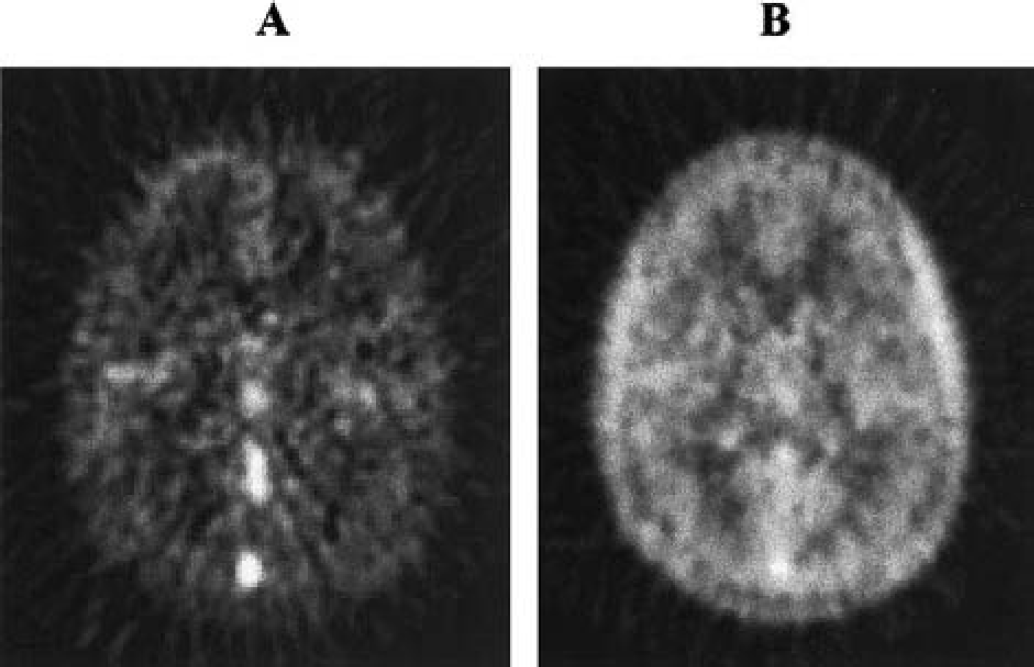
Images at the level of subcortical nuclei of a transverse slice derived from one subject.
Incorporation of tracer in the brain rose quickly after injection, and plateaued by 15 minutes. By 10 minutes, AA-related tissue concentration was greater than 70% of total radioactivity as calculated by the model. Figure 3B shows the increased brain tissue radioactivity, as compared with the early radioactivity image in Fig. 3A. The tracer concentration in the brain, however, was lower than in temporal muscles, and activity in the superior sagittal sinus was still apparent. Finally, predicted [11C]CO2 brain concentration progressively increased, peaked by 20 minutes, and did not exceed 7% of total brain radioactivity. Total brain uptake was about 1% of injected dose.
Figure 4 illustrates [11C]AA functional images of K* (top) and Vb (bottom) calculated with image data acquired over 0 to 20 minutes (Fig. 4A), 0 to 40 minutes (Fig. 4B), and 0 to 60 minutes (Fig. 4C) after injection. Application of the model to quantify Vb and K* separated the vascular and tissue components of cerebral radioactivity (Fig. 3), after correcting for [11C]CO2. Visual inspection of K* images reveals a sufficient, although noisy, delineation of the cortical mantle and subcortical nuclei. The signal-to-noise ratio improves with longer data analysis periods. The gray matter–white matter contrast appears lower than in CBF images (not shown). Images of K* and Vb have a very similar pattern for all analysis periods.
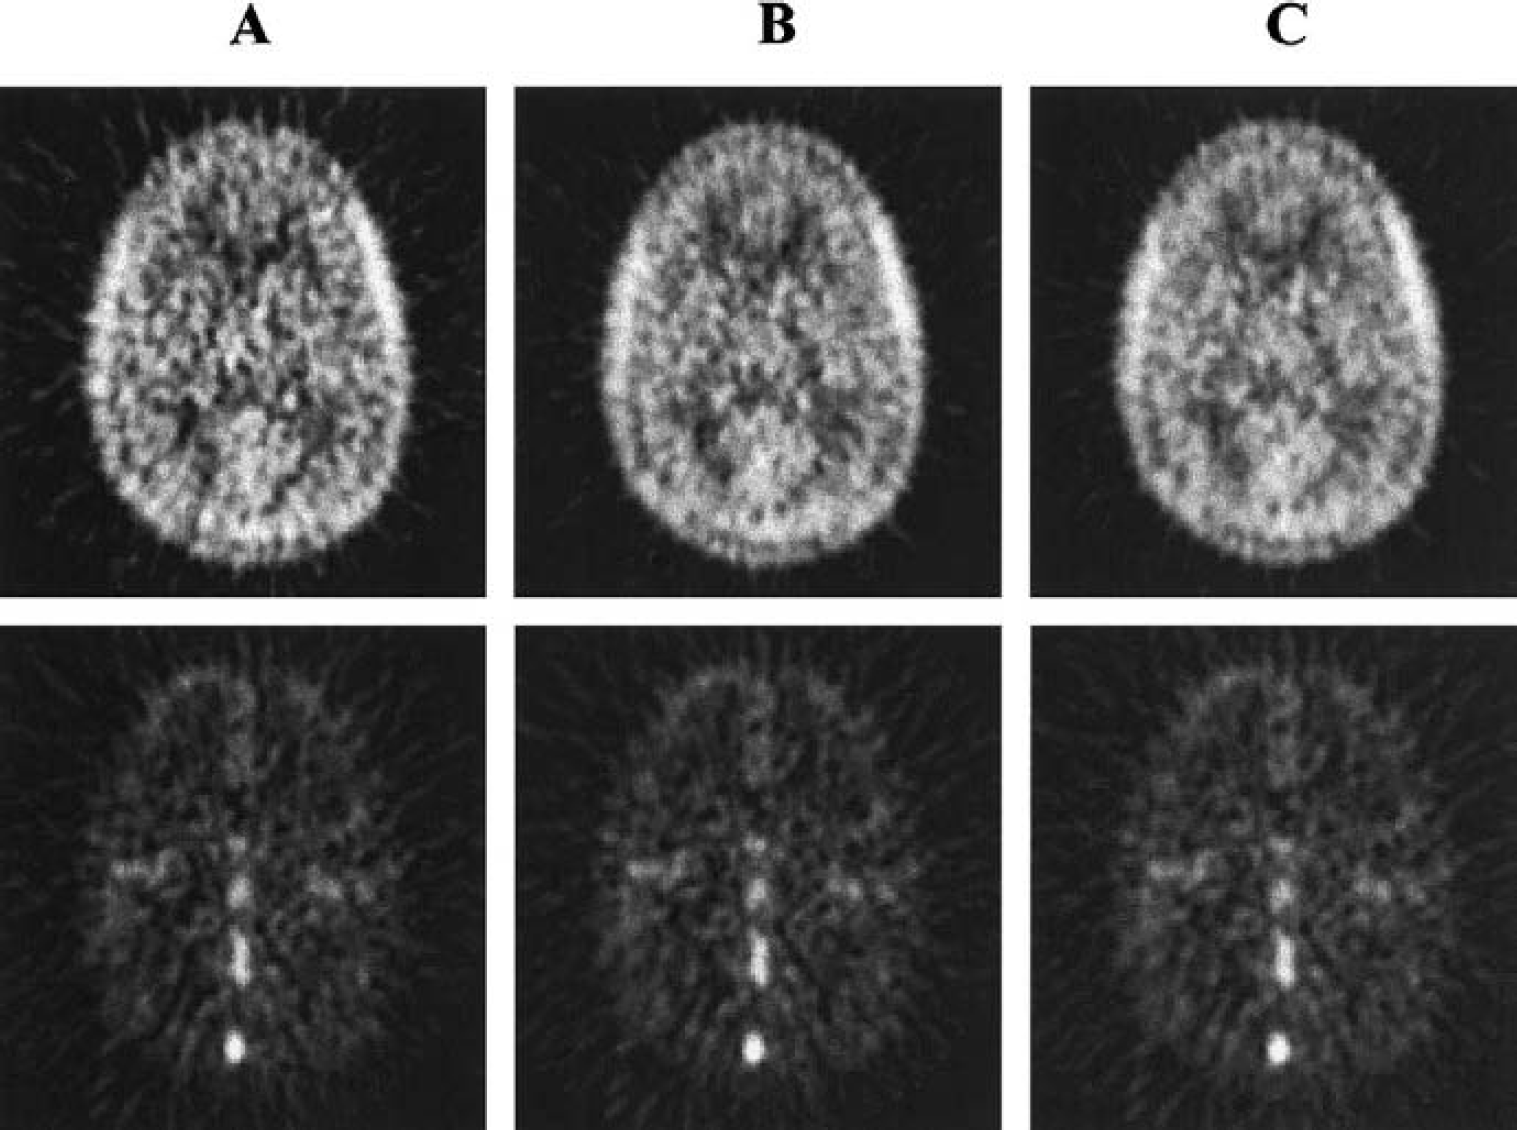
Functional images of the [11C]arachidonic incorporation rate K* (top) and blood volume Vb (bottom) calculated over 20-minute
Table 1 summarizes mean regional values and percent SD of K* for 0 to 60, 0 to 40, and 0 to 20-minute data analysis periods in gray matter and in white matter regions with and without correction for tissue [11C]CO2. The percent differences in global gray matter values of 0 to 40 and 0 to 20-minute analyses versus 0 to 60 minutes were 0.6 ± 0.8% and 1.6 ± 1.6%, respectively. Percent SD across subjects of global gray matter K* was about 20% and did not significantly decrease with increasing data analysis periods. Mean gray matter Vb was 0.055 ± 0.006 mL/mL, in agreement with literature values (Grubb et al., 1973; Ladurner et al., 1976; Phelps et al., 1979). Global gray matter values of Vb for 0 to 40 and 0 to 20-minute analyses were 0.6 ± 0.6% and 1.6 ± 1.3% lower than the 0 to 60-minute values. The consistency of K* and Vb values and images across different calculation times lends support to the validity of the simple irreversible model.
Brain incorporation rate of [11C]arachidonic acid calculated over 60-, 40-, and 20-minute intervals from injection, with and without correction for brain tissue [11C]CO2 in gray and in white matter, in 8 subjects
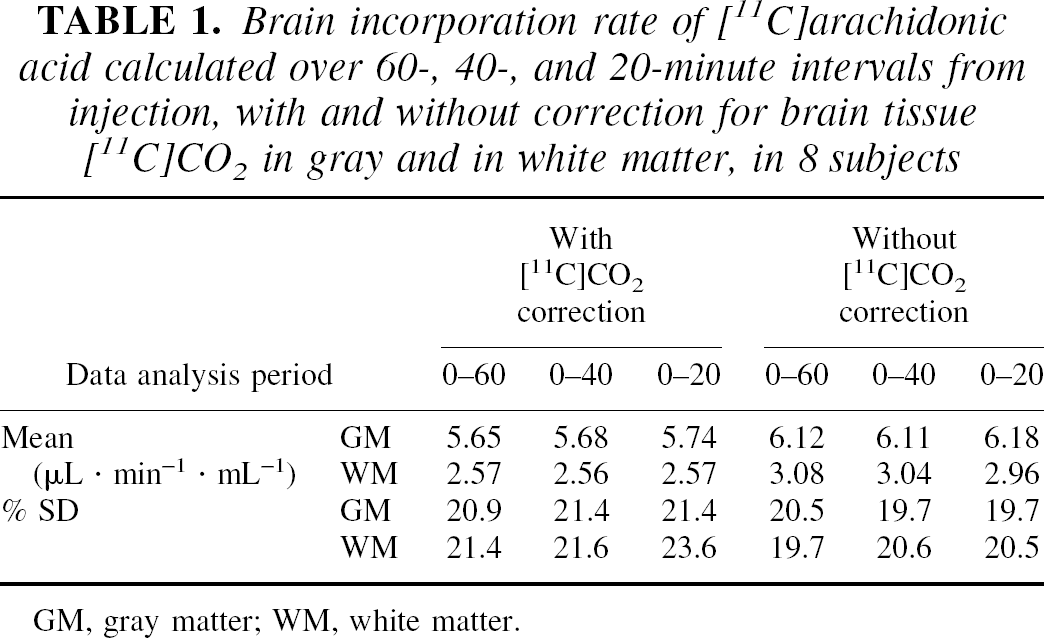
GM, gray matter; WM, white matter.
Without correction for brain tissue [11C]CO2, K* values increased by 8.5 ± 2.2%, 7.7 ± 2.8%, and 7.6 ± 1.6%, respectively, for 60, 40, and 20-minute analyses. In white matter, uncorrected K* values were higher by 16% to 20%. Vb values (60-minute analysis period) without [11C]CO2 correction were 4.4 ± 4.1% and 4.1 ± 4.5% lower than corrected values in global gray matter and in white matter, respectively.
Table 2 summarizes the 0 to 60-minute values of K* and Vb across the anatomic regions examined. Gray matter–white matter ratios for K* and Vb were, respectively, 2.20 ± 0.11 and 2.27 ± 0.35. The gray matter–white matter ratio for K* was significantly lower than for CBF (2.88 ± 0.26, P < 0.001). The intersubject SD (mean of the regional values) for K* was substantially higher than for CBF (22% and 14%, respectively).
Regional brain incorporation rate for [11C]arachidonic acid and brain blood volume
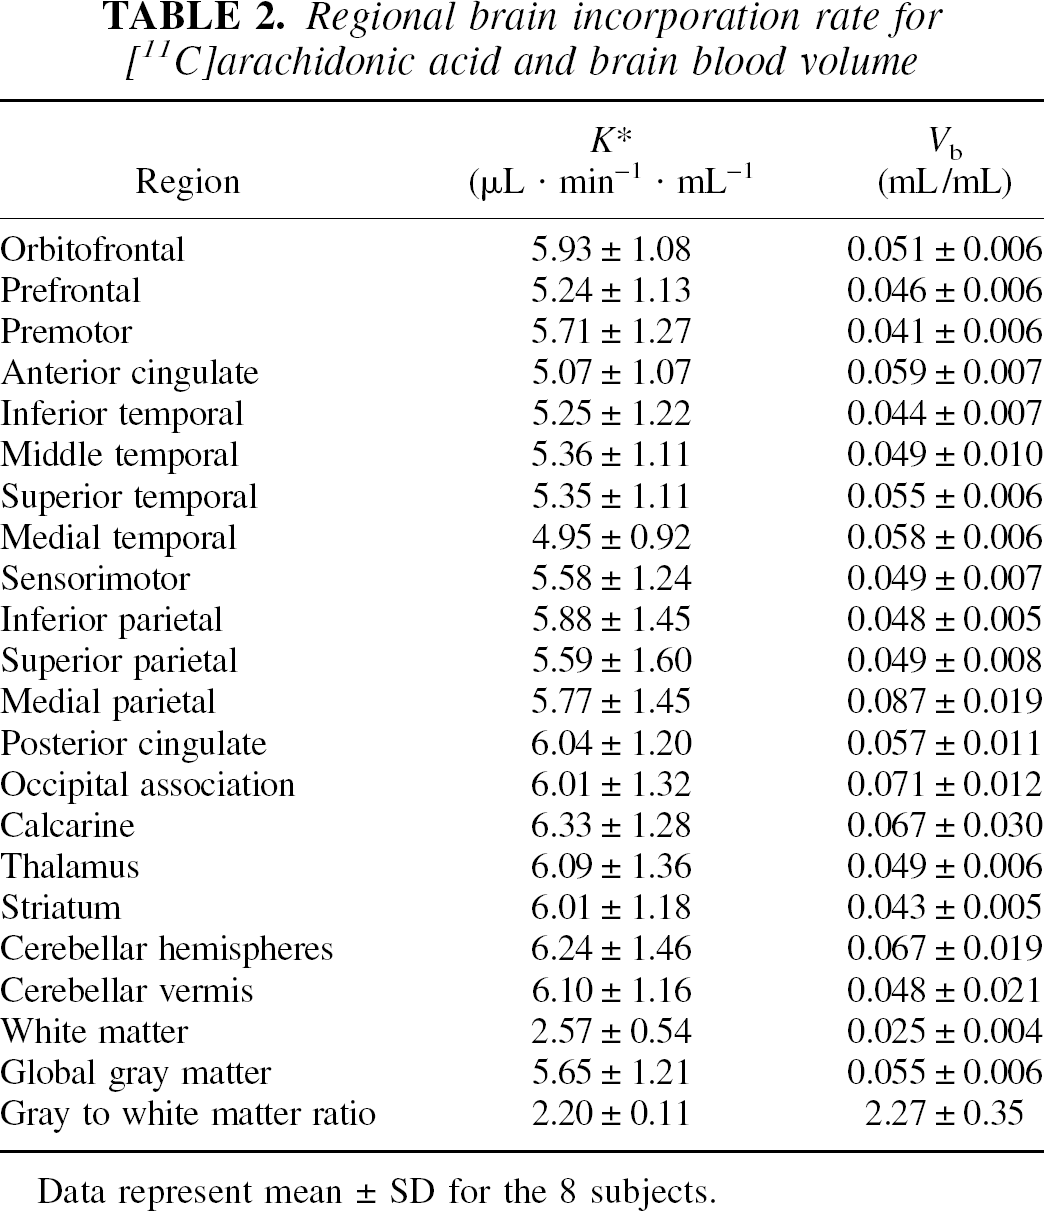
Data represent mean ± SD for the 8 subjects.
K* values for global gray matter for each subject plotted against the respective CBF values (Fig. 5A) had a regression slope of 0.046 (μL · min−1 · mL−1)/(mL · min−1 · 100 g−1), which was not significantly different from 0 (F test: P > 0.05). Mean values of K* for [11C]AA across anatomic gray matter regions were also plotted versus the corresponding CBF values (Fig. 5B) with a regression slope of 0.023 (μL · min−1 · mL−1)/(mL · min−1 · 100 g−1) (F test: P > 0.05). A similar relation was seen when data from each subject were analyzed individually, with slopes ranging from 0.005 to 0.042. Comparison with Fig. 5A demonstrates greater intersubject than interregion variability for K*, with the reverse true for CBF. The greater intersubject K* variability may be caused by higher methodological variability in the [11C]AA studies, for example, in the measurement of the input function.
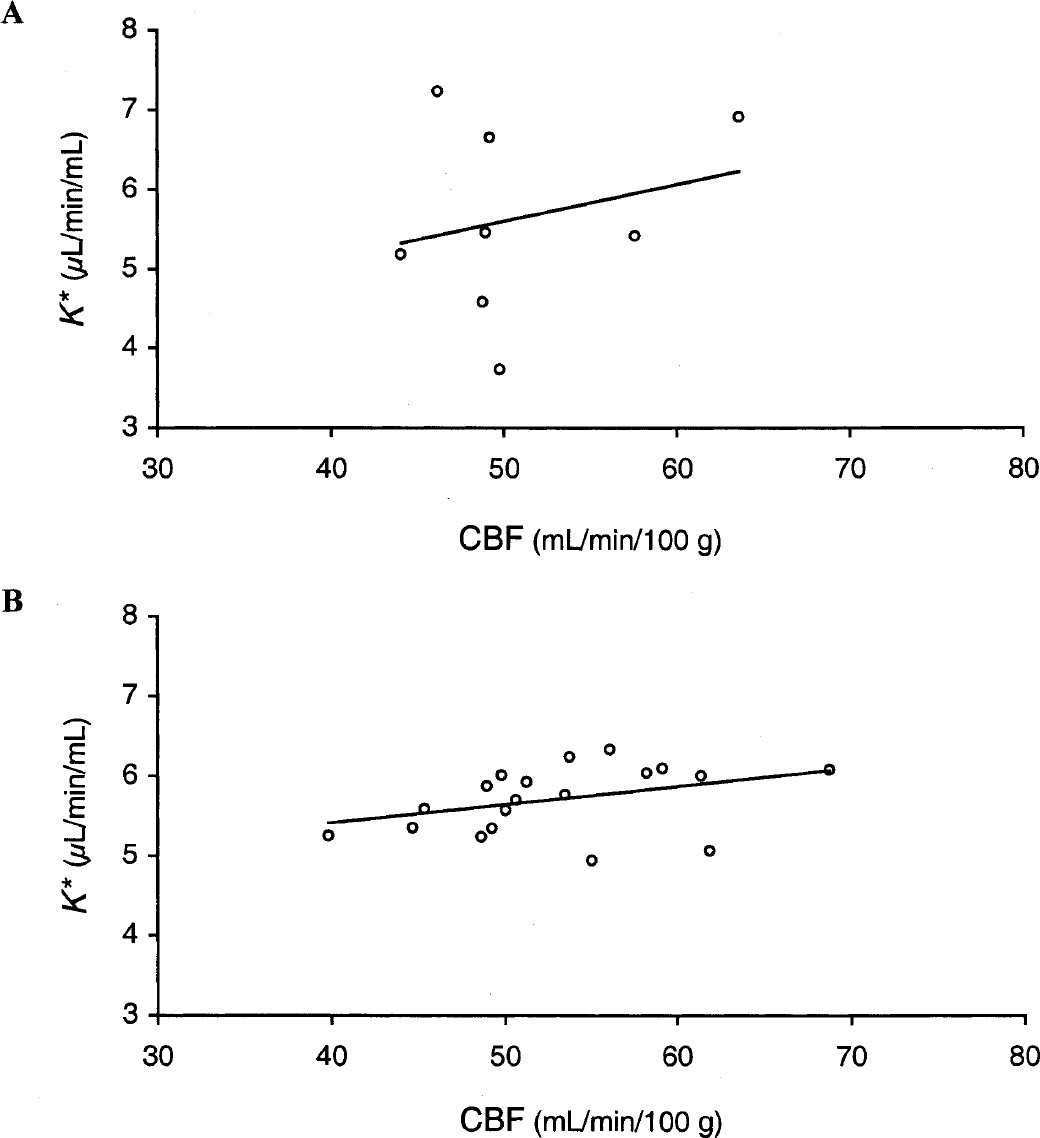
Relation between incorporation rate for arachidonic acid (K*) and cerebral blood flow (CBF).
DISCUSSION
Using PET and [11C]arachidonic acid, we have developed a method to quantify the incorporation rate from plasma to brain (K*) of AA based on the simple irreversible uptake model. Although the absolute concentration levels of the tracer in brain were modest, the use of the model permitted differentiation of vascular and tissue radioactivity and the production of functional images of AA incorporation with reasonable statistical quality.
Input function
In previous monkey studies, a rapid extraction procedure (Chang et al., 1997) was developed to measure the time course of the parent compound in plasma. Here, we extended this method using HPLC studies to account for the hydrolysis of [11C]AA esters, namely, triglycerides, cholesterol esters, and phospholipids (DeGeorge et al., 1989; Purdon et al., 1997) induced by H2SO4 (Sheppard and Iverson, 1975; Spangelo et al., 1986). Correction for this hydrolysis was performed based on Eq. 1, under the assumption that all nonparent radioactivity is esterified and therefore can be hydrolyzed, and that a fixed fraction h was hydrolyzed as part of the procedure. Equation 1 ignores [11C]CO2. In addition, this equation is an oversimplification, since there may be multiple [11C]AA esters and H2SO4 may hydrolyze different fractions of each ester. Equation 1 would remain valid, if the relative fractions of [11C]AA esters remained constant over time, and the value of h would be a weighted average of the individual hydrolysis fractions. In addition to these studies in young subjects, HPLC analyses were also performed in [11C]AA studies in five older subjects (Giovacchini et al., 2002); h was 0.233 (standard error 0.041), very similar to that found in the samples from the young subjects (0.236).
Tracer kinetic model
TACs were analyzed with a model with one tissue compartment (1T) and two parameters, K* and Vb. It has been shown that intravenously injected AA is rapidly esterified into brain phospholipids, after passing through a cytoplasmic precursor pool, which equilibrates with plasma within 1 minute after infusion (Washizaki et al., 1994). This suggests the potential need for an additional compartment in the PET model to account for the reversible pool. This compartment, however, is very small and thus may not be detectable in the PET signal.
To examine the effect of the small reversible compartment quantitatively, simulations were performed using a model with two tissue (2T) compartments (one reversible and one irreversible). Rate constants (K1, k2, and k3) were chosen so that the net incorporation rate [K* = K1k3/(k2+k3)] was fixed to the gray matter mean, K1 was set to 0.025 mL · min−1 · mL−1 [based on average CBF of 50 mL · min−1 · 100 g−1 and a first-pass extraction (brain uptake index) of 5% (Pardridge and Mietus, 1980)], and k2 was varied. Note that under these assumptions, k3 is less than 30% of k2; a low k3/k2 ratio is desirable so that K* is sensitive to tissue kinetics (k3), not just tracer delivery (K1). For the expected large values of k2 (e.g., > 1.0 min−1) under the rapid equilibration assumption, the simulated 2T curves differed from the 1T curves only in the first 10 minutes. Because of the high values of k2 and the low values of K1, the time course of radioactivity in the simulated reversible compartment had a very similar kinetic shape to the blood activity, but of smaller magnitude. Thus, since the reversible compartment activity was kinetically indistinguishable from the vascular activity, fits of these 2T curves with the two-parameter 1T model were excellent, with underestimation of K* of less than 10% and overestimation in Vb of up to 50%. Although estimation of the rate constants from a 2T model would be desirable for an ideal kinetic analysis, given the quality of the 1T fit to the PET data (Fig. 2), it is improbable that application of a 2T model will produce reliable, physiologically reasonable parameter estimates. Therefore, the 1T model is the appropriate choice for quantification of human [11C]AA studies, even in the presence of a rapidly reversible compartment.
Mean gray matter Vb was estimated as 0.055 mL/mL, which corresponds to 5.29 mL/100 g, after correction for brain density (1.04 g/mL), excluding correction for the difference between large vessel and cerebral hematocrit. This value is in the upper end of the range of previously reported gray matter Vb values (Grubb et al., 1973; Ladurner et al., 1976; Phelps et al., 1979). Better spatial resolution in our study, as well as the potential overestimation of Vb introduced by the rapid reversible compartment described above, may contribute to our measured Vb values.
[11C]CO2 readily enters the brain and approaches a transient equilibrium based on the difference between tissue and plasma pH (Brooks et al., 1984). To correct for uptake of this metabolite of [11C]AA in all brain pixels, the 1T model for [11C]CO2 was applied, using the measured [11C]CO2 input function and average gray matter rate constants. After subtraction of the predicted [11C]CO2 brain TAC, K* (60-minute analysis) was reduced by 8.5 ± 2.2%. This approach would be inaccurate if the [11C]CO2 rate constants are incorrect. Although [11C]CO2 enters the brain at a rate comparable to CBF, the “input function” for [11C]CO2, when produced by peripheral metabolism instead of bolus injection, is slowly varying (Fig. 1C), so regional variation in CBF will have only a minor effect on its brain uptake. Simulations predicted that a 100% increase in K1 would increase tissue [11C]CO2 by less than 2% from 20 minutes on, while a similar increase in distribution volume causes an increase of more than 90%. Thus, the [11C]CO2 correction should be accurate if the difference between brain and blood pH is normal. In addition, using gray matter parameters would cause an error in white matter regions only if there was a gray–white difference in [11C]CO2 distribution volume. As this difference is small (Brooks et al., 1984), errors in the white matter K* due to inaccurate [11C]CO2 correction should be small.
The current model assumes that cerebral uptake of nonparent radioactivity other than [11C]CO2 is negligible. Because of the low tracer incorporation into the brain (∼1% of injected dose) and the rapid parent peripheral clearance, even a modest amount of cerebral uptake of [11C]AA esters from plasma might theoretically represent a concern. Previous studies, however, did not find any evidence of brain incorporation of radiolabeled triglycerides, cholesterol esters, and phospholipids (Dhopeshwarkar and Mead, 1973; Pardridge and Mietus, 1979; 1980; Purdon et al., 1997). If there was substantial uptake of [11C]AA esters, an increase in the estimated K* value would be expected with increasing data analysis period. Given the stability of K* across different time frames (Table 1), uptake of [C]AA esters from plasma into brain is unlikely.
Brain uptake of [11C]AA
K* values are low, ∼5 μL · min−1 · mL−1. Assuming a gray matter flow of 0.5 mL · min−1 · mL−1, this corresponds to a net extraction of ∼1%, substantially less than the presumed 5% first-pass extraction of radiolabeled fatty acids, as derived from palmitic acid (PA) in rats (Pardridge and Mietus, 1980). In blood, [11C]AA is mostly bound to albumin (Robinson et al., 1992), so protein association and dissociation rates affect initial brain extraction. A theoretical model has been developed under the assumptions of passive diffusion of free plasma AA into the brain and rapid dissociation of AA from albumin (Robinson et al., 1992). Based on this model, K* values for radiolabeled fatty acids should be minimally affected by variations in CBF, assuming no capillary recruitment. Blood flow independence of K* for fatty acids is also supported by rat studies showing no differences in PA incorporation between hypercapnic and normocapnic anesthetized rats (Yamazaki et al., 1994).
Interpretation of K*
Rodent studies support the premise that cerebral AA uptake is primarily related to the PLA2-mediated neural transduction system. Administration of manoalide, a selective PLA2 inhibitor, reduced in vivo AA incorporation by more than 50% and in vitro PLA2 activity by 70% (Grange et al., 1998). However, because of the involvement of AA in neural functions other than signal transduction, such as membrane synthesis and remodeling (Noronha et al., 1990; Grange et al., 1995; Contreras et al., 1999; Rapoport, 1999), K* is not expected to be entirely specific to the PLA2 signaling system. To control for the fraction of the AA signal unrelated to PLA2 activity, PA, a saturated fatty acid that is incorporated in the sn-1 position of membrane phospholipids and is not released by PLA2, has been used (DeGeorge et al., 1991; Wakabayashi et al., 1994; Rapoport, 1999).
K* can be used to estimate the net rate of incorporation of AA into brain by multiplication with the plasma unlabeled AA concentration (Rapoport et al., 2001). This measure is comparable to the regional cerebral metabolic rate for glucose of the deoxyglucose technique (Sokoloff et al., 1977) where the net tracer incorporation rate is scaled by the plasma glucose concentration and the lumped constant. It has been postulated that this net AA incorporation would be an index of the daily replacement rate for fatty acids accounting for metabolic and efflux losses. In that case, measurement of the net rate might provide useful information regarding dietary AA supply and cognitive development (Gordon, 1997; Rapoport et al., 2001).
The AA method could be applied to older healthy subjects (McGahon et al., 1997; Giovacchini et al., 2002), and disorders such as Alzheimer disease and schizophrenia (Farooqui et al., 1988; Nitsch et al., 1992; McGahon et al., 1997; Smalheiser and Swanson, 1998; Hudson et al., 1999; Patrick et al., 2000). In these conditions, AA and PLA2 abnormalities have been reported in cortical areas related to physiologic and pathologic changes.
In addition, paired AA studies, at rest and during sensory–cognitive stimulation, have the potential to show changes associated with second messenger activity. To execute such a study, two injections of [11C]AA would be required. In comparing the K* images (Fig. 4), a clear statistical improvement is visible by using 40 minutes of data compared with only 20 minutes, with little improvement by using the full 60-minute data set. Given the logistical advantages of shorter scans, acquisition periods could be reduced to 40 minutes (or perhaps less) with only limited loss of statistical quality. This might permit acquisition of data in two different behavioral conditions, such as with a split injection paradigm similar to that used with [18F]fluorodeoxyglucose (Pietrini et al., 1997). Such a study could be performed using one radiosynthesis.
Footnotes
Acknowledgments:
The authors thank Giuseppe Esposito, M.D., Dale Kiesewetter, Ph.D., and Thad Rosenberger, Ph.D., for helpful discussions. We thank Jane Bell, Ken Ma, Patricia Reeves-Tyer, and the entire staff of the National Institutes of Health PET Department for their technical assistance. We also appreciate the support of the National Institute on Neurological Disease and Stroke.
APPENDIX A
The tissue data Ci(t) were fit with Eq. 4, here rewritten in matrix form as