
Abstract
Endocannabinoids, including 2-arachidonoylglycerol and anandamide (N-arachidonoylethanolamine; AEA), have neuroprotective effects in the brain through actions at CB1 receptors. However, AEA also binds to vanilloid (VR1) receptors and induces cell death in several cell lines. Here we show that anandamide causes neuronal cell death in vitro and exacerbates cell loss caused by stretch-induced axonal injury or trophic withdrawal in rat primary neuronal cultures. Administered intracerebroventricularly, AEA causes sustained cerebral edema, as reflected by diffusion-weighted magnetic resonance imaging, regional cell loss, and impairment in long-term cognitive function. These effects are mediated, in part, through VR1 as well as through calpain-dependent mechanisms, but not through CB1 receptors or caspases. Central administration of AEA also significantly upregulates genes involved in proinflammatory/microglial-related responses. Thus, anandamide produces neurotoxic effects both in vitro and in vivo through multiple mechanisms independent of the CB1 receptor.
It is now known that much of the tissue damage caused by central nervous system (CNS) insults results from delayed biochemical mechanisms (Faden, 2001). One of the secondary processes that may contribute to delayed neuronal death is activation of phospholipase-mediated signaling pathways that leads to membrane phospholipid degradation (Chan et al., 1989; Homayoun et al., 2000).
Endocannabinoids are endogenous lipid ligands, which bind to the same cannabinoid receptors (CB1, CB2) that mediate the effects of Δ9-tetrahydrocannabinol, the active compound of cannabis (Mechoulam, 2002). There are three members of the endocannabinoid family discovered to date: N-arachidonoylethanolamine (anandamide; AEA), 2-arachidonoylglycerol (2-AG), and 2-arachidonoylglyceryl ether (2-AGE; noladin); these have different affinities for CB1 and CB2 receptors and distinct biologic effects (Di Marzo et al., 2002). Endocannabinoid signaling system occurs in both neurons and astrocytes; astrocytes may use this system to communicate with surrounding neurons or other astrocytes (Walter et al., 2002). During the last decade, considerable experimental work has demonstrated protective biologic effects of endocannabinoids after brain injury (van der Stelt et al., 2002). Indeed, neuroprotective effects of cannabinoids have been shown in global and focal ischemia, as well as in neuronal cultures subjected to ischemic conditions (Nagayama et al., 1999; Sinor et al., 2000). Both 2-AG and AEA can protect cerebral rat cortical neurons from in vitro ischemia (Sinor et al., 2000), whereas 2-AG reduces cerebral brain edema and infarct volume, decreases hippocampal cell loss, and improves clinical outcome after traumatic brain injury in mice (Panikashvili et al., 2001). However, it should be noted that in contrast to the data supporting cannabinoid-induced neuroprotection (Marsicano et al., 2003; Mechoulam and Lichtman, 2003), several studies have revealed that activation of CB1 receptors can induce cytotoxic effects in a number of cultured cell systems (Downer et al., 2003) including cultured hippocampal (Chan et al., 1998) and cortical neurons (Downer et al., 2001). Among suggested mechanisms of cannabinoid-induced neurotoxicity are activation of caspase-3-dependent apoptosis (Campbell, 2001; Downer et al., 2001), generation of reactive oxygen species (Chan et al., 1998), sustained ceramide accumulation (Galve-Roperh et al., 2002), activation of the JNK cascade (Sarker and Maruyama, 2003), and sphingomyelin hydrolysis (Sanchez et al., 1998). It is highly possible that CB1 activation may lead to both neurotoxicity and neuroprotection, depending on a variety of influences such as nature and intensity of the toxic insult, as well as the cell type under study (Downer et al., 2003; Guzman, 2003).
Anandamide as an N-acylethanolamine (NAE) can be synthesized as a hydrolytic product of N-acylated species of phosphatidylethanolamine (NAPE) through a process catalyzed by phospholipase D (Devane et al., 1992; Schmid, 2000). Under normal conditions, the levels of NAPE and related NAE are very low, with their synthesis and metabolism strictly controlled (Schmid, 2000). However, accumulation of NAPE and NAE occurs in cells undergoing degeneration and phospholipid degeneration (Gray, 1976), as well as in conditions associated with membrane degradation (Epps et al., 1980). Increased levels of NAPE and NAE may occur with neuronal death induced by glutamate or the mitochondrial respiratory chain inhibitor, sodium azide (Hansen et al., 1997). Similarly, significant increases in both NAPE and NAE concentrations are found after glutamate-induced neurotoxicity in vivo (Hansen et al., 2001) as well as in post-decapitative ischemia (Natarajan et al., 1986). These lipid compounds, including AEA, may be formed in response to the high intracellular calcium concentration that occurs in injured cells (Hampson et al., 1998). Although AEA originally was identified as an endogenous ligand for cannabinoid receptors (Devane et al., 1992), more recent data suggest that it might also interact directly with other molecular targets, including non-CB1, non-CB2 G-protein coupled receptors (Di Marzo et al., 2000; Sagan et al., 1999), gap junctions (Venance et al., 1995), various ion channels (Hampson et al., 1998; Maingret et al., 2001; Szoke et al., 2000), and vanilloid (VR1) receptors (Zygmunt et al., 1999). Although a substantial body of evidence demonstrates that activation of CB1 receptors by endocannabinoids (Nagayama et al., 1999; Panikashvili et al., 2001), including AEA (van der Stelt et al., 2002), has neuroprotective effects, stimulation of VR1 receptors has been found to increase intracellular Ca2+ and lead to subsequent cytotoxicity (Olah et al., 2001).
VR1 is a nonselective ligand-gated cation channel with six-transmembrane domains and belongs to the family of transient release-potential ion-channels (Benham et al., 2002). It may be activated by exogenous compounds such as capsaicin, the pungent component of chili peppers, and resiniferatoxin, a plant toxin (Caterina et al., 1997; Szallasi and Blumberg, 1990; Szallasi, 2002). In the rat, VR1-positive neurons are located throughout the neuroaxis (Szallasi and Di Marzo, 2000), and the distribution of AEA is mainly overlapping with the localization of VR1 receptors (Szallasi and Di Marzo, 2000). There is ample evidence now (Ross, 2003) that the interaction of AEA with VR1 receptors is specific, whereas the efficacy of AEA as a VR1 agonist depends on numerous factors including receptor reserve, phosphorylation, CB1 receptor activation, voltage, temperature, and pH, among others.
Although a decade has passed since the discovery of AEA, conflicting data on its biologic effects are still emerging, and the mechanisms of AEA actions remain unclear. The root of the controversy resides in the fact that AEA is an endogenous ligand for both cannabinoid and vanilloid receptors, which often manifest opposing effects. For example, the neuroprotective effects of the endocannabinoids through CB1 have been demonstrated in numerous in vitro and in vivo models (Gomez Del Pulgar et al., 2002; Maccarrone et al., 2000; Mechoulam et al., 2002b), whereas the activation of VR1 receptors seems to be involved in various forms of neuronal cell death (Hail and Lotan, 2002; Hail, 2003; Jambrina et al., 2003). Indeed, in recent studies, AEA was shown to induce apoptotic cell death in human neuroblastoma CHP100, lymphoma U937, and PC-12 cells (Maccarrone et al., 2000; Sarker et al., 2000); the formation of apoptotic bodies induced by AEA corresponds to increases in intracellular calcium, mitochondrial uncoupling, and cytochrome c release (Maccarrone et al., 2000). These pro-apoptotic effects of AEA were mediated via VR1 receptors (Maccarrone et al., 2000). However, it should be noted that recent results (Veldhuis et al., 2003) demonstrated that arvanil, a ligand for both VR1 and CB1 receptors, leads to neuroprotective effects acting at both CB1 and VR1. Moreover, it has been shown that the in vivo neuroprotective effects of AEA are mediated by CB1 but not by VR1 or by lipoxygenase metabolites (Veldhuis et al., 2003). Taken together, it is possible that during pathologic conditions such as inflammation or cell damage when pH is decreased, the PKC-dependent signaling system is activated, and NAPE is increasingly synthesized and released by cells; under these conditions, AEA may become more active at VR1 than CB1 receptors. We hypothesize that AEA may induce either neuroprotection or neurotoxicity, depending on the balance of its action on CB1 receptors on the one hand, and VR1 receptors or calcium-mediated signal transduction pathways on the other. We have addressed these questions using both in vitro and in vivo model systems.
METHODS
Animals
All protocols involving the use of animals were in compliance with the Guide for the Care and Use of Laboratory Animals published by NIH (DHEW publication NIH 85-23-2985), and were approved by the Georgetown University Animal Use Committee. Male Sprague-Dawley rats (340 to 380 g) for in vivo studies and female pregnant rats used to prepare neuronal and glial cultures were purchased from Harlan (Indianapolis, IN, U.S.A.).
Drugs
Anandamide (AEA) and capsazepine (CPZ) were purchased from Tocris (Tocris Cookson, Ellisville, MO, U.S.A.), and dissolved in a minimum of ethyl alcohol and diluted with saline (the final concentration of ethanol was 2% (v/v). Five microliters of AEA and CPZ contained 20 nmol/L and 35 nmol/L, respectively. AM251, a specific CB1 antagonist, (N-(piperidin-1-yl)-5-(4-iodophenyl)-1-(2, 4-dichlorophenyl)-4-methyl-1H-pyrazole-3-carboxamide) was obtained from Tocris (Tocris Cookson, Ellisville, MO, U.S.A.), first dissolved in dimethyl sulfoxide (DMSO) and then diluted in saline (the final concentration of DMSO was 10%), whereas 5 μL contained 35 nmol/L. z-DEVD-fmk (N-benzyl-oxycarbonyl-Asp(OMe)-Val-Asp(OMe)-fluoromethylketone) was purchased from Enzyme Systems (Livermore, CA, U.S.A.), whereas SJA6017 (N-(4-fluorophenylsulfonyl)-L-valyl-L-leucinal), the calpain inhibitor VI, was obtained from Calbiochem (San Diego, CA, U.S.A.). Both drugs were dissolved in DMSO and diluted in saline to accommodate a dosing volume of 5 μL containing 160 ng and 1 μg, respectively. The vehicle for the AEA- and CPZ-treated animals was saline containing 2% of ethyl alcohol, whereas the vehicle for AM251-, z-DEVD-fmk-, and SJA6017-treated groups consisted of saline with 10% DMSO. Injection of CPZ (35 nmol/L), AM251 (35 nmol/L), z-DEVD-fmk (160 ng), and SJA6017 (1 μg) did not induce significant changes in cognitive outcome or alteration in blood pressure, compared to vehicle control (results not shown). Moreover, administration of these drugs did not alter the apparent diffusion coefficient (ADC), measured by diffusion-weighted magnetic resonance imaging (MRI) (results not shown); ADC significantly correlates with the changes of extracellular water and as such reflects brain edema (Albensi et al., 2000). Because there were no significant differences between cognitive performances, blood pressure, ADC values, and gene profile in animals treated with saline/ethyl alcohol or saline/DMSO vehicles, these animals were pooled into one group.
Cell cultures
Glia were prepared from 1- to 3-day-old rat cortices, and neurons were prepared from 17- to 18-day-old rat embryonic cortices, as described previously in detail (Lea et al., 2002). Cortical neuronal cultures were used to examine AEA dose–response curves between 0.5 and 100 μM, and cytotoxicity measured by lactate dehydrogenase (LDH) release. Mixed neuronal–glial cultures were used to test the effects of AEA on mechanical (stretch) injury-induced LDH release. Cerebellar granule cell (CGC) cultures were prepared as previously described (Toman et al., 2002). In experiments using trophic support withdrawal, CGCs cultured in neurobasal medium (NM) with 2% B27 supplement and 25 mmol/L KCl were washed once in NM and placed in B27-free NM containing 5 mmol/L KCl.
Stretch injury
Using the original method described by Ellis et al. (Ellis et al., 1995), cells cultured on a deformable membrane were stretched with compressed gas. Stretch (7.5-mm deformations of the membrane; 50-millisecond duration) was applied to the cells using a cell injury controller (Biomedical Engineering Facility, Medical College of Virginia, VA, U.S.A.).
Assay for in vitro cell death
Lactate dehydrogenase activity cell culture growth media was quantified as an index of cell death (Mukhin et al., 1997). Injury- and/or anandamide-induced release of LDH was measured using a CytoTox-96 nonradioactive cytotoxicity assay kit (Promega, Madison, WI, U.S.A.) according to the manufacturer's protocol 24 hours after injury or application of AEA to growth media. Relative absorbance was measured at 490 nm using a Multiskan Ascent microplate reader (Labsystem Oy, Helsinki, Finland). LDH levels in injured or treated cultures were expressed as a percentage of a mean value (100%) in uninjured cultures.
Intracerebroventricular injections
Surgical anesthesia was induced and maintained with 4% and 2% isoflurane, respectively, using a flow rate of 1.0 to 1.5 L/min oxygen. A guide cannula for microinjection of drugs was implanted into right lateral cerebroventricle. The drugs were administered to rats in a volume of 5 μL for 2 minutes using a microliter syringe. Administration of CPZ, AM251, SJA6017, or z-DEVD-fmk was performed 5 minutes after AEA injection.
Nuclear magnetic resonance imaging
At 24 hours, 48 hours, and 7 days after drug administration, all animals (n = 6/group) were reanesthetized with isoflurane and subjected to magnetic resonance imaging examination using a Bruker 7T/21 cm Biospec-Avance system (Bruker, Karlsruhe, Germany) as previously described (Albensi et al., 2000). Briefly, animals were placed in the heated Plexiglas holder, and a respiratory motion detector was positioned over the thorax to facilitate respiratory gating. The animal bed was positioned with the head in the center of the magnet within a 72-mm 1H birdcage resonator (Bruker). Field homogeneity across the brain was optimized and a sagittal scout image was acquired (RARE [rapid acquisition relaxation enhancement pulse sequence] image, field of vision, 4 × 4 cm; 128 × 128 resolution; repetition time [TR] to echo time [TE], 1,500/10 milliseconds with a RARE factor of 8, making the effective TE 40 milliseconds). Multislice T2-weighted images were then acquired to obtain eight contiguous slices commencing at the end of the olfactory bulb and working caudally (field of vision, 3 × 3 cm; slice thickness 2 mm; 256 × 256 resolution; TR/TE 2,000/20 ms; four echo images and two averages). Diffusion weighted (DWI) images were then acquired with a spin-echo pulse sequence that had diffusion gradients added before and after the refocusing pulse. Gradient strength was varied in six steps using sensitization values ranging from 20 to 1,000 s/mm2. A 256 × 256 matrix was used with a 3-cm field of view, TR 2.0 seconds, TE 502 milliseconds, slice thickness of 2 mm, and 4 echoes. Diffusion maps were generated by applying the Stejskal-Tanner equation in association with a Marquart algorithm using a commercially available Paravision software (Bruker, Billerica, MA, U.S.A.). ADCs were calculated for four regions: left cortex, right cortex, left subcortex, and right subcortex (Fig. 1). ADCs were expressed as 10−5 mm2/s ± SD.
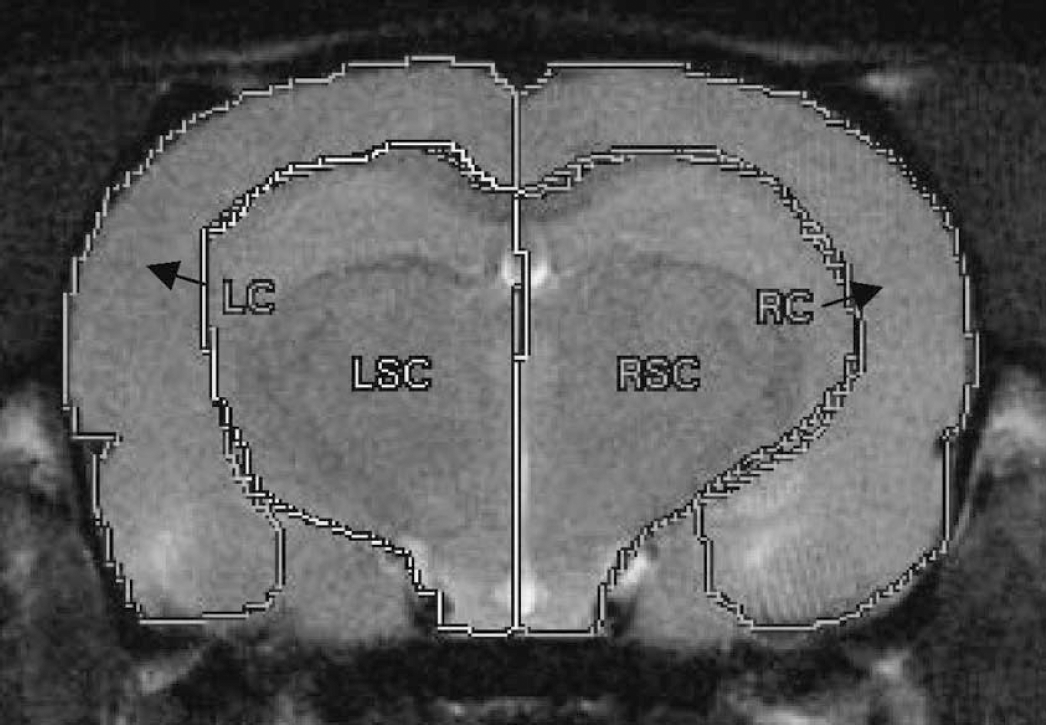
Diagrammatic representation of the different regions utilized for apparent diffusion coefficient determinations. LC, left cortex; RC, right cortex; LSC, left subcortex; RSC, right subcortex. The right side is ipsilateral, whereas the left side is contralateral to the anandamide injection.
Nuclear magnetic resonance spectroscopy
Anandamide-treated animals used in MRI experiments at 24 hours were also subject to phosphorus magnetic resonance spectroscopy using a Bruker 7T/21 cm Biospec-Avance system (Bruker, Karlsruhe, Germany) as previously described in detail elsewhere (Vink and McIntosh, 1990). Additionally, naïve or vehicle-treated animals were used as spectroscopy controls. Because there were no differences in vehicle-treated or naïve animals (results not shown), they were pooled for statistical analysis (n = 6). Briefly, animals were placed in a specially constructed, temperature-controlled Plexiglas holder and a 5-mm x 9-mm surface coil was placed centrally over the exposed skull. Skin and muscle were retracted well clear of the coil to prevent contributions from these tissues. The animals were then inserted into the center of a 7.0-Tesla magnet interfaced with a Bruker spectrometer and field homogeneity optimized on the water signal before acquisition of phosphorus spectra. Phosphorus spectra were obtained in 20-minute blocks using a 90° pulse calibrated for a 2-mm cortical depth, a 700-millisecond delay time, and a 5,000-Hz spectral width containing 2,048 data points. Rectal temperature and respiration were monitored at all times. The anesthesia was maintained using isoflurane. At the conclusion of the acquisition period, animals were removed from the magnet, their wounds were closed, and the animals were returned to their cages.
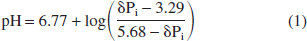
Phosphorus magnetic resonance spectra were analyzed using the resident Bruker computer software program. After convolution difference (400/20 Hz), chemical shifts and integrals of the individual peaks were determined following line fitting. Intracellular pH, brain free magnesium concentration, and cytosolic phosphorylation potential were then determined as described in detail elsewhere (Vink et al., 1994). Briefly, intracellular pH was determined from the chemical shift of the inorganic phosphate peak (δPi) relative to phosphocreatine (PCr) in the magnetic resonance spectra using the equation
Similarly, free magnesium concentration was determined from the chemical shift difference between the α and β peaks of ATP using the equation
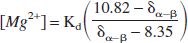
where δα–β is the chemical shift difference between the α and β peaks of ATP. The Kd for MgATP was initially assumed to be 50 μmol/L at pH 7.2 and 0.15 mol/L ionic strength and was corrected for pH according to Bock et al. (Bock et al., 1987). Cytosolic phosphorylation potential (PP) was determined according to the equation
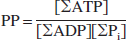
where Σ represents all the ionic forms of the free species. The concentration of ADP was calculated from the creatine kinase equilibrium equation after correcting the equilibrium constant for pH and free magnesium concentration as previously described in detail elsewhere (Vink et al., 1994). Concentrations of the other metabolites were determined from the integrated peak areas of the respective MRS peaks, assuming that preinjury the normal values for PCr and ATP were 4.72 and 2.59 μmol/g, respectively, and that the total creatine pool remained constant at 10.83 μmol/g (Siesjo, 1981; Veech et al., 1979). Brain water content was assumed to be 80%, with the intracellular compartment accounting for 78% of the total water (Siesjo, 1981).
Morris water maze test
Cognitive outcome (spatial learning) was determined using the hidden platform version of the Morris water maze as previously described (Hamm et al., 1996). Briefly, rats (n = 10/group) were trained to locate a hidden, submerged platform using constant extra-maze visual information, while the monitoring was performed using a PC-controlled video system (AccuScan Instruments, Columbus, OH, U.S.A.). The apparatus consists of a large, white circular pool (900-mm diameter, 500 mm high, water temperature 24 ± 1°C) with a Plexiglas platform 76 mm in diameter painted white and submerged 15 mm below the surface of the water (225 mm high). The surface of the water is rendered opaque with the addition of dilute, white, nontoxic paint. During training, the platform remained in a constant location hidden in one quadrant 14 cm from the sidewall. The rat was gently placed in the water facing the wall at one of four randomly chosen locations separated by 90°. The latency to find the hidden platform within a 90-second criterion time was recorded by a masked observer. A series of 16 training trials, administered in blocks of four, were conducted on days 17, 18, 19, and 20 in rats after drug injection. To control for visual discriminative ability or motor impairment, the same animals were finally required to locate a clearly visible black platform (placed in a different location) raised 5 mm above the water surface at least 2 hours after the last training trial. The results were expressed as a latency to find the platform (seconds) ± SD.
Western immunoblotting
The animals were killed and the brain was immediately removed. After dissection, the brain samples were stored at −80°C. For analysis, the brain tissue was resuspended in lysis buffer (60 mmol/L Tris-HCl, pH 7.8 containing 150 mmol/L NaCl, 5 mmol/L EDTA, 10% glycerol, 2 mmol/L Na3VO4, 25 mmol/L NaF, 10 μg/ml leupeptin (Sigma), 10 μg/ml aprotinin (Sigma), 1 mmol/L AEBSF (Sigma), 1 mmol/L Pepstatin (Sigma), 1 mmol/L Microcystin LR (Sigma), 0.1% sodium dodecyl sulfate (SDS), 0.5% Na deoxycholate, and 1% Triton X-100 (Calbiochem, La Jolla, CA, U.S.A.). The samples were incubated on ice for at least 30 minutes and centrifuged at 20,000 g for 15 min. The soluble fraction representing total cell extracts was recovered and stored at −80°C until use. Protein concentration in the samples was determined with the BCA assay kit (Pierce, Rockford, IL, U.S.A.). Equal protein aliquots (25 to 50 μg) were resolved by SDS-polyacrylamide gel electrophoresis and transferred to nitrocellulose membranes (Hybond-C super; Amersham, Arlington Heights, IL, U.S.A.). After transfer, the gels were stained with GelCode blue stain reagent (Pierce) to verify equal protein loading. The membranes were probed with specific primary antibodies and the immune complexes were detected using appropriate horseradish peroxidase–liked secondary antibodies (Amersham Pharmacia Biotech), chemiluminescence reagents (Super Signal WestDura, Pierce), and Kodak Biomax MR-1 films (Sigma).
Calpain activity assay
Tissue was homogenized in extraction buffer (K240-100, Biovision), incubated on ice for 20 minutes, and then centrifuged (10,000 rcf, 4°C). Supernatant was removed and centrifuged again (10,000 rcf, 4°C). The final supernatant was aliquoted and frozen. Later, protein concentration was determined using the method of Bradford (Bradford, 1976). Fifty micrograms of protein was then diluted in reaction buffer (25% Extraction Buffer, 5% DMSO, 13.6 mmol/L Tris-HCL [pH 7.5], 2.7 mmol/L dithiothreitol, 2.7 mmol/L CaCl2, and 500 μmol/L Suc-Leu-Tyr-AMC) and activity was measured at excitation of 360 nm and an emission of 530 nm on a microplate fluorescence reader (Cytofluor4000, PerSeptive Biosystems).
Caspase activity assay
Assay for caspase-3- and caspase-9-like activity was performed as previously described (Yakovlev et al., 1997). Aliquots of cytosolic extracts (25 μg of protein in 100 μL of extraction buffer) are preincubated at 37°C for 30 minutes, and then mixed with an equal volume of 40 μmol/L fluorescent tetrapeptide substrate (Ac-DEVD-AMC or Ac-LEHD-AMC, respectively; Bachem, Torrance, CA, U.S.A.) in the same buffer solution. Free aminomethylcoumarin (AMC) accumulation, which resulted from cleavage of the aspartate–AMC bond, is monitored continuously in each sample during 30 minutes in 96-well microtiter plates, using a CytoFluor II fluorometer (PerSeptive Biosystems, Framingham, MA, U.S.A.) at 360-nm excitation and 460 emission wavelengths. The emission from each well is plotted against time. Linear regression analysis of the initial velocity (slope) of each curve yielded an activity for each sample. Data are expressed as a percentage of the caspase activity in samples from sham-treated control animals.
Histology
Brains, prefixed in 4% phosphate-saline buffered formaldehyde, were cut using a cryostat, and serial 6-μm, anterior-to-posterior sections were made. The sections were stained with hematoxylin and eosin. Cell count of neuronal profile was performed for the pyramidal cell layer of CA3 hippocampal area, in 10 randomly chosen sections from each brain, as previously described (Bramlett et al., 1997). All neurons were included, regardless of whether they were normal or with changed structural characteristics. Hippocampal cell count in our vehicle-treated animals (254 ± 4 neurons in CA3 area) was comparable to values from the literature (Bramlett et al., 1997). The neural profile of the CA3 hippocampal sector of treated animals was expressed as a percentage of the total number of the neuronal cells in the CA3 region in vehicle-treated animals (100%). Cell count data were analyzed statistically using the t-test for independent samples.
Gene profiling by oligonucleotide microarray
Cortical and hippocampal samples were harvested at 24 hours, 48 hours, and 7 days after AEA (20 nmol/L, n = 3/time point) or vehicle administration (n = 3/time point). Total RNA from homogenized tissue was extracted using TRIzol reagent (Invitrogen Corporation, Carlsbad, CA, U.S.A.), and then converted to biotinylated cRNA and hybridized to 22 Affymetrix U34A oligonucleotide microarray containing 8,800 genes and expression sequence tags (ESTs), as described by us (Di Giovanni et al., 2003). Signal intensity values for each oligonucleotide probe set were calculated using Affymetrix GeneChip MAS 5.0 software. Any data not meeting stringent quality control criteria were repeated to meet standards. Signal intensity for each gene on the microarrays from AEA and vehicle-treated animals was normalized to levels in naïve cortex. Statistical analysis and hierarchic clustering was performed using Gene-Spring 5.0. Within each region, genes with significant changes were grouped by the primary function of their gene product.
Semiquantitative reverse transcriptase-polymerase chain reaction
One μg of total RNA used for gene profiling was also used for cDNA synthesis using SuperScript reverse transcriptase (Gibco BRL, Bethesda, MD, U.S.A.) and oligo(dT)-primer. The amount of synthesized cDNA was evaluated by polymerase chain reaction (PCR) using primers specific for ribosomal protein RPL19. PCR reactions were performed in a PTC-225 Thermal Cycler (MJ Research, Waltham, MA, U.S.A.) using AmpliTaq polymerase (Perkin Elmer Life Sciences, Torrance, CA, U.S.A.). Each PCR reaction was repeated at least twice. The thermal cycling parameters were as follows: 1 minute 30 seconds at 94°C followed by 30 cycles of 30 seconds at 94°C, 1 minute 30 seconds at 59°C, 1 minute at 72°C, and final incubation for 5 minutes at 72°C. PCR reaction products were analyzed by agarose gel-electrophoresis. Intensity of injured cortex and hippocampus (n = 3) was adjusted to respective vehicle controls (n = 3) using a housekeeping gene Ribosomal Protein (Invitrogen Corp., Carlsbad, CA, U.S.A.) L-19 (RPL-19). Normalized cDNA was then used to estimate the relative abundances of tissue inhibitors of metalloproteinase (TIMP)-1, MHC class II and brain-derived growth factor (BDNF) to confirm the array hybridization data. Primers for each gene were located in different exons. Different dilutions of cDNA samples were used for different genes to provide linear range of PCR reactions (Di Giovanni et al., 2003).
Data analysis
Continuous variables subjected to repeated measurements during a period of time (ADC, water maze studies) were analyzed using a repeated-measures analysis of variance followed by Tukey pairwise comparison at each time point. MRS data, activity assays, and cell counts were analyzed with a t-test. Analysis of variance followed by t-test with Bonferroni corrections for multiple comparisons were used for comparisons of anandamide- and vehicle-treated groups; P>0.05 was considered to reflect a statistically significant difference.
RESULTS
In vitro study
We initially tested the effect of AEA on cell viability measured by LDH release in primary cortical neuronal cultures, as previously described (Mukhin et al., 1997). Concentrations of AEA greater than 50 μmol/L significantly increased LDH release, indicating a neurotoxic action (Fig. 2a). We subsequently examined the effect of anandamide on rat cortical neurons exposed to a moderate stretch injury. This trauma model has been used to study diffuse axonal injury-induced molecular and biochemical responses in vitro (Ellis et al., 1995); it causes both necrotic and apoptotic pathways of cell death (Pike et al., 2000). Addition of 25 μmol/L AEA to cell culture media, a dose that did not cause cell death by itself, significantly increased stretch trauma–induced LDH release (Fig. 2b), indicating exacerbation of stretchmediated neuronal cell death by anandamide.
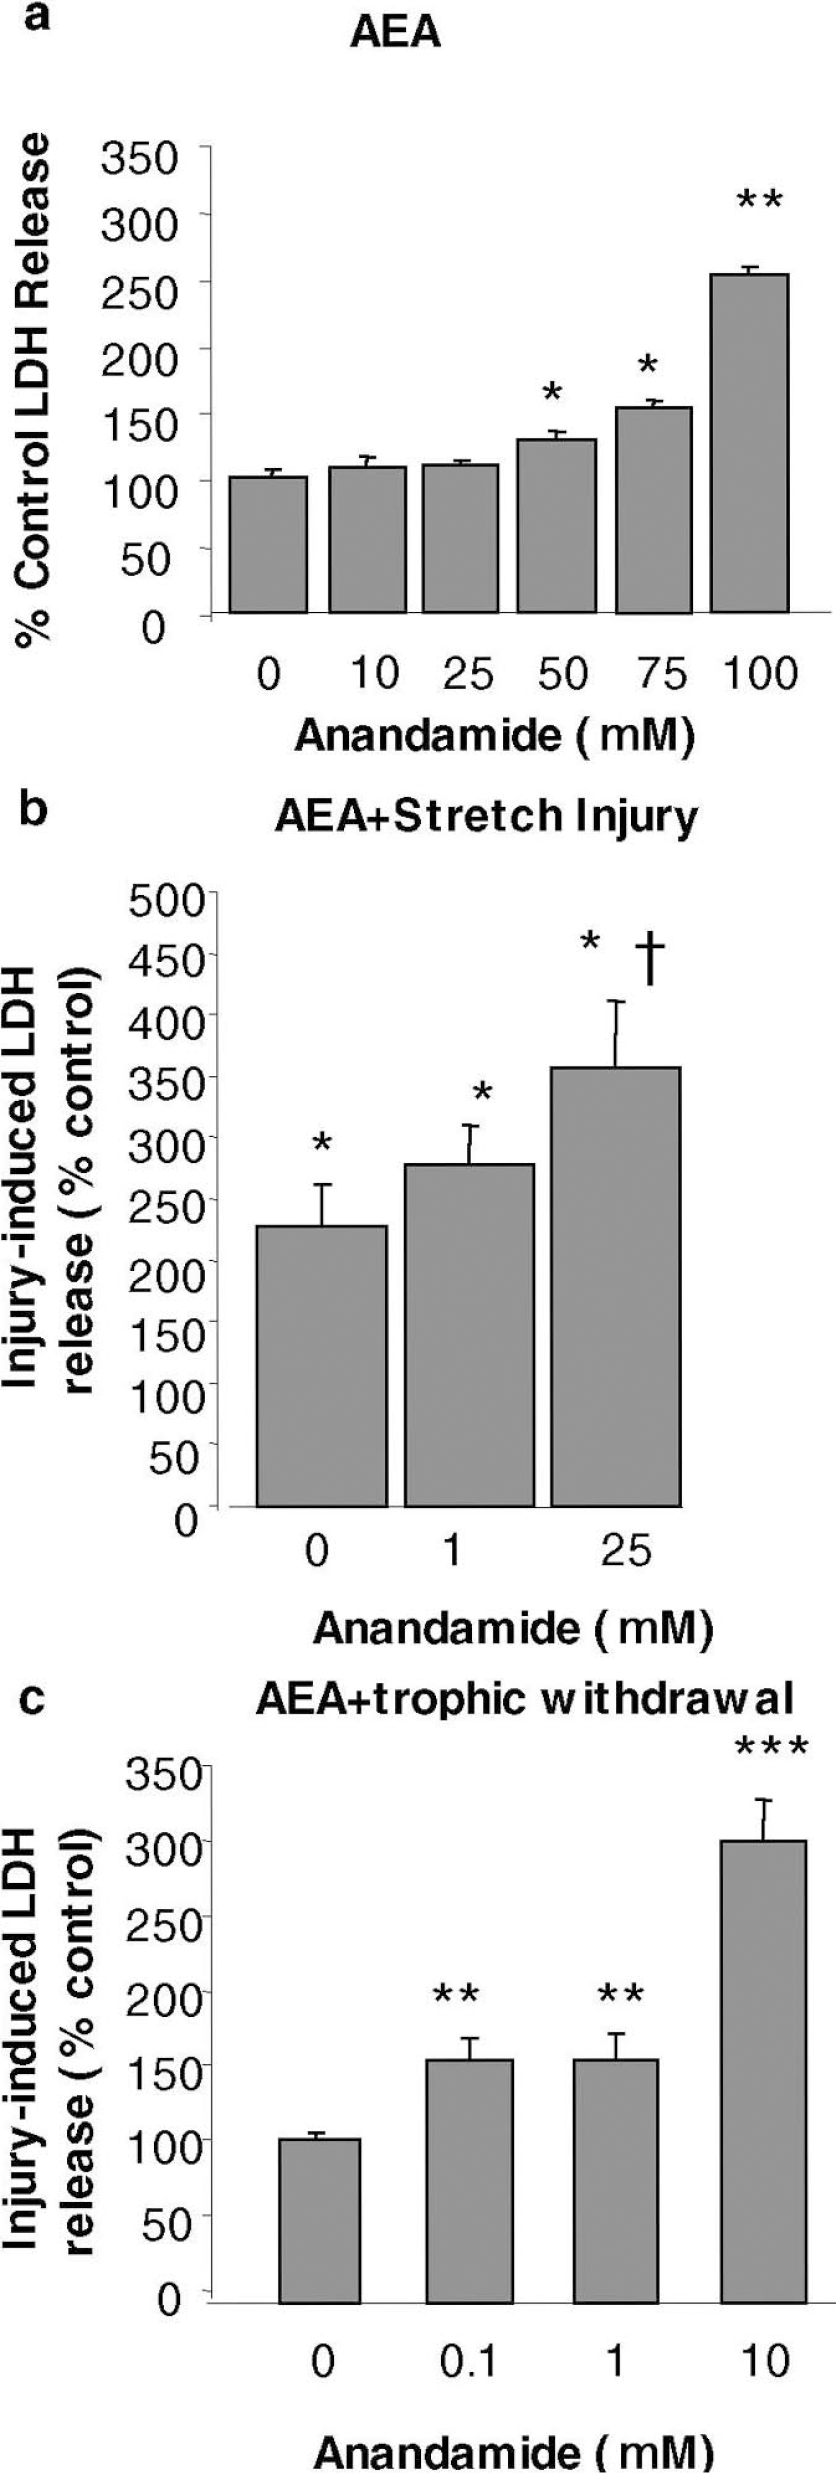
Effects of anandamide (AEA) on lactate dehydrogenase (LDH) release in cortical neuronal culture. (
Because of the possibility that low and high doses of AEA may have opposite modulatory effects on cell survival, we tested the effects of various concentrations of AEA on cell viability in CGC alone or subjected to trophic and potassium withdrawal. AEA in concentrations from 0.1 to 1 μmol/L had no effect on the viability of CGC with adequate trophic and potassium support (data not shown). However, administration of anandamide at doses of 0.1 μmol/L and greater significantly exacerbated injury-induced cell death in CGC subjected to trophic withdrawal, a well -established model of neuronal apoptosis (Eldadah et al., 1997) (Fig. 2c).
In vivo study
To address whether AEA may be neurotoxic in vivo, we administered 20 nmol/L AEA into the right cerebral ventricle in uninjured rats. To examine whether the AEA-induced effects are mediated through CB1 or VR1 receptors, we administered AM251, a CB1 receptor antagonist (1 μg intracerebroventricularly) or CPZ, a VR1 receptor antagonist (35 nmol/L intracerebroventricularly), 5 minutes after AEA injection.
Tissue damage after brain trauma may include both apoptotic and necrotic types of neuronal cell death (Raghupathi et al., 2000). Neuronal apoptosis after traumatic brain injury (TBI) is often associated with activation of caspase-3, and is attenuated by treatment with the caspase antagonist z-DEVD-fmk (Yakovlev et al., 1997). To elucidate whether caspase-3-mediated apoptosis is associated with AEA-induced neurologic dysfunction, we examined the ability of z-DEVD-fmk, at a dose shown to provide neuroprotection after TBI in rats (Yakovlev et al., 1997) (160 ng intracerebroventricularly) and given 5 minutes after AEA injection, to alter morphologic and functional changes induced by AEA.
In our laboratory, AEA (30 μmol/L) has been shown to increase intracellular calcium in rat cortical neurons, measured by fluo-3 fluorescence (Movsesyan et al., unpublished data). Among the potential effects of increased intracellular calcium accumulation is the activation of calcium-modulated proteases such as calpains (Buki et al., 1999). The involvement of calcium-modulated protease calpains in AEA-mediated changes was analyzed by injecting a calpain inhibitor, SJA6017 (35 nmol/L), intracerebroventricularly 5 minutes after AEA administration.
Neuronal cell loss after anandamide injection
To examine whether AEA administration causes neuronal cell death, we counted the total number of neurons in the CA3 region of the ipsilateral hippocampus 24 hours after AEA injection; this region also shows preferential cell loss after traumatic brain injury in rats (Bramlett et al., 1997). Significant cell loss was found in AEA-treated animals compared to vehicle controls (254 ± 4 neurons/mm3 vs. 195 ± 4 neurons/mm3) (Fig. 3). The VR1 receptor antagonist CPZ, as well as the calpain inhibitor SJA6017 significantly reduced such neuronal loss (Fig. 3). In contrast, neither the CB1 antagonist AM251 nor the caspase-3 inhibitor z-DEVD-fmk prevented the AEA-induced neuronal cell loss; in these animals, a trend toward enhanced neuronal cell loss was observed, although these changes were not significant statistically compared to animals treated with AEA alone (Fig. 3). This supports the possibility that inhibition of the CB1-mediated neuroprotection may amplify the neurotoxic effects of AEA and that inhibition of caspase-dependent apoptosis may facilitate a calpain-mediated necrotic cell death.
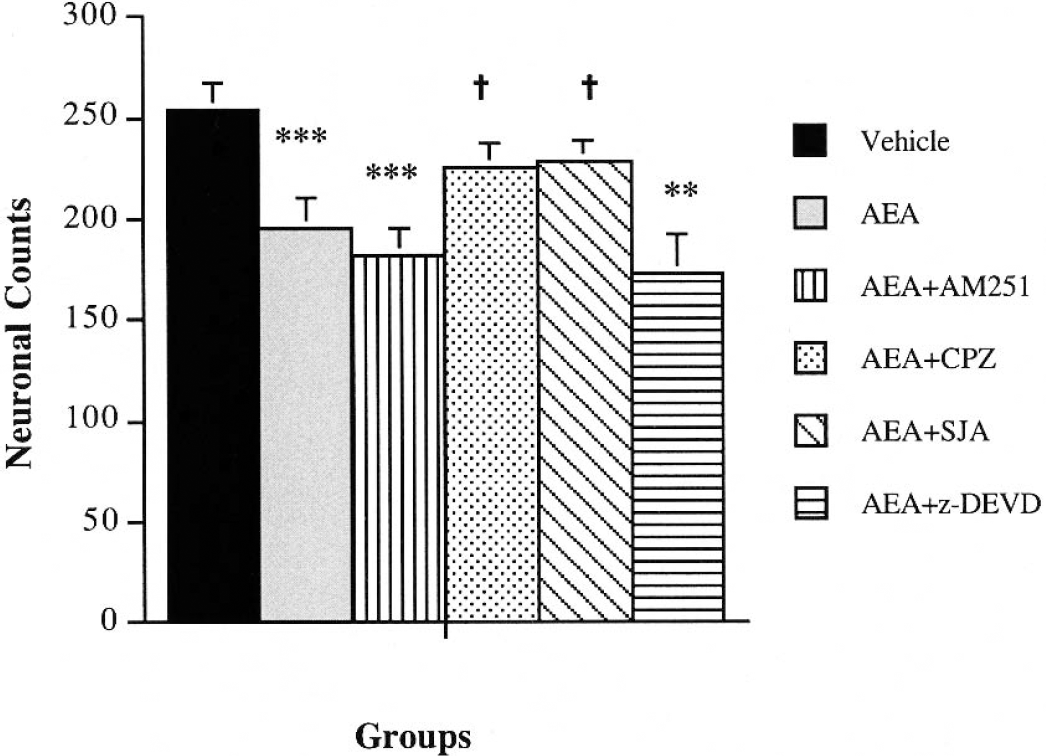
Cell loss after intracerebroventricular administration of anandamide (AEA) (20 nmol/L). Neuron counts in ipsilateral CA3 hippocampal subregion were analyzed statistically using the t-test with Bonferroni's correction for independent samples of groups. Intracerebroventricular administration of AEA (20 nmol/L) significantly reduced the number of cells measured 24 hours after injection. Treatment with capsazepine (CPZ) (35 nmol/L) and SJA6017 (1 μg) prevented the AEA-induced cell loss (for both †P>0.05 vs. AEA-treated group). Administration of a CB1 antagonist AM251 and a caspase-3 inhibitor z-DEVD-fmk (160 ng) did not have an effect on the AEA-induced cell loss. ***P>0.001, **P>0.01 vs. vehicle control; †P>0.05 vs. AEA-treated animals.
Magnetic resonance imaging changes induced by anandamide injection
T2-weighted MR images receive their contrast from the transverse magnetic relaxation of water protons in tissue (Boisvert et al., 1990); as such, this technique is widely used to detect ischemic changes in cerebral tissue (Jiang et al., 1998; Qiao et al., 2001). In our study, T2-weighted MRI demonstrated hyperintense areas bilaterally 24 hours after administration; the intensity was higher ipsilaterally to the injection (Fig. 4). Hyperintensity corresponding to the location of cerebral ventricle suggests enlargement of a ventricle because of tissue loss. Indeed, these ex vacuo changes were also confirmed by histologic examination (data not shown). Hyperintensity corresponding to hippocampi implies ischemic changes. Comparable alterations were found in the animals treated with CB1 antagonist AM251 and caspase-3 inhibitor z-DEVD, but were not noticeable in rats receiving VR1 antagonist CPZ or calpain inhibitor SJA6017 after AEA administration (Fig. 4).
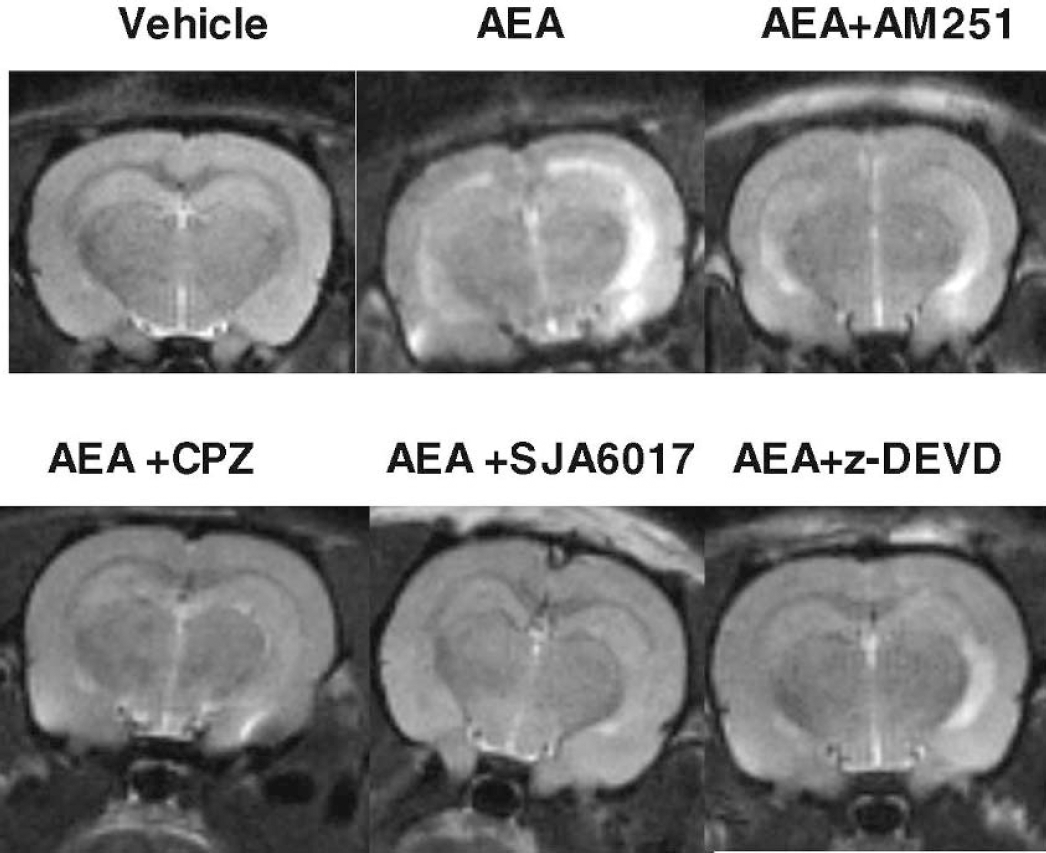
T2-weighted images obtained 24 hours after injection of vehicle, or anandamide (AEA; 20 nmol/L) alone or with combination with other compounds into right ventricle. AM251, CB1 antagonist; CPZ, capsazepine, VR1 antagonist; SJA6017, calpain VI inhibitor; z-DEVD, caspase-3 inhibitor. Hyperintense areas are noticeable bilaterally, and correspond to cerebral ventricles and hippocampi. The hyperintensity is increased in right hemisphere, ipsilateral to the injection. CPZ and SJA6017 significantly reduced the AEA-induced hyperintensity.
Diffusion-weighted MRI is accepted as a sensitive method for distinguishing between vasogenic and cytotoxic edema after traumatic brain injury (Li and Fisher, 1996). The ADC, calculated on the basis of DWI, significantly correlates with the changes of extracellular water (Albensi et al., 2000). Increased ADC in the brain indicates vasogenic edema, whereas reduced ADC suggests cytotoxic edema (Li and Fisher, 1996). Intracerebroventricular AEA administration significantly increased the ADC in cortex and hippocampus bilaterally (Fig. 5) at 24 hours through 7 days. Although there was no statistical difference between ADC values measured in left and right brain structures, the ADC map created on the basis of DWI revealed higher intensity of the changes of extracellular water in the right sight, i.e. ipsilateral to the AEA injection (Fig. 6). The increased ADC in the absence of any significant change in pH or bioenergetic state (Table 1) is consistent with vasogenic edema. Administration of the selective CB1 receptor antagonist AM251 (Kupina et al., 2001) (35 nmol/L intracerebroventricularly) 5 minutes after AEA injection reduced ADC values to significantly less than control levels (Fig. 5). Because reduced ADC is often considered as an indicator of cytotoxic edema, these findings may reflect enhanced cytotoxic edema, where block of the CB1 receptors by AM251 may have nullified the proposed neuroprotective action of CB1 receptors (Mechoulam et al., 2002a). CPZ, a VR1 antagonist administered 5 minutes after AEA injection (35 nmol/L intracerebroventricularly) significantly normalized ADC values during the first 48 hours after AEA injection (Fig. 5). However, the ADC was elevated in the CPZ-treated animals at 7 day after injection, which may reflect the limited duration of the VR1 antagonism achieved by a single injection of CPZ. Treatment with a caspase-3 inhibitor z-DEVD normalized the ADC in the observed brain structures during the first 48 hours after AEA injection. However, there was a significant reduction in ADC less than baseline levels in z-DEVD-treated animals at 7 days after injection, suggesting development of cytotoxic edema (Fig. 5). Intracerebroventricular injection of SJA6017, a new reversible peptide aldehyde inhibitor of calpain, administered 5 minutes after AEA, prevented ADC changes (Fig. 5).
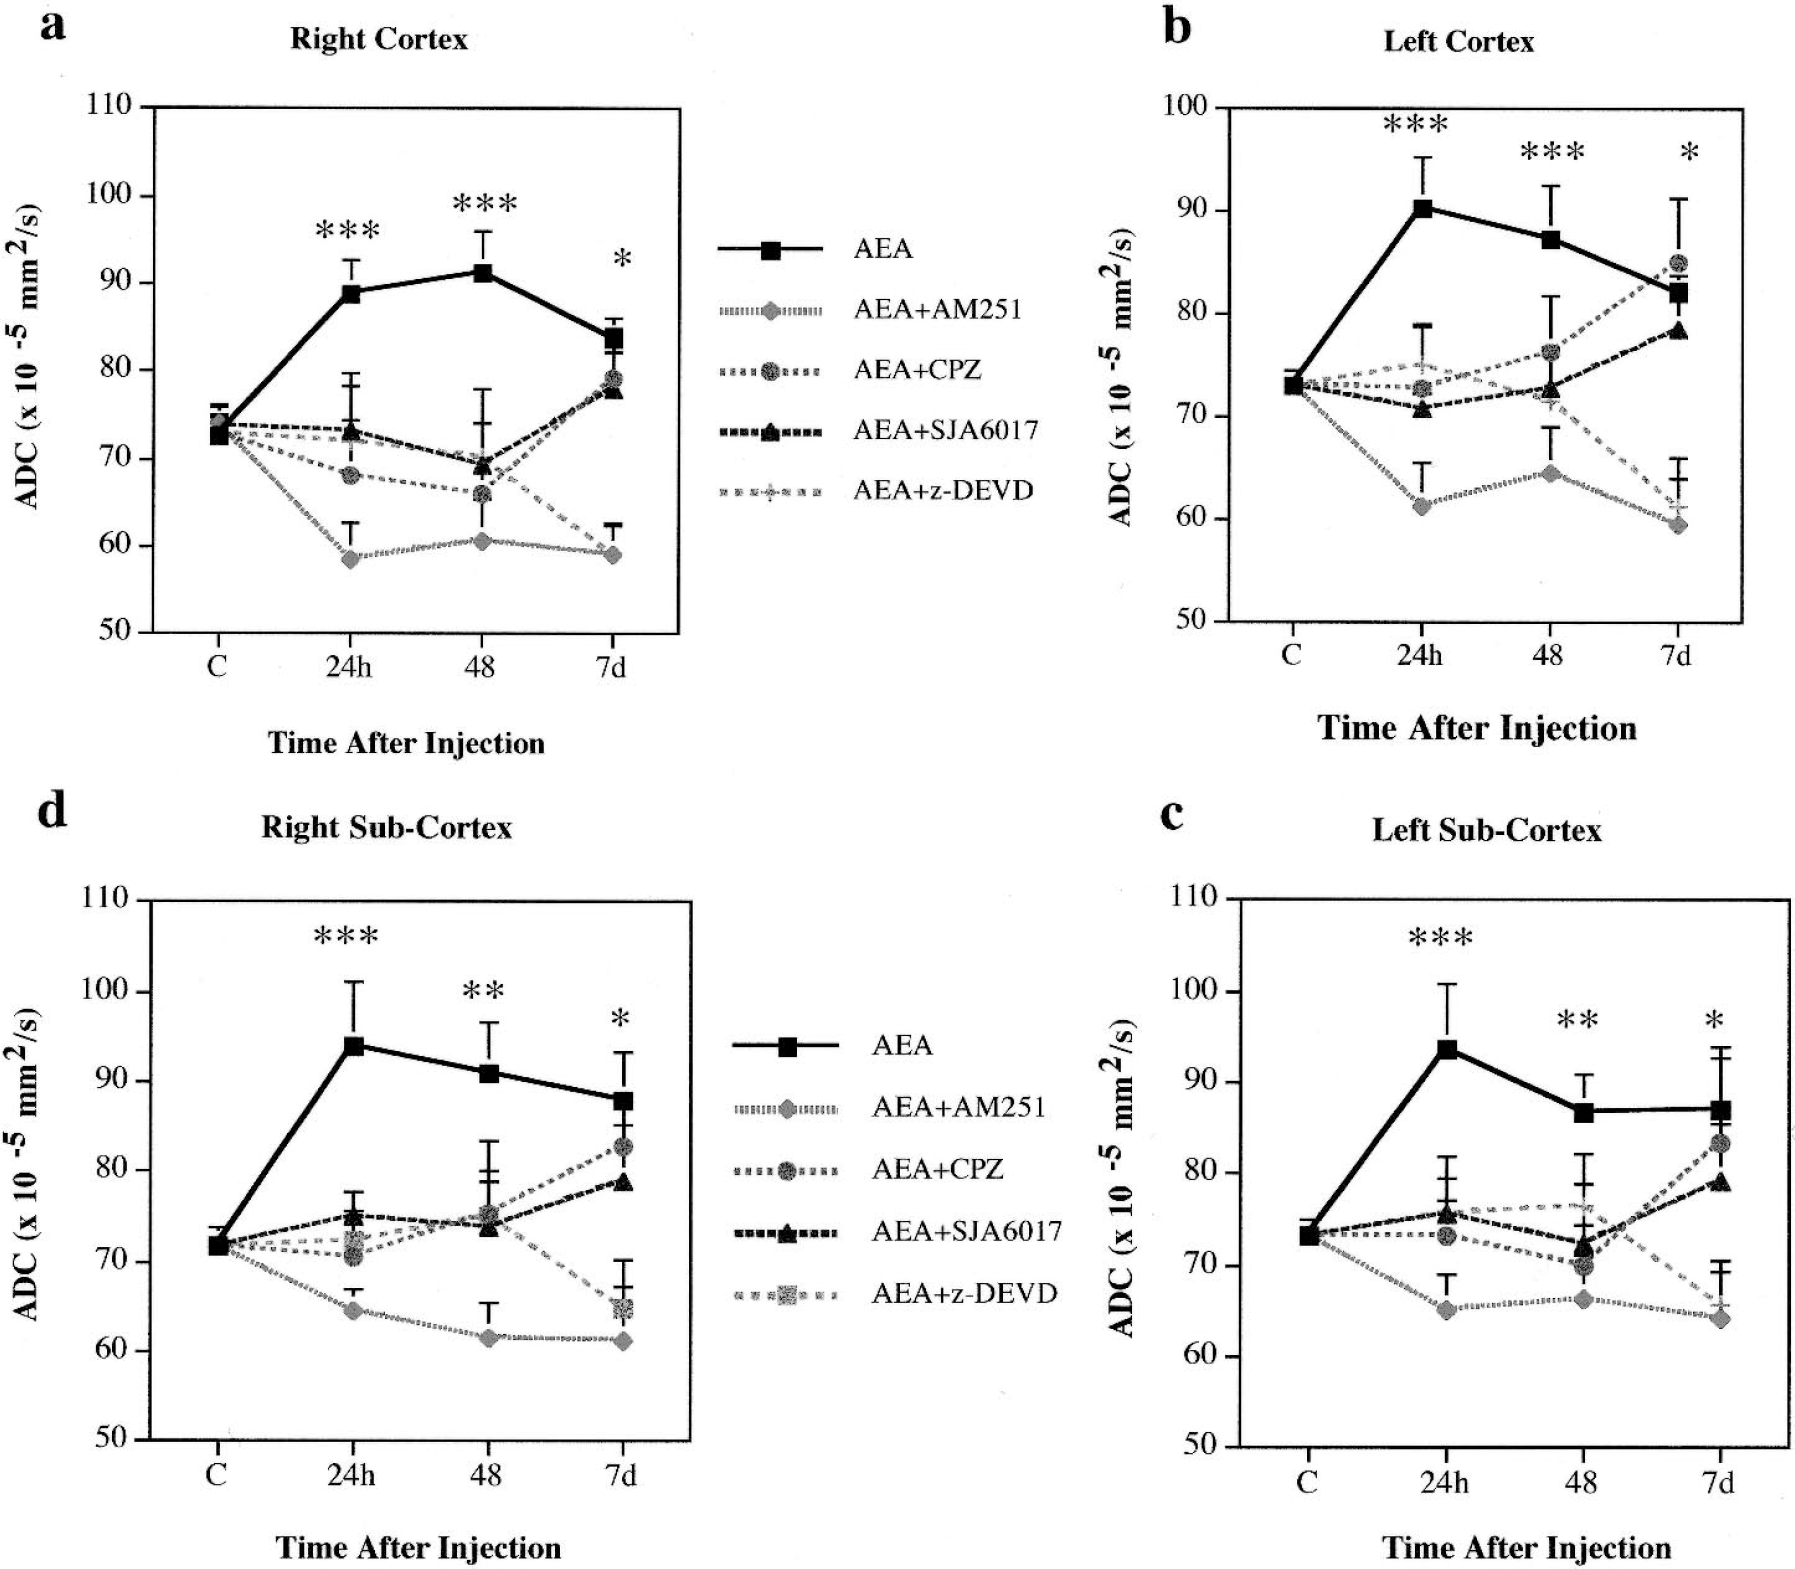
Apparent diffusion coefficient (ADC) measured by diffusion-weighted nuclear magnetic resonance imaging 24 hours, 48 hours, and 7 days after drug injections into right cerebroventricle: anandamide/AEA (20 nmol/L); CB1 receptor antagonist, AM251 (35 nmol/L); VR1 receptor antagonist, capsazepine/CPZ (35 nmol/L); caspase-3 inhibitor, z-DEVD-fmk (160 ng); and calpain inhibitor VI, SJA6017 (1 μg).
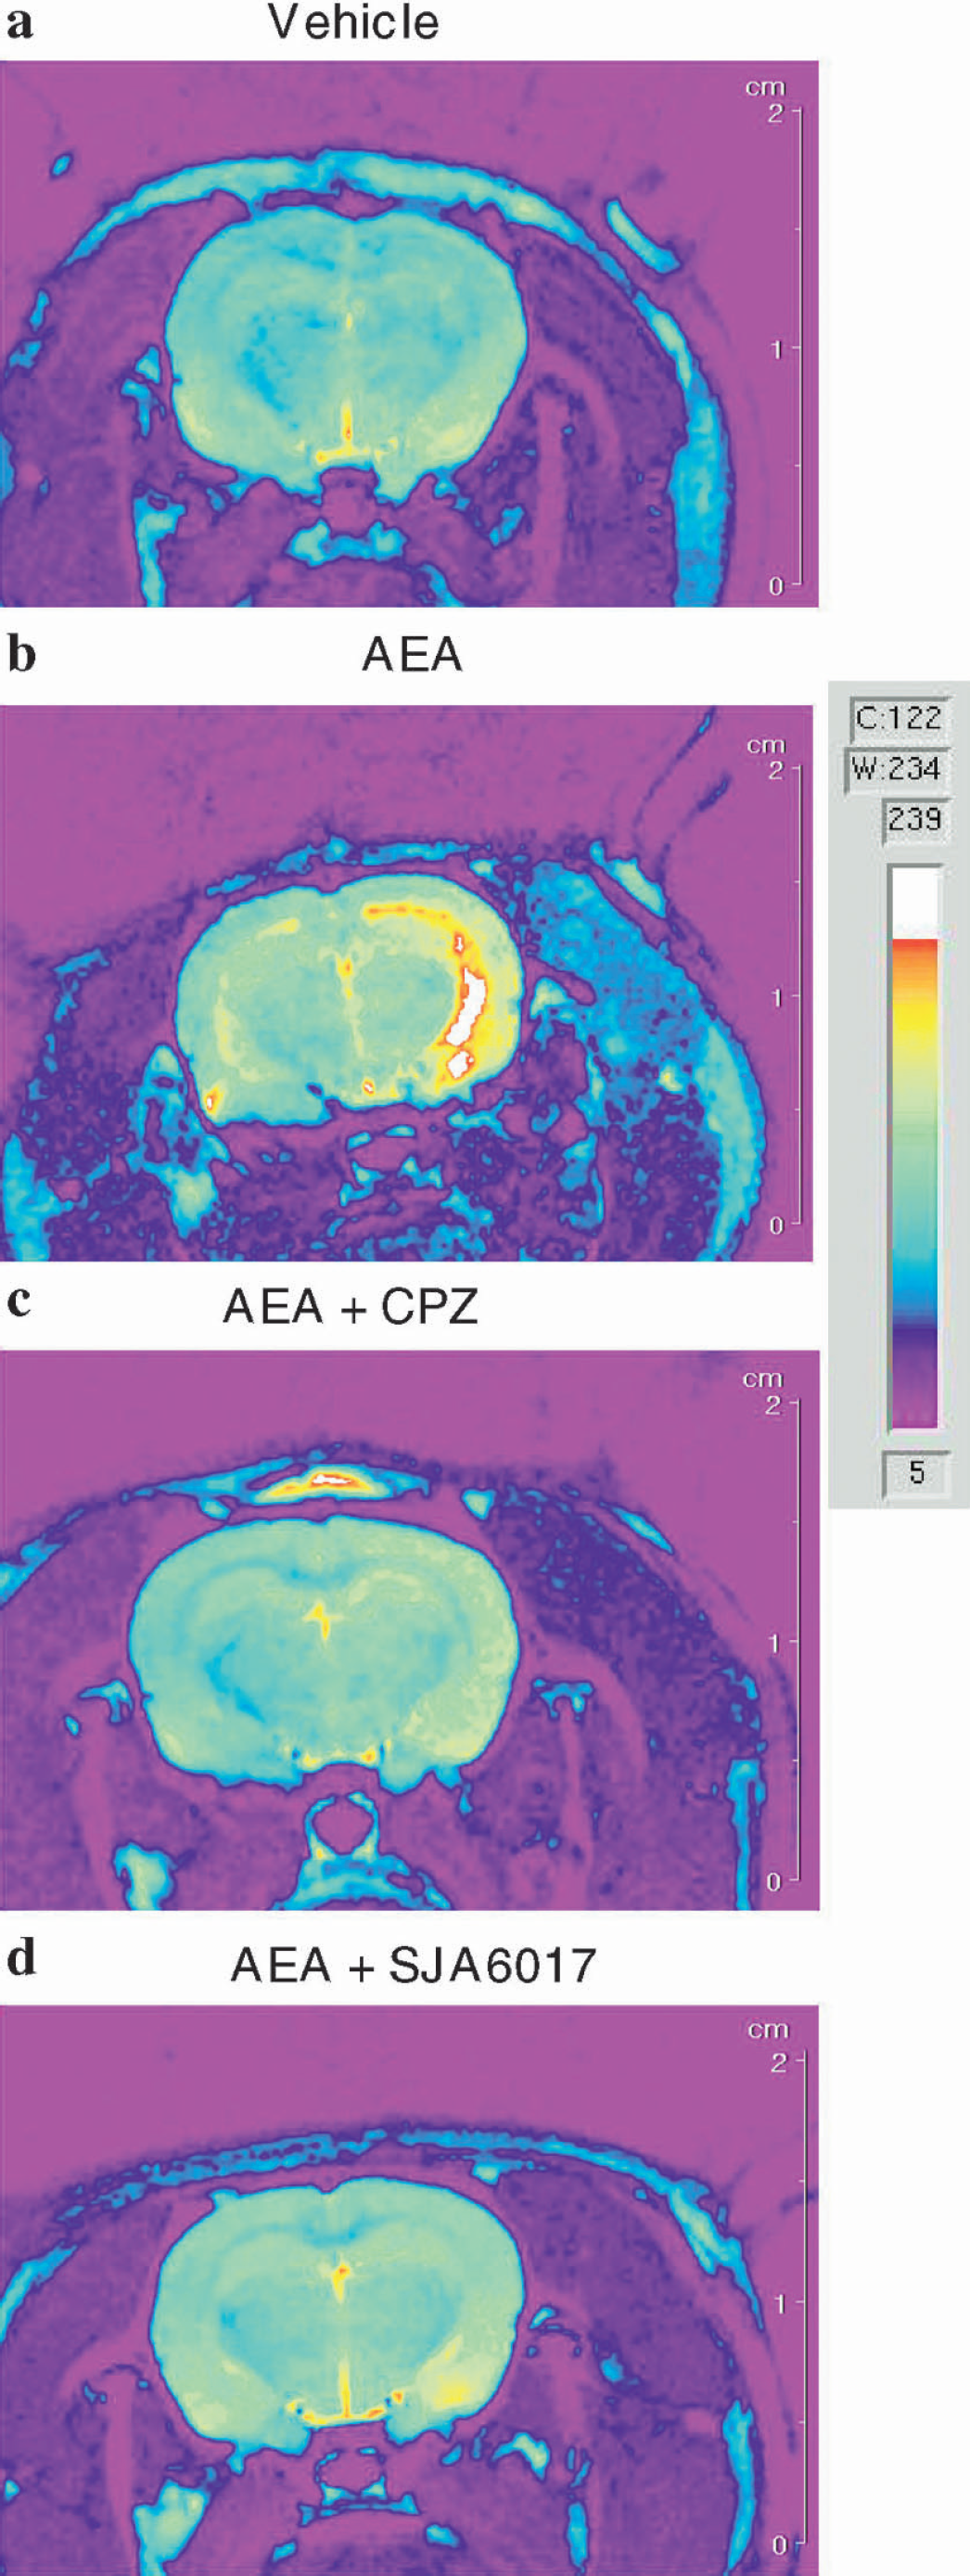
Representative diffusion-weighted images 24 hours after intracerebral injections (right ventricle, 5 μL final volume) of
Effects of anandamide on brain pH, free magnesium concentration, and bioenergetic state measured by nuclear magnetic resonance spectroscopy
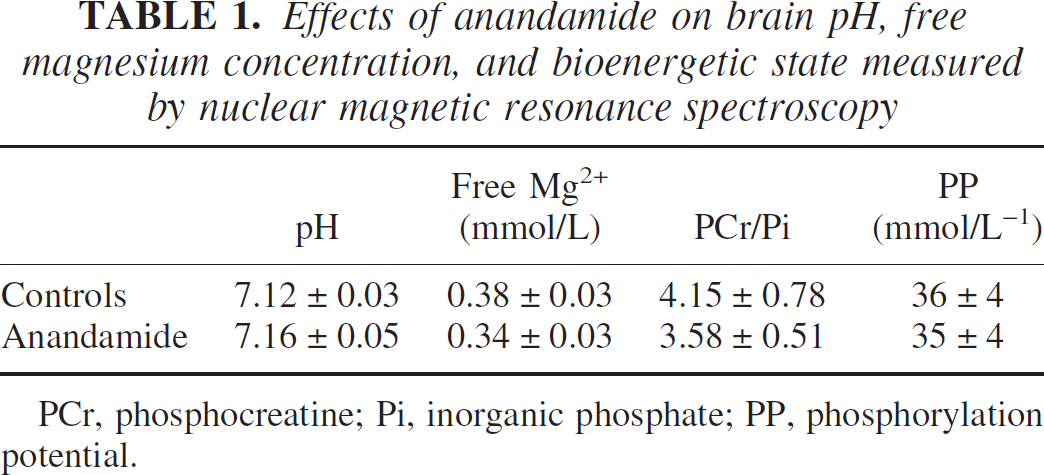
PCr, phosphocreatine; Pi, inorganic phosphate; PP, phosphorylation potential.
Caspase and calpain activation after anandamide injection
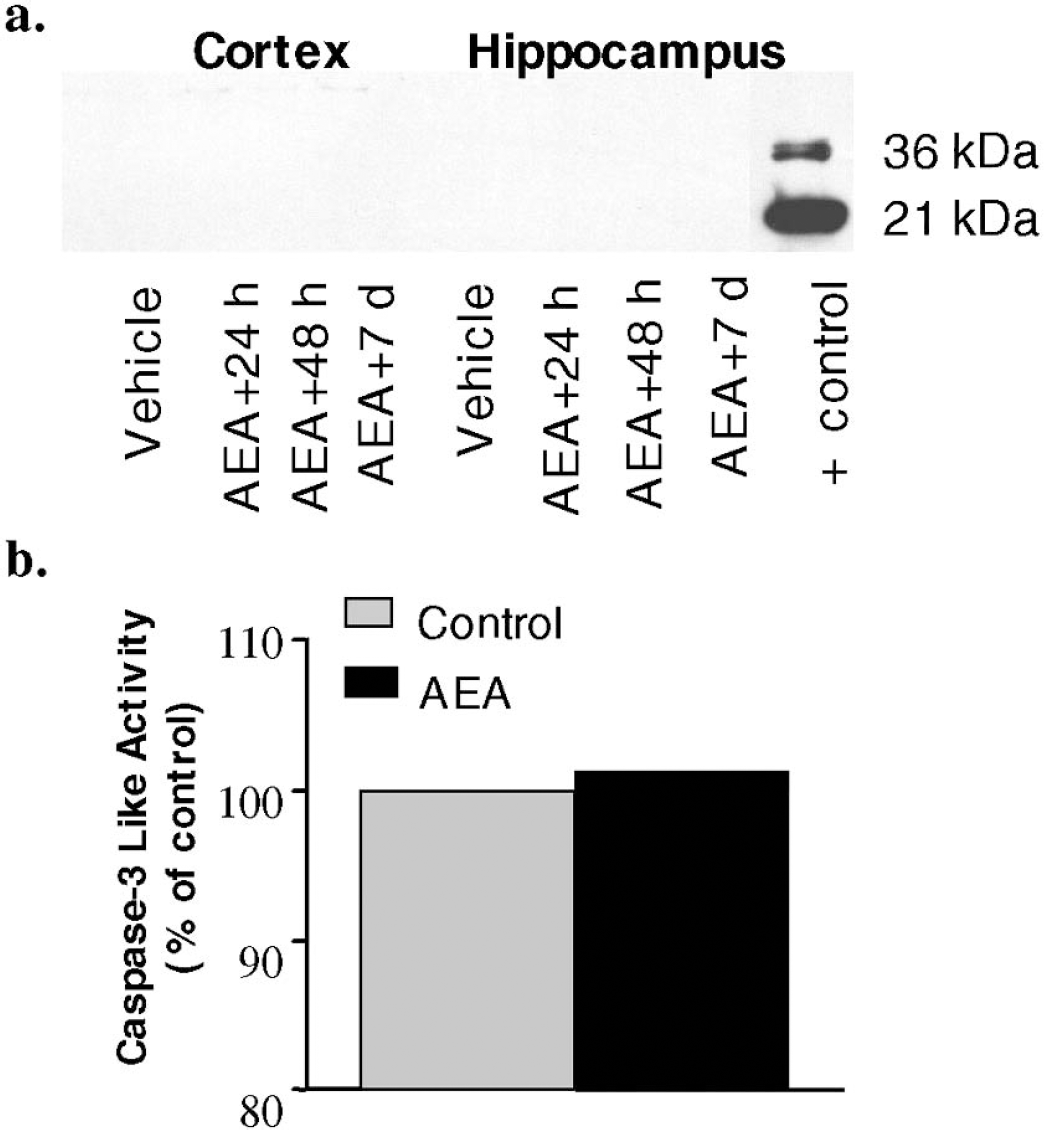
Importantly, neither immunocytochemistry (data not shown) nor immunoblotting showed caspase-3 (Fig. 7a shows ipsilateral structures) or caspase-9 activation (data not shown) after AEA administration. Additionally, a caspase activity assay demonstrated no changes in caspase activity in both ipsilateral and contralateral hippocampi 24 hours after AEA injection (Fig. 7b shows ipsilateral hippocampus). Consistent with the caspase inhibition studies, these findings indicate that the AEA-induced functional deficits are unlikely to be related to caspase-3-mediated apoptosis, in contrast to the findings in certain cell lines (Maccarrone et al., 2000).
Consistent with the MRI observations suggesting that calpain activation appears to be involved in the AEA-induced formation of edema, AEA injection caused a significant increase (approximately 30%) in calpain activity in ipsilateral hippocampus at 24 hours (Fig. 8).
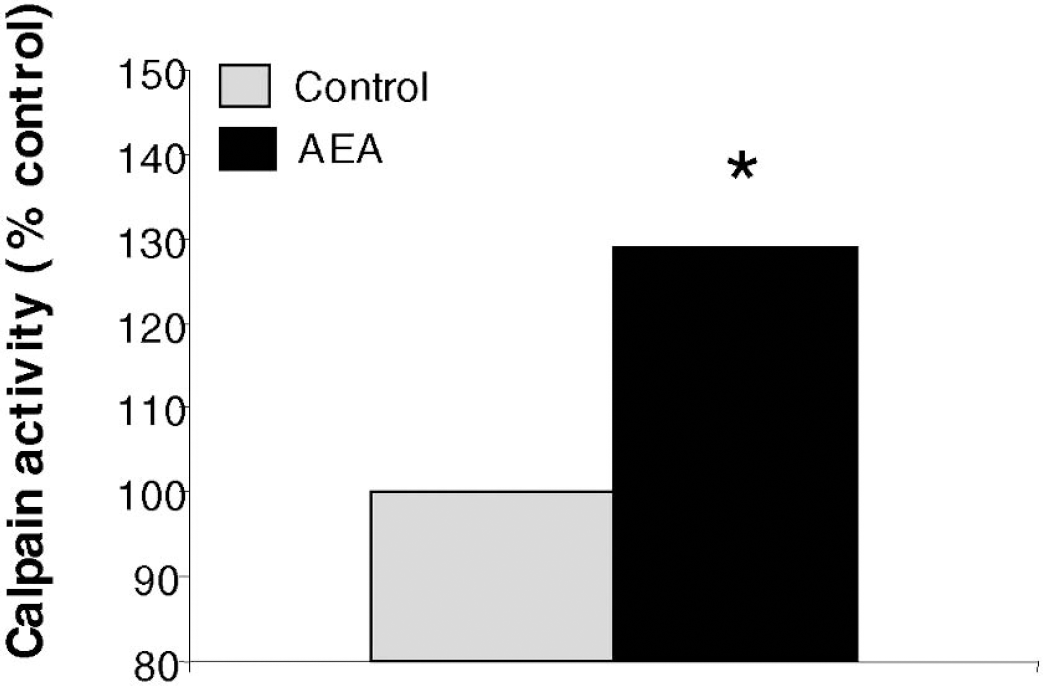
Calpain activity is increased in ipsilateral hippocampus 24 hours after injection of 20 nmol/L anandamide (AEA) into the right cerebral ventricle. Activity measured in AEA animals (n = 7) is expressed as percent of activity measured in naive (n = 7) and vehicle-injected controls (n = 5) processed identically and in the same assay. *P = 0.001 by two-tailed Mann-Whitney U comparison of AEA vs. control. Activity observed in naive and vehicle-injected controls was not statistically different.
Cognitive deficit induced by anandamide
The Morris Water Maze was performed during 4 consecutive days starting at 17 days after AEA or vehicle administration. The mean latency to locate the platform immersed below the surface of the water for the vehicle-treated animals at the end of the fourth training day was 27 ± 1 seconds. In contrast, animals treated with AEA demonstrated a mean latency of 45 ± 5 seconds at the same time-point, showing significantly reduced memory for the task, compared to vehicle controls (P>0.01) (Fig. 8). The CB1 receptor antagonist AM251 had no significant influence on the Morris Water Maze performance (Fig. 9a), indicating that the CB1 receptor was not involved in the AEA-induced cognitive deficits. Nonetheless, the cognitive deficit caused by AEA injection was prevented by the VR1 antagonist CPZ (Fig. 9b). Treatment with a caspase-3 inhibitor, z-DEVD-fmk, failed to prevent the AEA-induced cognitive deficit (Fig. 9c). In contrast, inhibition of calpain activation by administration of SJA6017 normalized cognitive performance at the fourth day of training, compared to nontreated animals (Fig. 9d).
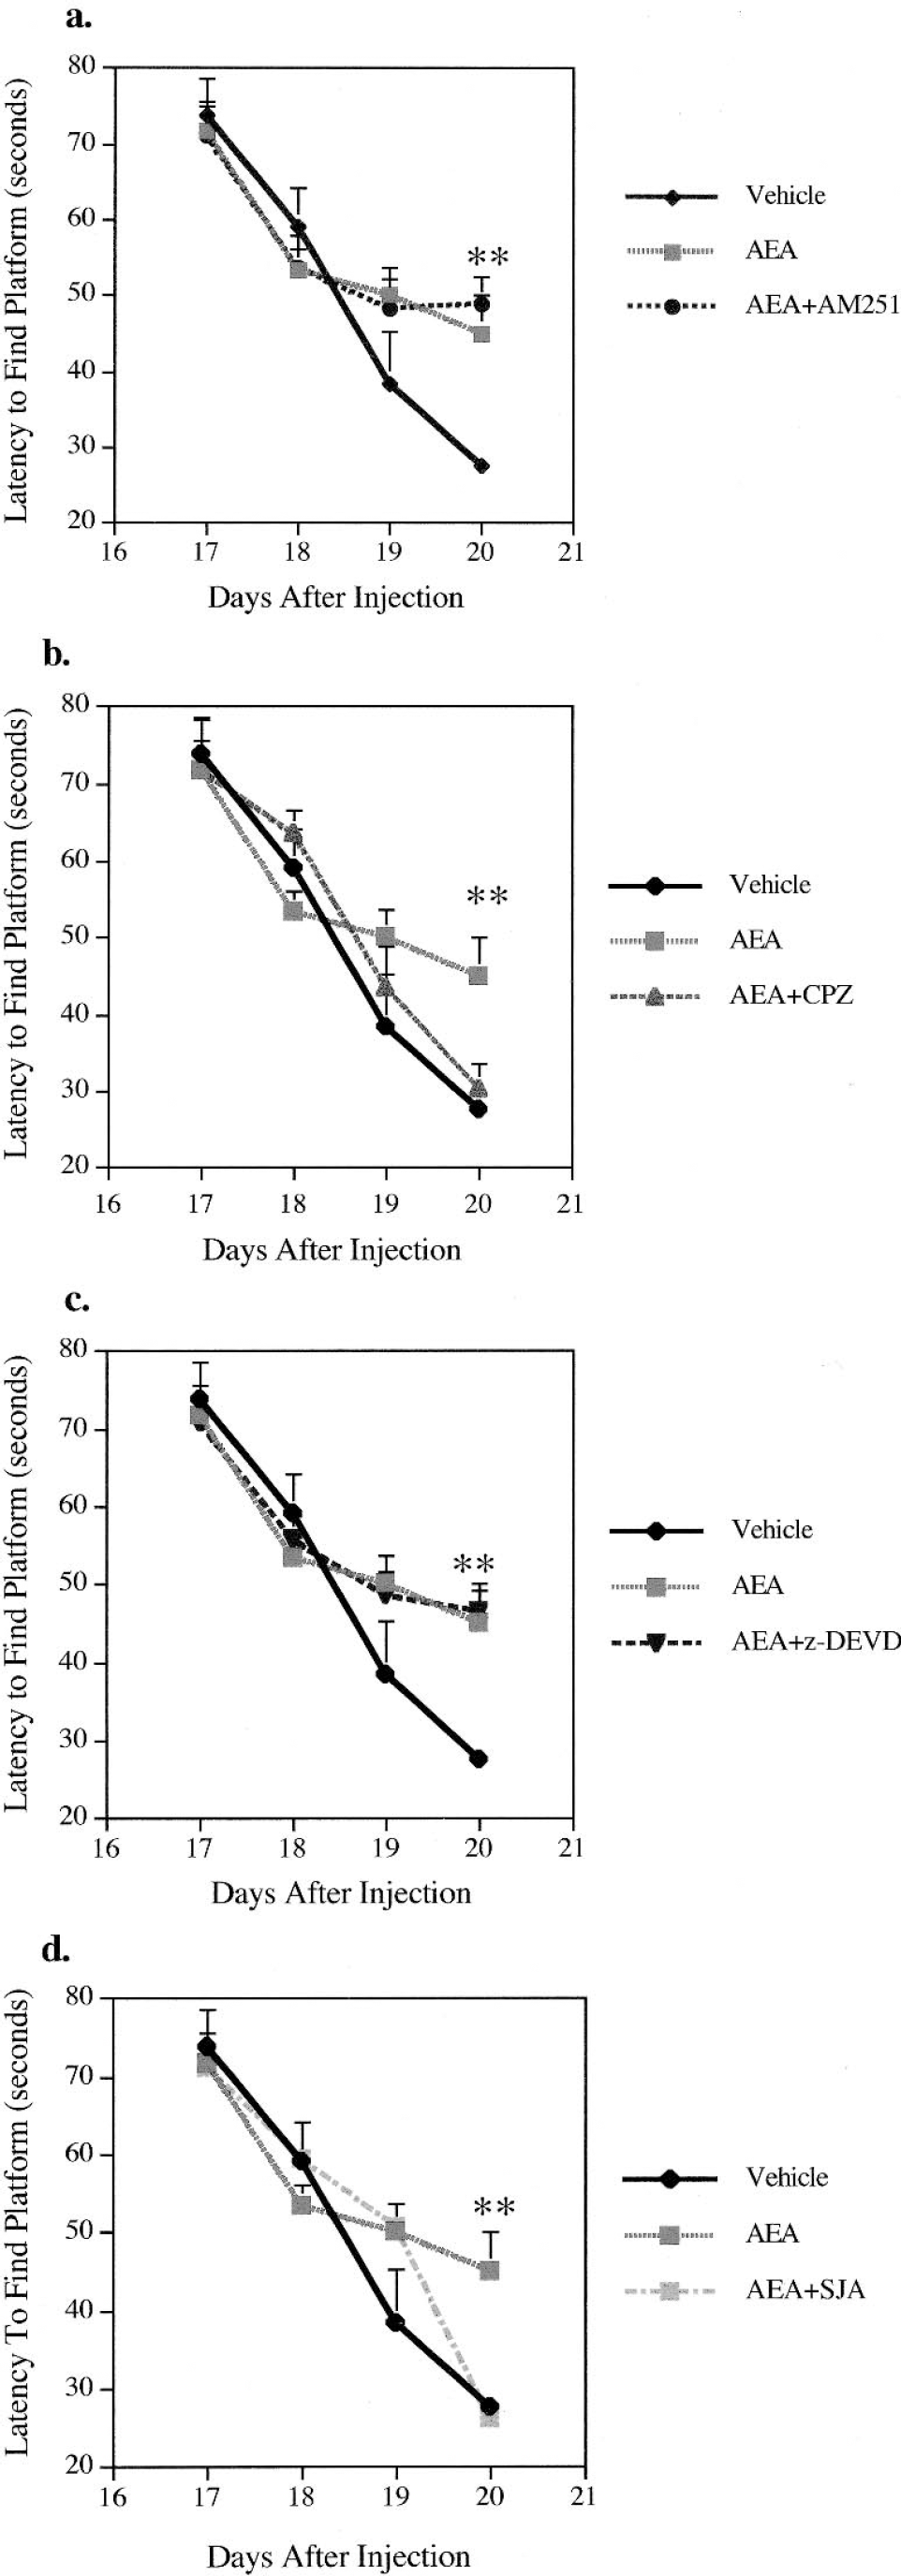
Morris water maze performance assessed 17 to 20 days after injection. Comparison of the mean latency (± SEM) to locate the hidden platform between vehicle-treated animals and animals with intracerebroventricularly administered anandamide (AEA) alone or in combination with
Gene expression changes after anandamide injection
To examine whether changes in gene expression underlie or contribute to the AEA-induced morphologic and functional alterations, we used oligonucleotide microarray hybridization to analyze changes in 8,800 genes/ESTs using RNA extracted from the brain structures (cortex and hippocampus, ipsilateral to the injection) of rats at various time points (24 hours, 48 hours, 7 days) after AEA administration. Of these, 331 (7.4%) probe sets in the cortex and 89 (2.0%) in the hippocampus demonstrated significant changes in expression level (vehicle vs. AEA) at one or more time points, when using more than 1.5-fold change and P>0.05 as criteria for significance. This organizational strategy demonstrated regional differences in temporal mRNA expression after AEA injection. Although each region displayed a unique transcriptional response to AEA, genes related to neurotrophic factors were downregulated in the cortex, whereas genes involved in inflammation were rapidly upregulated in both regions (Fig. 10a and 10b). This functional group included major histocompatibility complex (MHC) class II, fractalkine, granulin, and Fc gamma receptor in cortex, and galectin-3 and Ox-44 in hippocampus. Osteopontin and TIMP-1 were found to be upregulated at 24-hour and 48-hour time points in both brain structures. To verify the changes in mRNA level that were measured by microarray analysis, semiquantitative RT-PCR was performed on 3 randomly selected candidate genes (TIMP-1, MHC Class II, and BDNF) in both the cortex and hippocampus 24 hours after AEA injection. As shown in Fig. 10c, the direction of change in mRNA levels obtained using the microarray was consistent with the RT-PCR results.
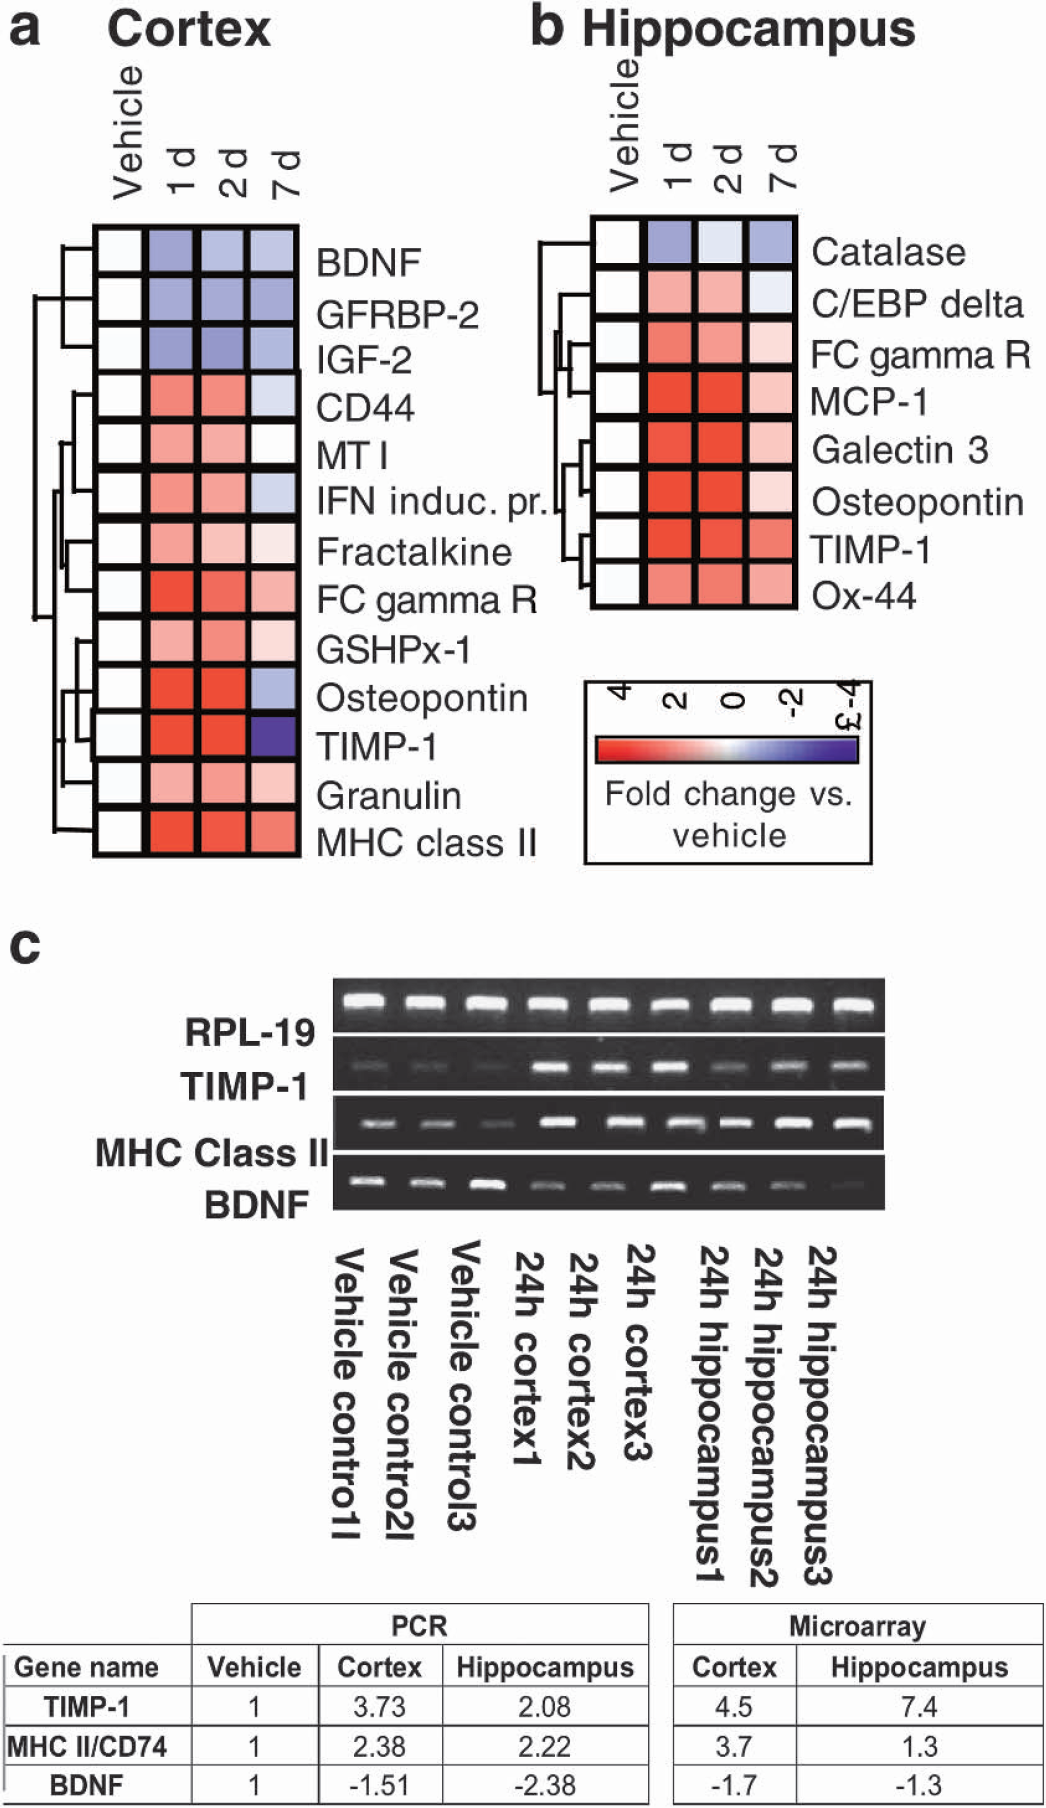
Temporal profile of gene alterations 24 hours, 48 hours and 7 days (n = 4/time point) intracerebroventricular injection of anandamide (AEA) (20 nmol/L) measured by oligonucleotide microarray technique. Signal intensity from each vehicle and AEA-injected microarray is normalized to the mean signal intensity from naïve cortex. Mean of the normalized signal intensity data is calculated for the vehicle microarrays, as well as for the AEA-injected microarrays at each time point. Genes showing at least a 1.5-fold change in one or more time points and a Welch t-test P value>0.05 between vehicle and AEA-injected groups at least one time point were considered significant. Significantly changed genes involved in inflammation and trophic support are shown as a dendrogram. Red indicates upregulation; blue, downregulation of gene expression after AEA injection vs. vehicle injection (white). The color intensity indicates magnitude of induction or repression.
DISCUSSION
We demonstrated that in two separate in vitro models of neuronal cell death, there was no evidence of AEA-induced neuroprotection; rather, anandamide clearly exacerbated cell death at doses lower than required to produce direct neurotoxicity. Furthermore, we found that anandamide in vivo significantly reduces cognitive performance and induces brain edema. The functional deficits caused by AEA were accompanied by neuronal cell loss in the hippocampus. Maccarrone et al. (Maccarrone et al., 2001) reported amounts of AEA to be approximately 50 nmol/g of fresh tissue in human brain, and 90 nmol/g fresh tissue in rat brain, respectively. It has been shown that brain injury induced in rats by intracerebral administration of N-methyl-D-aspartate is associated with a 13-fold increase in cortical AEA levels (Hansen et al., 2000). Therefore, the intracerebroventricular dose used in the present studies (20 nmol/L) should provide brain concentrations of AEA that are of a similar magnitude shown under pathologic conditions.
Previous studies have shown that endocannabinoids play an important role in the brain's first-line defense against excitotoxic damage (Mechoulam and Lichtman, 2003; Nagayama et al., 1999; Panikashvili et al., 2001; van der Stelt et al., 2002). However, significant differences in endocannabinoid effects were shown, depending on the species: in response to brain injury, mice produce 2-AG, whereas rats produce anandamide (Mechoulam and Lichtman, 2003). Moreover, the latest data (Marsicano et al., 2003) suggest that the neuroprotective effects of the endocannabinoids may depend on specific local action and on their on-demand production. Our observation that inhibition of CB1 receptors in the presence of anandamide significantly decreased the apparent diffusion coefficient (ADC) in the brain, suggesting cytotoxic edema, is consistent with the view that the activation of the CB1 receptors is protective.
However, there is ample evidence that anandamide exerts a pro-apoptotic activity by binding to vanilloid receptors (Maccarrone et al., 2000; Ross, 2003), although there are also data demonstrating that under certain conditions modulation of VR1 may lead to neuroprotection (Veldhuis et al., 2003). In our studies, the neurotoxic effects of anandamide in vivo appear to be largely mediated through VR1 receptors. Thus, the cognitive deficits, vasogenic brain edema, and neuronal cell loss induced by AEA were blocked by capsazepine, a selective antagonist of VR1 receptors.
Numerous studies have demonstrated that neuronal apoptosis after brain injury is often associated with activation of caspase-3, and that caspase inhibitors significantly improve outcome after CNS injury (Endres et al., 1998; Yakovlev et al., 1997). However, cell death associated with AEA administration was not associated with caspase activation. Our results suggest that not only did z-DEVD-fmk fail to prevent the AEA-induced cognitive deficits, but also it might induce cytotoxic edema 7 days after injection. We hypothesize that inhibition of caspase-3-dependent apoptosis may shift the apoptosis/necrosis continuum, moving the balance from apoptotic toward necrotic forms of neuronal cell death, as described in certain traumatic brain injury models (Bittigau et al., 1999).
Our previous results (Faden et al., 2003) showed that AEA increased intracellular calcium in rat cortical neurons, which support previous findings in nonneuronal cells (Mombouli et al., 1999); namely, addition of 30 μmol/L AEA into culture media after a steady Fluo-3 (Molecular Probes, Inc., Eugene, OR, U.S.A.) fluorescence baseline recording, in the presence but not absence of 1 mmol/L extracellular calcium, induced approximately a 20% increase in fluorescence, measured for 3 minutes after addition. The induction of calpains has been implicated in calcium-mediated neuronal injury after CNS injury (Povlishock et al., 1999) leading to delayed and sustained degradation of the cytoskeleton (Saatman et al., 2001). We chose SJA6017, a calpain inhibitor, administered in the dose that was shown to improve motor outcome after controlled cortical impact injury in mice (Kupina et al., 2001), to analyze the involvement of calpains in anandamide-related effects. The fact that SJA6017 strongly antagonized the neurotoxic effects of AEA supports the concept that activation of calcium-mediated signal transduction pathways by anandamide triggers calpains, leading to subsequent increase in spectrin proteolysis and cytoskeletal perturbation.
Brain injury causes significant changes in gene expression, with striking upregulation of genes involved in inflammation (Hayes et al., 1995; Hermann et al., 2001; Long et al., 2003; Matzilevich et al., 2002; Natale et al., 2003; Tang et al., 2002). The present study shows upregulation of genes involved in inflammation in cortex and hippocampus, including genes for MHC class II, fractalkine, FC gamma receptor, osteopontin, and TIMP-1. Upregulation of MHC class II antigen has been found in various in vivo models of brain injury, likely reflecting a trauma-induced microglial inflammatory response (Csuka et al., 2000). Fractalkine is a chemokine with cell adhesion and chemoattractive properties, which has been found to facilitate inflammatory processes in the CNS (Chapman et al., 2000). It has been demonstrated that fractalkine released from injured neurons can induce proliferation, activation, or migration of microglia, and as such can participate in the inflammatory response to neuronal injury (Tarozzo et al., 2002). Aggregation of Fc gamma receptors has been shown to activate phospholipases, increase intracellular Ca2+, and participate in antibody-directed cytotoxicity (Melendez et al., 1998). Upregulation of Fc gamma receptor has been reported in rat hippocampus during the early posttraumatic period (Matzilevich et al., 2002) as well in mouse cortex 3 days after cortical compact injury (Kobori et al., 2002). Osteopontin is a proinflammatory cytokine that enhances interferon-γ and interleukin-12 production, decreases interleukin-10, and plays a role in autoimmune-mediated demyelination (Chabas et al., 2001). Increased expression of osteopontin mRNA has been demonstrated in activated microglia as a response of the brain to kainic-acid induced excitotoxic injury (Kim et al., 2002). TIMPs that are specific inhibitors for metalloproteinases have been implicated in pathologic tissue remodeling such as scar formation (La Fleur et al., 1996). Significant upregulation of TIMP-1 has been found in reactive astrocytes after stab injury to the mature rat brain (Jaworski, 2000) as well as in ischemic rat cortices after middle cerebral occlusion (Rosenberg et al., 1998). Because many of the genes mentioned here are involved in inflammation and microglial activation, these results suggest the possible role of AEA in neurogenic inflammation.
Our results show downregulation of genes related to neurotrophic factors in cortex after AEA administration. Changes in the gene expression profile of neurotrophic factors have been found after brain injury (Hicks et al., 1999; Kobori et al., 2002; Rall et al., 2003), with BDNF being upregulated (Kobori et al., 2002). Downregulation of neuroprotective neurotrophins, including BDNF, may represent additional mechanism of AEA-induced neurotoxicity.
In conclusion, the present study demonstrates that the endocannabinoid anandamide is not necessarily neuroprotective as previously believed (Mechoulam et al., 2002a; Panikashvili et al., 2001; Sinor et al., 2000), but rather may induce pathologic effects in the brain, mediated through VR1 receptors and calpain activation. Furthermore, the increased vasogenic edema and the gene profiling changes induced by anandamide are consistent with the hypothesis that AEA initiates a neurogenic inflammatory response. Anandamide is also neurotoxic in vitro, and exacerbates neuronal cell death induced by either stretch injury or trophic withdrawal. Because AEA has been shown to be neuroprotective in different in vitro model systems, we suggest that AEA may, like Janus facing in opposite directions, show opposite actions with regard to modulation of cell death, depending on which receptors or signal transduction cascades are activated.