
Abstract
In the treatment of acute ischemic stroke most of the clinical trials have failed, contrasting with promising results in the preclinical stages. This continuing discrepancy suggests some misconceptions in the understanding of acute ischemic stroke. One possible method for identifying the shortcomings of present-day approaches is to integrate all the available knowledge into a single mathematical model and to subject that model to challenges via simulations with available experimental data. As a first stage, then, the authors developed a simplified model, defining the structure and the different parameters that represent the phenomena that occur during the hyperacute phase of ischemic stroke. First, the different critical points of the evolution of ischemic stroke, based on the available evidence on the pathophysiology of stroke, were identified. Those key steps were then related to the quantitative data obtained by magnetic resonance imaging and positron emission tomography scan. These two techniques allow the measurement of diverse key markers of cerebral metabolism: cerebral blood flow (CBF), oxygen extraction factor, cerebral metabolism rate of oxygen, and the apparent diffusion coefficient of water, among others. Those markers were organized together through mathematical equations, and changed over time in order to describe the evolution of an acute ischemic stroke. At each time during the evolution of stroke those parameters are summarized in a parameter called survival delay. This parameter made possible the definition of three different states for tissues—functional, infarcted, salvageable—as end point. Once the model was designed, simulations were performed to explore its internal validity. Simulation results were consistent with the reality of acute ischemic stroke and did not reveal any major drawbacks in the use of the model. The more rapid the decrease in CBF, the larger is the final infarcted area. The model also allowed for the characterization of two types of tissue in the penumbra: tissues with an initial metabolic impairment and tissues altered owing to the closeness of the ischemic area. The results of this experiment were consistent with what is known of acute ischemic stroke. The model integrated different markers of acute ischemic stroke into a single entity in order to mimic acute ischemic stroke, and has been shown to have a reasonable degree of internal validity.
In developed countries, stroke is the third cause of death and the first cause of disabilities in adults (Dirnagl et al., 1999;Poungvarin, 1998). Owing to this incidence and the aging of the population, efforts are being made on the research of new treatments for the acute phase of stroke, focusing mainly on decreasing residual disability. Two main therapeutic approaches, revascularization and neuroprotection, are among those being investigated. Even though thrombolysis using recombinant tissue-type plasminogen activator has been approved by the FDA, the procedure is still matter of debate in Europe (Wardlaw et al., 2000). The so-called neuroprotective drugs seem to have a relevant pharmacological activity on preclinical stages of development, but the clinical trials do not confirm preclinical results (De Keyser et al., 1999). The discrepancy between the results of animal model experiments and clinical trials in human patients may come from various sources: (1) a lack of relevance of the animal models as surrogates of the human ischemic brain attack; (2) a discrepancy between the real mechanism of action of the agents and the anticipated effects; (3) a design of clinical trials that does not allow efficacy to be demonstrated (e.g., a too-long delay to administration of the drug); (4) a difference between animal and human being as regards the dose—effect relation of these agents; (5) a difference between animal and human penetration of the drugs in the brain (i.e., a pharmacokinetic problem); (6) in humans, the tested molecules have their positive effects counterbalanced by an unanticipated negative effect (e.g., they could be efficient in reducing the infarcted volume in humans and in animals, but, in humans, could also decrease the neuronal plasticity, on which the clinical recovery is based).
Whatever the explanation, the discrepancy surely results from the limited relevance of our therapeutic models. There is a need, therefore, to identify where the drawbacks are in order to make significant progress in the treatment of stroke. To achieve this identification, we should first formalize all that is known about the hyperacute phase of the disease. One approach would be to build a mathematical model that assembles all available knowledge, and to use the model as a reference for designing new experiments and predicting their results through appropriate simulations (Noble et al., 1999).
Following this approach, we began to develop a formal model that would bring together different fields of knowledge on the pathophysiology of acute ischemic stroke and its neuroimaging investigation techniques, with a particular interest in magnetic resonance imaging (MRI) and positron emission tomography (PET). Such a formal model cannot be built in a single step, but in this article we report on our “first step” toward this goal, where we designed a “reduced” model of acute stroke and tested its ability to simulate the main established features of acute stroke. Since we are interested in the treatment of human stroke, we chose biomarkers accessible to brain imaging techniques as key expression parameters of the model, allowing us to explore in vivo brain ischemia in animal and in clinical settings. Such an approach would allow us to confront model predictions with experimental and clinical data.
In this article we present, first, the hypotheses on which the model is based; second, the model structure; and last, acute ischemic strokes simulated in order to illustrate the relevance of such a model by exploring its internal validity. For our “first step,” we decided to characterize stroke by using only the following parameters: cerebral blood flow (CBF), oxygen extraction factor (OEF), cerebral metabolism rate of oxygen (CMRo2), and a diffusion-weighted MRI parameter, the apparent diffusion coefficient of water (ADCw). These parameters evolved over time to define at each time point a key parameter called survival delay, which in turn allowed us to define the state of a cell at each time point of the stroke episode: as functional, infarcted, or salvageable.
MATERIALS AND METHODS
Hypotheses of the model
First, current knowledge of the physiopathology of stroke, “a clinically defined syndrome of rapidly developing symptoms or signs of focal loss of cerebral function with no apparent cause other than that of vascular origin” (Warlow, 1998), was summarized as a sequential (i.e., with branching and loops) series of events. Each event was characterized by a single parameter that could be measured by diffusion-weighted imaging (DWI) MRI and PET techniques.
The first stage of an acute ischemic stroke is a decrease of CBF. Vasodilatation occurs in compensation, in order to maintain the CBF constant for pressure higher than 60 mm Hg (Lassen, 1990). Beyond this limit, an increase of OEF (among other mechanisms) engages to maintain oxidative metabolism of glucose. Physiologically around 35%, OEF can be increased to a theoretical value of 100% (Baron, 1999) as a consequence of decreased CBF. Beyond that point (100% OEF) a decrease of CMRo2 occurs, characterized by the occurrence of ischemic cellular damages (core) (Biagas, 1999;Kristian and Siesjo, 1998;Lee et al., 1999) as a consequence of reduced blood flow.
Consequent to this “energy failure,” edema, one of the important markers of brain structure and functionality impairment during a stroke, appears. Its progress is typically in three stages (Baird and Warach, 1999;Schwamm et al., 1998). An early cytotoxic stage is marked by an increase of intracellular water, which goes through the cell membrane, following sodium, as sodium channels are opened because of the energy failure. The second stage, beginning three to six hours after onset, is marked by an increase of extracellular water as a result of an increase in extracellular protein concentration. In the third and last stage, a disruption of capillary membrane causes a flow of plasmatic fluid to the extravascular field. Edema signals a bad prognosis and could increase ischemic damage.
First defined by Astrup et al. (1981), the penumbra—the viable and salvageable tissues on the way to ischemia—is an area of electrical silence below a certain value of perfusion. Evolution of the penumbra areas depends on the parameter absolute values, their evolution over time, and the status of nearby areas. It has been well defined through numerous PET studies (Baron, 1999) and can be summarized thus: as an area with an OEF increased to more than two standard deviations of the values of the contralateral hemispheres, a CBF between 7 and 17 mL · 100 g−1 · min−1 (Fisher, 1997), and a metabolism which is maintained to a basal level (CMRo2 between 3 and 1.5 mL · 100 g−1 · min−1).
In investigating a stroke area, there are three main neuroimaging techniques for evaluating parameters in the different areas of ischemic tissues, the core, and the penumbra: diffusion-weighted perfusion and spectroscopy MRI (Berry et al., 1998;Beauchamp et al., 1999), and PET (Baron, 1999, 2001;Heiss et al., 1998). These techniques permit quantification of stroke markers (parameters) in the different areas of the human brain subjected to a blood flow decrease. Correlations with the clinical evolution of stroke make it possible to identify critical values for these parameters.
Diffusion-weighted images (Baird and Warach, 1998) make it possible to investigate edema parameters such as the ADCw—a marker for extracellular water movement—compared to the contralateral hemisphere. After stroke onset a fast decrease of ADCw occurs, followed by stabilization and eventual increase. Van Everdingen et al. (1998) point to an unfavorable correlation for tissue with an ADCw less than 0.62 and clinical outcome based on a 42-patient study. With PET scanning, one can approach other parameters—CBF, OEF and CMRo2—and their critical values (Table 1). Touzani et al. (1995) consider the CMRo2 threshold to be 1.5 mL · 100 g−1 · min−1, below which tissues can be said to be undergoing major hypoxic failure. Another clinical study found that, below the 1.4 mL · 100 g−1 · min−1 value (Marchal et al., 1996), damages to cells were irreversible.
Definition of the different areas involved in an acute ischemic stroke based on the positron emission tomography scan parameters
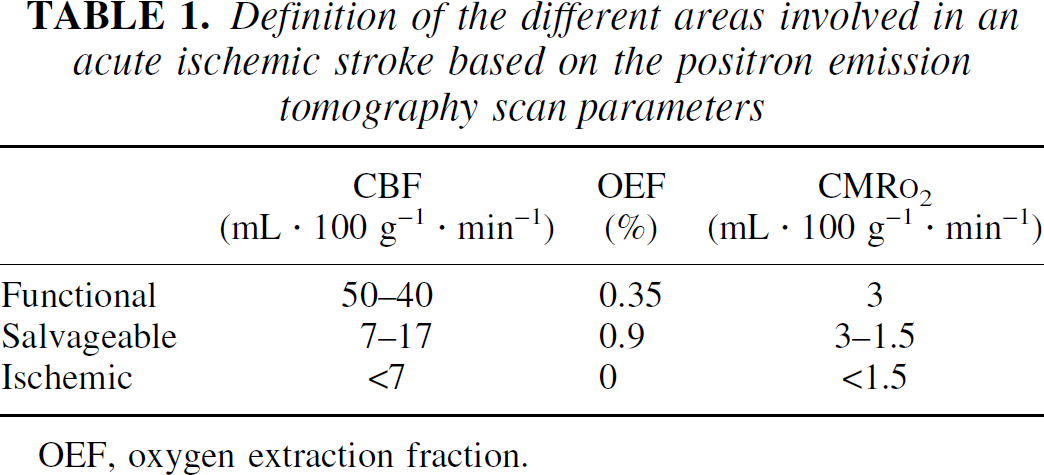
OEF, oxygen extraction fraction.
The model
Design of the model.
Design of the model and simulation were performed on a 166-MHz computer, with the S+ software (MathSoft Inc.) (1998).
Matrix structure.
The stroke model is a matrix of x row and y lines, defining × × y “cells” (Fig. 1). Each of these units is meant to represent an elementary area of a slice of brain tissue. Even with a 2-dimensional-structure model, we acknowledge that each unit has a non-null arbitrary volume. A unit in the model is meant to represent a homogeneous area for each mechanism it is involved in during stroke evolution. Number and size of units can be adapted to the work to be done. For each unit, six parameters are defined:number of vessels which irrigate the unit, blood flow for each vessel, OEF, CMRo2, ADCw, and survival delay.
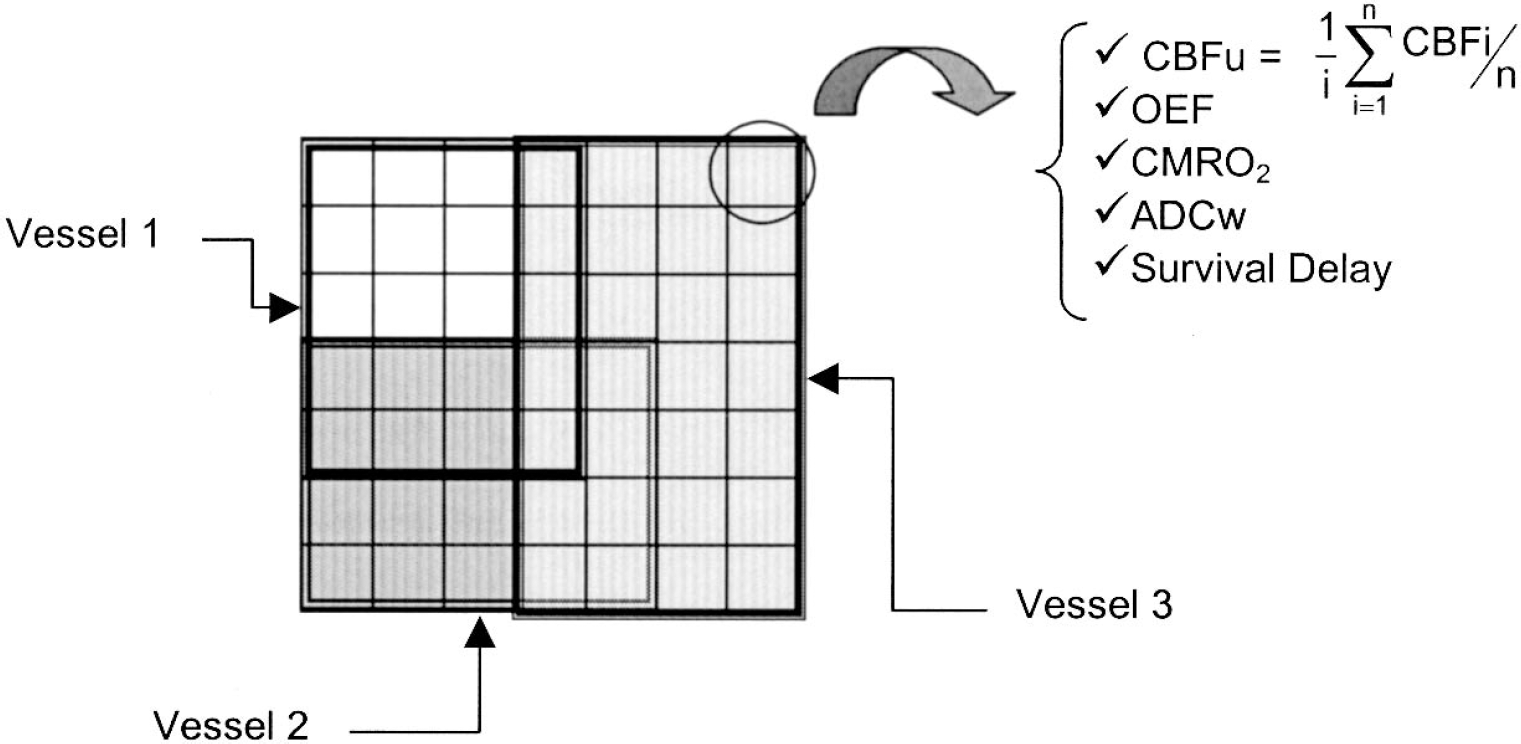
The matrix structure of the model, defined by 7 × 7 units. Each unit has its own parameters—CBFu, cerebral blood flow (mL · 100 g−1 · min−1) for a unit of the model; CBFi, cerebral blood flow (mL · 100 g−1 · min−1) for the vessel i; and survival delay, estimated delay for a unit before it is considered an ischemic unit—and can be irrigated by 1, 2 or 3 of the vessels.
Units are irrigated by a designated number of vessels. Each vessel irrigates, in a restricted area, a defined number of units by dividing itself into capillaries; one “capillary” of a vessel can irrigate only one unit (but each unit can be irrigated by more than one vessel). The first unit irrigated by a vessel defines the irrigation area of the vessel: it is called the index unit (one index unit for each vessel). The index units' positions are randomly defined on the matrix structure. The distances from the index units to each other unit of the matrix are calculated and compared. Each unit will be irrigated by the closest vessels (minimal length ± 10%), that is, the closest index units. Because a unit can be irrigated by more than one vessel, a CBF per unit (CBFu) has been defined. This CBFu is the mean of blood flows of the vessels, which irrigate the unit. The indicant i denotes the vessels, and n is the number of vessels irrigating this typical unit:
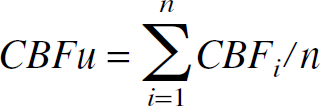
CBFu could be compared with the CBF measured with the PET scan representing the CBF per unit of tissue.
Parameter distributions and initial values.
At time 0, all the units are supposed to be in a “physiological” state, that is, their parameter initial values (Table 3) are based on the literature values. CBF is set at either 50 mL · 100 g−1 · min−1 (the minimal value for “normal” in literature) or 80 mL · 100 g−1 · min−1.
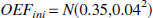
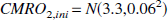
The mean values of the initial value of OEF (OEFini) and CMRo2 (CMRo2 ini) are also based on literature values. A Gaussian distribution N(m, σ2) around those mean values is assumed in order to represent the inter-individual variability.
Finally, it is assumed that no edema exists before stroke occurs, so initial ADCw, defined in comparison with the contralateral hemisphere, is set to 1.
To simulate stroke, time has to be taken into account in the model. Time is integrated as a discontinuous value from 0 to 360 minutes (the usual time window for inclusion in clinical studies of stroke). During this period, all parameters of the model are estimated every minute. This time window and the increment can be modified.
Evolution over time.
The decrease of the CBF of one vessel is defined by a sigmoid relation. No evidence supports this choice, only convenience. It allows simulation of a large variety of blood flow decays over time with the same equation, by controlling the sigmoid coefficient (SC), the time to half blood flow (T50), or the minimal value (M).
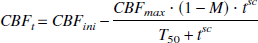
In the reported simulations, the initial value of CBF (CBFini) is supposed to be equal to the maximal value of CBF (CBFmax). This equation is applied for one vessel every minute, and a CBFut is then determined for each unit of the model at each time step. CBF is the key time-dependent parameter of the model, the remaining parameters all being linked to it (Fig. 2) thus indirectly to the time step from the equation:

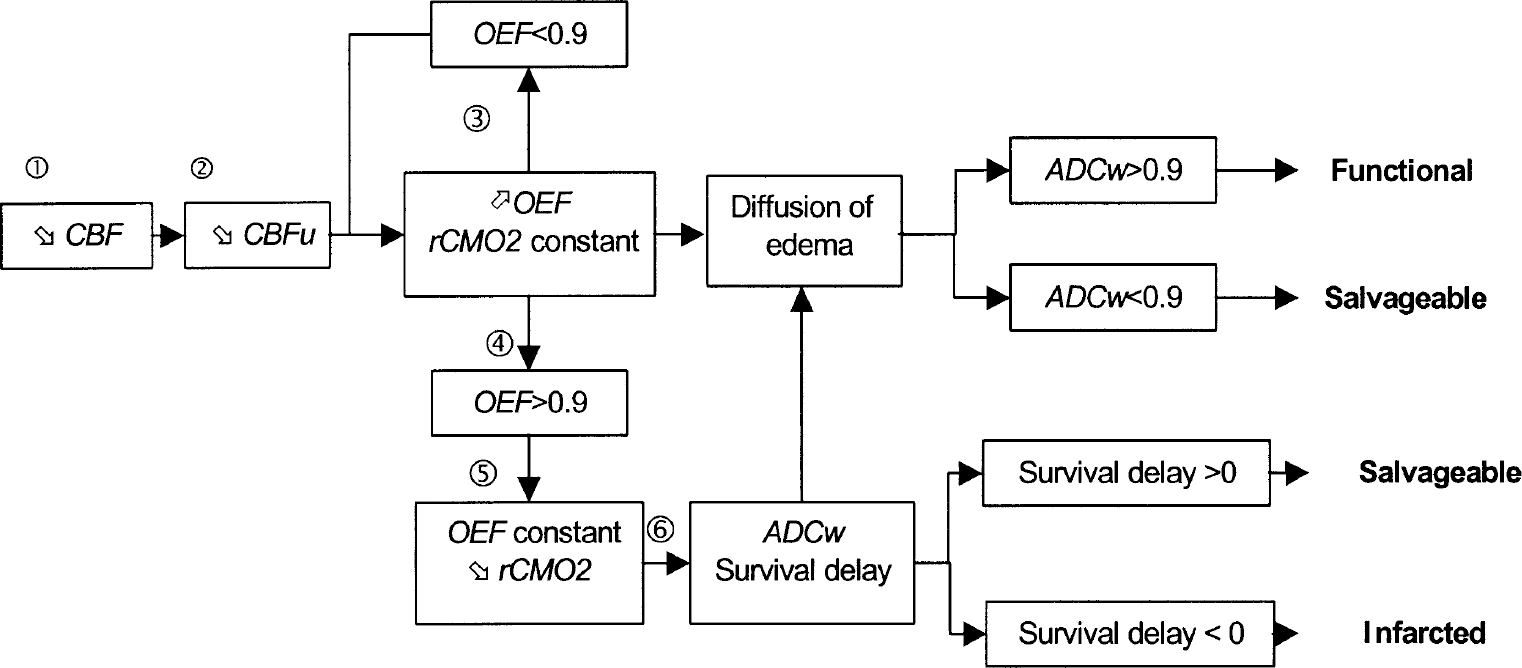
Different steps of the model, from the decrease of the cerebral flow to the state at the evaluation time (360 min in the experiment). (1) The CBF of the vessel concerned with stroke is decreased in accordance with Eq. 4. (2) A CBFu is calculated for each “unit” of the model (Eq. 1). (3) Using the initial value of CMRo2, OEF is increased as in Eq. 5 to maintain the proportionality between CMRo2 and CBFu. (4) When OEF has reached its maximum, then CMRo2 is decreased, with OEF fixed as its last value (Eq. 5). (5) A survival delay is calculated for each “unit” with a decreased CMRo2 (Eq. 9) as well as an ADCw value (Eq. 6). (6) Diffusion of edema is modeled by calculating the mean of ADCw for adjacent “units” (Eq. 8).
a is supposed constant over time and is estimated based on the initial parameters. This relation is based on the study of Senda et al. (1989) and on a published oxygen-delivery model (Hyder et al., 1998).
When CBFu decreases, OEF first increases, because it is assumed that CMRo2 is regulated at its initial value by an increase in OEF. OEF reaches a maximum value, set at 90%. Once OEF maximal value is reached, a decrease of CMRo2 follows.
Edema is estimated according to the value of ADCw. An early decrease of ADCw is typically mentioned in stroke. Furthermore, van Everdingen et al. (1998) concluded that ADCw values less than 0.62 were correlated with poor outcomes. A relation thus has been defined between ADCw and CMRo2, linking the decrease of ADCw with ischemia.
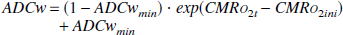
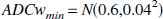
This relation between ADCw and CMRo2 was defined based on the shape during the first hours of the time course of individual ADCw as measured by Schwamm et al. (1998). ADCwmin, the minimum value for ADCw, is assumed to follow a Gaussian distribution around the mean of 0.6, because the mean ADCwmin measured in this specific study was 0.65.
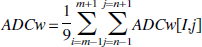
The diffusion of edema to the units surrounding the impaired unit is represented by the mean of ADCw across the 8 adjacent units and the ADCw reduced unit.
Survival delay is the last parameter for each of the units. Studies with monkeys have shown that, for a blood flow between 8 and 12 mL · 100 g−1 · min−1, infarction occurs within a two- to three-hour interval (Jones et al., 1981). Based on this observation, a survival delay was defined: the time it takes for the unit to die once its metabolism starts to be impaired. This survival delay is calculated each time the parameters are estimated. At time 0, it is assumed to be infinite; it starts to decrease when CMRo2 decreases. Part of the salvageable units can be defined as, units for which death is delayed.
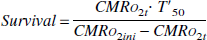
T′50 is the survival delay for CMRo2 = 0.5.CMRo2ini. CMRo2ini is the initial value for CMRo2. CMRo2t is the CMRo2 value at time t.
Outcome.
The outcome is defined as the status of each unit at the end of the observation period. Each unit can be in one of the three following states at any time: functional (F), salvageable (S) or infarcted (I), according to the value of its parameters and its own survival delay.
If the unit's survival delay has passed, the unit becomes infarcted (I). For some of the units with a decreased CMRo2, however, the point of survival delay may not have been reached at the time the evaluation occurs. These units are considered as part of S (not F), because metabolic impairment is assumed to have occurred. Also grouped under S are those units with no initial metabolic impairment. Owing to the closeness of the core, these units are altered because of the diffusion of the edema. They thus have a normal CMRo2, with a decreased ADCw (less than 0.9). The last category of units is F, those that can have an increased OEF, but with physiological CMRo2 and ADCw at the end of the observation period (Fig. 2).
Outcome of each run of simulation is presented as three percentages (i.e., percentage of F, of S, and of I, computed at t = 360 minutes).
Stroke simulations
Explored parameters.
In order to evaluate the response of the model to changes, different values are investigated. For this “first step,” we are interested in the influence of the shape of the CBF decrease and the survival delay on the outcome of the model. Consequently, different values are used for T′50 and SC. Change in T′50 would change the survival delay of unit consequently to a decrease of CMRo2, SC changes the slope of the CBF decrease. These parameters are fixed in a series for all strokes simulations (Table 2). A T′50 of 120 minutes means that a unit with a CMRo2 decreased by half has a survival delay of 120 minutes. If metabolism increases in this period, the unit will survive, otherwise it will die.
Parameters of specific fixed simulations
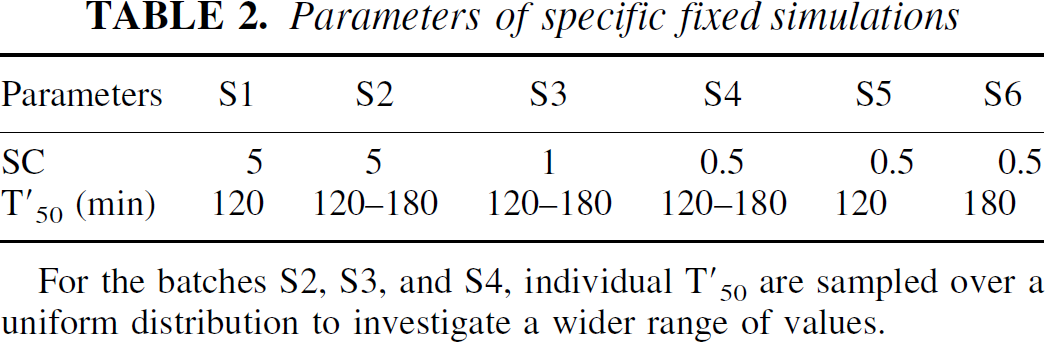
For the batches S2, S3, and S4, individual T′50 are sampled over a uniform distribution to investigate a wider range of values.
Distribution of initial parameters for a stroke simulation
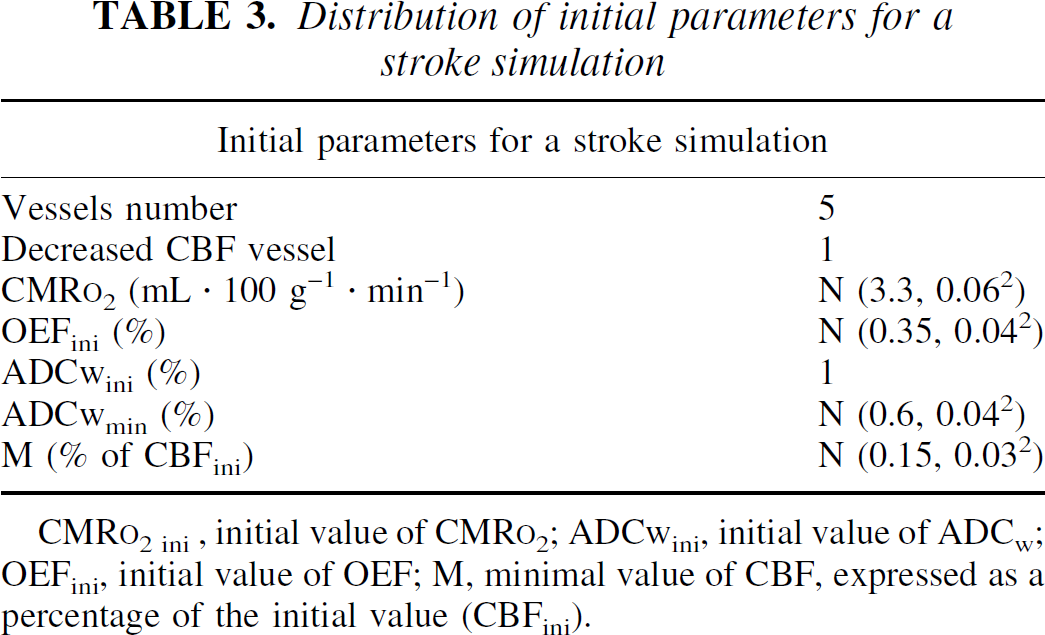
CMR
Runs.
Each batch of simulation involves a series of 50 simulated stroke episodes. For each stroke, initial parameters are independently defined; tested values, however, are the same for all the 50 strokes in a same batch. Six batches have been performed to investigate the sensitivity of the model to changes in the slope decrease of the CBF and/or to survival delay (Table 2).
Initial values of other parameters.
The rest of the parameters are initially defined for each case (stroke), and values are chosen on the same populations of values, which are identical for all simulations (Table 3).
Simulations' results analysis.
Simulations are analyzed by evaluating units parameters of the 50 strokes at 360 minutes. A quantitative analysis is first performed to evaluate the mean number of units for each status (F, S, and I). Parameters of penumbra are then investigated to identify whether the penumbra is due to a metabolic impairment or to the diffusion of the edema.
RESULTS
Distributions of the unit status are presented on Table 4; the unit parameter distributions at 360 minutes are shown in Fig. 3 for S units only. These data allow us to explore the internal validity of the model in the following way: (1) The percentage of I units increases when the initial values of the explored parameters worsen. The faster the CBF decreases, the greater the number of ischemic cells (S1 and S2). At this stage of stroke, survival delay does not have much influence, the number of ischemic cells being the same despite the increase of the survival delay. The unit parameter values are more impaired in I units than in S units, with lower CBFu, ADCw and CMRo2 (Table 5). A functional unit has a maximal value of blood flow, a low OEF, with no edema (ADCw > 0.9). (2) The percentage of I units decreases with the decrease of the sigmoidal coefficient; the slower the decrease of flow, the less the number of infarcted units for a same T′50 (series 2, 3, and 4). (3) The percentage of I units decreases when the survival half-life increases for a fixed flow, with 4 ischemic cells for S5 and 0 for S6.
Percentage of units in each of the different states (infarcted, salvageable, and functional) after 50 stroke simulations at the evaluation time of 360 minutes
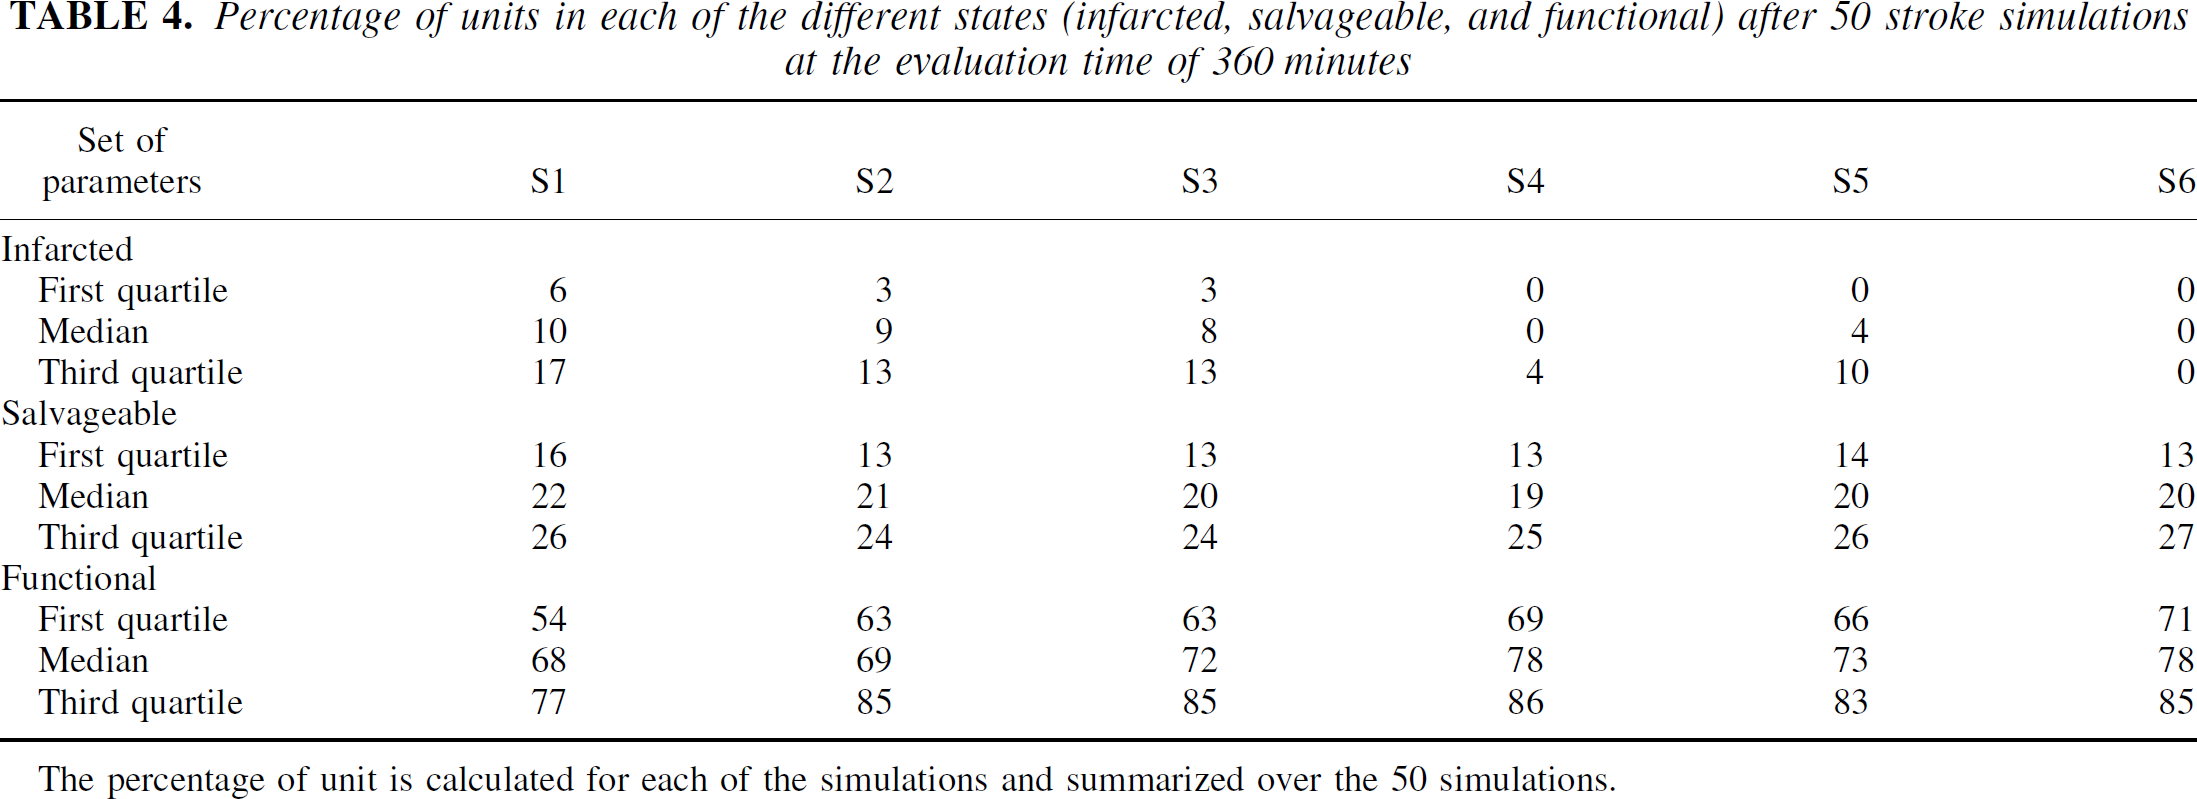
The percentage of unit is calculated for each of the simulations and summarized over the 50 simulations.
Parameters for each of the areas concerned with the ischemic stroke, 6 hours after the onset, for batches S4 and S6
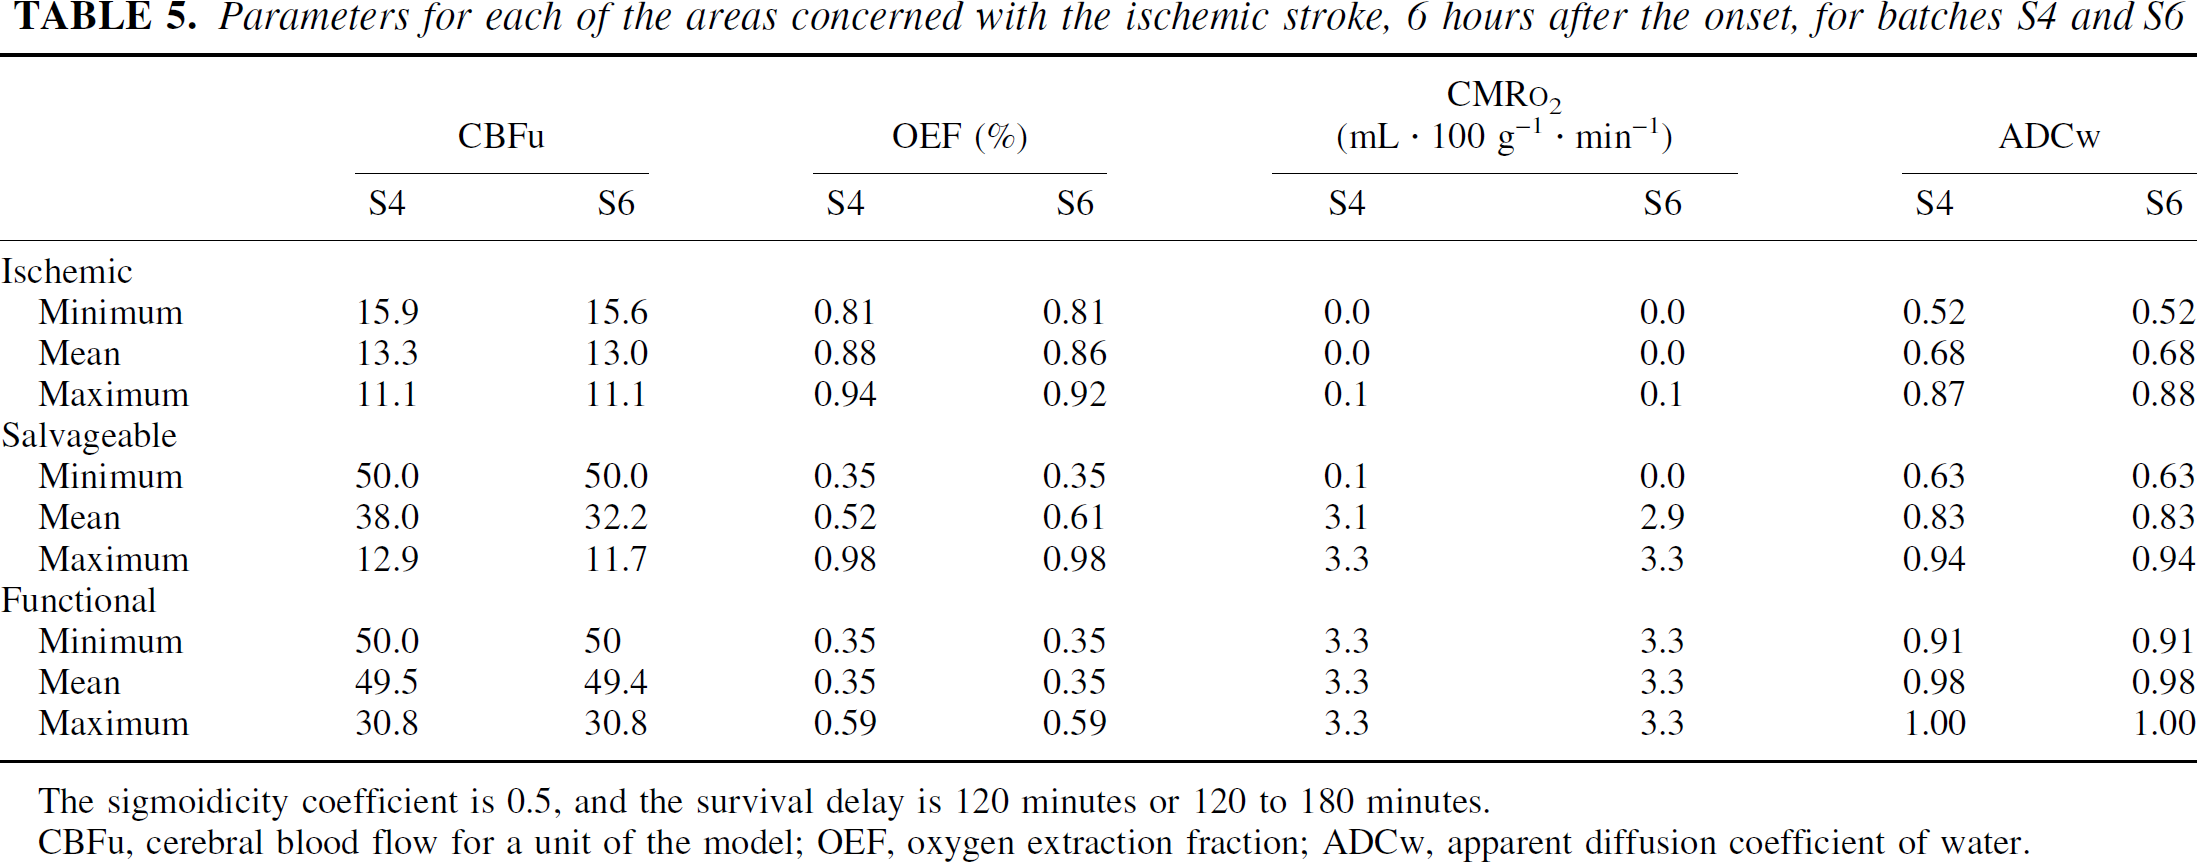
The sigmoidicity coefficient is 0.5, and the survival delay is 120 minutes or 120 to 180 minutes.
CBFu, cerebral blood flow for a unit of the model; OEF, oxygen extraction fraction; ADCw, apparent diffusion coefficient of water.
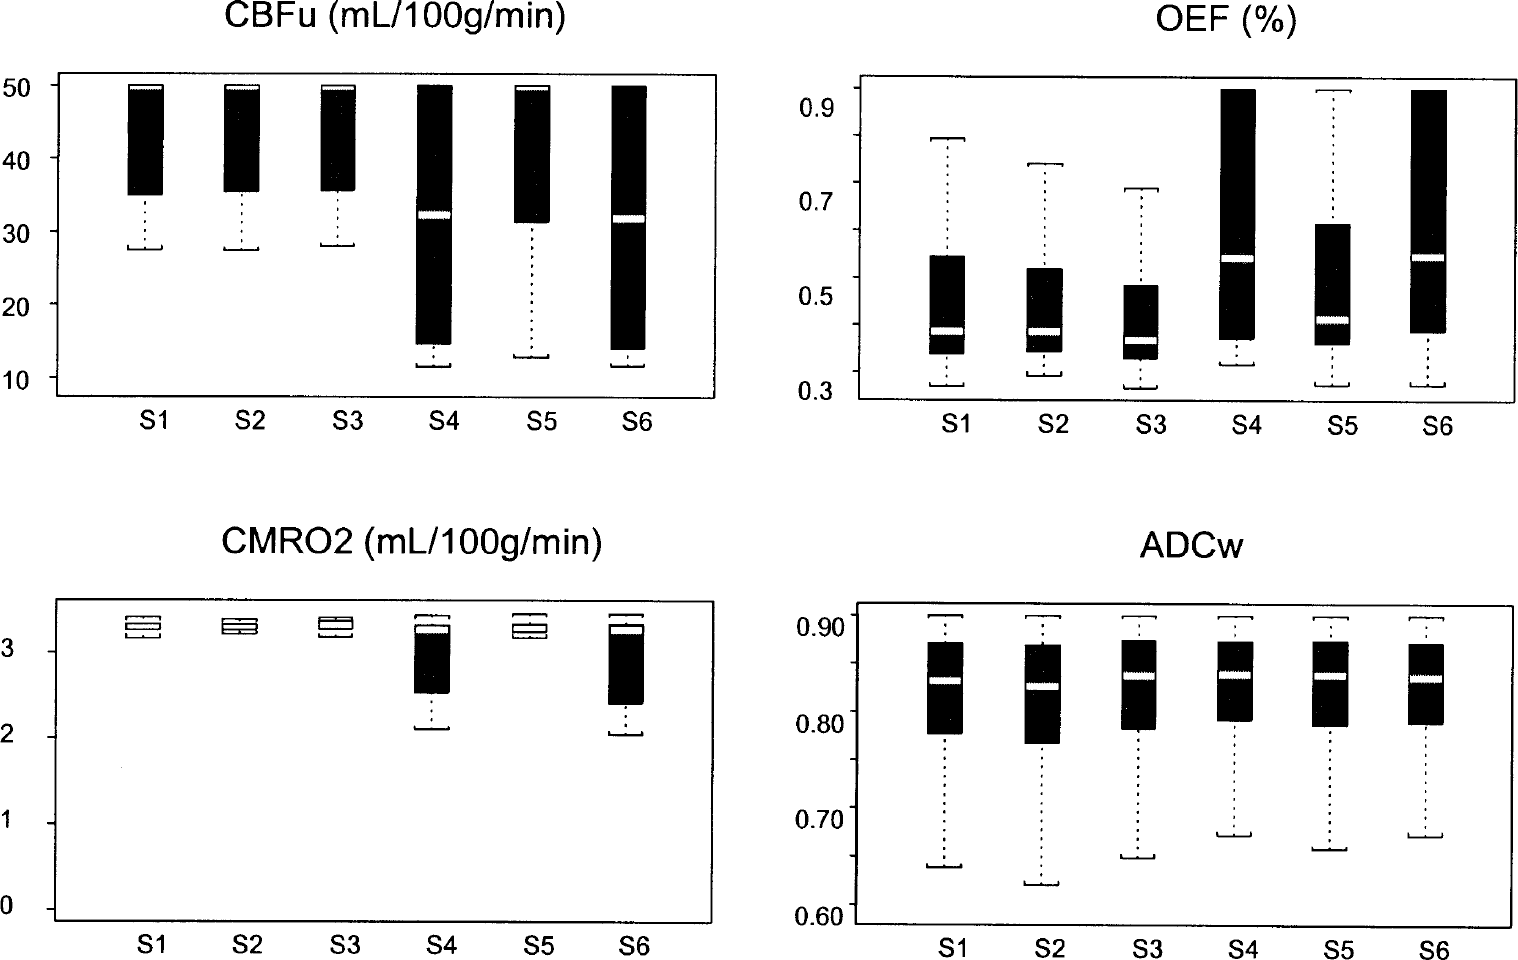
Box plots of salvageable units parameters; they represent repartition of values around means of parameters. S1 to S6 denote the 6 different sets of parameter initial values used for the simulations (see text and Table 2).
Other findings shown in Table 4 and Fig. 3 suggest the potential of the model for improving our understanding of mechanisms of acute stroke: (1) The percentages of units in the penumbra were similar through most of the different series of simulations. (2) Throughout the various simulations (i.e., the series with little variability in parameters and the ones with a greater variability on CBFu, OEF, CMRo2 [series 4 and 6]), two types of units compose the penumbra: (a) Units which are not on the way to necrosis; they are in the penumbra area because of the diffusion of cytotoxic edema (decreased ADCw). This is suggested by the 0.35 OEF value, which assumes a normal CBF for those units that are thus impaired by the diffusion of the ADCw. (b) Units with a decreased CBFu, an increased OEF, and a decreased CMRo2, which implies that these units would die, given a longer observation period. The influence of metabolism in the penumbra in these units is greater, and they are unable to maintain a basic metabolism. These two types of salvageable tissue can be seen with the increase of the variabilities of CBFu and OEF in S4 and S6 (Fig. 3).
DISCUSSION
Aims of this model
Our model represents the phenomena that occur during the early phase of acute ischemic stroke by describing the main steps of the stroke, to get a better understanding of the mechanisms and to be able to simulate interaction with drugs. To some extent, it could be related to the model of Wu et al. (2001) that predicted the outcome of tissues on a voxel-by-voxel basis. Their approach—more practical, based on logistic regressions founded on MRI parameters (rT2, rADC, rDWI, rCBF, rCBV and MTT)—demonstrates the interest of combining information in a single model to predict outcome. Our approach—more theoretical—is based on the interactions between the different parameters involved in a stroke episode, in order to predict the outcome of each area concerned with the stroke episode on a voxel-by-voxel basis.
The results of the reported simulations show a qualitative consistency between the model outcomes and the expected evolution of the brain damages given the initial setting. Such a consistency, although it cannot be viewed as a full validation of the model, suggests that there is no major flaw in the model's design and implementation. This internal validation is also supported by the comparison with the parameters of the salvageable tissue already published (Grandin et al., 2001;Jacob et al., 2001;Rohl et al., 2001). The preliminary results of the model (CBF ratio: 0.76; ADCw: 0.83) are in the same range as those reported by Rohl et al. (2001), who determined CBF ratios of 0.42 and 0.62 and ADC ratios of 0.89 and 0.93 for the penumbra area. Based on available data, future tuning of the model components and their relations would allow the mimicking of human strokes.
Survival delay and other parameters
The unit survival delay is central to this model. This point can be argued, because its definition is not related to human study, but is based on the extrapolation of data from a monkey study (Jones et al., 1981). Nevertheless, refinement of this parameter might allow the model to handle phenomena such as apoptosis. Use of the survival delay parameter makes it possible to integrate all the parameters involved in a stroke episode. With it, the state of the different units would be defined not as a dichotomous variable but through a continuous variable over time, and the infarcted area would be defined as a penumbra area undergoing rapid impairment. We computed the survival delay through the CMRo2; another study would possibly integrate ADCw into its definition. Given our experimental goal—evaluating the acute stage of stroke—inclusion of ADCw in the survival delay would not have a major impact on the outcome of the model. But in those units that are also affected by phenomena, such as inflammation, which could lead to delayed cell death, inclusion of ADCw in the definition of the survival delay would be necessary in order to describe this delayed cell death. CBF, an MRI parameter, is usually included in the markers for prediction of the outcome of stroke. Nevertheless, it is not included in our survival delay computation, because we acknowledge that CMRo2 is more directly related to metabolic damages than CBF values when it comes to predicting the states of the different pixels (Marchal et al., 1999). The major problem of this more realistic relation between CMRo2 and metabolism is the lack of accessibility to PET data, related to the few PET scans available.
The parameters featuring the units are based on DWI MRI (ADCw) and PET (CBF, CMRo2, OEF) parameters. Spectroscopy parameters such as N-acetyl-aspartate and lactate could be added to the model. On one hand, addition of such parameters could provide a better definition of the different areas; on the other, they could be redundant in defining the state of a single unit, because they are closely related to the metabolic status. They could, however, be of interest in developing the relation between the core and the penumbra.
In the model, OEF is not strictly involved in the outcome of the units, it merely delays the decrease of CMRo2 after a decrease of CBF, as it does physiologically. CMRo2 is the main parameter in our model because it drives ADCw value and survival delay.
The penumbra is subject to many phenomena, some of which are not taken into account in our definition of salvageable area. Available data support the fact that the penumbra is influenced by a slighter decrease of CBF than the core, by depolarization trains from the core, and by inflammation, which finally leads to unit death through necrosis or apoptosis (Dirnagl et al., 1999;Lee et al., 1999;Nicotera et al., 1999). None of these factors but edema are taken into account in our definition of the salvageable area because the model is thus far mainly concerned with the early phase of stroke (evaluation of the outcome of the model was performed 6 hours after the onset of the stroke). In the early phase of stroke excito-toxicity, induced by an impaired metabolism related to the sudden decrease of CBF, is the major part of the phenomena; inflammation and apoptosis will appear later (Dirnagl et al., 1999;Lee et al., 1999;Nicotera et al., 1999). Nevertheless, at a later point in the research, if the outcomes of this model are to stand comparison with clinical outcomes, then apoptosis and inflammation should be made components of unit status, as should neuronal plasticity.
Importance of edema phenomenon in penumbra
The penumbra is usually defined as follow: OEF increases up to 100% (Baron, 1999), CMRo2 decreases up to 1.4 times normal (Marchal et al., 1996), and CBF decreases up to 50% (Heiss et al., 1998), a definition consistent with the results of the model.
Regarding the results of the model, edema appears to play a major role in the definition of penumbra whether the origin is thoroughly metabolic or not. Despite the fact that our result are compatible with the theory of Belayev et al. (1998), who assume an important role for edema by suggesting the efficacy of albumin in reducing ischemic volume, our definition of the edema is not standard, and what is called “diffusion of the edema” in the model, represented by a decreased of the ADCw in the area surrounding the core, is more a parameter that summarizes the aggression of the salvageable tissue by the core in the first hours after an ischemic stroke.
Potential for exploration of stroke mechanism and therapeutic
Although our simulations are not aimed at exploring the potential of the model for exploring physiopathology of stroke, the results give clues that it could be done. We sorted out two types of penumbra units at the end of the observation period, as in Rohl et al. (2001): the penumbra units with an altered metabolism, which could be considered as ischemic-oriented units, and the units with cytotoxic edema, assumed to keep the potential for recovery. The former could be viewed as part of the core; the latter might be supposed to face depolarization phenomena and inflammatory factors from the core (which could drive them to death later), but they could also be therapeutic targets.
CONCLUSIONS
Despite these encouraging preliminary results, the model suffers from a lack of sensitivity to parameter changes: S4 and S6 give similar results despite different initial conditions. This model does not yet represent reality; the relations between the core and the penumbra need to be refined and completed, based on additional experimental data. Nevertheless, the model is able to summarize the information obtained with different investigative imaging techniques. It also links the different established parameters in a more comprehensive understanding of the mechanisms involved in the penumbra, which is the target of drug therapy today. Furthermore, the different parts of the model can be easily correlated to the efficacy of the drug therapy in acute ischemic stroke. It could be possible to simulate thrombolysis through an increase of CBF, and the activity of a neuroprotective drug could be related to an increase of CMRo2 or T′50 as they seek to protect the penumbra from the excito-toxicity due to this decrease in the metabolism; both therapeutic approaches would influence the survival delay of the units. To achieve trial simulation in acute ischemic stroke, this model needs to be validated and related to any reliable clinical end point. The external validation of such a model could conceivably be done by taking results obtained from functional imaging techniques (or outcome of other published models) and using them as parameters in the model. The present model needs further development, with the integration of, for instance, inflammatory phenomena and apoptosis in unit death phenomena by use of ADCw. Owing to the structural choices we made, the model is flexible: molecular levels of components can easily be added, if necessary, as could other components not yet integrated into it. Nevertheless, as it stands, the model challenges the published parameters of the penumbra and could provide help in clinical drug development in the near future.