
Abstract
Cerebral blood flow (CBF) can be quantified noninvasively using the brain perfusion index (BPI), determined from radionuclide angiographic data generated with technetium-99m hexamethylpropylene amine oxime (99mTc-HMPAO). Previously, the BPI has been calculated using graphical analysis (GA); however, the GA method is greatly affected by the first-pass extraction fraction and retention fraction, which are not only variable, but lower in cases with an increased CBF, such as after the administration of acetazolamide. Thus, GA-calculated BPI values (BPIG) may not reflect the absolute CBF. The objective of this study was to use the spectral analysis of radionuclide angiographic data collected using 99mTc-HMPAO to examine changes in the BPI after the administration of acetazolamide. We studied the CBF of both cerebral hemispheres in six healthy male volunteers; the BPI was measured at rest and after the intravenous administration of 1 g of acetazolamide. In all participants, an H215O positron emission tomography (PET) examination was also performed, and the spectral analysis—calculated BPI values (BPIS) and BPIG values were compared with the actual CBF measured using H215O PET (mCBFPET). The BPIS was 1.070 ± 0.051 (mean ± SD) at rest and 1.497 ± 0.098 after acetazolamide; the corresponding BPIG values were 0.646 ± 0.073 and 0.721 ± 0.107. The BPIS values were significantly correlated with the mCBFPET values, whereas the BPIG values were not. According to the BPIS values, the increase in BPI after the intravenous administration of acetazolamide was 40.1 ± 8.4%, as opposed to an increase of only 11.3 ± 6.5% according to the BPIG values. These results suggest that the spectral analysis of 99mTc-HMPAO—generated data yields a more reliable BPI than GA for the quantification of CBF after acetazolamide administration.
Keywords
Several reviews have indicated that the quantitation of cerebral blood flow (CBF) is very important for patient management, especially in patients with cerebrovascular disease (Baron, 2001; Marchal et al., 1999; Hellman and Tikofsky, 1990). Vascular reactivity in the brain after the administration of acetazolamide can have a major impact on the prognosis and therapeutic planning of a case, especially in patients in whom a major artery has been occluded (Kuroda et al., 2001; Vernieri et al., 1999).
Matsuda et al. (1992) developed a simple noninvasive method for quantifying brain perfusion using technetium-99m hexamethylpropylene amine oxime (99mTc-HMPAO) or technetium-99m ethyl cysteinate dimer (99mTc-ECD) (Matsuda et al., 1995). They calculated the brain perfusion index (BPI) by graphical analysis (GA) of the radionuclide angiographic data (Matsuda et al., 1992, 1995) and obtained a significant regression equation for the relationship between BPI and CBF, as measured by xenon-133 inhalation and single photon emission computed tomography (SPECT) (Matsuda et al., 1992). Regional CBF maps were then acquired using the calculated BPI values and Lassen's linearization correction algorithm (Lassen et al., 1988).
However, since the BPI obtained by GA (BPIG) is derived from the slope of Gjedde-Patlak plot (Matsuda et al., 1992, 1995), which is proportional to the product of the first-pass extraction fraction of the tracer, retention fraction [k3/(k2+k3); k2, back diffusion rate constant; k3, lipophilic-to-hydrophilic conversion rate constant] and CBF, it does not accurately reflect CBF. The reason for this is that BPIG is dependent upon the first-pass extraction fraction and retention fraction of the tracer, which generally change according to the CBF. Accordingly, a method for accurately estimating the BPI that is unaffected by the first-pass extraction fraction and retention fraction is needed.
Spectral analysis (SA) was introduced by Cunningham and Jones (1993) to analyze dynamic positron emission tomography (PET) data; this technique provides a spectrum of kinetic components involved in the regional uptake and partitioning of a tracer from blood to tissues and allows a tissue impulse response function to be derived with minimal modeling assumptions (Cunningham and Jones, 1993). Murase et al. (1999) were the first to apply the SA method to dynamic SPECT data acquired with 99mTc-HMPAO and 99mTc-ECD, and they emphasized the usefulness of this method, especially in cases where the CBF was elevated.
Acetazolamide is generally used to study the cerebrovascular response and/or to detect areas of misery perfusion (Baron et al., 1981; Hirano et al., 1994). Since CBF studies with 99mTc-labeled compounds may not reflect the absolute CBF after acetazolamide administration, CBF measurements obtained using 99mTc-labeled compounds must be corrected after acetazolamide administration. However, there have been no precise reports investigating the changes in the BPI after the intravenous administration of acetazolamide.
The objective of this study was to investigate the degree of increase in both BPIS and BPIG values after the intravenous administration of acetazolamide. We also performed H215O PET examinations at rest and after the intravenous administration of acetazolamide to compare both the SA-calculated BPI values (BPIS) and BPIG values with the absolute CBF measured using H215O PET.
MATERIALS AND METHODS
Theory
Spectral analysis.
With SA (Murase et al., 1999), the level of 99mTc-HMPAO radioactivity in the brain at a given time t [CS (t)] was modeled as a convolution of the blood input function [Ca (t)] with a sum of exponential terms, as shown by the following equation:
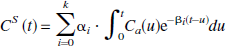
where αi and βi were constants and assumed to be positive or zero. Since CS (t) and Ca (t) usually have the same unit (e.g., Ci/mL), αi has a unit of the reciprocal of time (e.g., min−1). βi also has a unit of the reciprocal of time (e.g., min−1). The upper limit, k, represents the maximum number of terms to be included in the model and was set at 1,000. The αi values were determined from Eq. 1 using the level of brain radioactivity measured by radionuclide angiography and the nonnegative least-squares method for βi, ranging from 0 to 2 min−1 with an increment of 0.002 min−1. In the present study, the amount of radioactivity in the aortic arch was taken as in Eq. 1 to maximize the noninvasiveness of the procedure without the need for blood sampling. When Ca (t) was replaced by Dirac's delta function in Eq. 1, the tissue impulse response function [IRFS (t)] was given by the following equation [see Appendix 1).]:
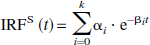
The BPIS was calculated from the IRFS (0) as follows:

where BPIS is expressed in units of min−1.
Graphical analysis
The BPIG was calculated as follows (Matsuda et al., 1992):
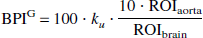
where ROIaorta and ROIbrain represent the size of the aortic arch and cerebral hemisphere regions of interest (ROIs), respectively, and where ku is the unidirectional influx rate of the tracer from the blood to the brain, determined by the slope of the line in the GA within the first 30 seconds after injection (Matsuda et al., 1992). To compare BPIG with BPIS, we multiplied the result of Eq. 4 by 0.06 so that the BPIG and the BPIS would be expressed in the same units (min−1).
Subjects
Six healthy male volunteers (22 to 27 years old) participated in this study. Informed consent was obtained from each participant after a detailed explanation of the purpose of the study, the risks of irradiation, and the scanning procedures. The study was approved by the Medical Ethics Committee of Osaka University Graduate School of Medicine.
Measurement of brain perfusion index using 99mTc-HMPAO
For the radionuclide angiography, a bolus of 370 MBq 99mTc-HMPAO was intravenously injected and sequential imaging was performed while the subject was in a supine position with the front of his body positioned against the gamma camera (RC-2600i; Hitachi Medical Co., Tokyo, Japan) to ensure that both the brain and the heart were within the field of view. The passage of the tracer from the aortic arch to the brain was monitored using a 128 × 128 matrix, and a total of 100 1-second images were obtained using low-energy high-resolution collimators (Matsuda et al., 1992).
To calculate the BPIS, the raw planar dynamic data were transferred to a workstation (Indigo 2; Silicon Graphics, Mountain View, CA, U.S.A.). ROIs were hand-drawn over the left and right cerebral hemispheres and the aortic arch using the workstation and a software package (Dr. View; Asahi Kasei Joho System Co., Ltd., Tokyo, Japan), as described by Matsuda et al. (1992) (Fig. 1). The BPIS calculations for the ROIs were performed on the workstation using a software package for BPI analysis developed by Murase (1999).
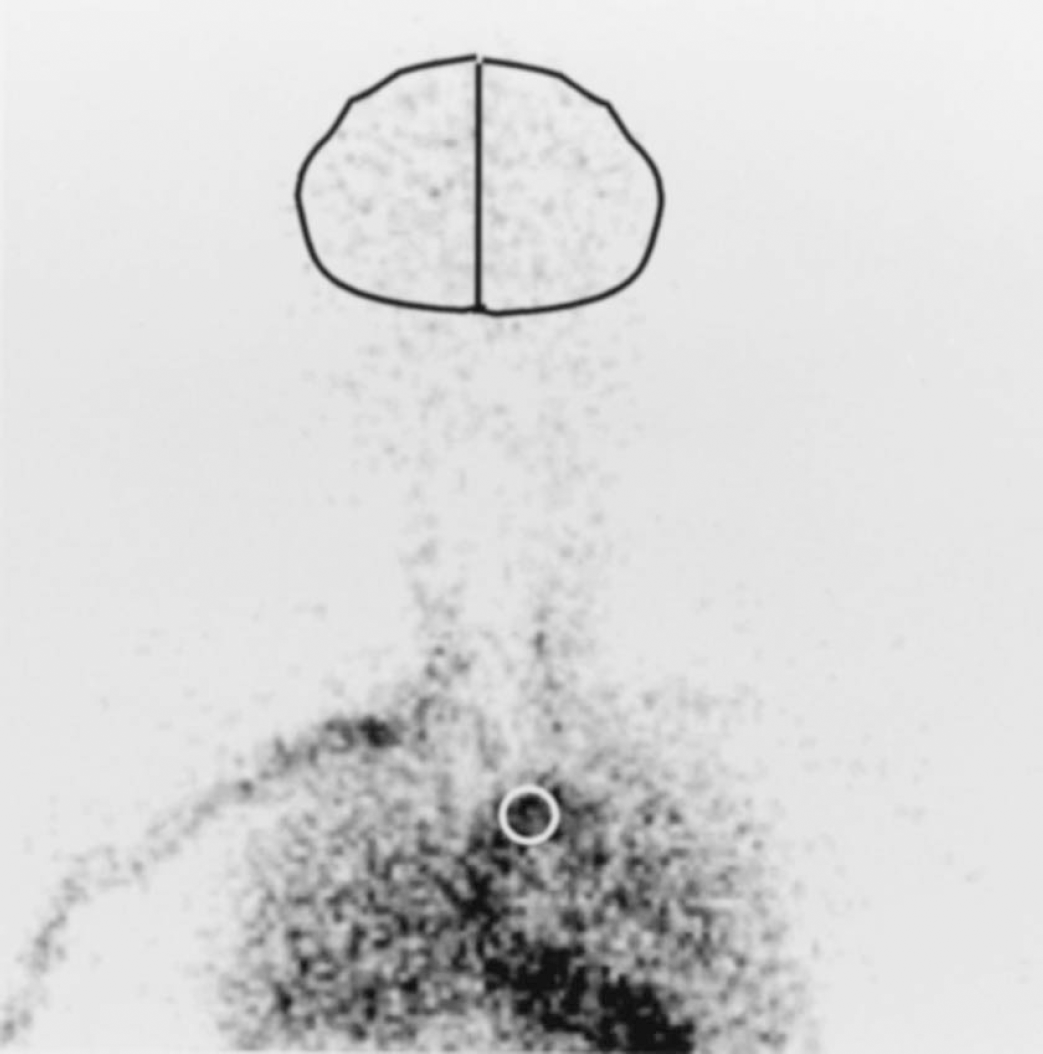
Example of regions of interest for radionuclide angiographic data obtained using technetium-99m hexamethylpropylene amine oxime.
To measure BPIG, the raw planar dynamic data were transferred to a Hitachi workstation (RW-3000; Hitachi Medical Co.), and the BPIG calculations were performed using a software package for Patlak plot analysis (RW-3000; Hitachi Medical Co.) with no filter, as described previously by Matsuda et al. (1992).
Acetazolamide challenges
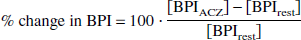
We measured the BPI at rest [BPIrest] and after acetazolamide administration [BPIACZ] in all six healthy volunteers. Seven days after the measurement of BPIrest, BPIACZ was measured 10 minutes after the injection of 1 g of acetazolamide. The rate of BPI increase (% change in BPI) was defined as follows:
Measurement of absolute cerebral blood flow using H215O positron emission tomography
Positron emission tomography data acquisition.
BPI and CBF measured using H215O PET were compared among healthy volunteers. The 99mTc-HMPAO SPECT at rest and H215O PET examinations were performed on the same day.
The PET examination was performed using a Headtome V scanner (Shimadzu Corp., Kyoto, Japan) with a spatial resolution of 4.0 mm at full width at half maximum. The subjects were placed in a supine position on a bed in a semidark room and were asked to close their eyes. For the attenuation correction, a transmission scan with a germanium-68/gallium-68 line source was obtained for each patient. The patients received a 36-second intravenous bolus injection of 1,110 MBq H215O at a flow rate of 30 mL/min through a cannula placed in the antecubital vein. Data were acquired over a scanning period of 160 seconds using a 128 × 128 matrix.
Regional CBF was measured using the H215O bolus injection (autoradiographic) method (Huang, 1983) while the participants were in a resting state or 10 minutes after the injection of acetazolamide. To evaluate the input function, continuous arterial blood sampling with a catheter needle inserted in the radial artery was performed for 5 minutes at a speed of 5 mL/min, and the 15O radioactivity was concurrently measured using a beta-detector (Shimadzu Corp.).
The transaxial images were reconstructed by the ordered subsets expectation maximization method (Llacer et al., 1993); the final slice thickness was 3.1 mm.
Data analysis of cerebral blood flow measured by H215O positron emission tomography.
The PET data were transferred to a Silicon Graphics workstation. ROIs for the mean CBF measured using H215O PET (mCBFPET) were drawn over the whole left and right cerebral hemispheres of the transaxial image using the “Dr. View” software package (Asahi Kasei Joho System Co., Ltd.) (Nariai et al., 1998). mCBFPET (mL · 100 g−1 min−1) was calculated as the mean CBF of five slices, ranging from the basal ganglia level to the upper parietal lobe level.
Statistical analysis
The correlations between BPIS and BPIG values and between the BPI and mCBFPET values were assessed by linear regression analysis. The degree of increase in the BPI and mCBFPET values after acetazolamide injection was compared using the Wilcoxon signed rank test. A P value of less than 0.05 was considered significant.
RESULTS
We studied the BPI at rest and 10 minutes after the intravenous administration of 1 g of acetazolamide in six volunteers. The BPIS was 1.070 ± 0.051 (mean ± SD) at rest and 1.497 ± 0.098 after the administration of acetazolamide; the corresponding BPIG values were 0.646 ± 0.073 and 0.751 ± 0.107, respectively. The correlations between BPIS and BPIG in all studies were not statistically significant (r = 0.285, P = 0.180), with a regression equation of y = 0.120x + 0.530.
The BPI and mCBFPET values are compared in Fig. 2, which shows the relationship between the BPIS (Fig. 2A) and BPIG values (Fig. 2B) obtained using 99mTc-HMPAO and the mCBFPET values. Although the BPIG and mCBFPET values were not significantly correlated (r = 0.287), the BPIS and mCBFPET values were significantly correlated (r = 0.940); the regression equation for this relationship was y = 0.017x + 0.364.
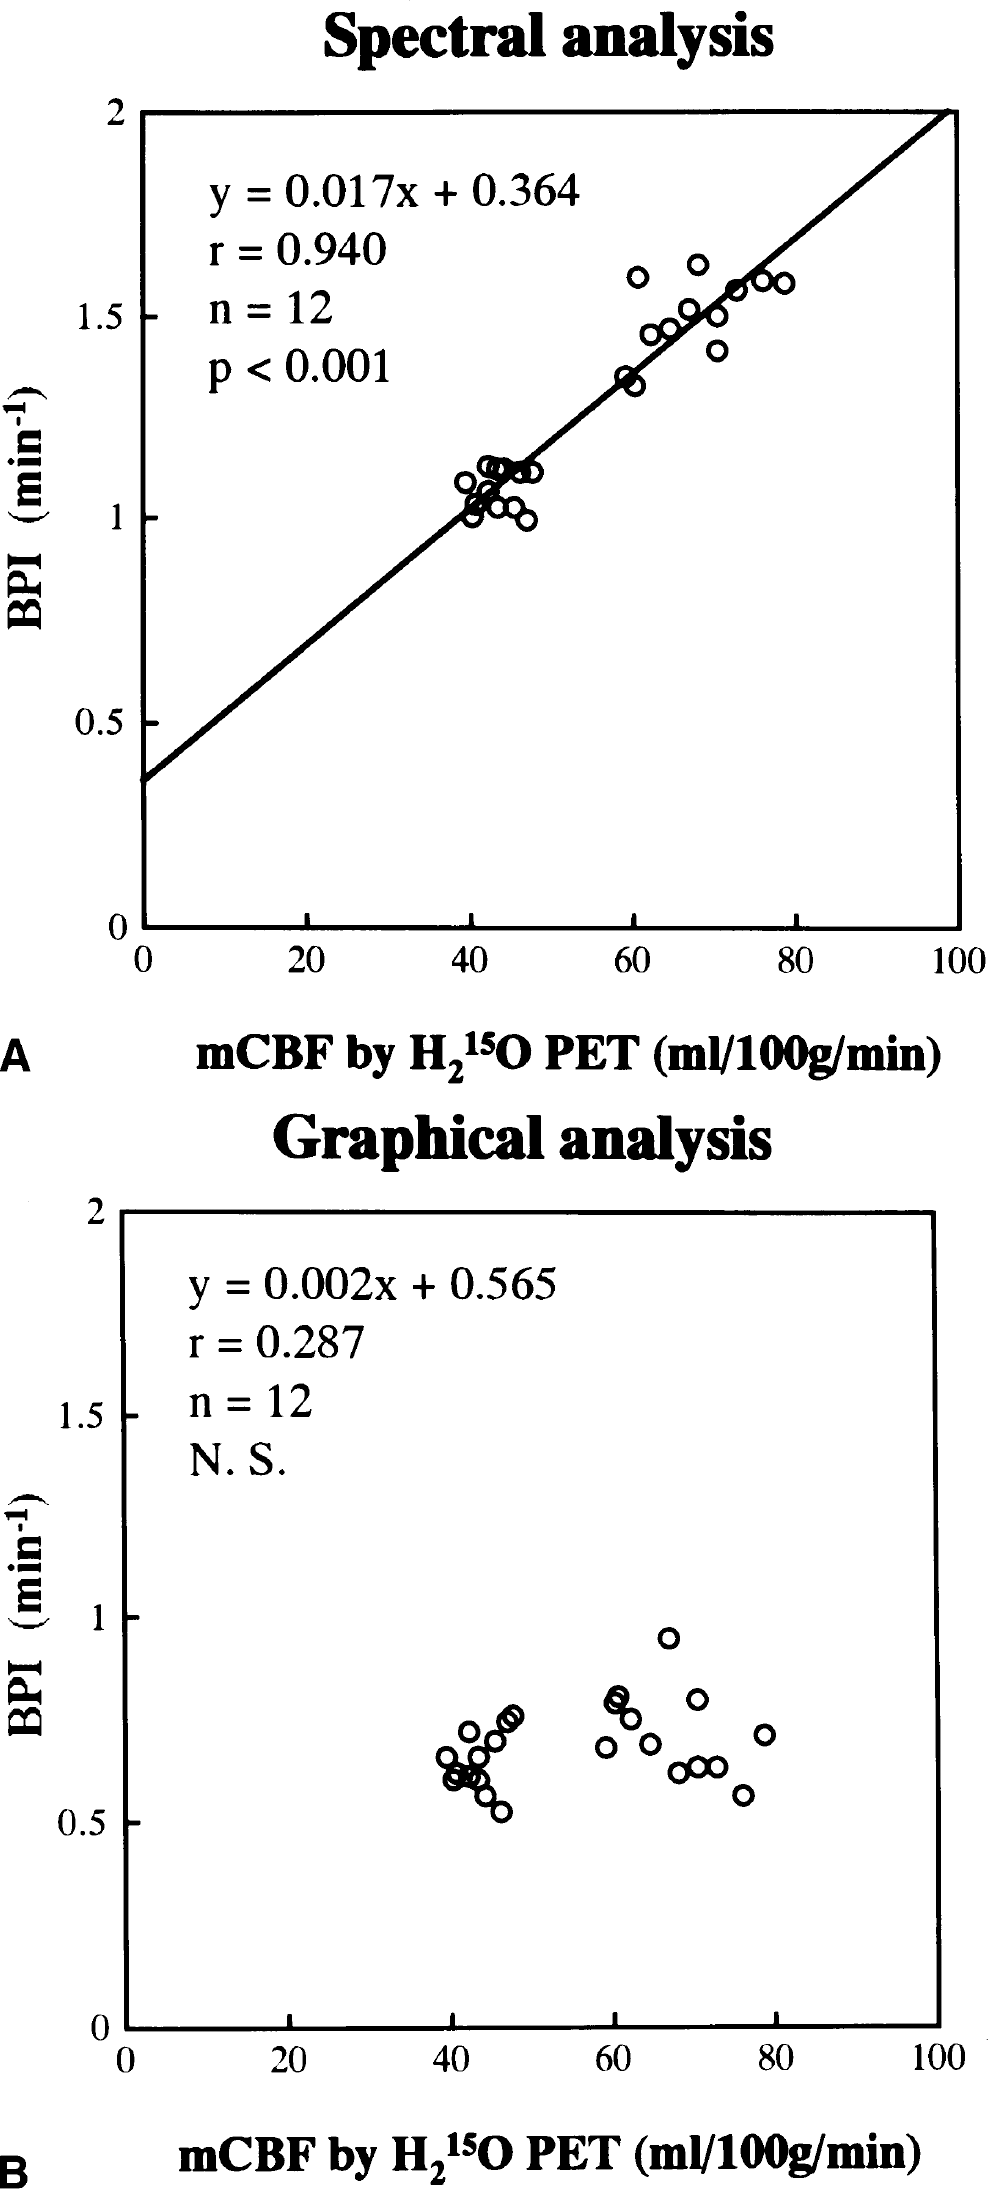
Relationship between the brain perfusion index (BPI) values obtained by spectral analysis (BPIS;
We also studied the percentage change in BPI between the values at rest and 10 minutes after acetazolamide administration (Fig. 3). The percentage change in BPIS after acetazolamide administration (40.1 ± 8.4%) was significantly greater than the change in BPIG (11.3 ± 6.5%). The mCBFPET was 43.6 ± 2.7 mL · min−1 100 g−1 at rest and increased by 55.6 ± 18.4% after the administration of acetazolamide. The percent change in mCBFPET after acetazolamide administration was significantly greater than the change in either BPIS or BPIG.
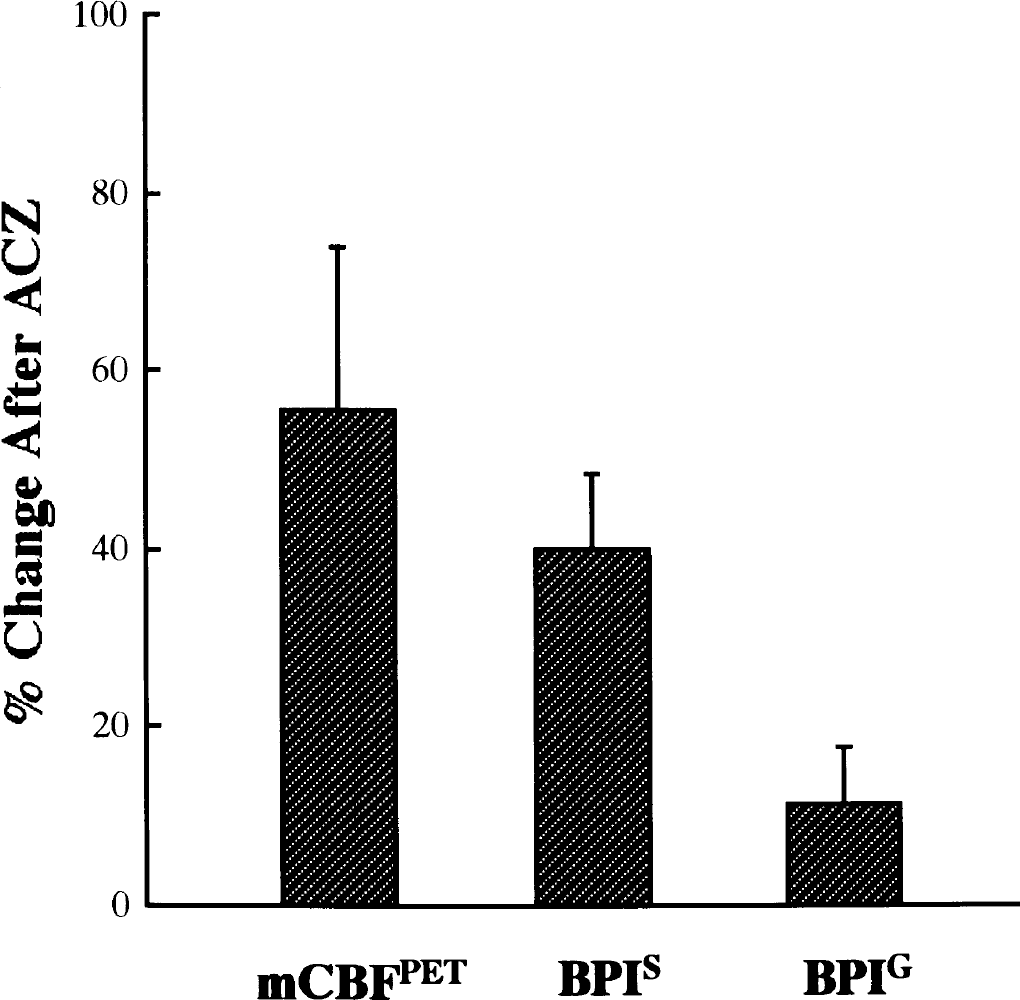
Comparison between the degrees of increase in brain perfusion index (BPI) (percent change in BPI) and H2O positron emission tomography (PET) (mCBFPET) after the administration of 1g of acetazolamide (ACZ). The percentage change of spectral analysis—calculated BPI values (BPIS) was significantly larger than that of graphical analysis—calculated BPI values (BPIG) (Wilcoxon signed rank test).
DISCUSSION
99mTc-HMPAO is widely used as a radiotracer for the evaluation of brain perfusion and has been used to examine a variety of brain diseases, providing a “snapshot” of cerebral perfusion at the moment of administration (Nowotnik et al., 1985; Hayashida et al., 1993; Takasawa et al., 2000). The largest advantage of this tracer is its ability to capture acute events, even in emergency cases (Shimosegawa et al., 1994), since it is available in the form of a 99mTc-labeled kit. One of its drawbacks, however, is that its rate of uptake in the brain is greatly affected by the extraction fraction and retention fraction, especially when the CBF is elevated (Murase et al., 1992). This property must be considered whenever a brain study involving a quantitative analysis with 99mTc-HMPAO is performed.
Matsuda et al. (1992) reported a quantitative method of measuring CBF using 99mTc-HMPAO. This procedure can be used to noninvasively determine the BPI using radionuclide angiographic data (Fig. 1). The regional tracer uptake pattern obtained by a subsequent SPECT measurement can then be converted into an absolute regional perfusion map, after calibration, and superimposed on the derived hemispheric CBF data, using the appropriate tracer linearity correction. In essence, this calculation of regional CBF from the BPI is based on the linearization algorithm of Lassen et al. (1988) and yields a curve—linear relationship between brain activity and blood flow. However, since the BPI obtained by means of GA is derived from the slope of Gjedde-Patlak plot (Matsuda et al., 1992, 1995), which is proportional to the product of the first-pass extraction fraction of the tracer, retention fraction, and the CBF, it does not accurately reflect CBF, especially when the CBF is elevated, such as after the administration of acetazolamide (Murase et al., 1999).
SA has been previously used to analyze dynamic PET scans in humans; this technique provides data representing the time course of activity in tissue regions of interest and in arterial blood following the administration of a radiolabeled tracer (Cunningham and Jones, 1993). SA provides a simple spectrum of kinetic components that relates the tissue's response to the blood activity curve, facilitating the interpretation of dynamic PET data and simplifying comparisons between regions and subjects.
Murase et al. (1999) were the first to apply the SA method to SPECT data. They demonstrated two crucial advantages to estimating the BPI using SA. First, BPIS is barely affected by the conversion of lipophilic, diffusible tracers to hydrophilic, nondiffusible tracers in the arterial blood of the brain. Since the influence of this phenomenon when 99mTc-HMPAO is used in humans results in at most a 1.0% difference in BPI, this phenomenon is probably negligible for technetium-99m-labeled compounds when the BPI is measured using SA. Second, the BPI is theoretically unaffected by the first-pass extraction fraction and retention fraction when measured using SA [see Appendix 2).]. The assumptions underlying this analysis are based only on the linear model.
We studied the changes in BPI after the injection of acetazolamide in six healthy volunteers (Fig. 3). The results showed that the percent increase in BPIG (11.3 ± 6.5%) was significantly lower than that in BPIS (40.1 ± 8.4%). The extraction fraction and retention fraction decrease with increasing blood flow (Murase et al., 1992). This probably explains why the GA method gives an underestimation of flow in comparison with SA when flow is high.
The kinetic behavior of diffusible tracers, such as 15O-labeled water, is crucially different from tracers that are trapped, such as 99mTc-HMPAO; thus, the distribution of 15O-labeled water examined using PET reflects the CBF more reliably and is widely used clinically (Hayashida et al., 1996; Kuwabara et al., 1998). The percentage change in mCBFPET was 55.6%, significantly higher than that in BPIS (Fig. 3). Furthermore, although the BPIS and mCBFPET values were significantly correlated, y-intercept of the regression equation was somewhat large (Fig. 2A). As shown in Appendix 2, the BPIS given by Eq. 3 is theoretically proportional to CBF. However, when the intravascular component is neglected, the sum of the αi values becomes equal to the influx rate constant of the tracer, that is, K1 (Cunningham and Jones, 1993), which is the product of CBF and the first-pass extraction fraction. When the temporal and spatial resolution for analysis are finite as in this study, the intravascular and extravascular components might not be separated adequately in SA, and then the BPIS values obtained in this study might have been affected by the limited first-pass extraction fraction. This would be the main reason for the aforementioned findings shown in Figs. 2 and 3. As shown in Fig. 2, however, the significant relationship between mCBFPET and BPIS can be used to estimate the percentage change in the absolute CBF after the administration of acetazolamide using BPIS.
Acetazolamide is generally used to estimate the vascular reserve and/or to detect areas of misery perfusion (Kuroda et al., 2001; Vernieri et al., 1999). Reactivity to acetazolamide in patients with major artery occlusion identifies patients with high risk of subsequent ischemic stroke (Kuroda et al., 2001; Webster et al., 1995; Yonas et al., 1993). Thus, it is important to study the absolute CBF and the reactivity to acetazolamide in routine clinical settings, especially in patients with major artery occlusion. The significant correlation between BPIS and mCBFPET found in this study suggests that CBF measurements obtained using SA might be as applicable as H215O PET measurements in clinical practice. We previously described the split dose 123I-IMP SPECT method, which enables measurements of CBF to be obtained both at rest and after the administration of acetazolamide in a short time (Hashikawa et al., 1994). In the future, the split-dose method using SA will be used in clinical practice, and this novel, noninvasive method should be less troublesome to patients undergoing quantitative CBF examinations.
In conclusion, we have demonstrated a simple, useful, noninvasive method for the quantitative evaluation of CBF. Our results suggest that this novel SA method provides more reliable BPI measurements than the conventional procedure using GA for the quantification of CBF using 99mTc-HMPAO. The SA method may allow noninvasive absolute CBF quantification using 99mTc-HMPAO to be performed in routine clinical settings.
Footnotes
Acknowledgments
We thank Mr. Y. Nakamura and the staff of the Department of Nuclear Medicine and the Cyclotron staff of Osaka University Medical School Hospital for their technical support in performing the studies, as well as Miss S. Imoto and Miss R. Morimoto for their administrative assistance.