
Abstract
This study examines the feasibility of a steady-state bolus-integration method with the dopamine D2/D3 receptor single photon emission computer tomography (SPECT) tracer, [123I]IBZM, for determination of in vivo affinity of haloperidol. The nonspecific binding of [123I]IBZM was examined in the rat brain by infusion of haloperidol to plasma levels approximately 100 times the Kd level in man. In humans, Kd for haloperidol binding was measured in four healthy volunteers that were examined twice: once with partial dopamine D2/D3 receptor blockade obtained by a scheduled infusion of unlabeled haloperidol (0.7 mg total dosage), and once in an unblocked state. Blood sampling and SPECT were performed intermittently during 6 hours after intravenous [123I]IBZM bolus injection. Plasma [123I]IBZM was determined by octane extraction. Plasma haloperidol was determined by a radioimmunoassay, and plasma protein binding was determined by equilibrium dialysis. In humans, the striatal D2/D3 receptor occupancy was 0.27 ± 0.085 and the in vivo Kd for haloperidol was 0.25 ± 0.1 nmol/L, which is comparable to Kd values as obtained from in vitro studies. The authors conclude that steady-state [123I]IBZM SPECT studies allow for determination of dopamine D2/D3 receptor occupancy in striatum and in vivo measurement of drug affinity to striatal dopamine D2 and D3 receptors.
Various single photon emission computed tomography (SPECT) and positron emission tomography (PET) ligands require valid methods for accurate quantification of receptor characteristics. [123I]iodobenzamide ([123I]IBZM) has, due to its suitable kinetics for the pseudoequilibrium method and for the steady-state infusion method, been used widely in SPECT studies. [123I]IBZM does, however, display a high degree of nonspecific binding. This is particularly a problem in pseudoequilibrium studies (Seibyl et al. 1996), whereas quantification of receptor occupancy in steady-state studies in this respect is more robust. However, the setup of a bolus infusion schedule may be an elaborate procedure. The steady-state method, as described by Lassen (1992), uses a bolus tracer injection with venous or arterial blood sampling to measure the equilibrium constant (Kd) of a steady-state ligand binding to a receptor through the use of a radiolabeled tracer specifically binding to the examined receptor type (Videbæk et al. 1993). With this approach it is not required that the unlabeled ligand binds selectively to the receptor in question.
According to the steady-state method, by use of bolus injection (Lassen, 1992) the occupancy of the receptors by unlabeled ligand can be expressed as a relation between the distribution volume (Vd) of the tracer in the unblocked (Vd(0)) and the partially blocked situation-(Vd(L), because Vd is a function of the concentration of free receptors. The fractional occupancy of the receptor with unlabeled ligand present (O(L)) is determined by:
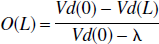
where λ is the brain-blood-partition coefficient for the nonsaturable component of the tracer distribution. As this is the occupancy at a given plasma level of the unlabeled ligand in a steady-state situation, the equilibrium constant, Kd for the unlabeled ligand (KdL), is calculated from:
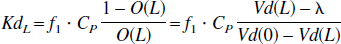
where f1 and Cp is the free fraction and the total concentration of the unlabeled ligand, respectively.
The measurements of f1, Cp, Vd(L), and Vd(0) are straightforward and are combined by use of a crosscalibration factor between the well counter and the scanner. As the protein and lipid content as well as the fractional water volume in cortex and plasma is similar, one may expect that λ is close to unity, and if λ is much smaller than Vd(L), the λ-correction becomes insignificant. This assumption was examined in vivo by measurement of distribution volumes in rats, with and without massive doses of haloperidol.
The aim of the current study was to examine the feasibility of the steady-state method and bolus tracer injection of [123I]IBZM for determination of Kd for a drug, in this case the traditional antipsychotic drug, haloperidol (Serenase, Jannsen Cilag). The affinity of haloperidol to the dopamine D2/D3 receptors was examined by intravenous infusion of haloperidol and bolus injection of [123I]IBZM followed by frequent blood sampling and SPECT scanning.
MATERIALS AND METHODS
Materials
Two groups (haloperidol-treated [n = 5] and control animals [n = 3]) of male Wistar rats (Møllegården, Denmark) weighing 320 to 380 g were studied. Five healthy volunteers (23 to 27 years in age, 2 males and 3 females) were studied. All volunteers were interviewed. The volunteers alleged no family history of psychiatric illness in siblings and parents and also claimed to be alcohol-free, neuroleptic-naïive, and drug-free. They all had a normal clinical examination. A pilot study was performed in one of the subjects to ensure that the anticipated haloperidol infusion time required to obtain steady-state was correct. Informed consent was obtained before participation in the study, which had been approved by the Ethical Committee for Copenhagen and Frederiksberg County (V.100.2215/91). Volunteers fasted and did not smoke tobacco for at least 10 hours before the study sessions. Water and food intake was allowed between the SPECT scannings. Smoking and intake of coffee and tea were not allowed.
Methods
Animal studies
Anesthesia was initiated by halothane 3% and continued by 0.7% to 1% during the surgical procedure. Catheters were placed in the femoral vein and artery for drug infusion and blood sampling, respectively. The wounds were infiltrated by lidocaine and a catheter was placed locally for lidocaine supplement. The rats woke up restrained in a plastic tube. After 30 minutes of rest, 2.5 MBq [123I]IBZM was given intravenously followed by an infusion of 2.5 MBq [123I]IBZM per hour for 3 hours. After 3 hours, a blood sample for [123I]IBZM determination was obtained and immediately after the animal was decapitated by a guillotine. The brain was rapidly taken out and placed on ice for dissection. Macroscopically visible blood vessels were removed and samples from frontal cortex, cerebellum, and striatum were collected. The tissue was weighed and counted in a Hewlett Packard Cobra 5002/5003 γ-counter (Packard Instrument Co., Meriden, CT, U.S.A.).
In addition to [123I]IBZM, 5 rats received haloperidol (Serenase, Janssen-Cilag) infusion between 3.75 and 6.75 mg/kg hour haloperidol.
The initial isotope delivery schedule was slightly different between the haloperidol-treated group and the control group. In the control group, the loading dose of [123I]IBZM was given over 2 minutes, whereas in the haloperidol-treated group, the loading dose, for practical reasons, was given as an infusion together with the haloperidol loading dose over 12 minutes. Plasma content of [123I]IBZM was determined as in the human study (see below).
Human studies
For determination of the affinity of haloperidol to dopamine D2/D3 receptors, 4 healthy volunteers were examined, each on 2 separate days with an interval of 1 to 3 weeks. One study was without haloperidol and the other with continuous haloperidol infusion aiming at 25% blockade of the dopamine receptors. In the unblocked condition, a bolus of 122 ±11 MBq [123I]IBZM (specific activity > 5.1 106 Ci/mol, [Cygne BV, Belgium]) was injected intravenously while the volunteer rested in a supine position with his or her head placed in the head holder of the SPECT scanner. In the partially blocked condition, an intravenous haloperidol infusion of 0.6 mg/h for 30 minutes, 0.23 mg/h for 90 minutes, and 0.012 mg/h as maintenance dose was started 4 hours before bolus injection of 245 ± 15 MBq [123I]IBZM and continued throughout the study. Blood sampling and SPECT scanning sequences were started at the time of tracer injection.
To verify that 4 hours of haloperidol infusion resulted in a steady-state condition, 1 subject had 2 [123I]IBZM injections (120 MBq and 246 MBq). Accordingly, SPECT scanning and blood sampling were performed twice, 4 and 8 hours after the start of the haloperidol infusion.
After approximately 50 minutes of haloperidol infusion, 4 of the 5 volunteers felt tired and took a nap for approximately 90 minutes. Blood pressure and respiratory frequency were measured intermittently and remained stable throughout the study.
SPECT scanning. Single photon emission computed tomography scanning was performed by a Tomomatic 232 system (Medimatic, Hellerup, Denmark), a rapidly rotating and highly sensitive 2-slice system for SPECT. The system is equipped with a 13-mm collimator and images 2 transaxial brain slices of 18 mm (full width at half maximum), with a midplanar distance of 40 mm. Rotation speed was 6 rpm and the primary energy window 140 to 180 keV. Penetration and scatter from higher energy photons was modeled and subtracted based on measurements in a secondary window (180 to 220 keV. Reconstruction was performed using filtered back-projection, the reconstruction matrix being 32 times 32. The SPECT system was crosscalibrated against the well counter using a Capintec brain phantom (Capintec, Pittsburgh, PA, U.S.A.). These measurements link the pixel values in the filtered and attenuation-corrected SPECT images to the plasma sample count rates obtained from the well counter.
Scanning procedure. Subjects were repositioned identically in the scanner by use of adhesive tape markers of the orbitomeatal (OM) plane. Data sampling was obtained in 3 volunteers at the OM+50 mm and OM+90 mm levels, and in 2 other volunteers at OM+10 mm and OM+50 mm. Only data from the OM+50 mm were used for the Kd calculations. The OM+50 mm was chosen as the level of examination based on the authors' previous experience with multilevel scanning with [123I]IBZM and [99mTc]HMPAO. For both tracers, this level is superior for basal ganglia.
The acquisition protocol started with 8 frames of 10 seconds, followed by 4 frames of 60 seconds and 6 frames of 10 minutes each. From 90 minutes after injection until the end of the study session, the subjects were scanned every hour by 10-minute frames.
For Kd data analysis, the 93% count rate fractile from the OM+50 mm slice was chosen as cut-off for distinction between target and background. This fractile was defined on the last scan in the first scanning session (after 50 minutes), and the selected region of interest was superimposed on the previous scans. On each subsequent scan the fractile was redefined also from the 93% fractile. The count rate in the selected receptor-rich regions was decay-corrected and a time-activity curve was generated. The area below the time-activity curve was calculated using the trapezoid rule, and the total area under the curve was obtained by adding the extrapolated area to infinity from the point of the last scan by use of monoexponential extrapolation. The extrapolated area constituted an average 28% of the total area in the blocked studies, and 21% in the unblocked studies. The areas finally were multiplied by the crosscalibration factor to obtain the same units as for the blood curve (Videbcek et al., 1993).
To examine how the specific-to-nonspecific binding in the unblocked condition changed with time after bolus injection, a set of fixed regions representing cerebellum, frontal cortex, temporal cortex, occipital cortex, and basal ganglia were placed on all scans obtained for the volunteers examined in OM+1 and OM+5 cm.
Blood sampling. Catheters for blood sampling, haloperidol infusion, and [123I]IBZM injection were placed in both cubital veins. Initially, samples for protein binding, blind samples for haloperidol, and [123I]IBZM were drawn. After [123I]IBZM injection, blood samples of 5 mL for radioligand determination were drawn at 0 to 20, 20 to 40, 40 to 60, and 90 seconds, 2, 3, 4, 5, 10, 20, 40, 60, 90, and 120 minutes, and every hour thereafter. Samples of 10 mL for haloperidol plasma concentration measurements were drawn 30 minutes and 1 minute before [123I]IBZM injection, and 40, 60, and 120 minutes after. After the samples had been drawn into heparin-sodium-fluoride vials, they were immediately centrifuged and plasma was pipetted for further analysis as described below.
[123I]IBZM determination by octane extraction. A modified method of Guo et al. (1993) was used. The extraction of parent compound from plasma was performed as follows: A mixture of 1000 μL plasma, 1000 μL 1 mmol/L phosphate buffer, and 4000 μL octane was shaken for 2 minutes; 3000 μL of the octane phase was then pipetted to a counting vial. The samples were counted in a γ-counter (Packard Auto-Gamma 5606; United Technologies Packard), decay-corrected, and recalculated into cpm/mL plasma. A time-activity curve was generated and the area below the venous [123I]IBZM plasma curve was calculated as described for the brain time-activity curves. The extrapolated area constituted between 10% to 60% of the total area, depending on the metabolic rate of the tracer.
Haloperidol determination by radio immuno assay (RIA). The total plasma haloperidol concentration was determined by a commercially available RIA method (Janssen Biotech, Olen, Belgium). Each sample was analyzed in duplicate. The lower limit of quantification was 0.15 nmol/L and the intra assay coefficient of variation was 12%.
Plasma protein binding of haloperidol. Protein binding of haloperidol was determined individually by equilibrium dialysis in a Kontron Diapack model 4000 using a cellulose membrane (Sigma Chemical, St. Louis, MO, U.S.A.) that retains proteins >12.000 D. One-milliliter serum samples were incubated at room temperature together with a haloperidol solution of a final concentration of 100 nmol/L. After incubation, 1.5 mL of the final solution was dialyzed against buffer for 4 hours. An 800-μL aliquot was drawn from each compartment and the haloperidol concentration was determined by modification of the method described by Curry et al. (1982). After extraction of the sample with hexane-isoamyl alcohol (92:2 v/v), duplicate samples were analyzed on a Sperisorb S 5 CN column (4.6 mm inner diameter x 150 mm) (Waters, Milford, MA, U.S.A.) with a mobile phase of metanol-acetonitrile-10 mmol/L ammonium acetate (70:24:6 v/v) at a flow rate of 1.7 mL/min. Detection was performed at 248 nm. The lower limit of quantification was 1 nmol/L and the interassay coefficient of variation 6% (15 nmol/L).
RESULTS
Animal studies
The calculated [123I]IBZM distribution volumes for striatum, cerebellum, and frontal cortex are shown in Table 1. The Vd in striatum was three times Vd in cerebellum and twice that of the frontal cortex. Treatment with haloperidol reduced Vd in striatum by 63% to the level of the nonreceptor containing reference region, indicating that full blockade of specific binding was reached by haloperidol treatment. Haloperidol did not affect the Vd in receptor poor areas such as frontal cortex and cerebellum, indicating that no changes except for the receptor blockade occurred in Vd by the treatment.
Distribution volume (Vd) of [123I]IBZM in striatum, cerebellum, and frontal cortex in rat
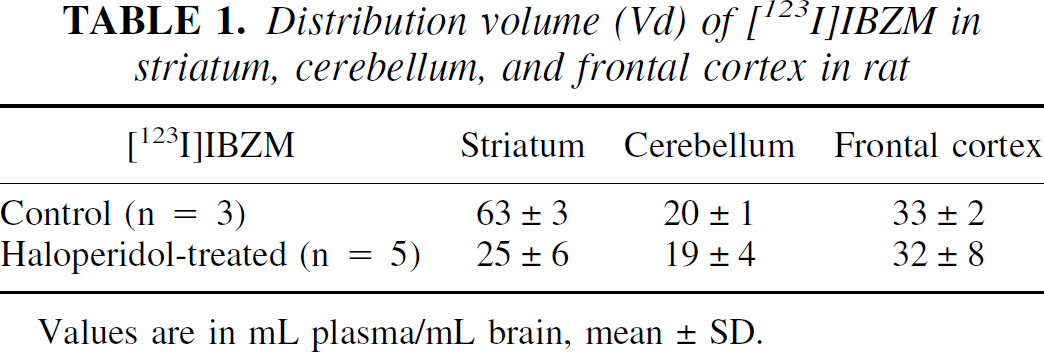
Values are in mL plasma/mL brain, mean±SD.
Single photon emission computed tomography study
As seen in Fig. 1, the plasma level of haloperidol in the partially blocked condition remained stable from 30 minutes before and throughout the study (Friedman test). The mean nonprotein bound fraction of haloperidol measured by microdialysis was 9.0% ± 0.8% and the individual average concentrations of nonprotein bound haloperidol after [123I]IBZM injection were between 0.06 and 0.13 nmol haloperidol/1 L plasma water (Table 2).
Individual values of free plasma haloperidol, striatal occupancy, and Kd for haloperidol

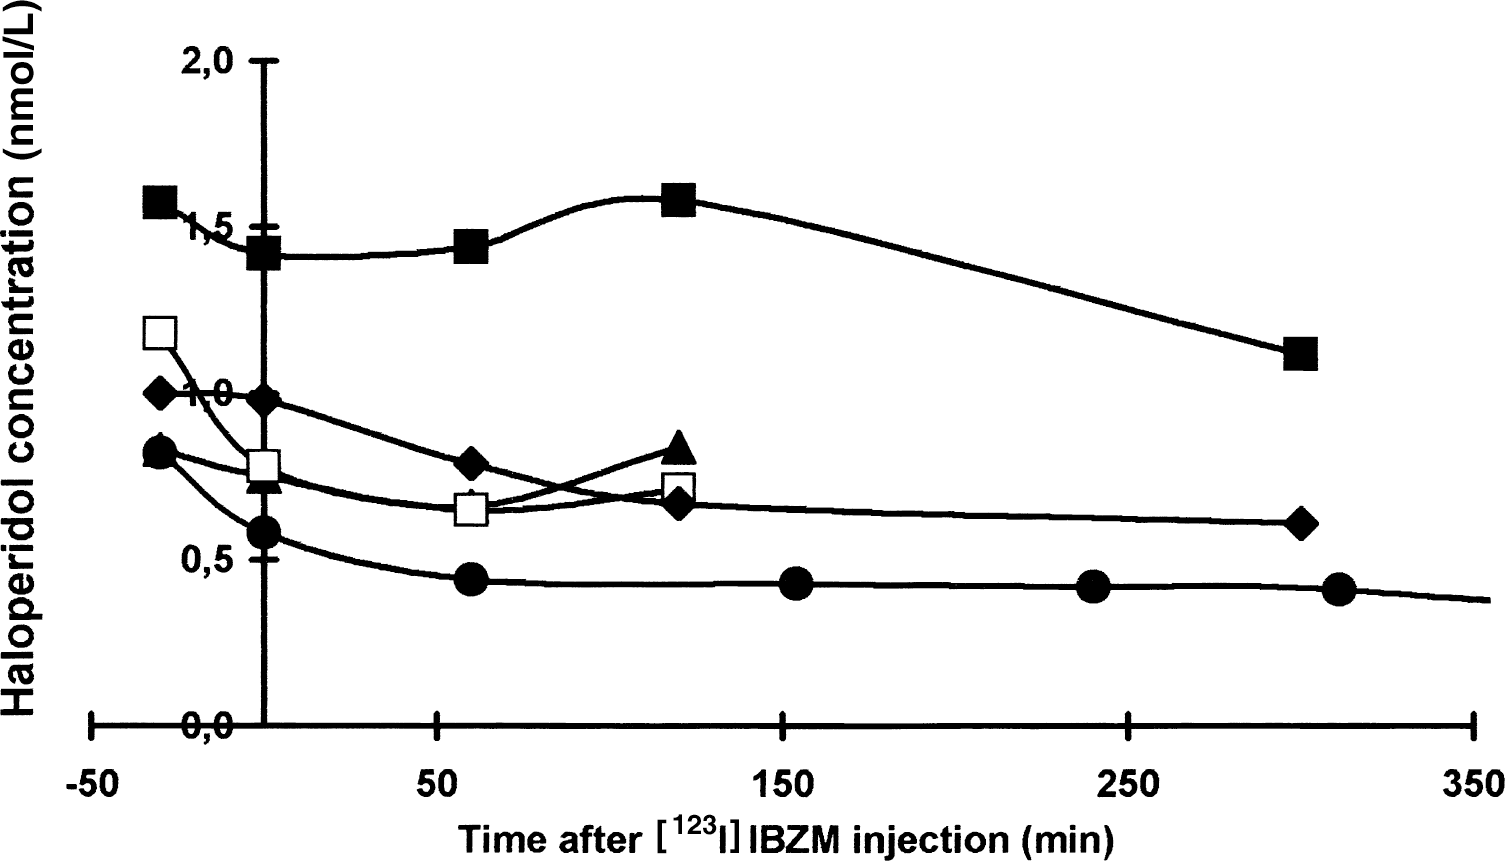
The total plasma haloperidol concentration (nmol/L) in the five volunteers as function of time after [123I]IBZM injection. Filled circle represents volunteer I studied with haloperidol infusion for 8 hours, filled triangle represents volunteer II, filled square represents volunteer III, open square represents volunteer IV, and filled diamond represents volunteer V.
Vd remained unaltered in the subject examined with tracer injection after 4 and 8 hours blockade with haloperidol infusion, 17 and 18 mL plasma/1 mL brain, respectively.
The individual occupancy and Kd of haloperidol is summarized in Table 2. The average occupancy was 0.27 ± 0.085 and the average striatal Kd value was 0.25 ± 0.1 nmol/L. An example of time-activity curves after bolus injection for striatum, hemisphere, and temporal cortex are displayed for a volunteer in Fig. 2.
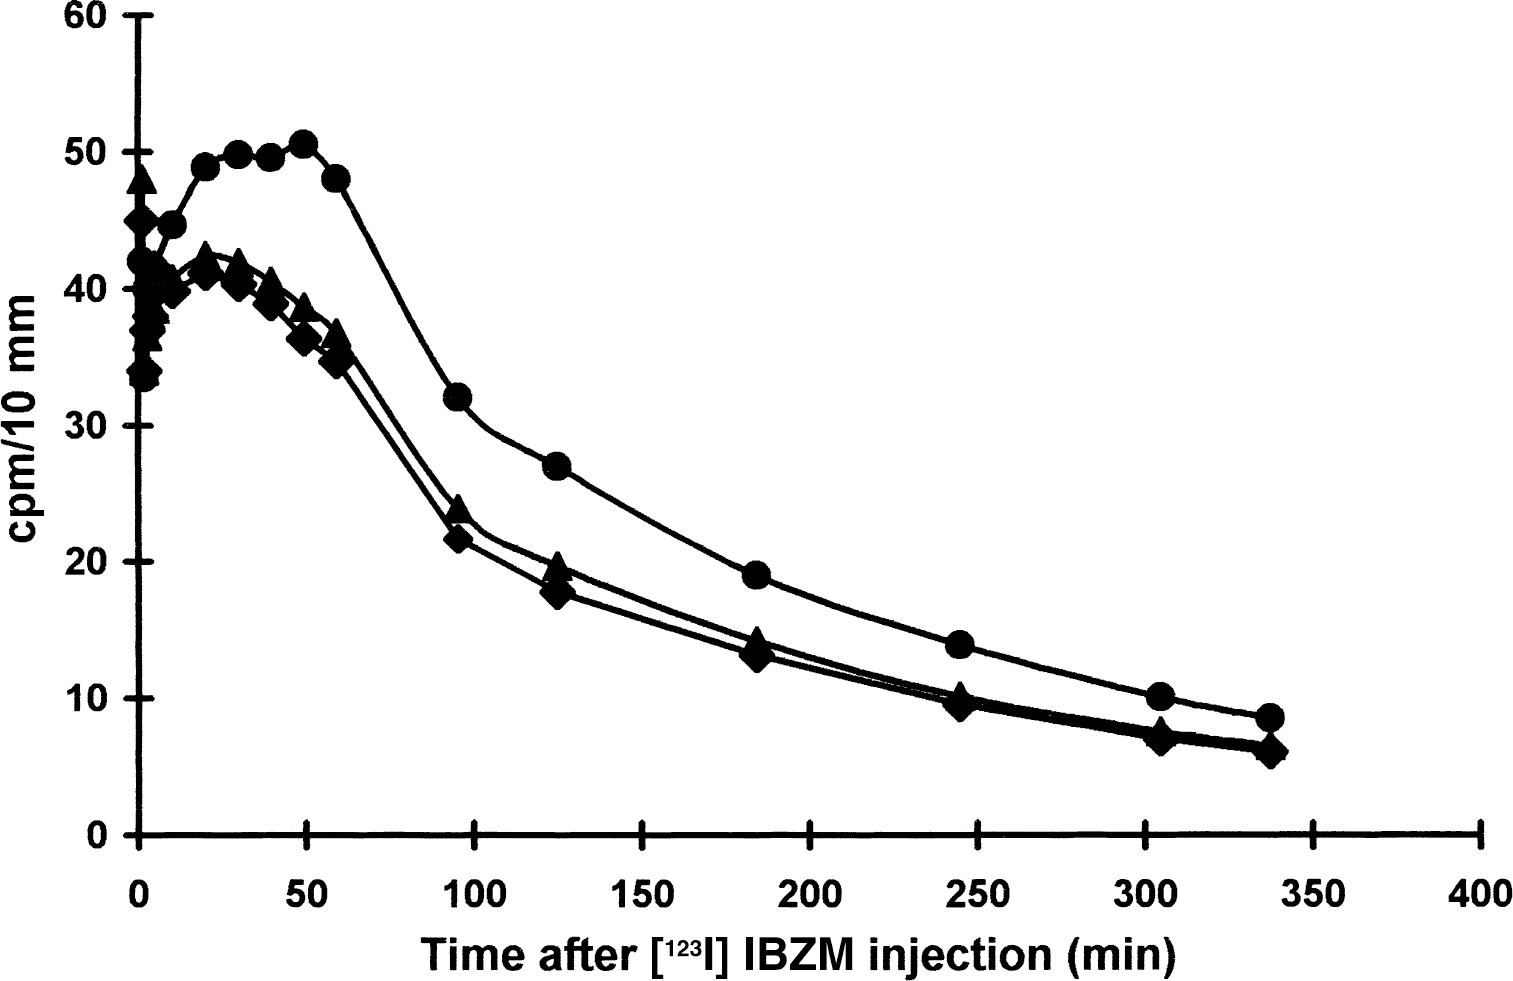
Regional cerebral time-activity curves in volunteer 4 after [123I]IBZM injection. Filled circle represents basal ganglia, filled triangle represents hemisphere, and filled diamond represents temporal cortex.
DISCUSSION
For the first time, the use of the steady-state method with [123I]IBZM for determination of affinity of a cold ligand, namely haloperidol, is described. In the current study, the in vivo determined Kd for haloperidol was 0.25 nmol/L, which is in accordance with previous determinations of 0.45 to 2 nmol/L (Schotte et al. 1996; Sokoloff et al. 1990) determined from in vitro studies.
Assumptions for the steady-state method
As discussed in the introduction, the steady-state method requires that the examined unlabeled ligand is in steady-state in plasma and brain. Furthermore, it requires that λ of the tracer either is low compared with Vd(0) or that the fraction of nonspecific tracer binding is well determined. It is also required that the tracer binds specifically only to the examined receptor, and that within the experimental time, the tracer is not metabolized into other radioactive labeled ligands with affinity to brain receptors. These four assumptions are discussed separately below.
Steady-state
The authors concluded that their 4-hour bolus-infusion protocol led to steady-state by comparison of Vd measured after 4 and 8 hours of infusion. This comparison was performed in one case and showed exactly the same result in the two situations.
Nonspecific binding
Because of the relatively low concentration of dopamine D2/D3 receptors, the extrastriatal binding of IBZM is assumed to be mainly nonspecific (Seibyl et al., 1996). This assumption was tested in the animal studies. If the concentration of the blocking unlabeled ligand is infinitely high, no receptor sites are available for specific binding of radioactive tracer, and the distribution volume of the tracer represents nonspecific binding, that is, λ equals Vd when 100% of the receptors are blocked. In the completely blocked condition, the rat brains showed a high distribution volume of approximately 20. This was an unexpected finding because other neuroreceptor ligands have a nonspecific distribution volume closer to 1 (Videbæk et al., 1995; Lassen, 1992). In rats, Vd in the blocked condition was greater than the unblocked Vd in the human studies; therefore, a correction using this value would result in a negative Kd. For that reason, a value of λ of unity was used for the calculations of Kd. An alternative approach would be to assume that the relative fraction of nonspecific binding was similar in rat and human brain. From Table 1, it can be seen that the nonspecific binding in the rat brain constitutes approximately 40% of the total binding. Using this fraction in Eq. 2 leads to a reduction in the calculated Kd value from 0.25 nmol/L to 0.16 nmol/L. Another unexpected finding was a greater nonspecific Vd in frontal cortex as compared with cerebellum.
It is unlikely that the blocked Vd was erroneously determined by using an insufficient dose of haloperidol for blockade of dopamine D2 and D3 receptors, as an increase in haloperidol dose by 50% did not further decrease Vd. A too low specific activity of [123I]IBZM might account for the authors' finding, but as the maximal count rate was 20 cps/g striatal tissue and the specific activity >5.1 106 Ci/mol, it can be calculated that the maximal striatal tracer concentration was approximately 0.2 pmol IBZM/1 g tissue. This is low compared with a striatal dopamine D2/D3 receptor density of approximately 25 pmol/g striatal tissue (Hyttel and Arnt, 1986). Theoretically, different subtype specificity and affinity for the two ligands could cause the high Vd in the blocked condition. Because haloperidol has a Kd value for dopamine D3 receptors, which is approximately 20 times greater than for dopamine D2 receptors (Sokoloff et al. 1990), IBZM binding to D3 therefore could be a part of the measured unblocked binding (Videbæk et al., 2000), but because the amount of dopamine D3 receptors relative to dopamine D2 is low, dopamine D3 binding cannot account for the massive extrastriatal uptake. Theoretically, [123I]IBZM may bind to other yet unknown receptors not blocked by haloperidol and this would explain the regional differences in nonspecific binding as well as an unexpected high λ.
Crosscalibration cancels out except in relation to λ where the resulting error approximates ɛ •λ/Vd(L), where ɛ is the random error of the crosscalibration factor. The random error for [123I]IBZM can be calculated as 7%.
Tracer specificity
[123I]IBZMs binds with similar affinity to dopamine D2 and D3 receptors (Videbæk et al. 2000). Former studies by autoradiography, in situ hybridization, and immunocytochemistry agree that dopamine D2 receptors are in the majority as compared with dopamine D3, but there have been conflicting results on the topographic distribution and the amount of receptors. It is generally accepted that the distribution of dopamine D2 and D3 receptors is overlapping and that dopamine D3 receptors have the greatest density in Islands of Calleja and in ventral striatum and nucleus accumbens. However, autoradiographic studies have shown more widespread distribution in neocortex (Khan et al., 1998; Herroelen et al., 1994) than the in situ hybridization technique (Le Moine and Bloch, 1996; Sokoloff et al., 1990). An immunocytochemical study by Khan et al. (1998) using highly specific subtype antibodies has shown colocalization of D2 and D3 receptors, but also complementary distribution and significant subtype-specific differences in labeling intensity and cellular localization. These conflicting results may well be explained by the different techniques used. Because the [123I]IBZM images display a mixture of receptor dopamine D2 and D3 densities with predominance of dopamine D2 receptors, measured Kd values do not represent the affinity to a single receptor subtype, but represent the average Kd of the tissue in which dopamine D2 receptors prevail. Haloperidol also displays affinity to both receptor subtypes; but in contrast to [123I]IBZM, haloperidol has a much lower affinity to dopamine D3 receptors than to dopamine D2 receptors. In vitro studies have shown a dopamine D2 to D3 density ratio between 7 (Schotte et al., 1996) and 20 (Sokoloff et al., 1990), and in vivo studies have shown a factor of 7 (Schotte et al., 1996). Because [123I]IBZM and haloperidol bind to both receptor subtypes, the calculated binding parameter represent a mixed dopamine D2/D3 binding reflecting the constitution of the tissue.
Metabolism of tracer and unlabeled ligand
Metabolism of haloperidol or [123I]IBZM into other active ligands with different kinetic properties than the parent compound is unlikely to occur. Haloperidol is only slowly metabolized (T1/2: 14 to 41 h) by either, in high dosage an N-dealkylation, a reduction procedure or more seldom by hydroxylation. The major metabolic pathway, the oxidative N-dealkylation, leads to metabolites with, if any, very low neuroleptic activity and its contribution to the signal can be neglected. The metabolites from reduction of haloperidol has a neuroleptic activity with potencies of aprroximately 1/10 to 1/20 but they are primarily produced at high dosage of haloperidol and can therefore be neglected in this study (Jørgensen, 1986). [123I]IBZM is metabolized into a water-soluble component, mainly consisting of free iodine, and one or two less lipofilic components (Seibyl et al., 1992; Guo et al., 1993) that do not cross the blood–brain barrier (Guo et al., 1993).
Photon scattering and choice of method
One of the advantages for the steady-state method by SPECT compared with reference region models, including the transient equilibrium, the modified Logan plot, kinetic reference tissue model, and voxel-based reference tissue model, is the lower influence of photon scattering. Models involving reference regions with low and nonspecific tracer uptake are very sensitive to errors in the estimated scatter fraction. As can be seen from Eq. 2, the estimate of Kd is rather independent of the actual scatter fraction because the relative amount of scatter in the receptor-rich region is small as compared with receptor-poor areas, also when the receptors are partially blocked. Furthermore, the cross-calibration study was performed using a brain phantom under conditions similar to the human study.
Pharmacologic aspects
The measured Kd in the three of four volunteers was comparable. Subject V had a somewhat larger Kd value than the other subjects and this subject was the only one who did not feel tired during the initial haloperidol infusion, even though the free plasma haloperidol was on average. As the calculated affinity is not a pure dopamine D2 binding, the higher Kd value in this subject may be caused by either a significant relative larger number of dopamine D3 receptors, a lower dopamine D2 affinity, or a combination of these two factors.
In conclusion, although the assumptions of the steady-state method are not completely fulfilled for [123I]IBZM, because the ligand binds to two receptor subtypes and the high nonspecific binding imposes a relative uncertainty on the calculated Kd value, the [123I]IBZM steady-state method is a robust tool for evaluation of a mixture of dopamine D2 and D3 binding within patient groups or as a pharmacologic tool.
Footnotes
Acknowledgments
The authors thank Bente Dall, Eva Brødsgaard, and Kent Pedersen for technical assistance.