
Abstract
Commonly used inbred mouse strains display substantial differences in sensitivity to focal cerebral ischemia. Such differences can often be ascribed to differences in vascular anatomy. The authors investigated whether a contributing factor could be strain-related differences in cellular synthesis of the pleiotropic and potential neurotoxic cytokine tumor necrosis factor (TNF) in the border zone of and within the focal cerebral infarct. In all mouse strains investigated they found that TNF was synthesized by infarct and periinfarct infiltrating Mac-1 immunopositive microglia—macrophages. BALB/c mice, which developed the largest infarcts, contained significantly fewer TNF-producing microglia—macrophages compared with SJL and C57BL/6 mice at both 12 and 24 hours after permanent occlusion of the distal part of the middle cerebral artery. SJL mice developed larger infarcts than C57BL/6 mice, whereas the number of TNF-producing microglia—macrophages per infarct volume unit was comparable. Western blotting data confirmed the increased TNF levels in SJL mice compared with BALB/c and C57BL/6 mice. Furthermore, mice with 12-hour postischemic survival consistently contained two-to threefold more TNF-producing microglia—macrophages than mice with 24-hour survival. The data show that the magnitude of the cellular TNF response to cerebral ischemia is strain dependent, while the time-profile and the cellular sources of TNF are similar irrespective of genetic background. Furthermore, the lack of correlation between infarct size and cellular TNF response suggests that the functionally important TNF is produced in the very early phase (minutes to a few hours) after induction of ischemia, just as it raises the possibility that different mouse strains display different sensitivities to TNF.
Differences in mouse strains play a significant role in susceptibility to different experimental brain disorders (Melvold et al., 1987; Tuohy et al., 1988; Yong et al., 1994; Schauwecker and Steward, 1997; Fox et al., 1999; Owens et al., 2001), including models of both focal (Barone et al., 1993; Connolly et al., 1996; Maeda et al., 1999; Majid et al., 2000) and global cerebral ischemia (Yang et al., 1997; Fujii et al., 1997; Wellons et al., 2000). The different susceptibility to ischemia has been related, at least in part, to differences in vascular anatomy (Yang et al., 1997; Kitagawa et al., 1998; Maeda et al., 1999), and to differences in glutamate-induced neurotoxicity (Schauwecker and Steward, 1997) and neuroanatomy (Lathe, 1996; Laghmouch et al., 1997). Interstrain differences in the production of the potential neurotoxic cytokine TNF (Barone et al., 1997; Nawashiro et al., 1977a, b) have been demonstrated both in vitro and in vivo (Ashman et al., 1995; Inoue et al., 1996; Bebo et al., 1996; Darville et al., 1997). An additional cause of strain-related differences in the neurologic outcome of experimental stroke could therefore be differences in the cellular production of TNF or the cellular sensitivity to TNF.
Tumor necrosis factor is a truly pleiotropic cytokine (Merrill and Benveniste, 1996; Owens et al., 2001; Finsen et al., 2002). Tumor necrosis factor activates the vascular endothelium (Warren, 1990), and stimulates chemokine and adhesion molecule expression (Tessier et al., 1997; Yang et al., 1998), resulting in infiltration of blood-borne leukocytes, primarily macrophages, into the inflamed CNS (Sedgwick et al., 2000). In vitro, and probably in vivo, TNF activates microglia and macrophages, resulting in the production of other inflammatory mediators such as IL-1β (Saito et al., 1996; Loddick and Rothwell, 1996; Stroemer and Rothwell, 1998), IL-6 (Wang et al., 1995; Saito et al., 1996), nitric oxide (Samdani et al., 1997), which all are known to be implicated in cerebral ischemia (Benveniste, 1994), just as it stimulates its own production (Saito et al., 1996). In favor of a neurotoxic effect of TNF are studies showing that administration of TNF binding protein reduces the infarct volume in mice and rats after transient or permanent occlusion of the MCA (Dawson et al., 1996; Nawashiro et al., 1997a; Barone et al., 1997; Yang et al., 1998). Pointing to a neuroprotective effect are findings showing that administration of small amounts of TNF before an ischemic insult induces ischemic tolerance (Nawashiro et al., 1997b), and findings showing that TNF-deficient and TNF-p55-receptor-deficient mice develop larger infarcts than their respective wild-type mice after focal cerebral ischemia (Bruce et al., 1996; Gary et al., 1998; R. Gregersen et al., unpublished data, 2000).
The expression of TNF is increased after focal cerebral ischemia (Buttini et al., 1996; Gregersen et al., 2000), and other types of neurodegenerative conditions in experimental animals (Jensen et al., 2000; Owens et al., 2001) and in humans (Tarkowski et al., 1999). Tumor necrosis factor is produced at an early stage after the induction of focal cerebral ischemia both in mice (Gregersen et al., 2000) and in rats (Wang et al., 1994; Liu et al., 1994; Buttini et al., 1996) at a timepoint when the infarct is still undergoing maturation. The number of TNF mRNA—expressing cells reaches peak values from 12 to 24 hours, at which time TNF is produced primarily by microglia—macrophages located in the border zone of the infarct and within the infarct (Gregersen et al., 2000; Lambertsen et al., 2001). Tumor necrosis factor mRNA-expressing cells are still present at 48 hours, but virtually absent 5 days after surgery (Gregersen et al., 2000).
Here, we investigated the cellular TNF response to focal cerebral ischemia in three inbred mouse strains and in C57x129 F1 hybrid mice. Infarct volumes and absolute and relative numbers of TNF mRNA expressing and TNF immunoreactive cells were compared at 24 hours, when both infarcts and TNF-synthesizing cells are well defined and easy to quantify (Gregersen et al., 2000; Lambertsen et al., 2001). Supplementary data were obtained on mice with 12 hours postsurgical survival. The results of the study showed that there are major strain-dependent differences in the magnitude but, however, not the time profile of the cellular TNF response to focal cerebral ischemia. The data also showed that infarct and periinfarct infiltrating microglia—macrophages were the predominant source of TNF in all strains of mice, and that there were no correlations between infarct size and cellular TNF response at either 12 or 24 hours.
MATERIALS AND METHODS
Animals
Adult male SJL mice were obtained from Bomholtgaard A/S (Ry, Denmark) or Harlan-Sprague Dawley (Indianapolis, IN, U.S.A.). Male and female BALB/c and male C57Black/6 (C57BL/6) mice were bred in the animal facility at the Montreàl Neurological Institute (Montreàl, Canada) or obtained from Bomholtgaard A/S and were transferred to the animal facility at the University of Southern Denmark, Odense University. C57x129 mice were bred in the animal facility, University of Southern Denmark, Odense University, by mating C57BL/6 and 129/Sv mice originally obtained from Bomholtgaard A/S. All mice were housed under diurnal lighting conditions and allowed free access to food and water. Animal procedures were approved by the Danish Animal Health Care Committee (J. no. 1995–101–73).
Permanent middle cerebral artery occlusion
Permanent occlusion of the MCA was performed as previously described in detail (Moller et al., 1995; Gregersen et al., 2000) in the four different mouse strains; SJL (25.2 g ± 2.6 g, n = 16), BALB/c (27.5 g ± 3.9 g, n = 14), C57BL/6 (26.8 g ± 2.5 g, n = 12), and the hybrid C57x129 (39.4 g ± 2.3 g, n = 9). Mice were anesthetized by subcutaneous injection of a 1:1:2 mixture of Hypnorm (fentanyl citrate 0.315 mg/mL and fluanisone 10 mg/mL, Jansen-Cilag), Stesolid (5 mg/mL Diazepamum, Dumex), and distilled H2O (SJL 0.21 mL/10 g; BALB/c 0.22 mL/10 g; C57BL/6 and C57x129 0.16 mL/10 g). Mice were placed on a heating pad (37°C ± 0.5°C) and a skin incision between the lateral part of the orbit and the external auditory meatus was made. The superior pole of the parotid gland and the upper part of the temporal muscle were pushed aside after partial resection. A burr-hole was drilled directly over the distal part of the MCA, the dura mater was removed, and the MCA was coagulated by applying bipolar forceps coupled to an electrosurgical unit. The incisions were closed and the mice were supplied with 1 mL of physiologic 0.9% saline to prevent dehydration, and the eyes were coated with ointment to protect drying. Mice were returned to their cages and were allowed to recover from anesthesia in a 28°C controlled environment. Postoperative care consisted of supplying the mice with subcutaneous injections of physiologic 0.9% saline.
Brain tissue processing and determination of infarct volume
Mice were decapitated after cervical dislocation 12 or 24 hours after permanent occlusion of the MCA, and the brains were removed and rapidly frozen in CO2-snow. Brains were cut into serial 30-μm cryostat sections, mounted on RNAse-free super frost plus (Hounisen, Denmark) or gelatin-treated glass slides, and stored in sealed boxes at −80°C until further tissue processing. Every sixth section was stained with toluidine blue for determination of infarct volume using the Computer Assisted Stereological Test Grid System (Olympus, Denmark) and the Cavalieri principle for volume estimation (Moller et al., 1995; Gregersen et al., 2000).
Tumor necrosis factor mRNA in situ hybridization
AP-labeled oligo DNA probes were purchased from DNA Technology A/S (Aarhus, Denmark). In situ hybridization for TNF mRNA was performed as described in detail by Lambertsen et al. (2001). In brief, sections were air dried and fixed in 96% ethanol, at 4°C overnight. In situ hybridization was performed with a mixture of two 28′mer AP-labeled oligo DNA probes (3 pmol/mL of each probe) complementary to bases 305–332 (5′-CTTCTCATCCCTTTGGGGACCGATCACC) and 570–597 (5′-GTAGTCGGGGCAGCCTTGTCCCTTGAA) of murine TNF cDNA (Pennica et al., 1985) in a hybridization buffer containing 50% formamide, 0.1 mol/L Tris-HCl (pH 7.5), 4 × SSC (1 × SSC = 150 mmol/L NaCl and 15 mmol/L sodium citrate), 1 × Denhardt solution [0.04 g of polyvinylpyrrolidone (Sigma-Aldrich, Vallensbæk Strand, Denmark) and 0.04 g of bovine serum albumin (Sigma-Aldrich)], 10% dextran sulphate (Pharmacia Biotech, Hørsholm, Denmark), and 500 μg/mL single-stranded salmon sperm DNA (Sigma-Aldrich) for 20 hours at 37°C. After hybridization, the sections were rinsed 3 × 30 minutes in 1 × SSC (pH 8.0) at 55°C, 2 × 10 minutes in Tris-HCl (0.01 mol/L Tris-HCl and 0.15 mol/L NaCl, pH 9.5) at RT, and immersed in a freshly made AP-developer containing 4.5 μL NBT (Sigma-Aldrich) stock solution (70 mg/mL NBT in 70%N,N-dimethylformamide), 3.4 μL BCIP (Sigma-Aldrich) stock solution (50 mg/mL BCIP in 100%N,N dimethylformamide) in 1 mL Tris-HCl-MgCl2 (0.1 mol/L Tris-HCl, 0.1 mol/L NaCl, and 0.05 mol/L MgCl2·6H2O, pH 9.5) for 3 days in the dark at RT. Development was arrested in distilled water and sections coverslipped in Aquatex.
The specificity of the probes and the hybridization reaction was tested by hybridizing parallel sections with (1) each probe alone, (2) or a cocktail of the two probes, (3) digesting the sections with RNase “A” (Pharmacia Biotech) before hybridization, and (4) hybridizing with a 100-fold excess of each of the unlabeled TNF probes. Finally, as a test for the quality of the tissue, one glass slide from each animal was hybridized for GAPDH mRNA using a probe (5′-XCCTGCTTCACCACCTTCTTGATGATGTCA) (1 pmol/mL), complementary to bases 833–859 of murine GAPDH cDNA (Sabath et al., 1990). Sections hybridized with the GAPDH probe showed a distinctly different, largely neuronal in situ hybridization signal (data not shown).
Immunohistochemistry for tumor necrosis factor
Immunohistochemistry for TNF was performed using a two-step procedure using an AP-conjugated secondary antibody (Lambertsen et al., 2001). In brief, sections were air dried and fixed in 4% paraformaldehyde for 7 minutes. After washes in TBS (pH 7.4) for 15 minutes, and TBS + 1% Triton (Sigma-Aldrich) (pH 7.4) for 15 minutes, sections were incubated with 10% FCS (Gibco BRL, Glasgow, Scotland) in TBS for 30 minutes, at RT, and then incubated with a 1:200 dilution of the polyclonal rabbit anti-murine TNF antibody (Endogen, Woburn, MA, U.S.A.) for 24 hours at 4°C. The following day, sections were rinsed 3 × 15 minutes in TBS + 1% Triton and primary antibody was visualized using a 1:100 dilution of the AP-conjugated antibody to rabbit Ig (Sigma-Aldrich) for 1 hour at RT and the AP-developer used for in situ hybridization containing 1 mol/L levamisole (Sigma-Aldrich). Finally, the development was arrested in distilled water and the sections coverslipped in Aquatex. Control reactions for antibody specificity were performed on parallel sections by (1) preabsorbing the antibody with 10-fold excess of recombinant TNF (Sigma-Aldrich) before application to brain sections, (2) substitution of the primary antibody with rabbit serum, and by (3) omission of primary antibody in the protocol.
Combined in situ hybridization for tumor necrosis factor mRNA and immunohistochemistry for glial fibrillary acidic protein
The combined procedure was performed as described in Lambertsen et al. (2001). Sections were fixed in 4% paraformaldehyde for 5 minutes and rinsed in 2 × SSC for 2 × 30 minutes at RT. The sections were hybridized with a mixture of the 2 TNF probes (10 pmol/mL of each probe) overnight at 37°C. Next day, the sections were rinsed in 1 × SSC for 3 × 30 minutes at 55°C, followed by 2 × 5 minutes in a Tris-Mg2+ buffer (0.1 mol/L Tris-HCl, 1 mol/L NaCl, and 2 mmol/L MgCl2, pH 7.5) at RT. Sections were rinsed 2 × 25 minutes in Tris-Mg2+ buffer containing 10% FCS and 0.1% Triton at RT and incubated with polyclonal rabbit anti-bovine GFAP (anti-GFAP) antibody (Dako A/S, Glostrup, Denmark) diluted 1:1,800 in Tris-Mg2+ containing 10% FCS at 4°C overnight. After 3 × 15-minute rinses in Tris-Mg2+ buffer, species-specific biotinylated donkey anti-rabbit Ig (Amersham Pharmacia Biotech UK, Little Chalfont, Buckinghamshire, U.K.) diluted 1:200 in Tris-Mg2+ and 10% FCS was applied for 1 hour at RT. Endogenous peroxidases were blocked with 100 mL of methanol and 200 μL of H2O2 for 30 minutes at RT. Next, the sections were rinsed 3 times in Tris-Mg2+-buffer, incubated with horseradish peroxidase—conjugated streptavidin (Dako A/S) diluted 1:200 in Tris-Mg2+ with 10% FCS for 1 hour at RT, and rinsed 3 × 10 minutes in Tris-Mg2+, and 10 minutes in TBS, pH 7.5 at RT. Peroxidase development was performed using 0.025% diaminobenzidine and 0.006% H2O2 diluted in TBS, pH 7.4. Sections were rinsed in TBS for 10 minutes followed by 2 × 10 minutes in Tris-Mg2+-buffer and 2 × 10 minutes in Tris-HCl at RT. Finally, the in situ hybridization signal was developed in the NBT/BCIP developing solution as already described, and the sections were mounted in Depex.
Double immunohistochemistry for tumor necrosis factor and microglia—macrophages
Double immunohistochemistry was performed as previously described in detail by Lambertsen et al. (2001). Briefly, air-dried fresh-frozen sections were fixed in 4% paraformaldehyde for 7 minutes, rinsed in TBS + 1% Triton, pH 7.4, for 30 minutes and treated with 10% FCS in TBS for 30 minutes at RT. Next, sections were incubated with a rat monoclonal antibody to murine macrophage—associated antigen-1 (Mac-1/CD11b) (Serotec, Kidlington, U.K.) diluted 1:600 in TBS and 10% FCS overnight at 4°C. The next day, sections were rinsed 3 × 15 minutes in TBS + 1% Triton at RT and reacted for 1 hour with species-specific biotinylated sheep anti-rat Ig (Amersham) diluted 1:200 in TBS and 10% FCS at RT. The sections were then rinsed 3 × 15 minutes in TBS + 1% Triton, incubated for 1 hour with horseradish peroxidase—conjugated streptavidin diluted 1:200 in TBS and 10% FCS, rinsed 3 × 15 minutes in TBS and developed 7 minutes in 0.05% DAB and 0.033% H2O2 in TBS at RT. At this stage, the sections were transferred to the protocol for TNF immunohistochemistry as described before.
Western blotting for tumor necrosis factor
Western blotting for TNF was performed as previously described (Gregersen et al., 2000; Lambertsen et al., 2001). SJL, BALB/c, and C57BL/6 mice were given an overdose of pentobarbital (Den kgl. Veterinjr-og Landbohøjskoles Apotek, Copenhagen, Denmark) 24 hours after the induction of ischemia and perfused with ice-cold 0.1 mol/L phosphate-buffered saline through the heart. The brains were removed, dissected into the ipsi-and contralateral cortex, and placed in RIPA buffer. The tissue was homogenized and a protein estimation was performed at 595 nm on a spectrophotometer. Samples of 20 μg of protein from each mouse was loaded on a 10% Bis-Tris gel (Novex, San Diego, CA, U.S.A.) and electrophoresed in MES—sodium dodecyl sulfate running buffer (Novex) at 200 V for approximately 35 minutes. Proteins were transferred to a polyvinylidene difluoride membrane at 30 V for 1 hour and the membrane was blocked in 2.5% powdered milk (Matas, Odense, Denmark) dissolved in TBS + 0.05% Tween 20 for 10 minutes at RT. The membrane was rinsed 3 × 15 minutes in TBS + 0.05% Tween 20, incubated with a polyclonal rabbit anti-mouse TNF antibody (TriChem, Copenhagen, Denmark) diluted 1:50 in TBS overnight at 4°C. Next day, the membrane was rinsed in TBS + 0.05% Tween 20 for 3 × 15 minutes, incubated with an AP-conjugated antibody to rabbit Ig (Sigma-Aldrich) diluted 1:100 in TBS for 1 hour at RT, and finally rinsed 3 × 15 minutes in TBS + 0.05% Tween. Visualization of protein bands was performed by rinsing the membrane in 10 mmol/L Tris-HCl buffer and developing the signal in the AP developer used for in situ hybridization as described herein.
Quantification of tumor necrosis factor mRNA-expressing and tumor necrosis factor immunoreactive cells
The advantage of estimating the total number of cells instead of the density of cells (number of cells per area) is that total numbers are unaffected by differences in the size of the infarcted hemisphere because of differences in ischemia-induced edema formation or shrinkage/tissue resorption. Using an approximated stereologic counting technique (see below), TNF mRNA—expressing and TNF immunoreactive microglia—macrophages were counted within the infarcted area and in periinfarct areas, yielding an estimate of the total number of TNF mRNA—expressing and TNF immunoreactive microglia—macrophages in the different mouse strains. In practice, cells with a clearly identifiable nucleus surrounded by a moderate to strong in situ hybridization signal (Figs. 1A,C,E,G) or an immunohistochemically stained perinuclear cytoplasm (Figs. 1B,D,F) were counted on approximately 15 sections separated by 360 μm, from each animal using a ×100 objective and a 4,630-μm2 frame area stepping 200 μm/200 μm in the XY-position using the Computer Assisted Stereological Test Grid System (Olympus, Denmark). The total number (N) of TNF mRNA—expressing and TNF immunoreactive microglia—macrophages in each animal was estimated using the formula: Estimate of N = ΣQ × (1/ssf) × (1/asf) × (1/tsf), where 1/tsf is the thickness sampling fraction (1/tsf = 1), 1/ssf the sampling section fraction (1/ssf = 12), and 1/asf the area sampling fraction (40,000/4,630) as described by West et al. (1996).
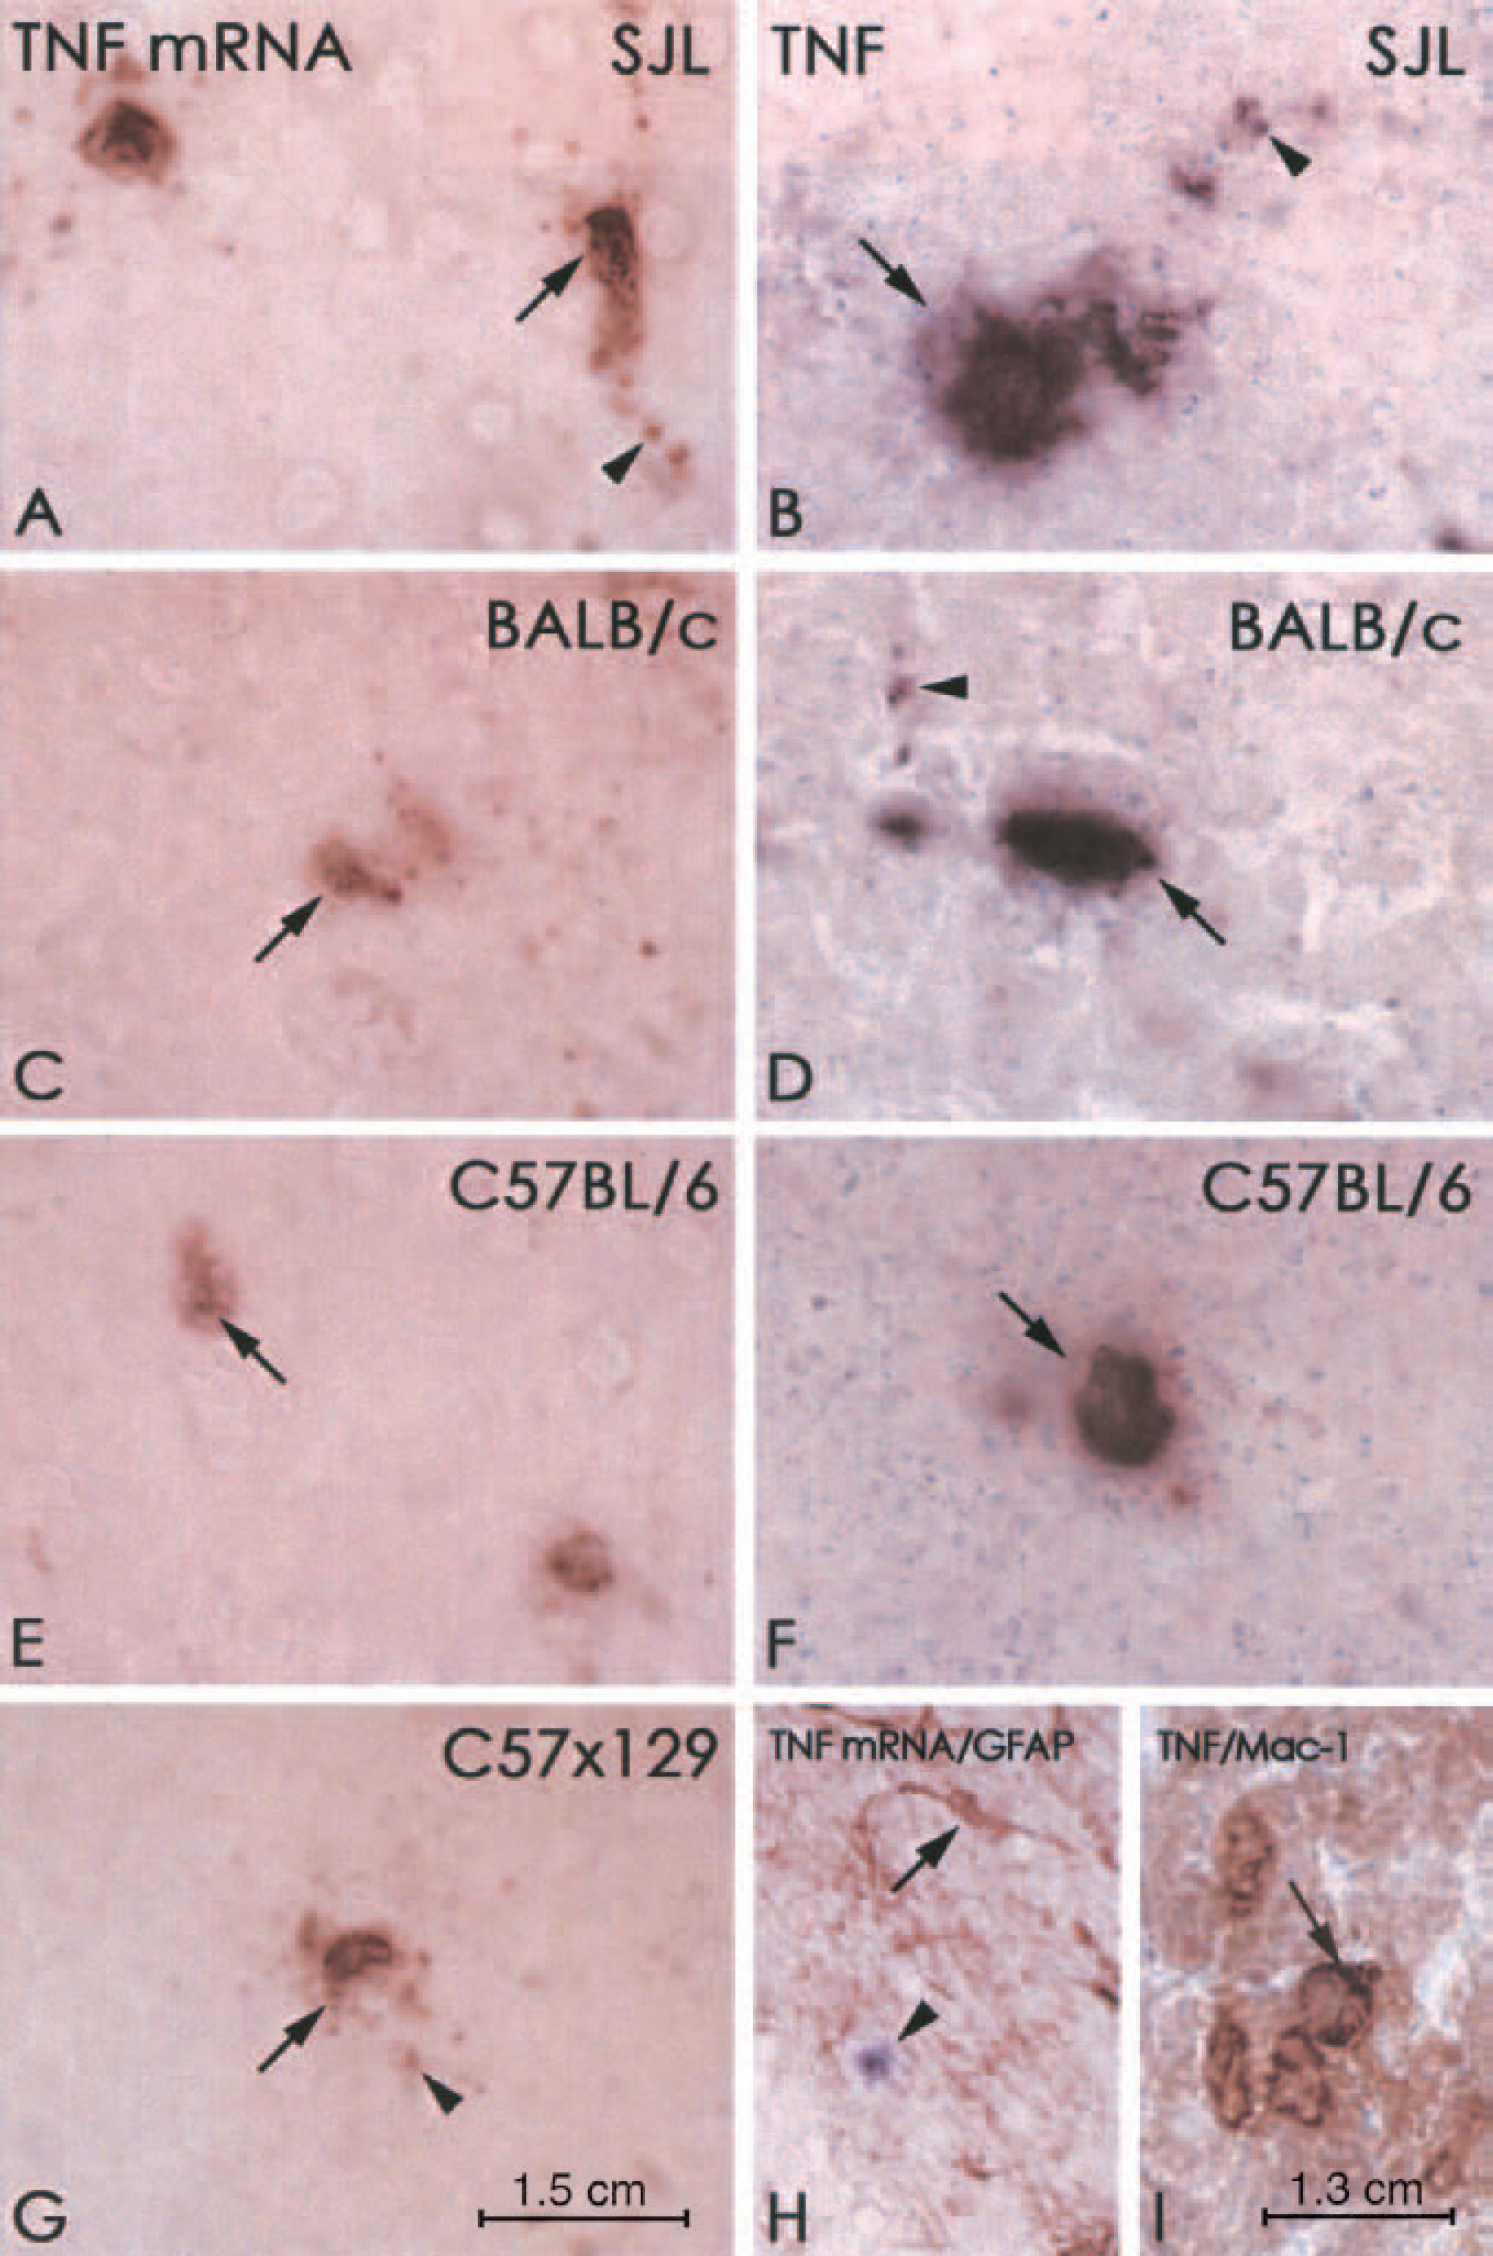
Microglial—macrophage synthesis of TNF mRNA and protein 24 hours after permanent occlusion of the middle cerebral artery.
The reason for using this approximated counting procedure, with 1/tsf = 1, was that the thickness (t) of the sections calculated in three different animals was insufficient to perform unbiased stereologic estimations with an optical disector (Gundersen, 1986; West et al., 1996). Thus, measurements of the total thickness of the sections at five randomly chosen locations within the infarct and 5 points within the periinfarct in 10 sections from each animal revealed a thickness of only 6.8 μm ± 0.4 μm within the infarct and 10.0 μm ± 0.5 μm within the periinfarct for the in situ hybridized sections, and 6.1 μm ± 1.0 μm within the infarct and 9.5 μm ± 2.6 μm within the periinfarct for the immunohistochemically reacted sections. We therefore decided to count cells in the entire height of the section, estimating that the bias introduced in the otherwise unbiased counting procedure would be negligible compared with the error that would result from comparisons of the density of TNF synthesizing cells in representative sections.
The rostrocaudal distribution of TNF mRNA—expressing and TNF immunoreactive microglia—macrophages was analyzed by dividing the total number of TNF mRNA—expressing and TNF immunoreactive microglia—macrophages per section by the corresponding infarct area as measured on the toluidine blue—stained sections. The number of cells per volume unit was estimated by dividing the total numbers of TNF mRNA—expressing and TNF immunoreactive cells by the corresponding infarct volume.
Data analysis
For statistical analysis of differences between infarct volumes and differences in the total number of TNF mRNA—expressing and TNF immunoreactive microglia—macrophages among the different mouse strains at 12 and 24 hours after MCA occlusion, Kruskal-Wallis nonparametric analysis of variance was used with nonparametric two-tailed Mann-Whitney follow-up test for comparison between 2 groups. For statistical analysis of a significant correlation between the total number of TNF mRNA—expressing or TNF immunoreactive cells and infarct volume, simple linear regression was used. Data are shown as mean ± SD, and statistical significance was set at P < 0.05.
RESULTS
Histopathological changes observed 12 and 24 hours after permanent middle cerebral artery occlusion
Permanent occlusion of the MCA produced a reproducible, well-demarcated pale-staining area of pannecrosis in the ipsilateral frontal and parietal cortices in all mouse strains, as visualized at both 12 and 24 hours after MCA occlusion by the toluidine blue staining (Fig. 2, shown for 24 hours only). Analysis of the composition of the cellular infiltrate in the border zone of the infarcts showed the presence of moderate numbers of large mononuclear cells, presumably blood-borne macrophages, and only sporadic polymorphonuclear leukocytes in the different strains of mice at both 12 and 24 hours after the induction of ischemia.
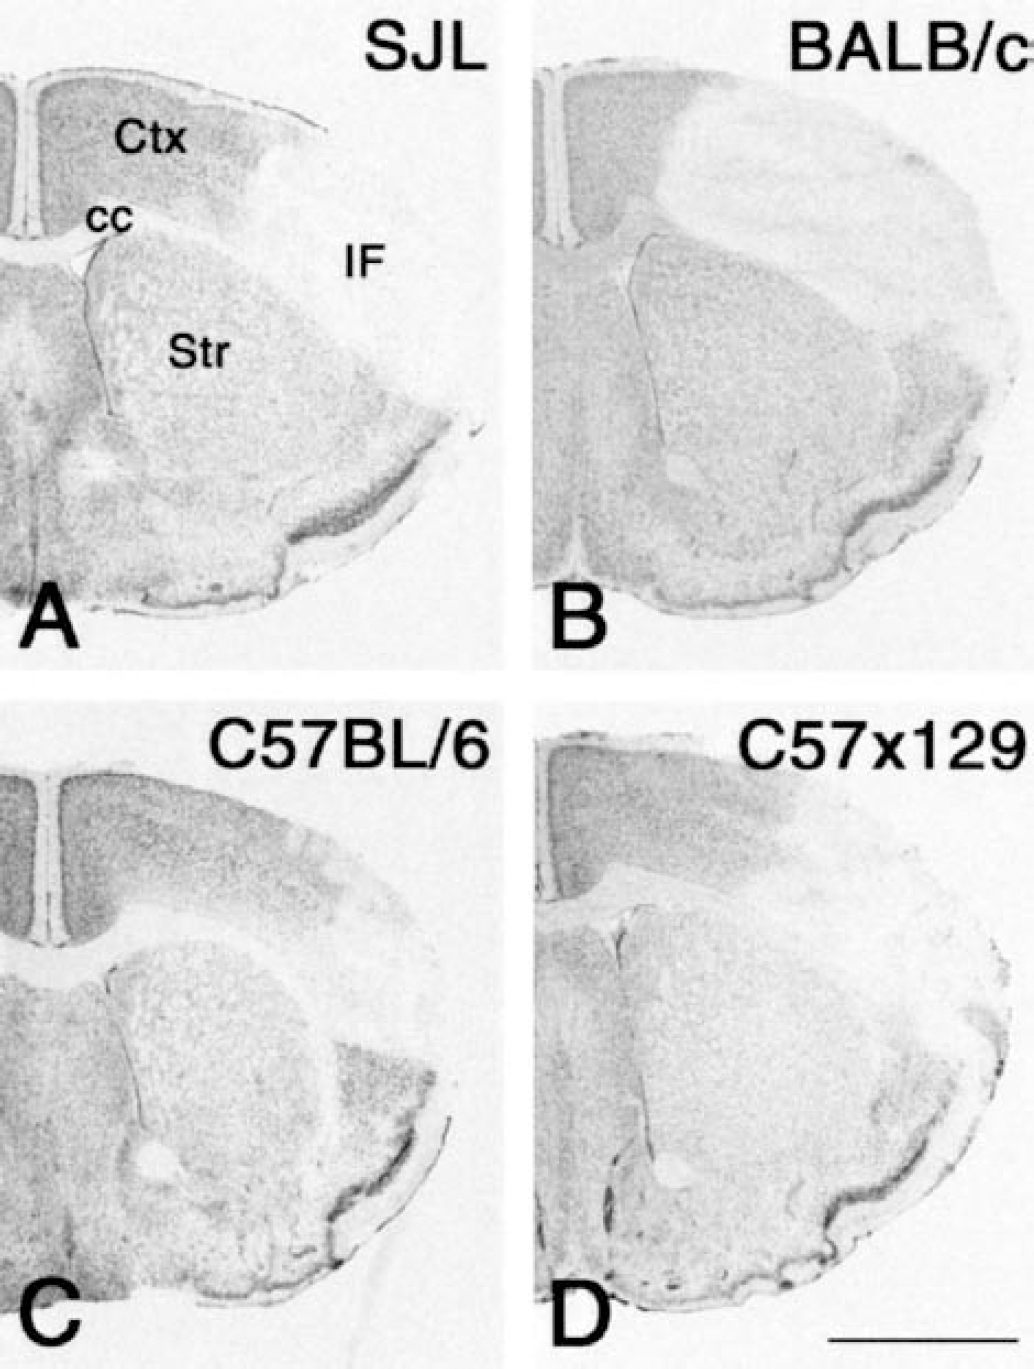
Toluidine blue staining showing the size of ischemic brain damage in
Microglia—macrophages are the major producers of tumor necrosis factor in focal cerebral ischemia irrespective of mouse strain
The specificity of the in situ hybridization signal was documented by the finding of an identical regional and cellular localization of the in situ signal in sections hybridized with each probe alone, and a significantly stronger signal in sections hybridized with the probe mixture. Similarly, sections pretreated with RNase “A” before hybridization, or hybridized with a 100-fold excess of unlabeled TNF probe mixture, or buffer alone, were devoid of signal. In support of the specificity of the immunohistochemical staining, sections reacted with immune serum preabsorbed with TNF, buffer and FCS, or rabbit serum were completely blank (data not shown).
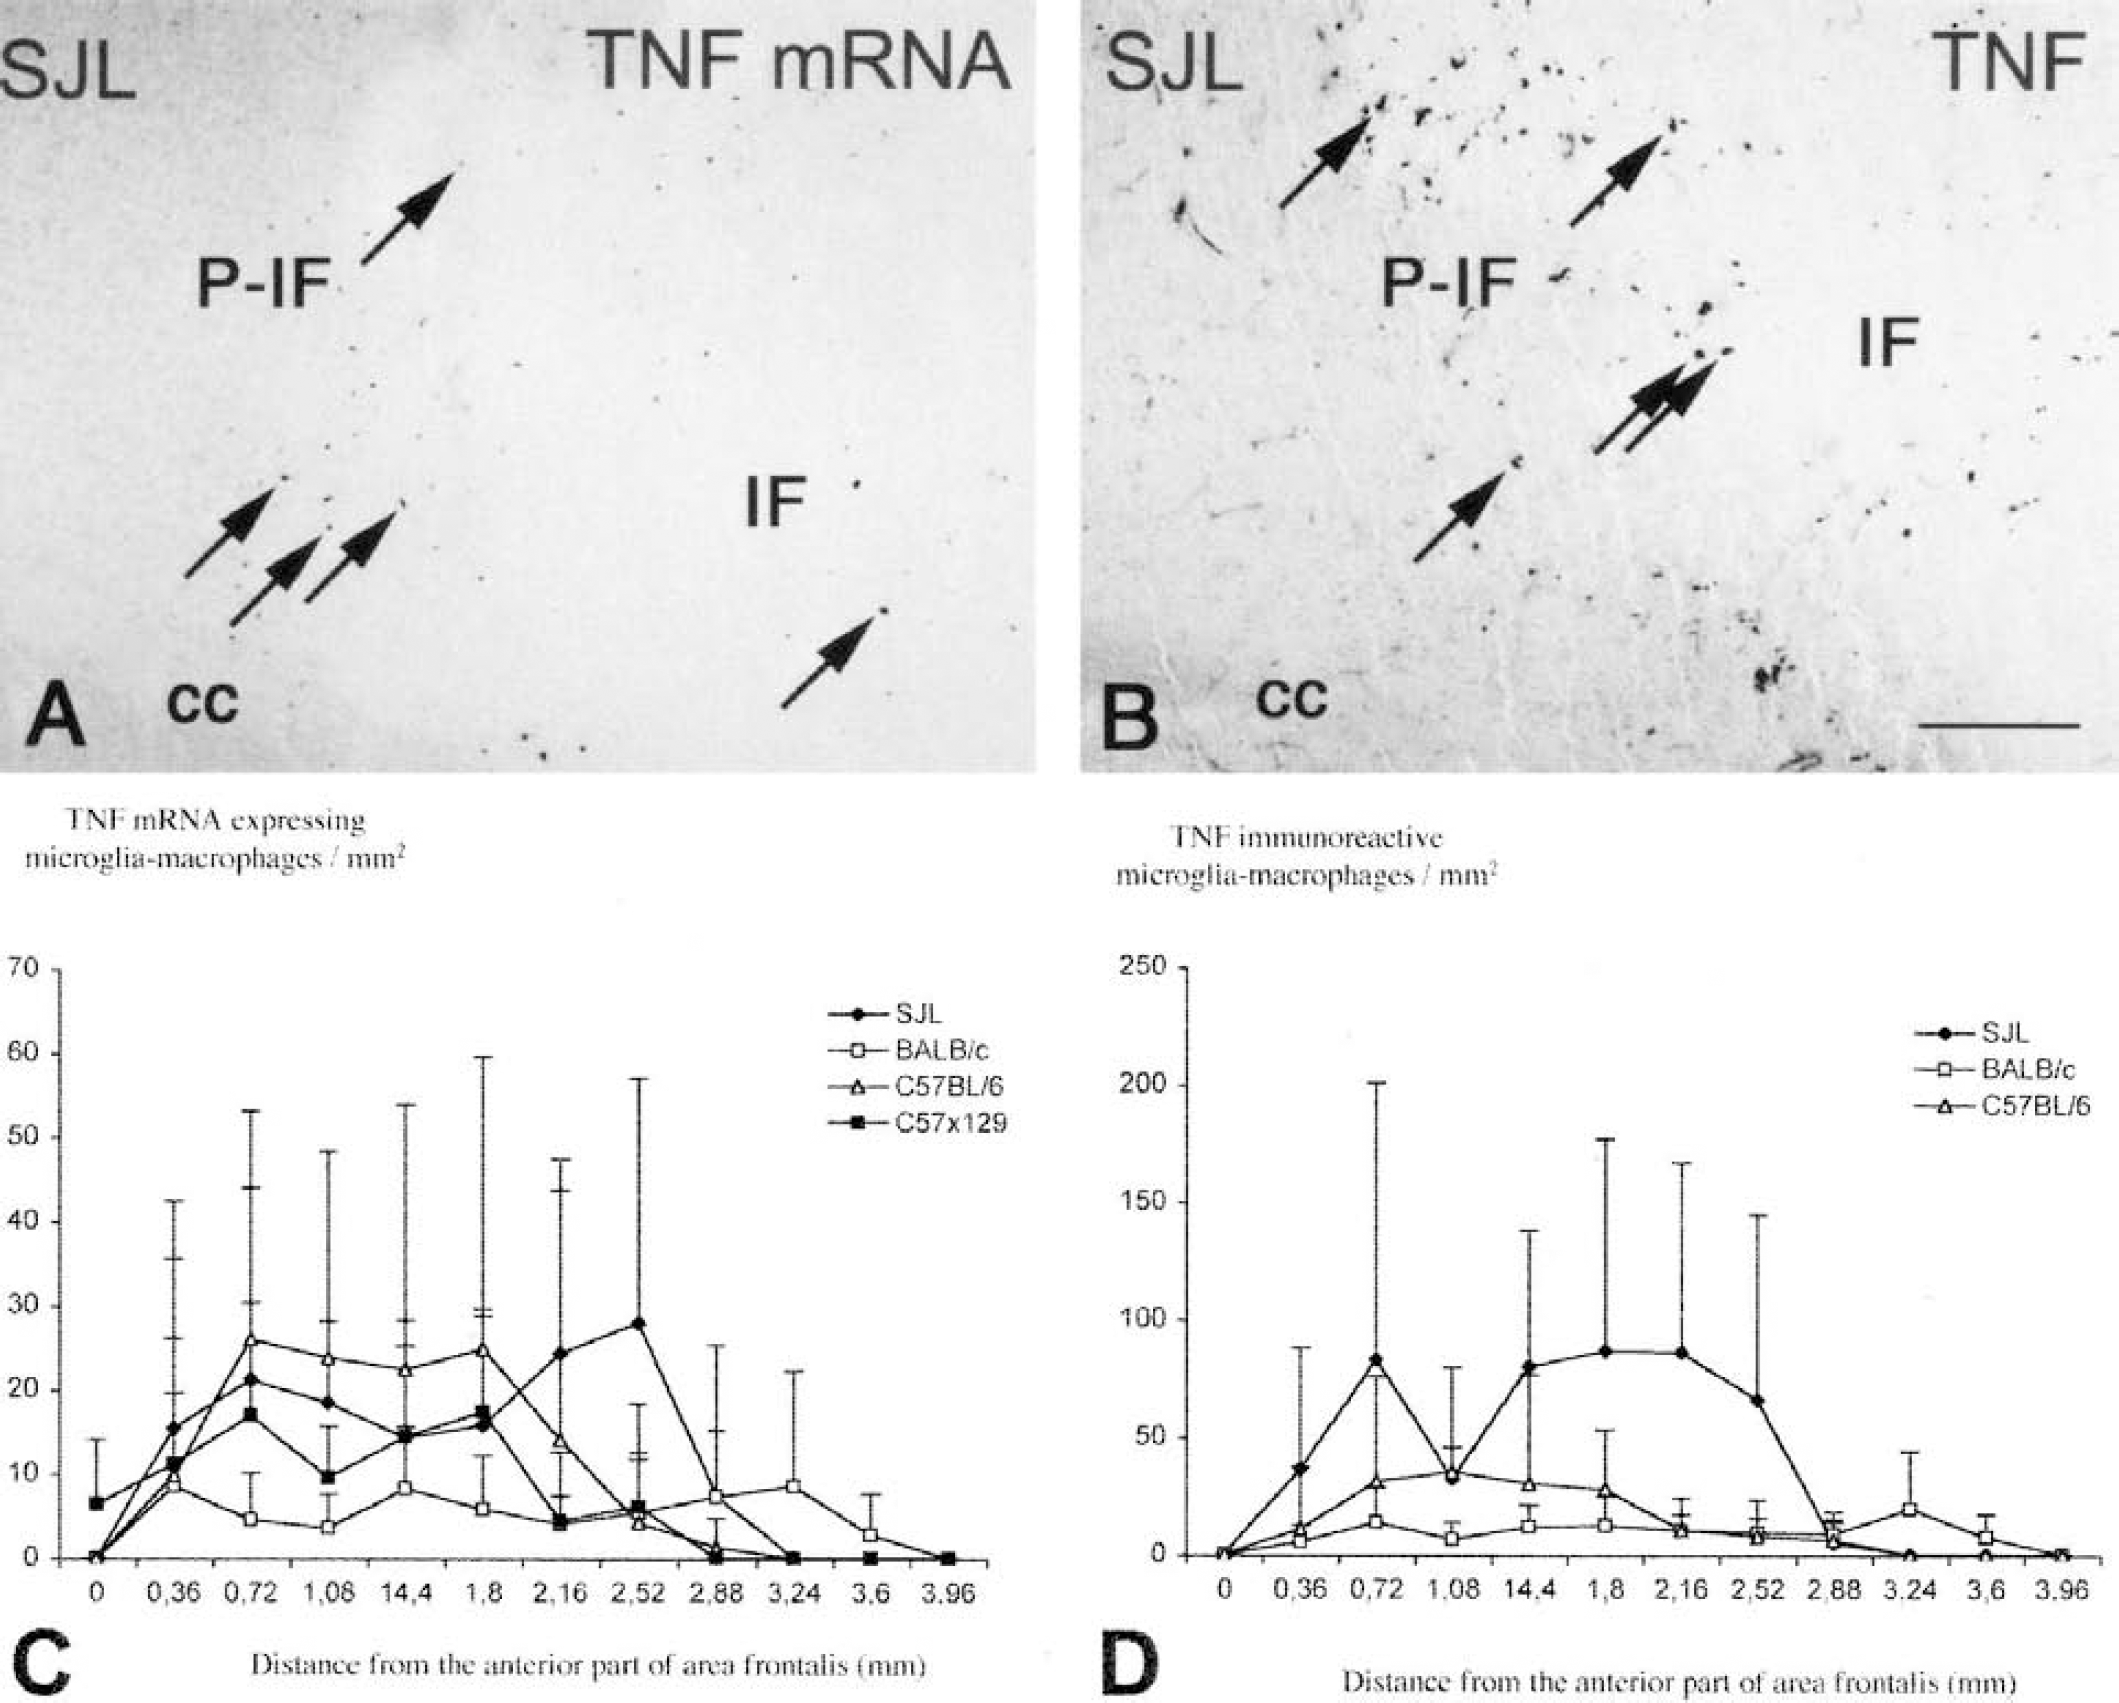
In all mouse strains, TNF mRNA—expressing and TNF immunoreactive cells were located in periinfarct areas and in the periphery of the infarcts at both 12 and 24 hours after permanent occlusion of the MCA (Figs. 3A,B, and 4A,B, shown for the SJL mouse only). As previously reported (Gregersen et al., 2000; Lambertsen et al., 2001), the TNF in situ hybridization signal and immunoreactivity was located to the perinuclear cytoplasm and the proximal processes of cells with microglial—macrophage morphologies in all four mouse strains (Figs. 1–A and 3B). In line with these data, combining the in situ hybridization protocol for TNF mRNA with immunohistochemistry for GFAP (Fig. 1H) and performing double immunohistochemistry for TNF and the microglia—macrophage Mac-1 antigen (Fig. 1I) confirmed our previous findings of a nonastrocytic, microglial—macrophage origin of TNF mRNA (Gregersen et al., 2000; Lambertsen et al., 2001).
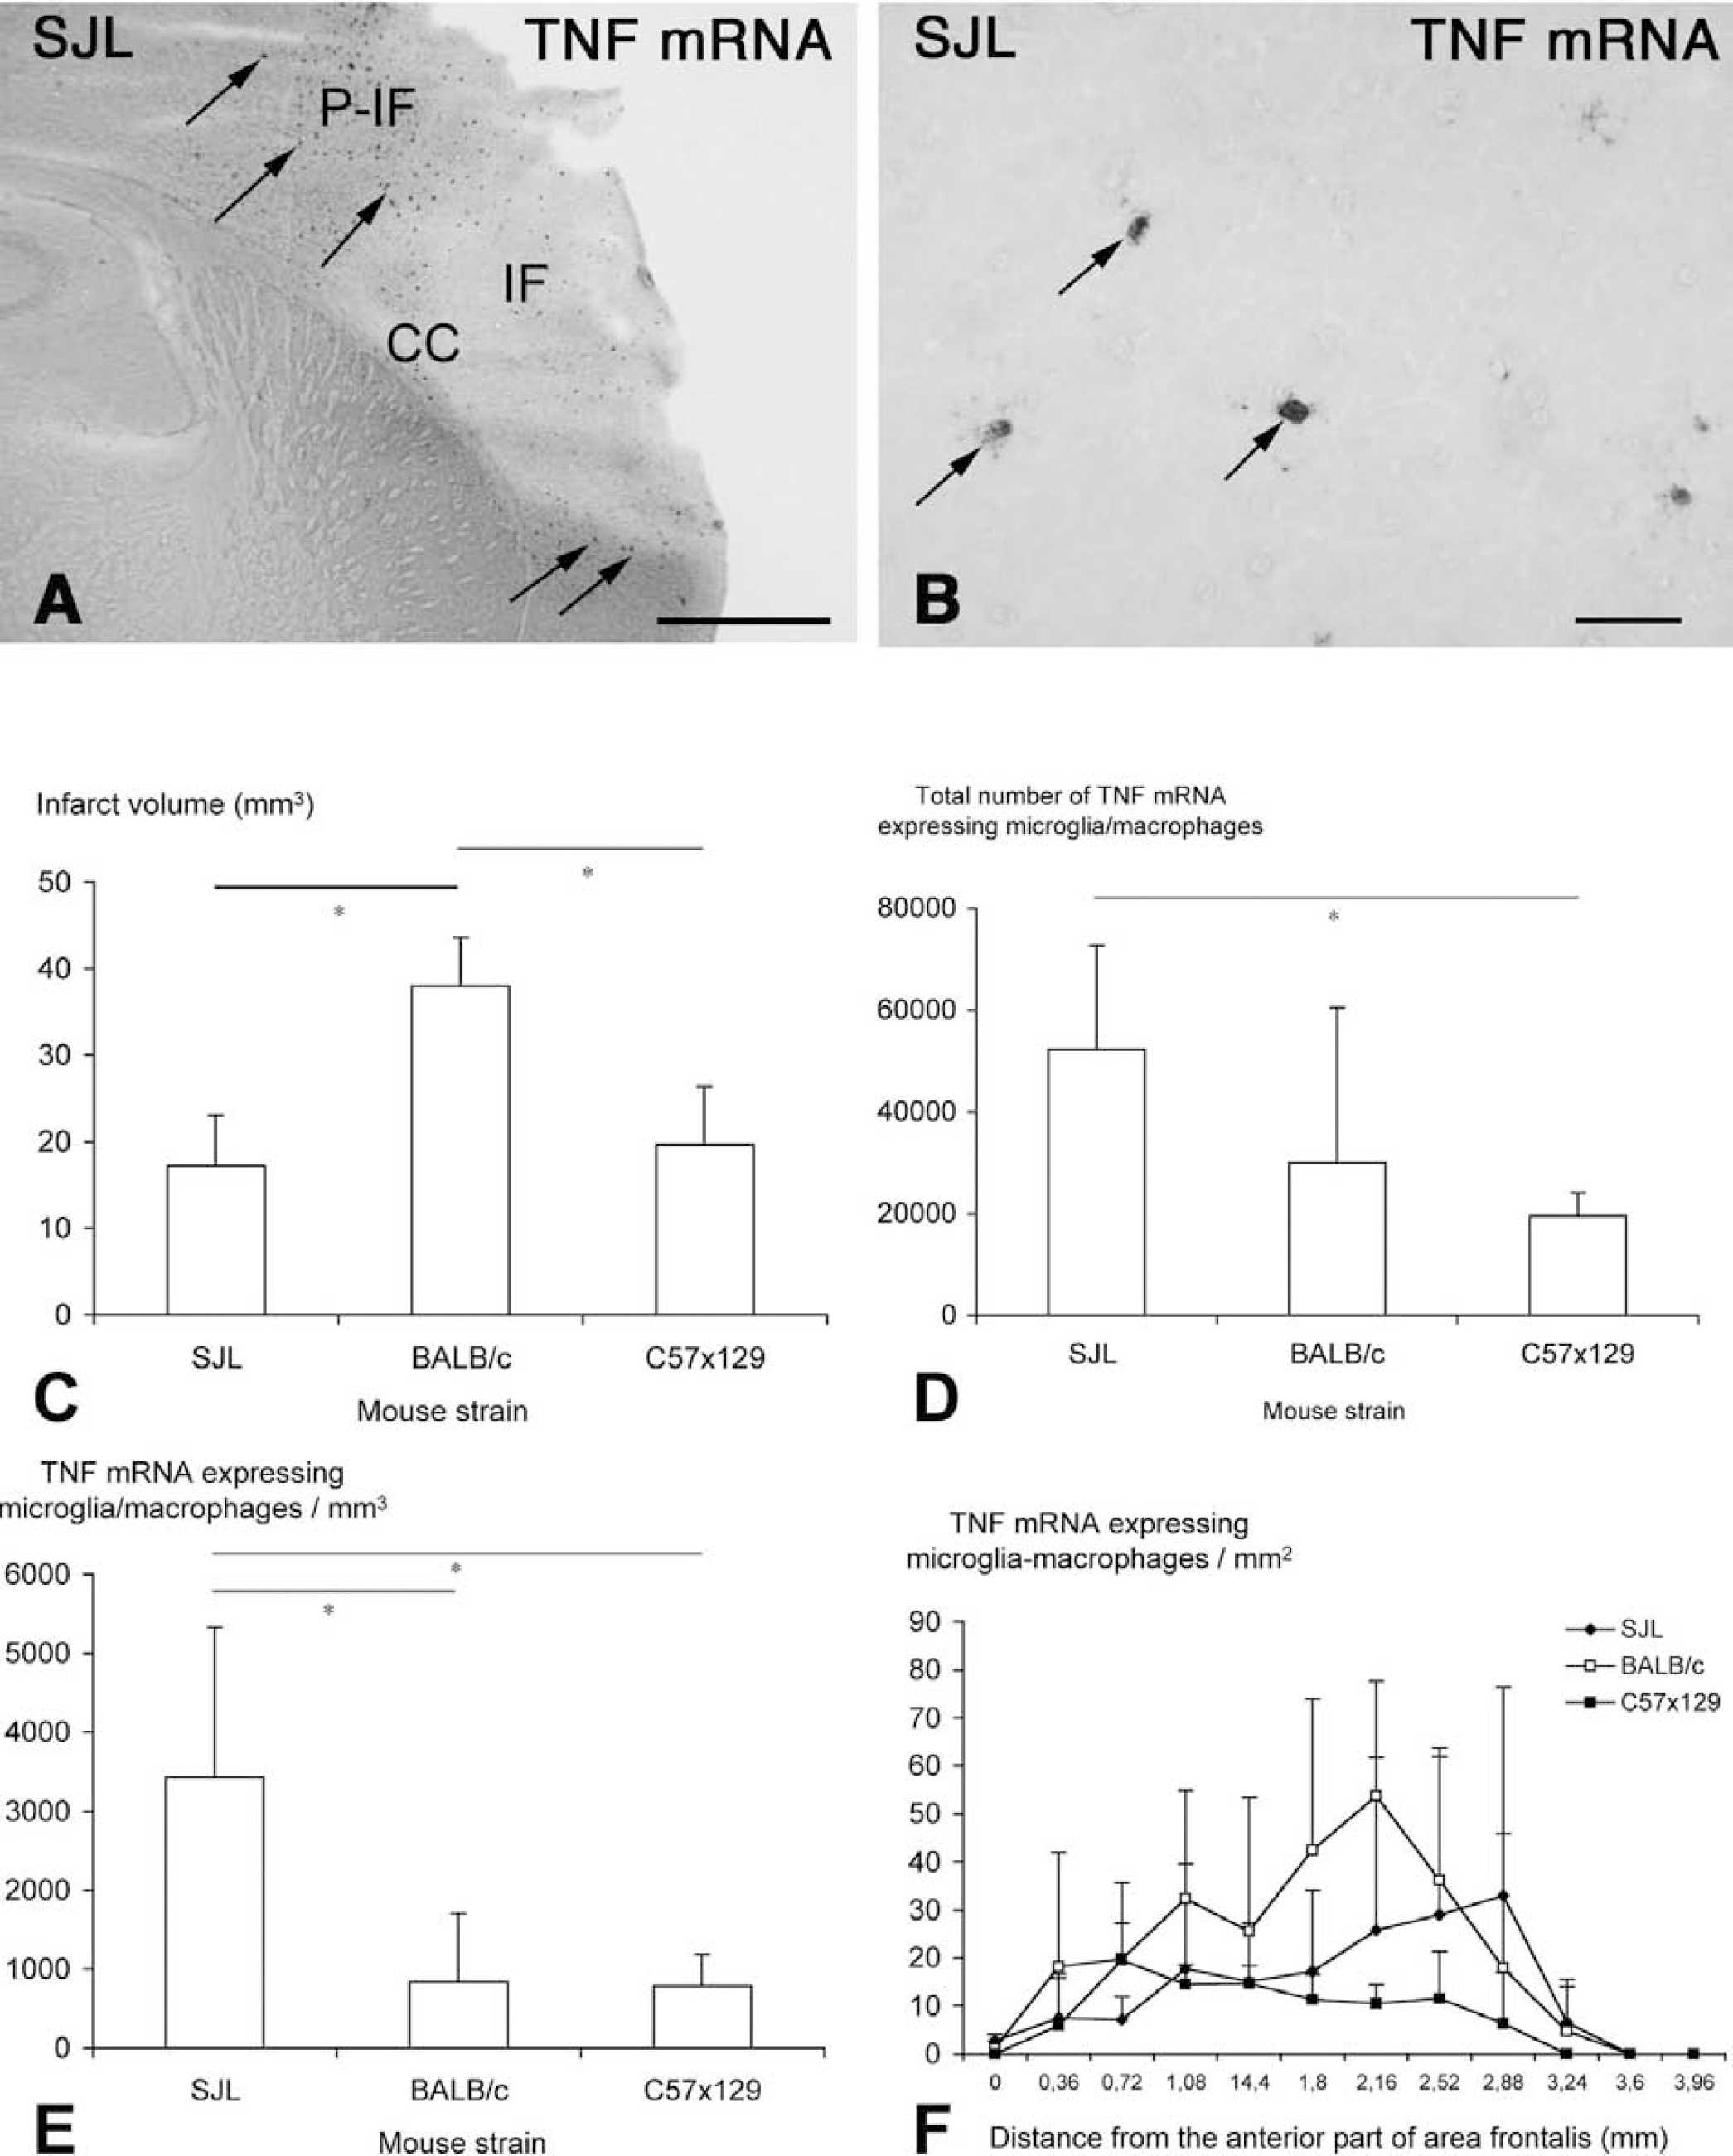
Strain-related differences in infarct volume and TNF response 12 hours after permanent occlusion of the MCA.
Strain-related differences in infarct volume 24 hours after permanent middle cerebral artery occlusion
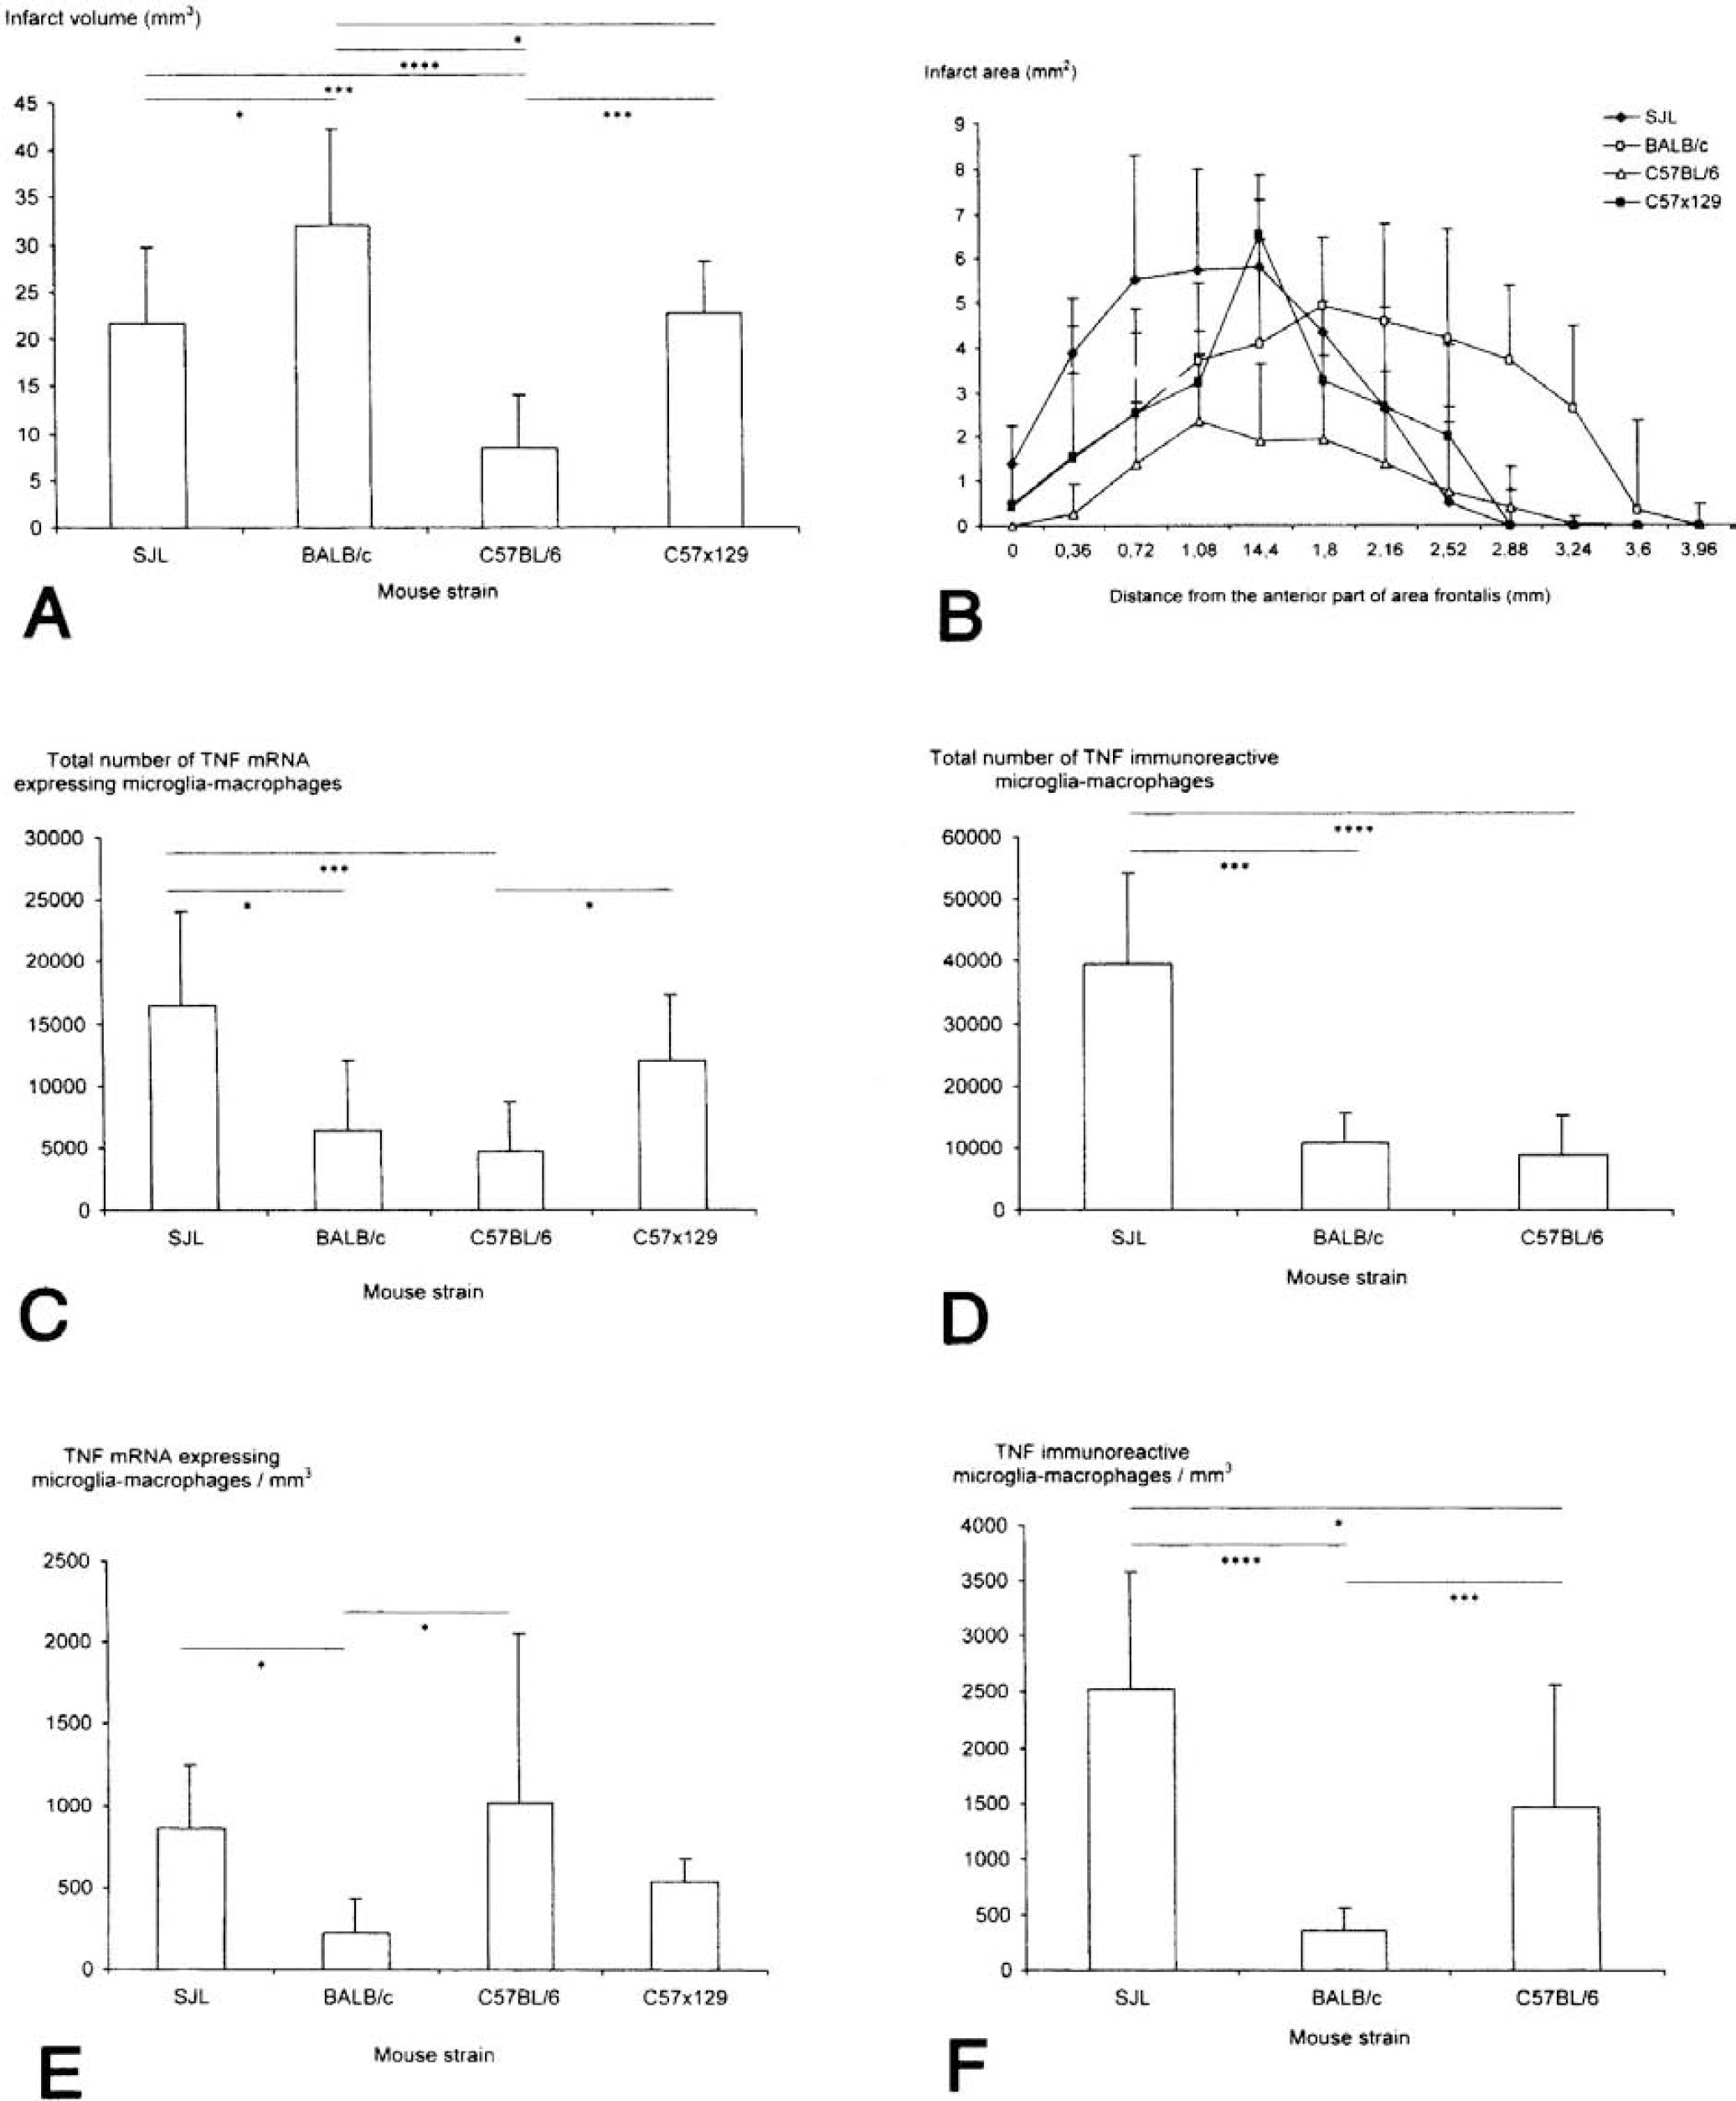
For comparison of the infarct volumes between the different mouse strains, we used the Cavalieri principle for infarct volume estimation on toluidine blue—stained sections. At 24 hours, BALB/c mice developed significantly larger infarct volumes than those observed in SJL mice, C57BL/6 mice, and C57x129 mice (Figs. 2 and 5A) despite identical experimental conditions. Furthermore, C57BL/6 mice had significantly smaller infarct volumes than SJL mice and C57x129 mice at 24 hours (Fig. 5A). Infarct volumes were 21.7 mm3 ± 8.1 mm3 for the SJL strain (n = 9), 32.2 mm3 ± 10.0 mm3 for the BALB/c strain (n = 8), 8.4 mm3 ± 5.7 mm3 for the C57BL/6 strain (n = 12), and 22.8 mm3 ± 5.4 mm3 for the C57x129 hybrid mice (n = 5). Comparison of the rostrocaudal MCA distribution in the different strains of mice at 24 hours showed that the infarcts were distributed similarly in SJL, C57BL/6, and C57x129 mice. However, the BALB/c mice displayed a larger MCA distribution area compared with the other mouse strains (Fig. 5B).
Strain-related differences in infarct volume and TNF response 24 hours after permanent occlusion of the MCA.
Strain related differences in microglial-macrophage tumor necrosis factor response 24 hours after permanent middle cerebral artery occlusion
In order to establish whether there were strain-related differences in the ischemia-induced TNF response, we estimated and compared the total number of TNF mRNA—expressing microglia—macrophages in all 4 mouse strains at 24 hours after MCA occlusion using an approximated stereological counting technique. The SJL strain contained significantly larger numbers of TNF mRNA—expressing microglia—macrophages than C57BL/6 mice and BALB/c mice (Fig. 5C). The C57x129 hybrid mice contained significantly larger numbers of TNF mRNA—expressing microglia—macrophages compared with C57BL/6 (Fig. 5C). When estimated as the number of TNF mRNA—expressing microglia—macrophages per infarct volume both SJL and C57BL/6 mice contained significantly larger numbers of TNF mRNA—expressing microglia—macrophages per infarct volume compared with BALB/c mice (Fig. 5E). The difference observed between C57BL/6 and C57x129 did not reach significance. The TNF mRNA—expressing microglia—macrophages were located evenly along the rostrocaudal axis similar to the infarct distribution in all mouse strains (Figs. 4A,C). There was no correlation between the infarct volume and the total number of TNF mRNA—expressing cells 24 hours after MCA occlusion neither when each strain was correlated alone (SJL R = 0.15, P = 0.7; BALB/c R = −0.16, P = 0.74; C57BL/6 R = 0.05, P = 0.88; C57x129 R = 0.92, P = 0.08) or when all strains were correlated together (R = 0.17, P = 0.36).
Immunohistochemistry for TNF was only performed for the SJL, BALB/c and C57BL/6 strain (Figs. 1B,D,F). In agreement with our observation in the in situ hybridized sections, we found that SJL mice contained significantly larger numbers of TNF immunoreactive microglia—macrophages compared with BALB/c mice and C57BL/6 mice (Fig. 5D). Furthermore, C57BL/6 mice contained significantly larger numbers than BALB/c mice (Fig. 4D). The TNF immunoreactive microglia—macrophages were located evenly along the rostrocaudal axis (Figs. 4B,D). There was no correlation between the infarct volume and the total number of TNF immunoreactive cells at 24 hours after MCA occlusion neither when each strain was correlated alone (SJL R = 0.47, P = 0.2; BALB/c R = −0.2, P = 0.64; C57x129 R = 0.28, P = 0.38) or when all strains were correlated together (R = 0.23, P = 0.22).
Western blotting for TNF 24 hours after the induction of ischemia showed unique bands of 19 kd in all homogenates from the ipsilateral cortex from SJL, BALB/c and C57BL/6 mice. The Western blot confirmed our findings of increased TNF levels in the SJL strain (Fig. 6, lanes 4–5) compared with the BALB/c strain (Fig. 6, lanes 6–7). Furthermore, the TNF response was stronger for the SJL strain than for the C57BL/6 strain (Fig. 6, lanes 8–9). Control lanes included (1) a molecular weight standard, (2) rabbit serum, and (3) recombinant murine TNF, and confirmed that the bands visualized were specific for TNF (Fig. 6. Molecular weight standard in lane 1 not shown).
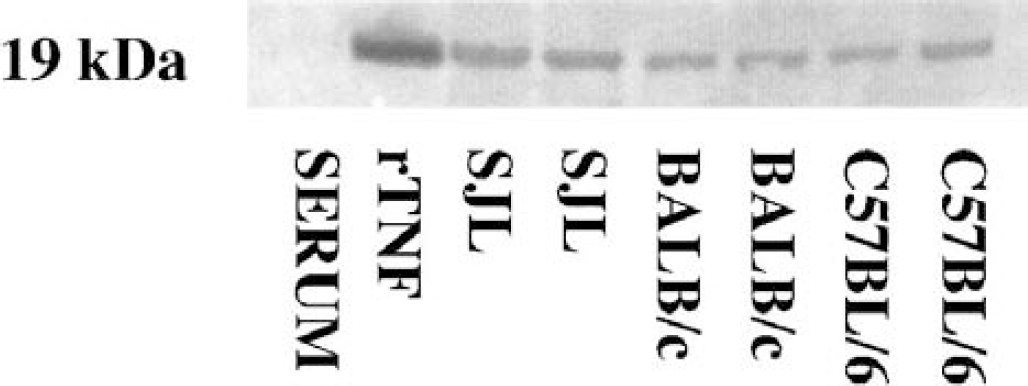
Western blot for TNF protein 24 hours after induction of focal cerebral ischemia. Lanes: (1) molecular weight standard (not shown), (2) rabbit serum (1:10,000), (3) recombinant TNF (0.5 ng), (4–5) SJL mice, (6–7) BALB/c mice, and (8–9) C57BL/6 mice.
Strain-related differences in infarct volume and microglial—macrophage tumor necrosis factor response 12 hours after permanent middle cerebral artery occlusion
We also performed a quantitative analysis of TNF mRNA—expressing cells in SJL, BALB/c, and C57x129 hybrid mice with 12-hour postsurgical survival. This was done to (1) obtain information about the time profile of the microglial—macrophage TNF response, and (2) investigate whether the cellular TNF response might possibly correlate with infarct size at earlier postsurgical stages. We found that BALB/c mice developed significantly larger infarct volumes than observed in SJL and C57x129 mice (Fig. 3C). Infarct volumes at 12 hours were 17.2 mm3 ± 5.8 mm3 for the SJL strain (n = 5), 38.0 mm3 ± 5.6 mm3 for the BALB/c strain (n = 4), and 19.7 mm3 ± 6.7 mm3 for the C57x129 strain (n = 4). The estimation of the total number of TNF mRNA—expressing microglia—macrophages showed that the SJL strain contained significantly larger numbers of TNF mRNA—expressing microglia—macrophages than the C57x129 hybrid mice (Fig. 3E). When estimated as the number of TNF mRNA—expressing cells per infarct volume, SJL mice contained significantly larger numbers of TNF mRNA—expressing cells per infarct volume compared with both BALB/c and C57x129 mice (Fig. 3D). The TNF mRNA—expressing microglia—macrophages were located evenly along the rostrocaudal axis, similarly to the infarct distribution in all mouse strains (Fig. 3F). As observed for mice with 24-hour survival, there was no correlation between the infarct volume and the total number of TNF mRNA—expressing cells 12 hours after MCA occlusion either when each strain was correlated alone (SJL R = 0.12, P = 0.85; BALB/c R = −0.31, P = 0.69; C57x129 R = 0.43, P = 0.57) or when all strains were correlated together (R = −0.29, P = 0.34).
Comparison of the number of infarct and periinfarct infiltrating TNF mRNA—expressing microglia—macrophages in mice with 12-and 24-hour survival showed that the number of TNF mRNA—expressing cells was approximately two-to threefold larger at 12 hours as compared with 24 hours after surgery in all three strains investigated, strongly suggesting that the time profile of the cellular TNF response to focal cerebral ischemia is independent of genetic background.
DISCUSSION
In the present study, we show that the magnitude but not the time profile of the microglial—macrophage TNF response to focal cerebral ischemia is strain dependent. At 24 hours after occlusion of the MCA, SJL mice and especially the C57BL/6 mice contained large numbers of TNF mRNA—expressing and TNF immunoreactive cells per infarct volume unit. In comparison, the BALB/c mice, which contained the least TNF synthesizing microglia—macrophages, developed the largest infarcts. Also at 12 hours after occlusion of the MCA, the SJL strain contained larger numbers of TNF mRNA—expressing microglia—macrophages compared with the C57x129 hybrid and the BALB/c strain, which also at 12 hours developed the largest infarcts.
In accordance with previous observations in C57x129 and SJL mice (Gregersen et al., 2000; Lambertsen et al., 2001), we observed that TNF is produced by GFAP-negative cells coexpressing the microglial—macrophage Mac-1 antigen also in the BALB/c and C57BL/6 mouse strains. This suggests that the differences in the total number of TNF synthesizing cells among strains are caused by strain-dependent differences in microglial TNF production, and/or recruitment of TNF-producing macrophages, and not in the cell type that synthesizes TNF in the different mouse strains. We also consistently counted approximately twice the number of TNF-immunoreactive cells compared with TNF mRNA—expressing cells in all mouse strains at 24 hours. This difference may reflect a higher sensitivity of the immunohistochemical procedure, but could also reflect that the majority of the transcribed TNF mRNA had already been translated into the corresponding protein. The observation of a two-to threefold decrease in the total number of TNF mRNA—expressing microglia—macrophages 24 hours after the induction of ischemia compared with 12 hours is consistent with our previous findings of approximately twice the number of TNF mRNA—expressing cells in C57x129 mice 12 hours after occlusion of the MCA compared with 24 hours (Gregersen et al., 2000). Taken together, these data strongly suggest that the strain-dependent differences in the cellular TNF response cannot be attributed to differences in the time profile for the appearance of TNF synthesizing microglia—macrophages.
The finding of significantly larger infarcts in BALB/c mice compared with SJL, and in C57BL/6 is in line with previous reports of larger cortical infarcts in BALB/c mice compared with other mouse strains after focal cerebral ischemia (Barone et al., 1993; Majid et al., 2000). Our findings of very small infarcts in C57BL/6 mice 24 hours after the induction of ischemia compared with previous findings of large infarct volumes in C57BL/6 mice with a permanent occlusion of the MCA (Connolly et al., 1996; Maeda et al., 1999) can be explained by the fact that these previous studies were based on a proximal occlusion of the MCA leading to infarction in both the cortex and the striatum, whereas we in our study used a distal occlusion of the MCA leading to infarction only in the cortex. Findings of similarly sized infarcts at 12 and 24 hours after surgery support our previous findings of a mature infarct already a few hours after occlusion of the distal part of the MCA (Gregersen et al., 2000).
In combination, the large mean infarct volume and the low number of TNF-synthesizing cells in the BALB/c mice resulted in the lowest number of TNF-synthesizing cells per infarct volume unit among the mouse strains investigated at 24 hours after permanent occlusion of the MCA. In comparison, the SJL mice and especially the C57BL/6 mice contained large numbers of TNF synthesizing cells per infarct volume unit. This suggests that the SJL and C57BL/6 mice and the BALB/c mice are, respectively, high and low producers of TNF after focal cerebral ischemia. Findings of higher TNF levels in the SJL mice were further confirmed by the Western blotting data showing increased levels of TNF in SJL mice compared with BALB/c and C57BL/6 mice. These findings are in line with observations of extremely high numbers of TNF-producing cells in the spinal cords of SJL mice with Theiler's virus-induced encephalomyelitis compared with BALB/c mice with the same disease (Inoue et al., 1996). Similar strain-related differences in the inflammatory response have also been reported for other experimental brain disorders (Yong et al., 1994; Krakowski and Owens, 1996). Our methods were optimized for cell counting but not estimations of single-cell production of TNF mRNA or TNF in the different mouse strains. However, in vitro studies of mast cells have shown that SJL mast cells contain and release more TNF than mast cells from BALB/c mice (Bebo et al., 1996), raising the possibility that individual SJL microglia/macrophages may produce more TNF than BALB/c and possibly C57BL/6 microglia/macrophages. The possibility that single-cell TNF synthesis is strain dependent seems plausible because the gene encoding TNF is linked to the major histocompatibility complex genes located on the murine chromosome 17 (Brouckaert et al., 1993).
Genetic differences in the extent of damage induced by different neurologic disorders have been shown to be largely dependent on background of the major histocompatibility complex (Bernard, 1976). The sensitivity to injury and inflammation is thus associated with altered balance of pro-and antiinflammatory cytokines and chemokines (Charles et al., 1999; Maron et al., 1999). Such differences might influence microglial activation and recruitment of inflammatory leukocytes into infarct and periinfarct areas, and thereby influence not only the magnitude of the microglial—macrophage TNF response but also the cellular sensitivity to TNF. Studies of mice with experimental autoimmune encephalomyelitis have shown that the deleterious actions of TNF are mediated by soluble TNF rather than membrane-bound TNF (Ruuls et al., 2001). Strain-dependent differences in sensitivity to TNF could therefore be caused by differences in the synthesis of the TNF converting enzyme known to cleave the 26-kd TNF transmembrane protein (Moss et al., 1997). This hypothesis gains support from findings of genetic differences in enzymatic synthesis in vitro where BALB/c, SJL, and C57BL/6 mice have been shown to differ in interferon-γ-and TNF-induced production of nitric oxide (Zidek et al., 2000). Other strain-dependent differences might include differences in TNF-p55/p75 receptor expression on the cell surface and/or downstream events that are differently regulated in different mouse strains.
Tumor necrosis factor intervention studies performed in BALB/c and CD1 mice (Nawashiro et al., 1997a; Yang et al., 1998) as well as in rat (Dawson et al., 1996; Barone et al., 1997), and studies of infarct development in genetically manipulated mice on the C57BL/6x129 hybrid background (Bruce et al., 1996; Gary et al., 1998) have provided convincing evidence that TNF does play an important modulatory role in ischemia-induced neuronal degeneration irrespective of the strain or species of the experimental animal. The present finding of a lack of correlation between infarct size and number of TNF synthesizing microglia—macrophages both between strains and within the same strain should therefore not be interpreted as meaning that TNF has no influence on infarct development, but only that TNF produced from 12 hours onward is produced secondarily to the infarction. This is in line with the general view that focal cerebral infarcts mature early, within the first few hours after permanent occlusion of the MCA (Gregersen et al., 2000). This emphasizes that to understand the mechanism of action of TNF in cerebral ischemia, it is necessary to obtain detailed information about the cellular production of TNF, TNF converting enzyme, and the expression of the TNF-p55/p75 receptors in the very early phase—minutes to a few hours—after induction of focal cerebral ischemia. Such information would not only contribute to clarifying the duality of function of TNF in ischemia-induced neuronal degeneration but also in inflammatory CNS disorders, such as multiple sclerosis, where TNF is known to be involved in the pathogenesis (Finsen et al., 2002).
CONCLUSIONS
We conclude that the magnitude, but not the time profile of microglial—macrophage synthesis of TNF at 12 and 24 hours after permanent occlusion of the distal part of the MCA is strain dependent and without correlation to the mean infarct size. The findings suggest that the pathophysiologically important TNF is produced in the early phase (minutes to a few hours) after induction of ischemia and/or that different mouse strains display different sensitivities to TNF.
Footnotes
Acknowledgments
The authors acknowledge the technical assistance provided by Inger Margrethe Rasmussen, and Lene Jørgensen, Anatomy and Neurobiology, University of Southern Denmark (SDU), Odense University (OU), the Laboratory of Biomedicine, SDU, OU, and the expert assistance by Margrethe Krog, SDU, OU and photographer Albert Meyer, Aarhus University, Denmark. Trevor Owens, Montreàl Neurological Institute, McGill University, Montreàl, Canada, is acknowledged for donation of mice and valuable discussion.