
Abstract
Hypoxia-inducible factor-1 (HIF-1), a transcription factor composed of HIF-1α and HIF-1β protein subunits, has been implicated in cellular protection and cell death in cerebral ischemia. The extent to which HIF-1 plays a role in brain pathology during intracerebral hemorrhage (ICH) is unknown. This study determined whether HIF-1α is upregulated at different time points in a rat model of ICH and the role of thrombin and red blood cell lysis in upregulation. Recently, thrombin has been implicated as a nonhypoxic regulator of HIF-1α in cultured smooth-muscle cells. Male Sprague-Dawley rats received intracerebral infusions of saline, autologous whole blood, blood plus hirudin, thrombin, thrombin plus hirudin, or lysed erythrocytes. Rats were killed at different time points for Western blot analysis, immunohistochemistry, immunofluorescent double staining, and reverse transcription polymerase chain reaction measurements of HIF-1α. HIF-1α protein levels increased without changing HIF-1α messenger RNA levels after intracerebral infusions of blood, thrombin, and lysed erythrocytes. HIF-1α positive cells, which proved to be neurons, were found in the brain after ICH. Hirudin, a specific thrombin inhibitor, reduced HIF-1α upregulation in response to both thrombin and blood. This study demonstrates that perihematomal HIF-1α protein is upregulated after ICH. This phenomenon is an early response of brain parenchyma to the clot. Thrombin and erythrocyte lysate are involved in HIF-1α upregulation through reducing HIF-1α degradation.
Perihematomal edema and neuronal death are generally considered to be the major causes of mortality and morbidity after intracerebral hemorrhage (ICH). Our previous studies have shown that the coagulation cascade, particularly thrombin, and hemoglobin toxicity after red blood cells lysis contribute to brain injury after ICH (Lee et al., 1995; Lee et al., 1996a, b ; Xi et al., 1998a,b). A number of different endogenous factors may potentially modulate brain injury after ICH. These include serine protease inhibitors (serpins), which inhibit thrombin, as well as other proteins such as heme oxygenase-1 (HO-1), a key enzyme in hemoglobin degradation, and iron transport proteins such as transferrin and the transferrin receptor. Interestingly, the level of plasminogen activator inhibitor-1, a serpin that can inhibit the activities of thrombin and tissue-type plasminogen activator, HO-1, transferrin, and transferrin receptor are all regulated by hypoxia-inducible factor-1α (HIF-1α), a transcription factor (Bianchi et al., 1999; Kietzmann et al., 1999; Lee et al., 1997c; Lok and Ponka, 1999; Rolfs et al., 1997; Tacchini et al., 1999).
Hypoxia-inducible factor-1, composed of HIF-1α and HIF-1β subunits, is one of the earliest molecular switches in the signaling of hypoxic tissues (Kallio et al., 1998; Piacentini and Karliner, 1999; Wang et al., 2000). In rat cultured cortical neurons, oxygen and glucose deprivation rapidly and transiently induce activation of HIF-1α in a dose- and time-dependent manner (Ruscher et al., 1998). After permanent middle cerebral artery occlusion in rats, there is a temporal and spatial induction of HIF-1α messenger RNA (mRNA) in the penumbra, with an increase of mRNA encoding glucose transporter 1, glycolytic enzyme aldolase A, lactate dehydrogenase A, and vascular endothelial growth factor, all encoded by HIF-1 target genes (Bergeron et al., 1999). HIF-1α–induced angiogenesis and glycolytic metabolism may be important for cells to survive under hypoxic/ischemic condition (Bergeron et al., 2000; Semenza, 2000c), although recent studies provide evidence that HIF-1α mediates the death of cultured cells subjected to oxygen and/or glucose deprivation (Carmeliet et al., 1998; Halterman et al., 1999).
In contrast to models of cerebral ischemia, there are only modest and transient reductions in cerebral blood flow after ICH (Lee et al., 1997b; Mendelow et al., 1984; Nath et al., 1986, 1987; Patel et al., 1999). Whether the resultant hypoxia is sufficient to induce HIF-1α is uncertain. However, recent experiments by Richard et al. (2000) in cultured smooth-muscle cells showed that thrombin (i.e., a nonhypoxic mechanism) can upregulate HIF-1α, suggesting another mechanism by which ICH might induce HIF-1α. In addition, HIF-1α induction by hypoxia is iron dependent (Srinivas et al., 1998), suggesting that iron release from the red blood cells of the hematoma lyse might also regulate HIF-1α. The purpose of this study, therefore, was to investigate whether HIF-1α is upregulated in the brain after ICH and the roles thrombin and erythrocytes lysis play in that regulation.
MATERIALS AND METHODS
Study design
This study was divided into four parts. In the first part we examined whether HIF-1α is upregulated after an intracerebral infusion of blood. Fifty microliters of either autologous blood or saline was infused into the right basal ganglia of rats. The animals were killed 4 hours, 1 day, 3 days, or 7 days after the injection. Brain HIF-1α was measured using Western blot analysis (at protein level), reverse transcription polymerase chain reaction (at gene level), immunohistochemistry, and immunofluorescent double staining. The second part examined whether an intracerebral infusion of thrombin upregulates HIF-1α. Rats received 50 μL of either saline, thrombin (5 U), or thrombin plus hirudin (5 U + 5 U), respectively. They were killed 1, 3, or 7 days later, and the brains were processed for Western blot analysis or reverse transcription polymerase chain reaction. The third part examined the role of thrombin in HIF-1α upregulation after ICH. Rats received 50 μL saline, 50 μL blood, or 50 μL blood + hirudin (5 U) 1 or 3 days before HIF-1α Western blot analysis. The last part examined whether an intracerebral infusion of lysed red blood cells upregulates HIF-1α. Rats received either lysed red blood cells (30 μL) or saline and were killed for Western blot analysis 24 hours later.
Animal preparation and intracerebral infusion
Male Sprague-Dawley rats (N = 78, Charles River Laboratories, Portage, MI, U.S.A.), weighing 300 to 400 g, were used in this study. Rats were anesthetized with pentobarbital (40 mg/kg, intraperitoneally, and the right femoral artery was catheterized for pressure monitoring and blood sampling. Arterial blood was obtained for analysis of blood pH, and gases, hematocrit, and glucose. The rectal temperature was maintained at 37.5°C using a feedback-controlled heating pad. Autologous blood, thrombin, lysed red blood cells, or saline were infused into the right caudate nucleus stereotactically at a rate of 10 μL/min through a 26-gauge needle (coordinates: 0.2 mm anterior, 5.5 mm ventral, and 3.5 mm lateral to the bregma) using a microinfusion pump. The needle was removed, the skin incision was closed, and the animals were allowed to recover.
Western blot analysis
Rats were anesthetized and killed at different time points. They underwent intracardiac perfusion with saline. The brains were removed and a 3-mm-thick coronal brain slice was cut approximately 4 mm from the frontal pole. The slice was separated into ipsilateral and contralateral cortex, and ipsilateral and contralateral basal ganglia. Western blot analysis was performed as previously described (Xi et al., 1999). Briefly, 50-μg proteins for each were separated by sodium dodecyl sulfate polyacrylamide gel electrophoresis and transferred to a Hybond-C pure nitrocellulose membrane (Amersham). Membranes were probed with a 1:2,000 dilution of the primary antibody (mouse anti-human HIF-1α, Novus Biologicals, Littleton, CO, U.S.A.) and a 1:2,500 dilution of the secondary antibody (peroxidase-conjugated goat anti-mouse antibody, BioRad Co.). The antigen-antibody complexes were visualized with a chemiluminescence system (Amersham) and exposed to Kodak X-OMAT film (Rochester, NY, U.S.A.). The relative densities of bands were analyzed with NIH Image (Version 1.61, Bethesda, MD, U.S.A.).
Immunohistochemistry and immunofluorescent double labeling
Rats were anesthetized and underwent intracardiac perfusion with 4% paraformaldehyde in 0.1 mol/L (pH 7.4) phosphate-buffered saline. The brains were removed and kept in 4% paraformaldehyde for 6 hours, then immersed in 25% sucrose for 3 to 4 days at 4°C. Brains were then placed in embedding compound and sectioned on a cryostat (18-μm thick). Sections were incubated using the avidin-biotin complex technique. Monoclonal mouse anti-human HIF-1α was used for primary antibody (Novus Biologicals, 1:500 dilution). Hematoxylin staining was used as counterstaining. Normal mouse immunoglobulin G was used as a negative control (Xi et al., 1999).
For immunofluorescent double labeling, the primary antibodies rabbit anti-human neuron-specific enolase antibody (1:100 dilution) and mouse anti-HIF-1α antibody (1:100 dilution) were used. Rhodamine-conjugated goat anti-rabbit antibody (1:100 dilution) and fluorescein isothiocyanate-labeled horse anti-mouse antibody (1:100 dilution) were used as second antibodies. The double labeling was analyzed by a fluorescence microscope (Xi et al., 1999).
Reverse transcription and polymerase chain reaction
The brain tissues were sampled as described in the description of our Western blot analysis. Total RNA was extracted with Trizol reagent (Gibco BRL, Grand Island, NY, U.S.A.), and 1 μg RNA was digested with deoxy-ribonuclease (DNaseI, Amplification Grade, Gibco BRL). Complementary DNA (cDNA) was synthesized by reverse transcription using the digested 1 μg RNA (11 μL) with 14 μL of reaction buffer (Perkin Elmer, Foster City, CA, U.S.A.) containing dNTP (dATP, dCTP, dGTP, and dTTP), 25 mmol/L MgCl2, 10x polymerase chain reaction (PCR) buffer II, random hexamer primer, RNase inhibitor, and MuLV reverse transcriptase. The reaction was performed at 42°C for 30 minutes and terminated at 99°C for 5 minutes. Diethyl pyrocarbonate water (75 μL) was added to dilute the cDNA to 100 μL and stored at −2°C until use.
Polymerase chain reaction was performed with 15 μL of the reverse transcriptase reaction mixture (Perkin Elmer) containing 25 mmol/L MgCl2, dNTP, 10x PCR buffer II, and AmpliTaq DNA polymerase in a final volume of 50 μL. The deoxyoligonucleotide primers (NIH GenBank) used for PCR in this study were 5'-AAGTCTAGGGATGCAGCAC-3' (sense) and 5'CAAGATCACCAGCATCTAG-3' (anti-sense), which were synthesized by Operon Technologies. Amplification was performed in a DNA thermal cycler (MJ Research, Watertown, MA, U.S.A.). Samples were subjected to 30 cycles (95°C, 30 seconds; 53°C, 30 seconds; and 72°C, 1.5 minutes). Polymerase chain reaction production was analyzed by the use of electrophoresis on 1% agarose gel. Gels were visualized with ethidium bromide staining and ultraviolet transillumination. Photographs were taken with black and white film (Polaroid Corp., Cambridge, MA, U.S.A.). The relative densities of bands were analyzed with NIH Image (Version 1.61).
Statistical analysis
All data in this study are presented as mean ± SD. Data were analyzed with analysis of variance using the Scheffe F test or Student's t-test. Significance levels were measured at P < 0.05.
RESULTS
Physiologic parameters were measured immediately before an intracerebral infusion including blood pH (7.46 ± 0.05), blood gases (PO2: 79 ± 4 mm Hg; PCO2: 43 ± 4 mm Hg), mean arterial blood pressure (110 ± 9 mm Hg), hematocrit (40 ± 2%), and blood glucose (6.2 ± 1.1 mmol/L). All the values were within the normal range.
Increases of brain HIF-1α after intracerebral hemorrhage
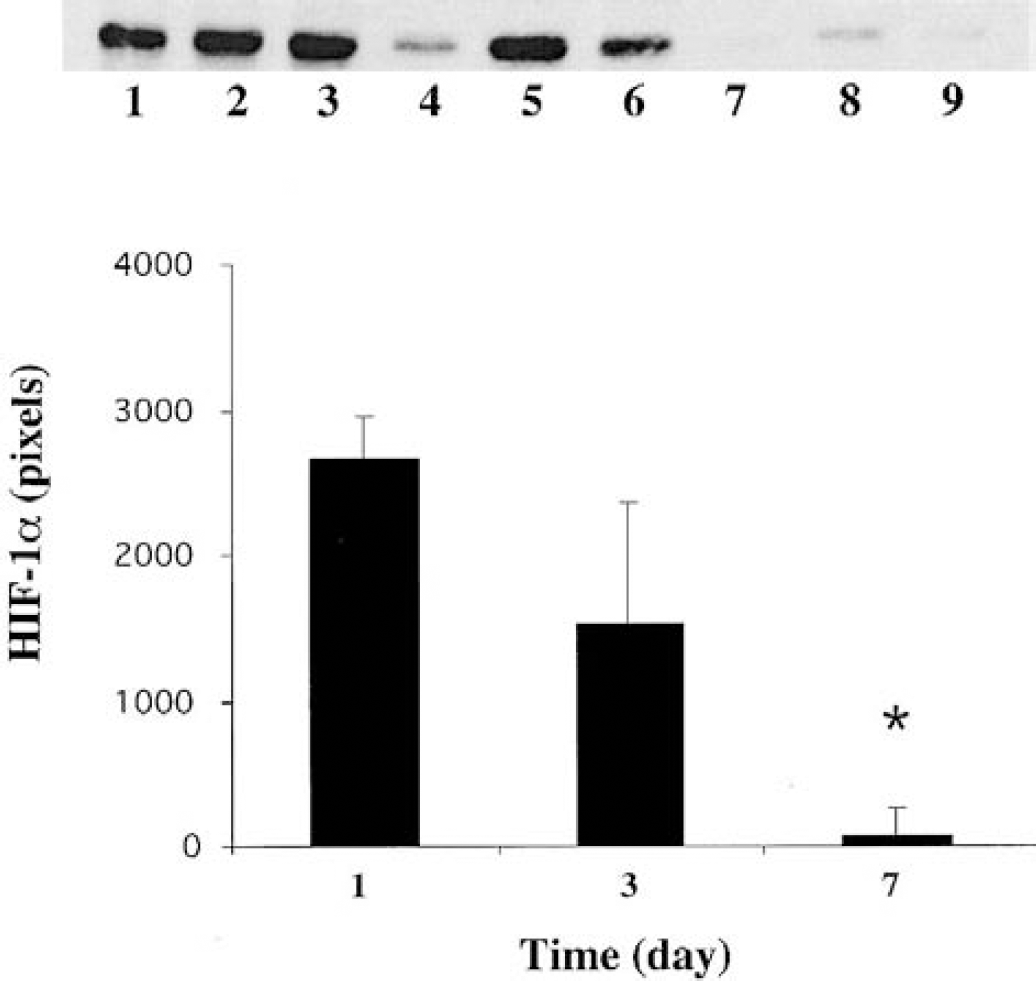
By Western blot analysis, HIF-1α was undetectable in normal rat brain. However, it was increased in the ipsilateral basal ganglia of rats that received a blood injection into the basal ganglia (Fig. 1). Effects of autologous blood over time indicated that an increase in HIF-1α protein occurred as early as 4 hours, peaked at 3 days, and then declined by 7 days (Fig. 1). Thus, at day 3 after ICH, the HIF-1α protein in the ipsilateral basal ganglia was 1,632 ± 148 pixels, significantly (P < 0.05, n = 3) higher than at day 1 (589 ± 458 pixels) or day 7 (375 ± 172 pixels). There was no significant change of HIF-1α protein levels in the contralateral basal ganglia (Fig. 2). Hirudin blocked HIF-1α accumulation 3 days after ICH (409 ± 413 versus 2,830 ± 1,314 pixels in ICH control, P < 0.05, Fig. 3).
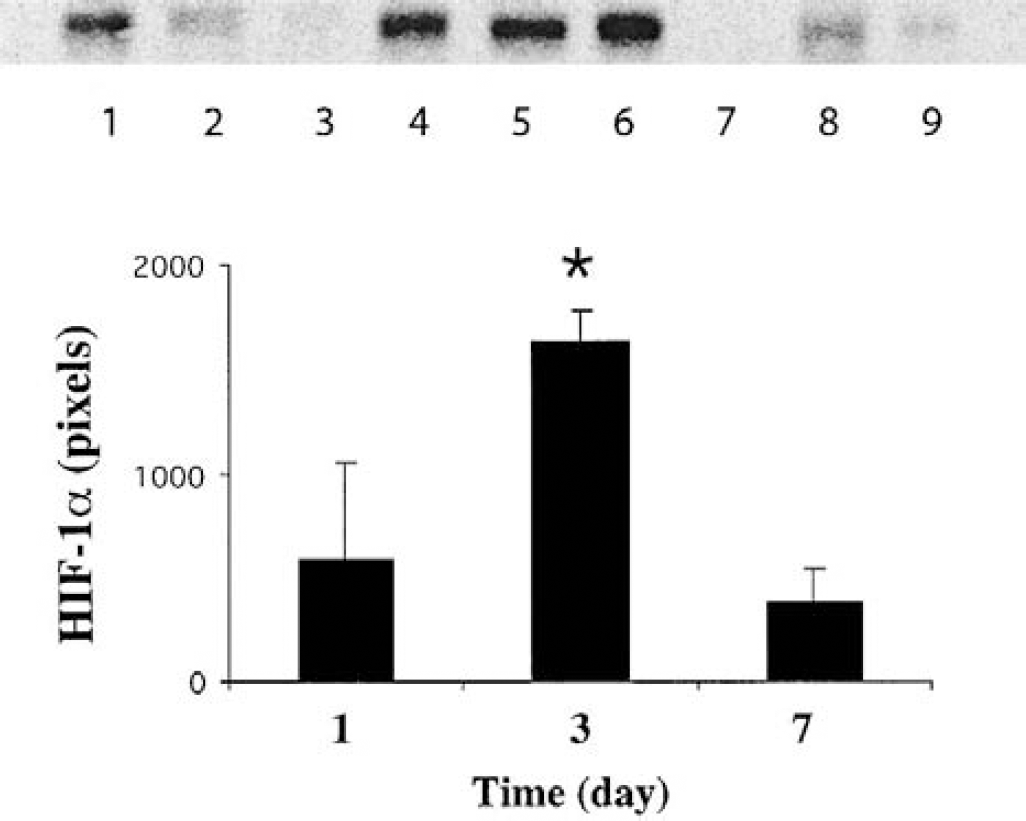
Western blot showing the time course of hypoxia-inducible factor-1α protein levels in the ipsilateral basal ganglia after intracerebral injection of blood. Lanes 1 to 3, 4 to 6, and 7 to 9 were from brains at 1, 3, and 7 days after intracerebral hemorrhage, respectively. The graph shows the analysis of the Western blot. Values are means ± SD. *P < 0.05 versus day 1 and day 7.
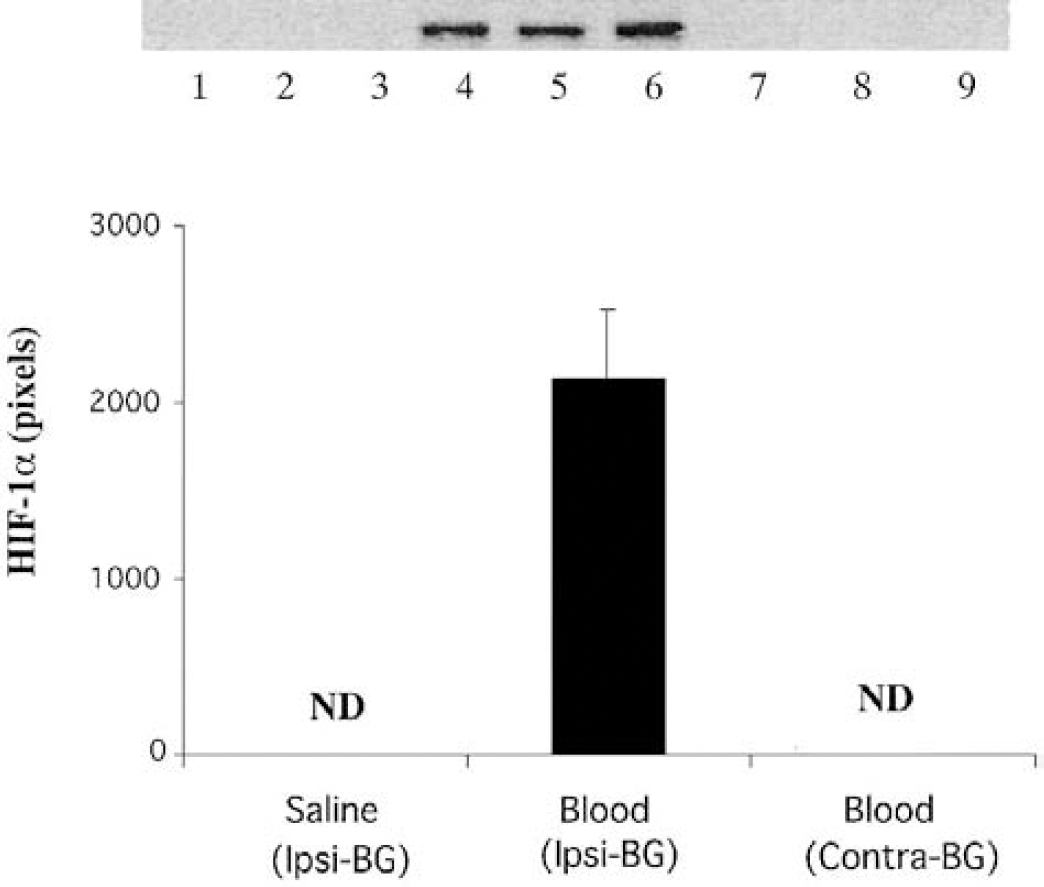
Western blot analysis of hypoxia-inducible factor-1α in the basal ganglia 3 days after intracerebral hemorrhage (ICH). Lanes 1 to 3 were from the ipsilateral basal ganglia of control (saline infusion) brains, lanes 4 to 6 were from the basal ganglia ipsilateral to the ICH (Ipsi-BG), whereas lanes 7 to 9 were from the contralateral basal ganglia (Contra-BG). The graph shows the analysis of the Western blot. Values are means ± SD. ND, not detectable.
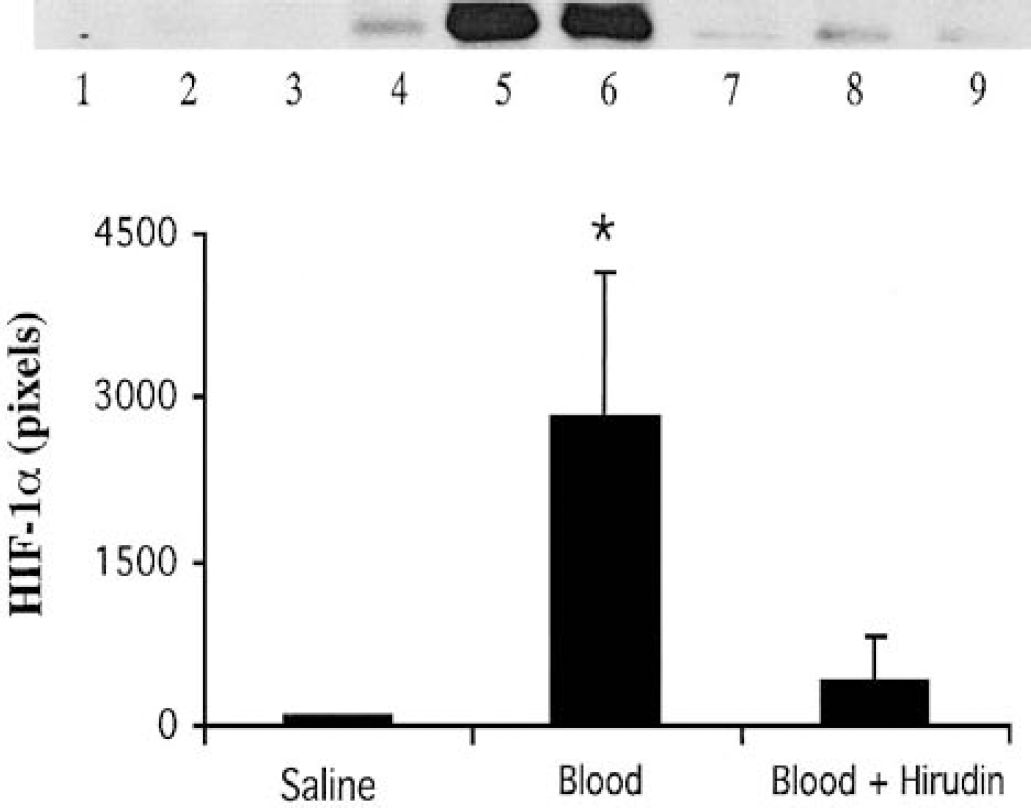
The effect of hirudin on the hypoxia-inducible factor-1α upregulation induced by blood. The brain samples of the ipsilateral basal ganglia were taken 3 days after intracerebral injection of saline (lanes 1 to 3), blood (lanes 4 to 6), or blood plus hirudin (lanes 7 to 9). The graph shows the analysis of the Western blot. Values are means ± SD. *P < 0.05 versus the other groups.
Immunohistochemistry demonstrated that HIF-1α positive signals were localized to neurons in the perihematomal tissue (Fig. 4). Immunofluorescent double staining also confirmed that HIF-1α positive cells were neurons (Fig. 5).
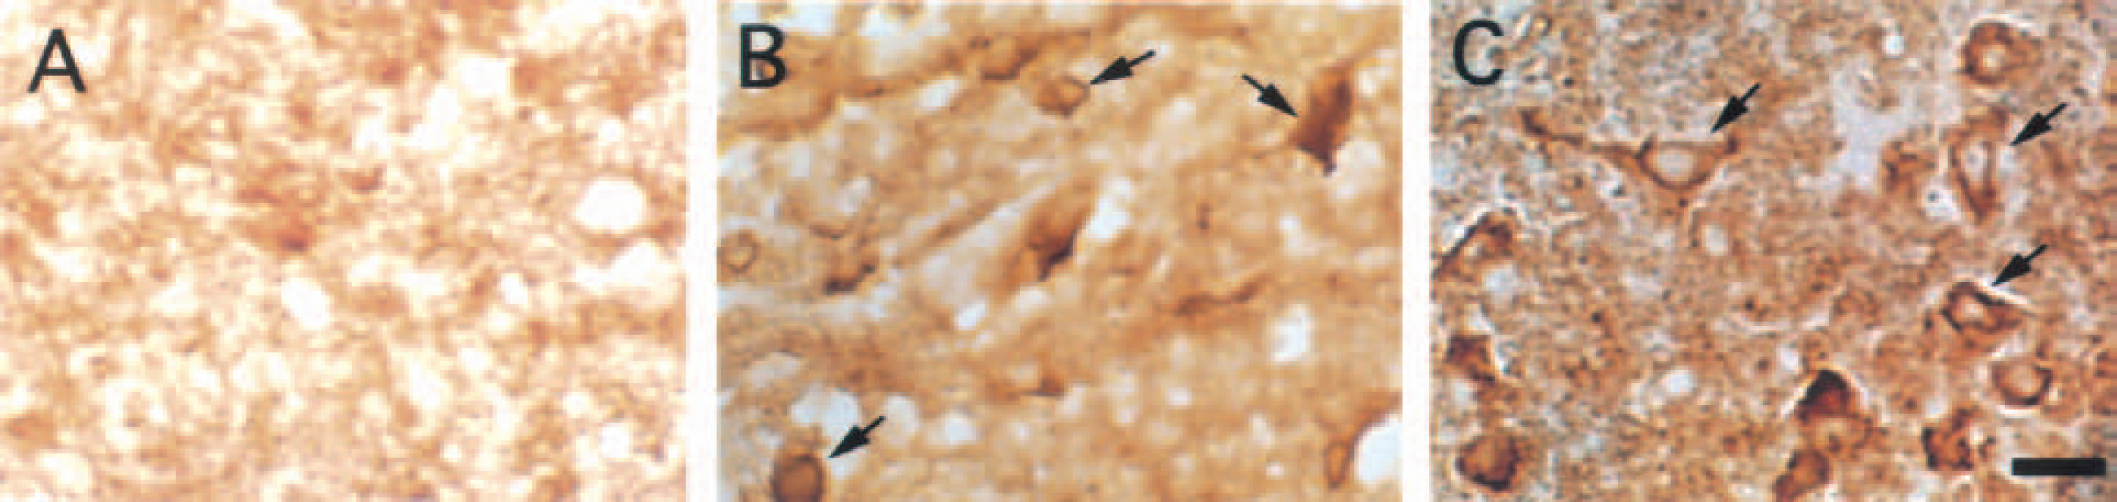
Hypoxia-inducible factor-1α (HIF-1α) immunoreactivities in the ipsilateral basal ganglia 3 days after intracerebral injection of saline
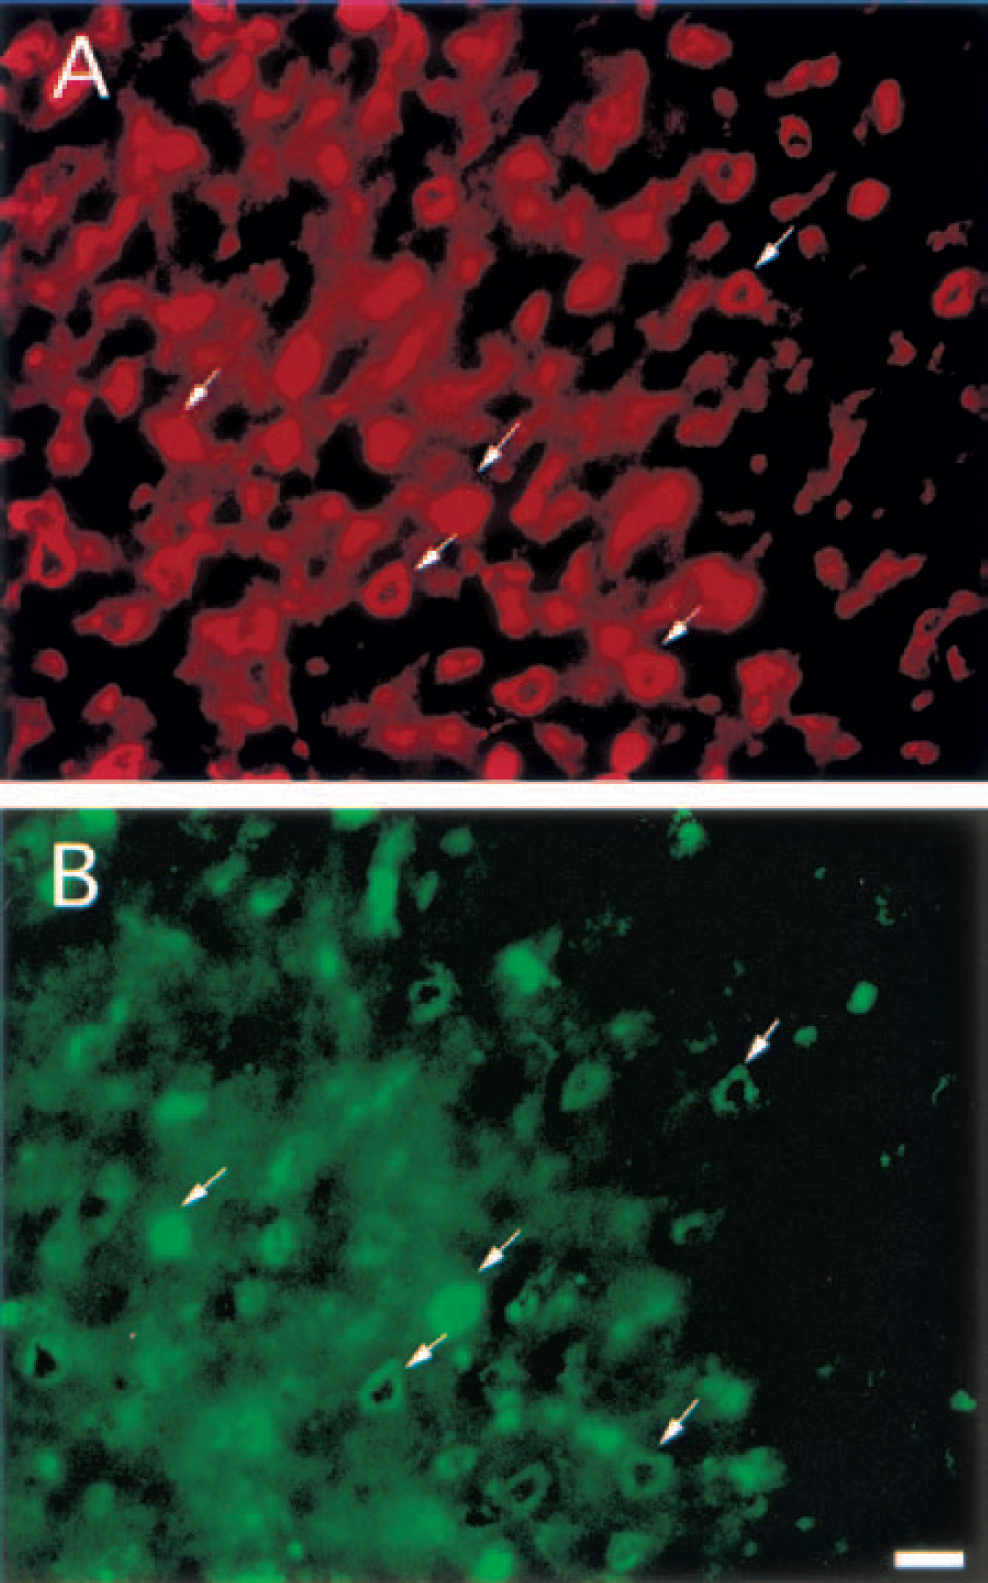
Double immunofluorescent labeling for neuron-specific enolase (NSE) and hypoxia-inducible factor-1α (HIF-1α) in the ipsilateral basal ganglia 3 days after intracerebral injection of blood.
Effect of thrombin on HIF-1α
By Western blot, we found that HIF-1α protein was upregulated after injection of thrombin (5 U). This peaked by the first day after injection and lasted at least 3 days (Fig. 6). Thrombin-induced HIF-1α upregulation was also inhibited by hirudin (Fig. 7). HIF-1α from rats that received hirudin and thrombin was 713 ± 564 pixels 1 day after injection, significantly lower than that seen after thrombin infusion alone (2,363 ± 670 pixels, P < 0.05). Both immunohistochemistry and immunofluorescent double staining demonstrated that HIF-1α positive signals were localized to neurons around the hematoma in the ipsilateral basal ganglia (Fig. 4).
Western blot showing the time course of hypoxia-inducible factor-1α protein levels in the ipsilateral basal ganglia after intracerebral injection of thrombin (5 U). Lanes 1 to 3, 4 to 6, and 7 to 9 were from brains at 1, 3, and 7 days after the injection, respectively. The graph shows the analysis of the Western blot. Values are means ± SD. *P < 0.05 versus day 1 and day 3.
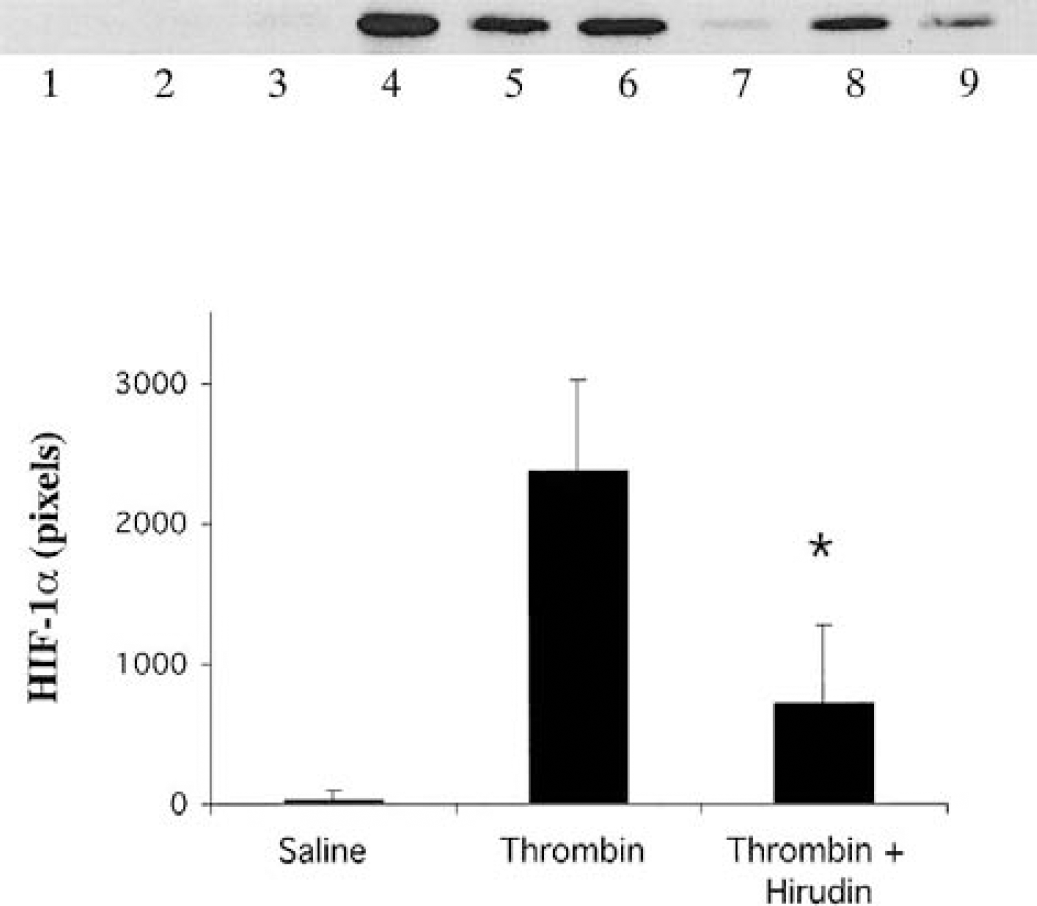
The effect of hirudin on hypoxia-inducible factor-1α induced by thrombin. Brain samples of the ipsilateral basal ganglia were taken from saline control group (lanes 1 to 3), thrombin (5 U) group (lanes 4 to 6), or thrombin plus hirudin group (lanes 7 to 9) 1 day after injections. The graph shows the analysis of the Western blot. Values are means ± SD. *P < 0.05 versus the saline or thrombin group.
Lysed red blood cells and HIF-1α
HIF-1α protein levels were markedly increased after intracerebral injection of lysed red blood cells. The level of HIF-1α in the ipsilateral basal ganglia was 3,043 ± 703 pixels 1 day after injection, which was significantly higher than that after saline infusion (75 ± 101 pixels, P < 0.05, Fig. 8).
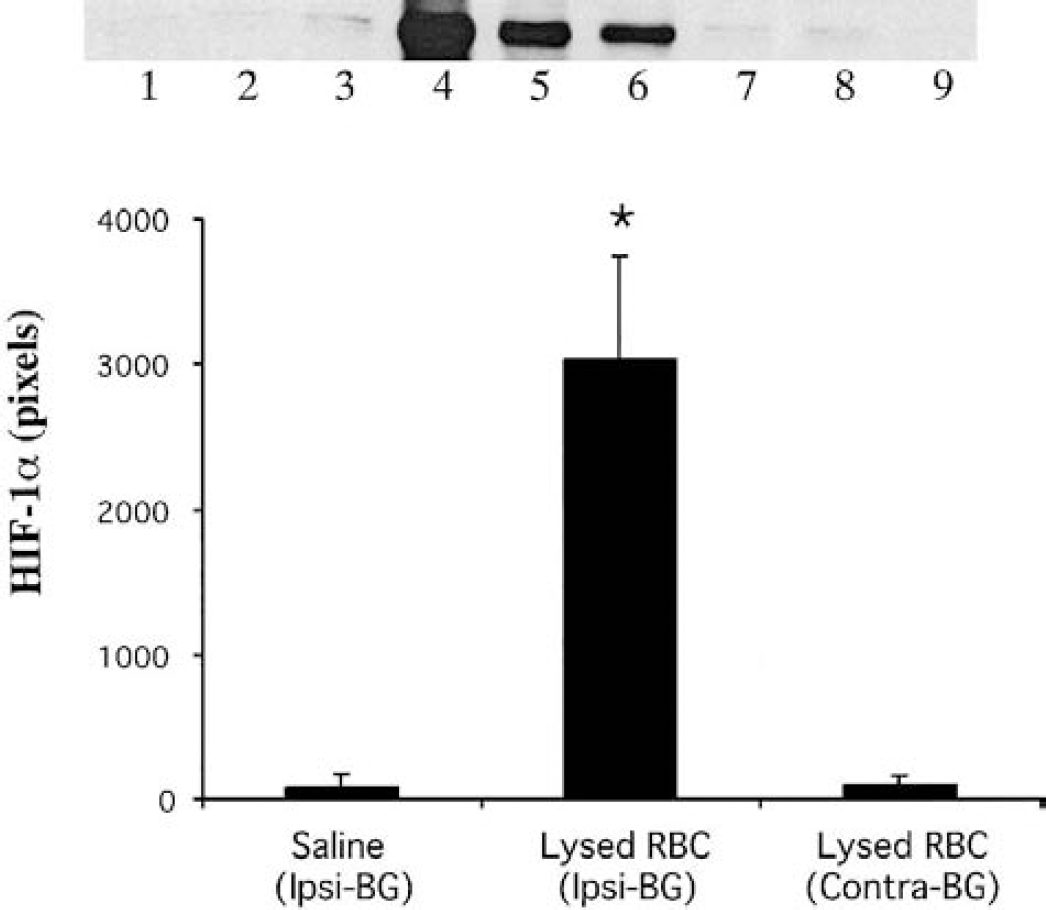
The effect of the lysed red blood cells on the hypoxia-inducible factor-1α protein levels in the basal ganglia. Samples were taken at 1 day after injections. Lanes 1 to 3 were the ipsilateral basal ganglia (Ipsi-BG) of saline (control) group. Lanes 4 to 6 and lanes 7 to 9 were from the Ipsi-BG and the contralateral basal ganglia (Contra-BG) of lysed red blood cell group, respectively. The graph shows the analysis of the Western blot. Values are means ± SD, *P < 0.05 versus the other groups.
Effect of blood and thrombin on HIF-1α mRNA
By reverse transcription polymerase chain reaction data, HIF-1α mRNA was constitutively expressed in normal brain, and mRNA levels were unchanged 24 hours after ICH. There was no significant difference in HIF-1α mRNA levels in the ipsilateral basal ganglia between ICH and control 3 days (6,820 ± 654 versus 6,114 ± 299 pixels in the ICH control, n = 3, P > 0.05) after the intracerebral injection (Fig. 9). HIF-1α mRNA levels were unchanged in the ipsilateral basal ganglia 4 and 24 hours after an intracerebral infusion of thrombin (Fig. 10). These results suggest that the upregulation of HIF-1α protein levels seen after intracerebral blood and thrombin infusion is not mediated by altered transcription of the HIF-1α gene.
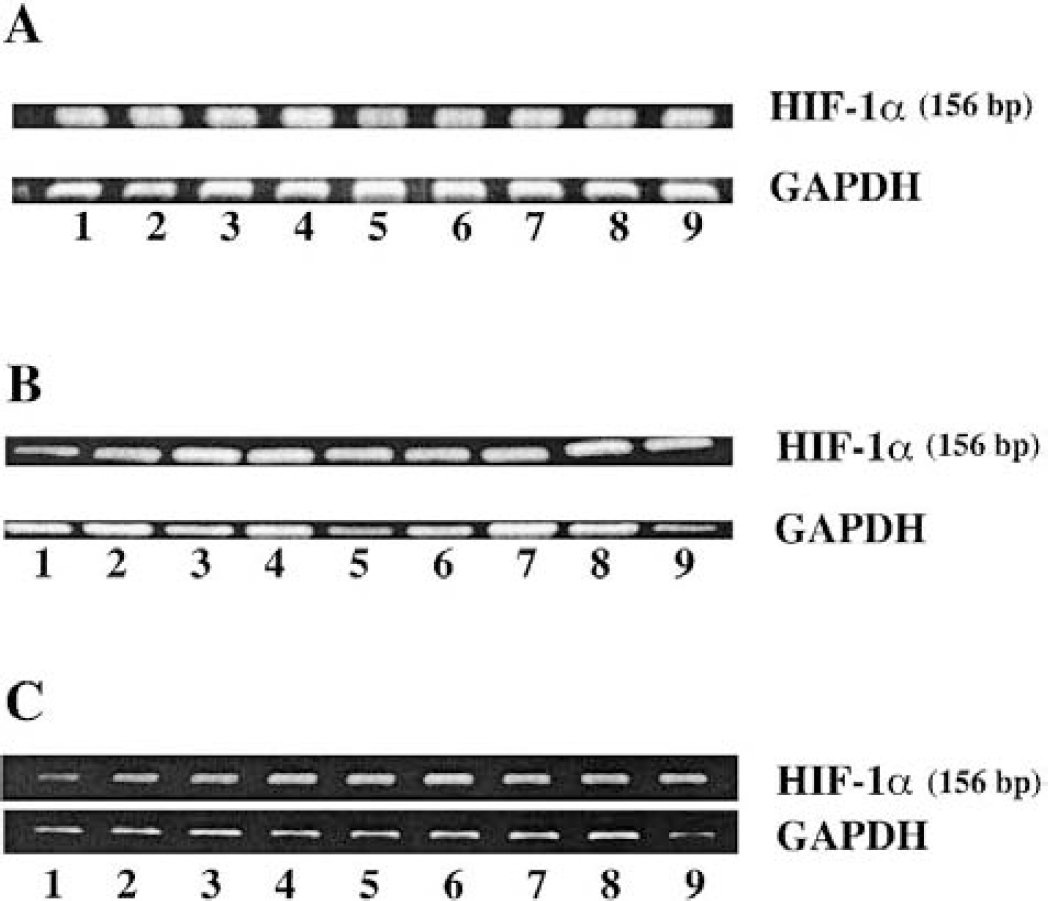
Hypoxia-inducible factor-1α messenger RNA expression after intracerebral hemorrhage.
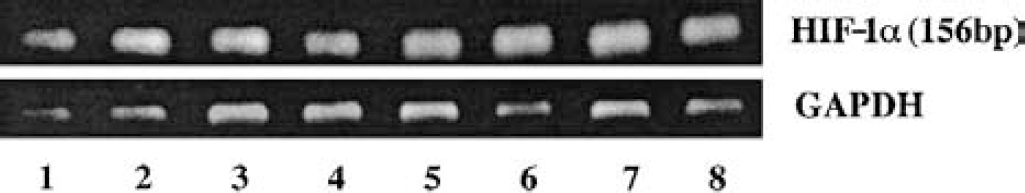
Hypoxia-inducible factor-1α messenger RNA expression in the ipsilateral basal ganglia at 4 and 24 hours after intracerebral infusion of thrombin (4 hours, lanes 3 to 4; 24 hours, lanes 7 to 8) or saline (4 hours, lanes 1 to 2; 24 hours, lanes 5 to 6).
DISCUSSION
In the present study, we found that HIF-1α protein levels were increased after intracerebral injections of autologous blood, thrombin, or lysed red blood cells. Because HIF-1α is known to regulate the expression of a variety of potentially neuroprotective proteins, its upregulation may play an important role in modulating ICH-induced injury. In addition, the upregulation of HIF-1α by thrombin and lysed red blood cells suggests that HIF-1α levels in brain may be regulated by factors other than hypoxia.
HIF-1 is a well-known transcription factor that is composed of two subunits, HIF-1α and HIF-1β. Each subunit contains an N-terminal basic helix-loop-helix domain, responsible for heterodimerization and DNA binding (Wang et al., 1995). Although the HIF-1β protein is found in all cells, HIF-1α is virtually undetectable during normal oxygenation, because it is rapidly degraded by the ubiquitin-proteasome system (Berra et al., 2001; Huang et al., 1998; Kallio et al., 1999; Salceda and Caro, 1997). Under normoxic condition, the half-life of HIF-1α protein turnover is less than 15 minutes (Wang et al., 1995). Thus, HIF-1α protein was not detected in normal brain or brains from sham rats in our experiments at any time point either by immunostaining or by Western blot analysis, although HIF-1α mRNA was constitutively expressed. We found a marked increase in HIF-1α protein levels after ICH, but this elevation was not associated with an increase in HIF-1α mRNA levels. Thus, it appears that HIF-1α protein accumulation during ICH is not mediated by altered transcription. Whether it is mediated by an inhibition of the ubiquitin-proteasome degradation system, as happens in hypoxia (Huang et al., 1998; Kallio et al., 1999; Salceda and Caro, 1997), remains to be determined.
As implied by its name, HIF-1α is typically induced by hypoxia (Jewell et al., 2001; Semenza, 2000b). Thus, HIF-1α upregulation occurs during cerebral ischemia (Bergeron et al., 2000; Bergeron et al., 1999). Cerebral ischemia is variable and often transient after ICH-induced brain injury. Recent animal studies have not found a significant reduction in cerebral blood flow after ICH (Qureshi et al., 1999). A transient reduction in perihematomal blood flow occurs after ICH (Nath et al., 1987). Although hypoperfusion may be insufficient to cause ischemic injury, it is possible that HIF-1α accumulates because it responds rapidly to hypoxia (Jewell et al., 2001).
It is also possible that HIF-1α upregulation after ICH is induced by factors other than hypoxia. For example, Richard et al. reported that HIF-1α levels are upregulated in vascular smooth-muscle cells by thrombin (Richard et al., 2000), that is, a nonhypoxic pathway. Gorlach et al. also found that thrombin activates HIF-1α (Gorlach et al., 2001). As in smooth-muscle cells, we too found that thrombin upregulates HIF-1α levels in neurons. This effect appears to be specific, because it was blocked by a coinfusion of hirudin, the specific thrombin inhibitor. The thrombin effect is not likely to be mediated by hypoxia because we have previously found no reduction in cerebral blood flow after thrombin injections into the basal ganglia (Lee et al., 1997b). We have also found, in brain slice preparation, that thrombin does not cause vasoconstriction (Lee et al., 1997b). In addition, the experiments of Richard et al. in cultured smooth-muscle cells indicate that thrombin can induce HIF-1α upregulation without a change of oxygen level (Richard et al., 2000).
Thrombin appears to play an important role in the induction of HIF-1α after ICH because the coinjection of hirudin and blood reduced HIF-1α upregulation. The time course of upregulation by thrombin and ICH was different, however, with a peak effect at 1 day by thrombin and 3 days for blood. It should be recalled that thrombin may be bound to fibrin within the clot and is gradually released into the surrounding parenchyma (Hsieh, 1997).
Another potential explanation for the delayed peak in upregulation of ICH-induced HIF-1α may be related to the time required for red blood cell lysis. In this study, we found that lysed red blood cells cause HIF-1α accumulation within 1 day of injection. After an ICH, red blood cell lysis usually starts 2 to 3 days later. The mechanism by which lysed red blood cells upregulate HIF-1α remains to be determined, although it is known that hypoxia induced HIF-1α upregulation is iron dependent (Srinivas et al., 1998). Such an intracerebral infusion of lysed red blood cells reduces cerebral blood flow by only 30% (Xi et al., 200a,b), suggesting that the effects on HIF-1α may not be hypoxia mediated.
The net effect of HIF-1α upregulation after ICH is unknown. However, HIF-1α is involved in the regulation of some specific genes, such as genes for the expression of glycolytic enzymes, erythropoietin, and vascular endothelial growth factor (Bergeron et al., 1999; Semenza, 2000a). These genes are involved in the adaptive response of cells to hypoxic conditions. HIF-1α may also play an important part in regulation of plasminogen activator inhibitor-1 and heme oxygenase-1 (HO-1), because both are HIF-1α target genes. Plasminogen activator inhibitor-1, one of the serpins, may be neuroprotective (Hua et al., 2002). Nagai et al. reported that brain infarct volume is increased after cerebral ischemia in plasminogen activator inhibitor-1 knockout mice (Nagai et al., 1999). Plasminogen activator inhibitor-1 is an inhibitor of thrombin (Cunningham et al., 2000) and thrombin-mediated brain damage has been implicated as a major component of ICH-induced injury (Lee et al., 1996a, b , 1997a). HO-1, which has also been called heat shock protein 32, degrades heme into iron, carbon monoxide, and biliverdin. Studies suggest that HO-1 is involved in cytoprotection from different kinds of injuries (Abraham et al., 1995; Otterbein et al., 1995), although HO-1 upregulation may induce cell injury by inducing cellular iron content (Lamb et al., 1999; Suttner and Dennery, 1999).
In this study, we found that the induced HIF-1α was mainly localized in neurons near the hematoma (Fig. 4). Neurons are sensitive to damage by thrombin, hemoglobin, and iron. Thus, HIF-1α induction may be a self-defense response to blood-induced neurotoxicity.
The present data demonstrate that perihematomal HIF-1α is upregulated after intracerebral hemorrhage. Short-term hypoxia around the hematoma, thrombin formation, and red blood cells lysis may contribute to the accumulation of HIF-1α. Upregulation of HIF-1α may stimulate production of its target gene products, including plasminogen activator inhibitor-1 and HO-1, which, in turn, modulate brain injury after ICH.