
Abstract
Optical imaging spectroscopy was used to measure the hemodynamic response of somatosensory cortex to stimulation of the whiskers. Responses to brief puffs of air were compared in anesthetized and unanesthetized rats. The hemodynamic response was approximately four times larger in the unanesthetized animal than the corresponding anesthetized animal. In unanesthetized animals, a short-latency (approximately 400 milliseconds) short-duration (approximately 300 milliseconds) hemodynamic startle response was observed. General linear model analysis was used to extract this component from the time series, and revealed an underlying short-latency increase in deoxygenated hemoglobin in response to somatosensory stimulation. It is proposed that anesthesia can have a marked affect on the relation between changes in blood volume and blood flow. This work represents a step in the development of an experimental model that can be used to investigate fundamental neurologic processes in the awake-behaving rodent.
Keywords
Optical imaging spectroscopy (OIS) has been used to investigate the hemodynamic responses of brain tissue to increased neural activation (Jones et al., 2001; Malonek et al., 1997; Malonek and Grinvald, 1996; Mayhew et al., 1999b, 2000, 2001b; Nemoto et al., 1997). These changes represent the intrinsic signals underlying the blood oxygen level-dependent (BOLD) response in functional magnetic resonance imaging (fMRI) (Ogawa et al., 1993a). The whiskers of the rodent project to discrete areas of the contralateral somatosensory cortex generally referred to as the barrel cortex. The tight spatial coupling between cortical tissue and its vascular supply combined with the well-known anatomy and physiology of the system makes it attractive as a model for investigation into vascular changes produced by local stimulation (Woolsey, 1996; Woolsey and Rovainen, 1991). The use of this preparation is commonplace in fMRI studies (Hyder et al., 2000; Mandeville et al., 1999a, b ; Silva et al., 2000), also in OIS experiments (Jones et al., 2001; Lindauer et al., 2001; Mayhew et al., 2000; Nemoto et al., 1999), and in studies relating flow to activation using laser Doppler flowmetry (LDF) (Ances et al., 2000; Lindauer et al., 1999).
Most previous studies were conducted using anesthetized preparations. However, the effects of different anesthetics may produce marked differences in the activation-flow coupling (Bonvento et al., 1994; Jones et al., 1995; Lindauer et al., 1993). Furthermore, fMRI studies in the unanesthetized rat (Lahti et al., 1998, 1999; Peeters et al., 2001) and OIS studies in monkey (Shtoyerman et al., 2000) show hemodynamic responses to stimulation are significantly larger in unanesthetized animals. This is thought to be due to reduced neural activity and blood flow coupling in the anesthetized state (Buxton, 2001; Vanzetta and Grinvald, 2001). Although the major hemodynamic response to neural activation is a large inflow of oxygenated blood to the activated area, several reports have noted a brief shorter latency increase in deoxygenated blood (Jones et al., 2001; Mayhew et al., 2000, 1999b; Nemoto et al., 1999). This initial deoxygenated “dip” (so called because it gives rise to a decrease in the fMRI BOLD signal) was interpreted as evidence for a rapid increase in oxygen consumption in the active cortex before the increase in blood volume and flow. However, this finding is controversial, being observed consistently in some laboratories (Jones et al., 2001; Malonek and Grinvald 1996; Mayhew et al., 2000, 1999a; Nemoto et al., 1999) but not in others (Lindauer et al., 2001; Silva et al., 2000). Some of the reasons for this discrepancy are described in Mayhew et al. (2000). A recurring theme is the possible effect of different types and levels of anesthesia used in the different laboratories. The present report informs this debate by comparing the hemodynamic responses of activated somatosensory cortex in anesthetized and unanesthetized animals.
MATERIALS AND METHODS
Optical imaging spectroscopy was used to monitor the hemodynamic response of contralateral somatosensory cortex to air-puff stimulation of the whiskers in four anesthetized and four unanesthetized rats. The unanesthetized group was imaged once a day for 4 days, whereas the anesthetized group was imaged two or three times immediately after barrel cortex location. Control experiments in the unanesthetized preparation included stimulation of the ipsilateral whiskers and operation of the equipment with the air stimulator directed away from the animal.
Experimental groups and design
The subjects were Hooded-Lister rats weighing between 300 and 400 grams and kept in a 22°C, 12-hour dark/light-cycle environment with free access to food and water. All aspects of this study were performed with Home Office approval under the Animals (Scientific Procedures) Act of 1986.
Unanesthetized animal preparation
Training
The main problems with imaging the cortex of unanesthetized animals are the artifacts in illumination and light transmission produced when the animal moves. Procedures were therefore developed to train the animals to tolerate head restraint for periods exceeding 15 minutes.
Rats were handled daily during the first week of a 3-week preoperative training period during which they were given free access to food. During the second and third week of the preoperative training period, rats were placed daily into a felt and Velcro harness (design available from the author) and trained to accept restraint for progressively longer periods. The harness was suspended such that the animal's paws could not make contact with the table. At this time, animals were placed on a restricted diet (to maintain body weight to at least 90% of normal levels) and rewarded with sucrose solution or evaporated milk during restraint periods. Initial struggling and vocalization diminished by the second or third session, enabling the restraint period to be increased to 40 minutes or longer.
Surgery and imaging apparatus
Animals were anesthetized with an intraperitoneal injection of xylazine and ketamine (1.1 mL/kg). The skull overlying the somatosensory cortex (1 to 5 mm posterior and 4 to 8 mm lateral to bregma) was thinned to translucency with a dental drill under constant cooling with saline. Retaining skull screws were implanted anterior and posterior to the thinned window. The thinned window was then coated with a thin layer of cyanoacrylate to provide added strength and reduce skull regrowth. A custom stainless-steel well was positioned over the window and set in place with dental cement packed around the skull screws. The animal was left to recover for a minimum of 4 days before any imaging experiments were performed. The steel well was filled with saline (warmed to 37°C) and a 3-mm medical endoscope (Endoscan Ltd) was screwed into position in the well. The endoscope, which provides both illumination of the cortex and transmission of the reflected image to a 12-bit SMD (Silicon Mountain Design; 1M60) digital camera, permits fast configuration of the imaging apparatus. This is necessary to keep animal restraint time to a minimum and avoids the need to finely adjust the position of either the animal or the camera for optimal image transmission. To reduce head movements, a pneumatically operated clamp tightly gripped the implanted well, which allowed instant release of the animal if signs of stress were exhibited.
Anesthetized animal preparation
Surgery and imaging apparatus
Animals were anesthetized with an intraperitoneal injection of urethane (1.25 g/kg) for all surgical procedures and experiments. The surgical details of the acute preparation for the barrel cortex are described in detail elsewhere (Jones et al., 2001; Mayhew et al., 2000, 2001b; Zheng et al., 2001a). The main deviations from the previously described unanesthetized preparation were that a plastic well was implanted and the endoscope was not used. The image is instead focused onto the SMD digital camera using a 50-mm lens. Not using the sealed endoscope imaging system additionally allows the positioning of an LDF probe (Perimed, Stockholm, Sweden; time constant, 0.2 seconds) that is used to measure CBF concurrently during spectroscopic experiments. Because the LDF system uses a helium-neon laser with a wavelength of 632.8 nm, a notch filter (± 5 nm) at this wavelength was attached to the spectrograph and the “white light” illumination was low-pass filtered (< 624 nm) to prevent cross talk. For all anesthetized animals, blood gas analyses were performed and end-tidal C
Single-wavelength optical imaging
Imaging with the lens/camera setup in the anesthetized animals was performed at 590 nm (full width half maximum [FWHM] 5 nm) (Jones et al., 2001; Mayhew et al., 2000). However, this wavelength did not provide sufficient illumination when used with the endoscope. In these studies, broadband 624-nm illumination (FWHM 50 nm) was used. All experiments consisted of 30 consecutive trials, for each of which 12 seconds of data were recorded at 7.5 Hz, with a 1-second air-puff (5 Hz) stimulation at 8 seconds (the whole whisker pad was deflected approximately 3 to 4 mm). The intertrial interval was 25 seconds. Data were averaged over trials on a frame-by-frame basis and then analyzed further to locate the barrel cortex. A signal source separation algorithm exploiting a “weak model” of the expected temporal response was used to filter out low-frequency noise and isolate the response to stimulation, as described in more detail elsewhere (Zheng et al., 2001a). The results of the single-wavelength experiments are shown in Fig. 1.
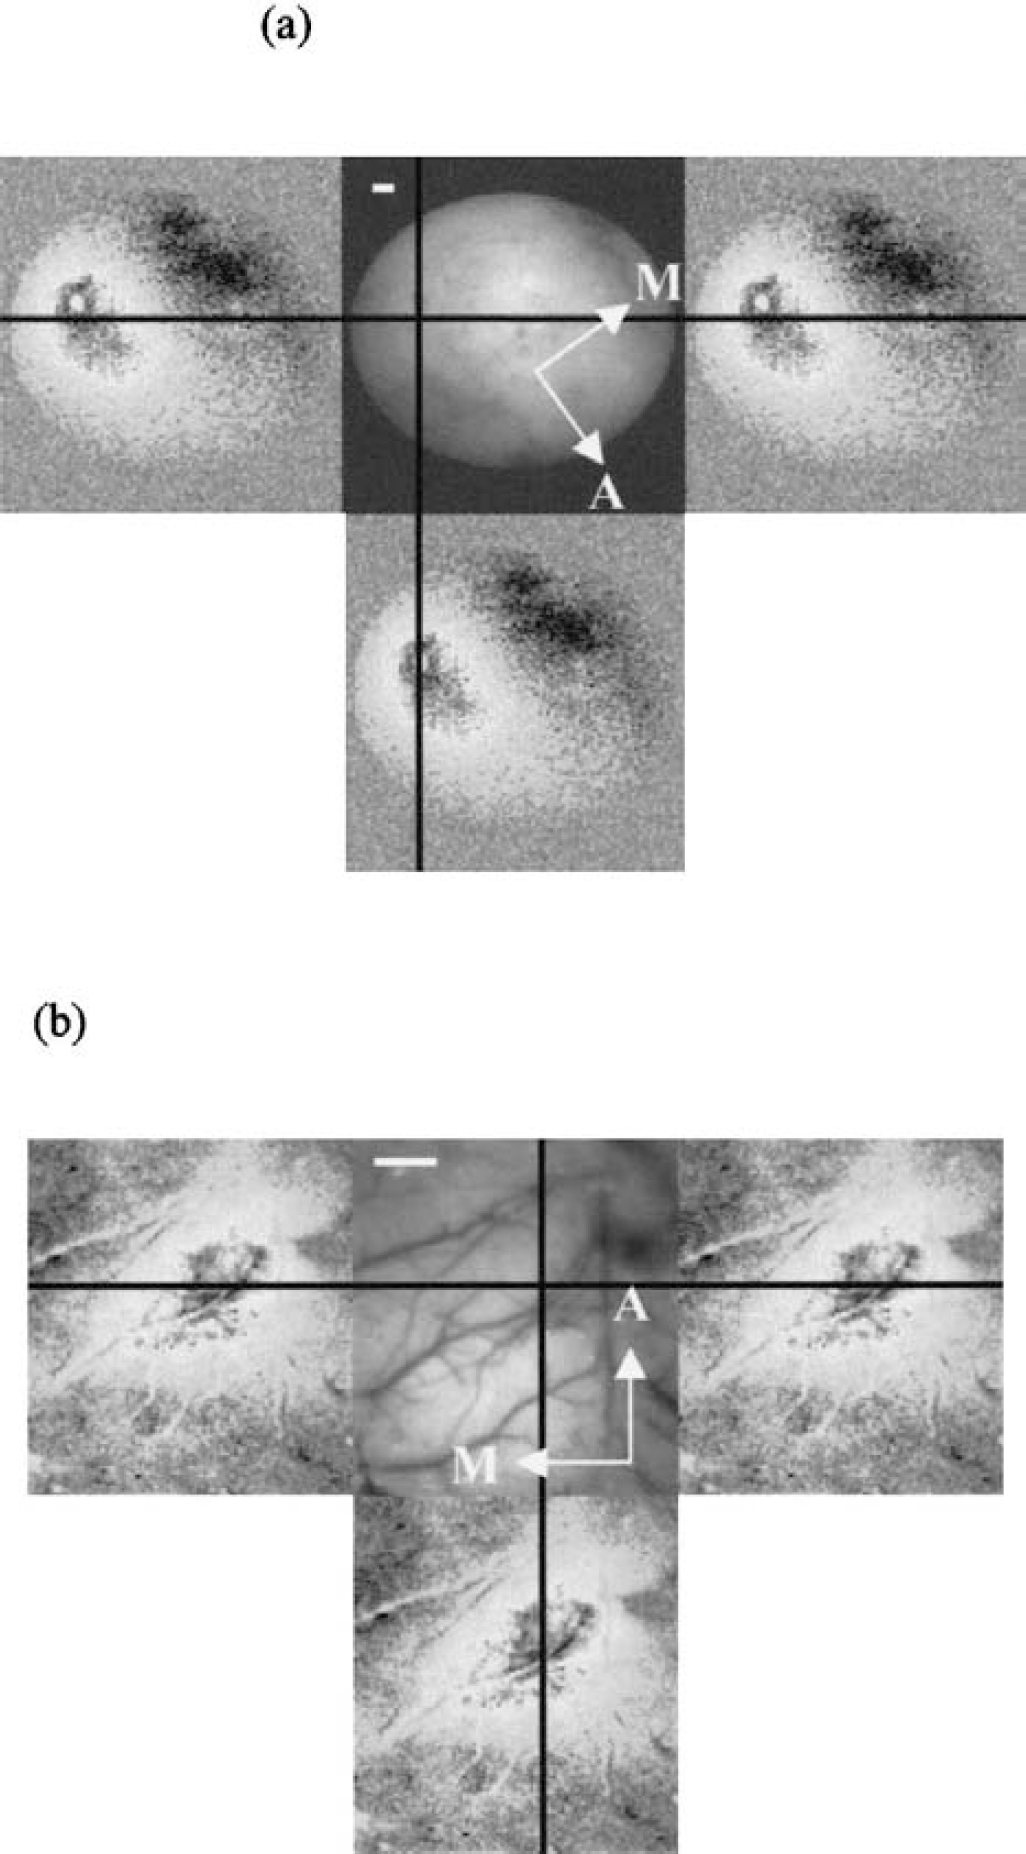
Barrel cortex activity in unanesthetized and anesthetized preparations (different rats).
Optical imaging spectroscopy
After barrel cortex localization, a spectrograph slit (250-μm wide for unanesthetized animals and 100-μm wide for anesthetized animals) was placed over the area of maximum activation. The data-collection procedure again consisted of 30 trials with an intertrial interval of 25 seconds. For each trial, 15 seconds of data were taken with a 1-second period of stimulation starting at 8 seconds. The data were averaged over trials and then submitted to pathlength scaling analysis (Mayhew et al., 2000, 1999b). This algorithm modifies that used by Cope (1991) by including terms for differential pathlengths over the range of wavelengths used. The current study uses wavelengths in the range of 505 to 620 nm. As in our earlier work, we assumed a baseline value of between flow (Hbt) of 100 μmol/L and a saturation baseline of 0.5 (Jones et al., 2001; Mayhew et al., 2000).
RESULTS
The magnitude of the hemodynamic responses was considerably larger in the unanesthetized group. There was little difference in the time to peak or the onset latency of the responses across groups. Summaries of response magnitude and time-to-peak and onset-latency data are given in Tables 1 to 3.
Mean response magnitudes for optical imaging spectroscopy time series from all stimulation experiments
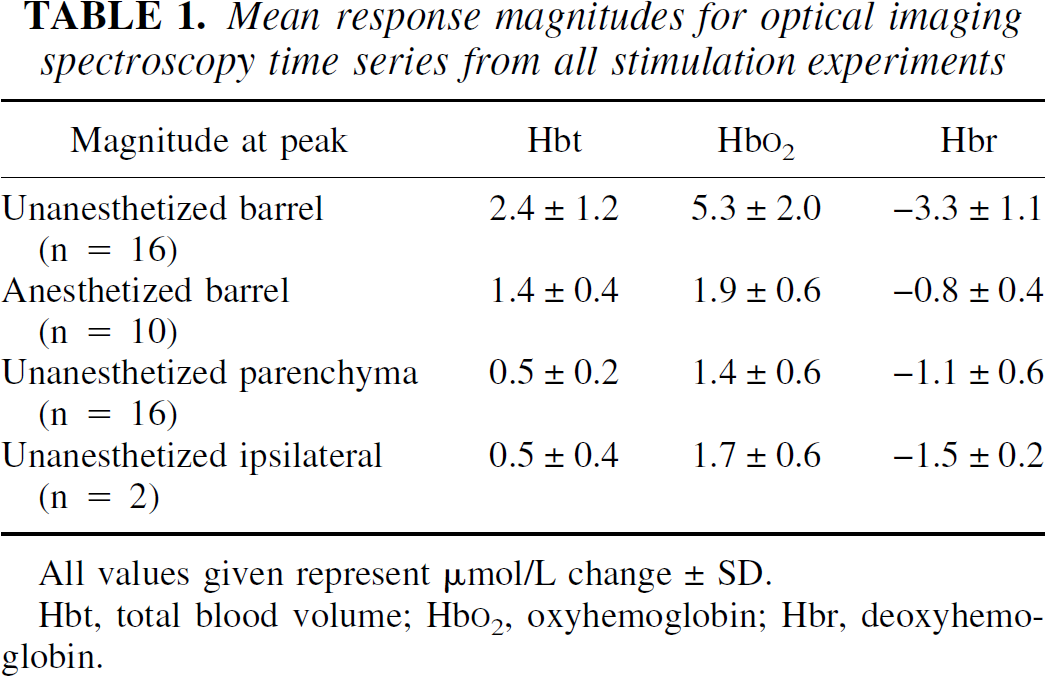
All values given represent μmol/L change ± SD.
Hbt, total blood volume; Hb
Time to peak for optical imaging spectroscopy time series from all stimulation
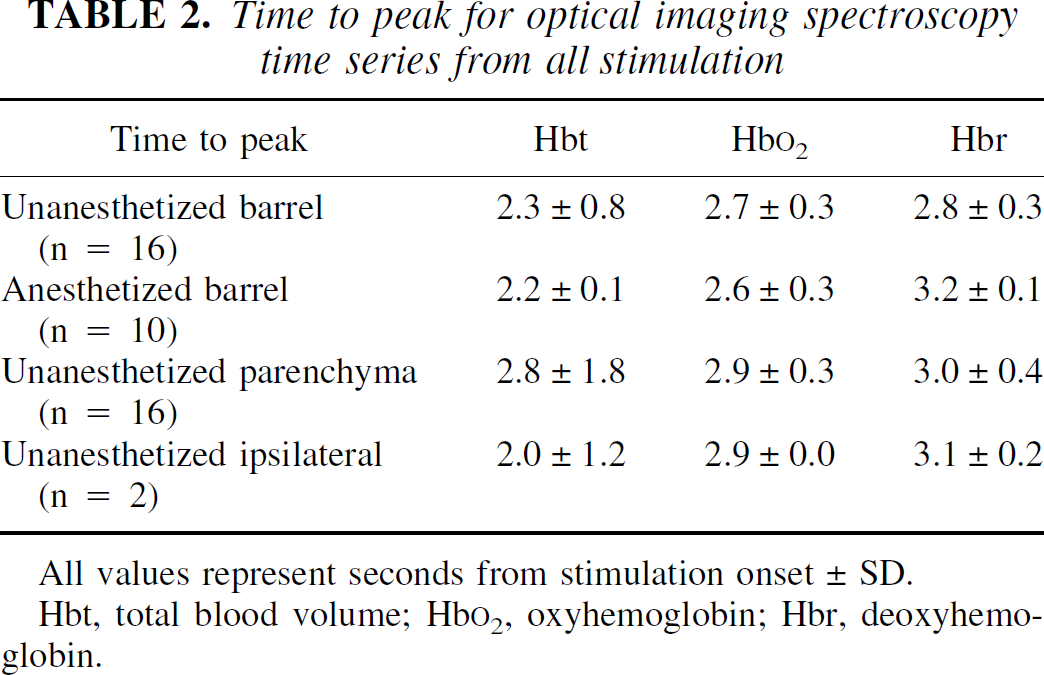
All values represent seconds from stimulation onset ± SD.
Hbt, total blood volume; Hb
Onset latency (50% of normalized peak magnitude) for all optical imaging spectroscopy time series from all stimulation experiments
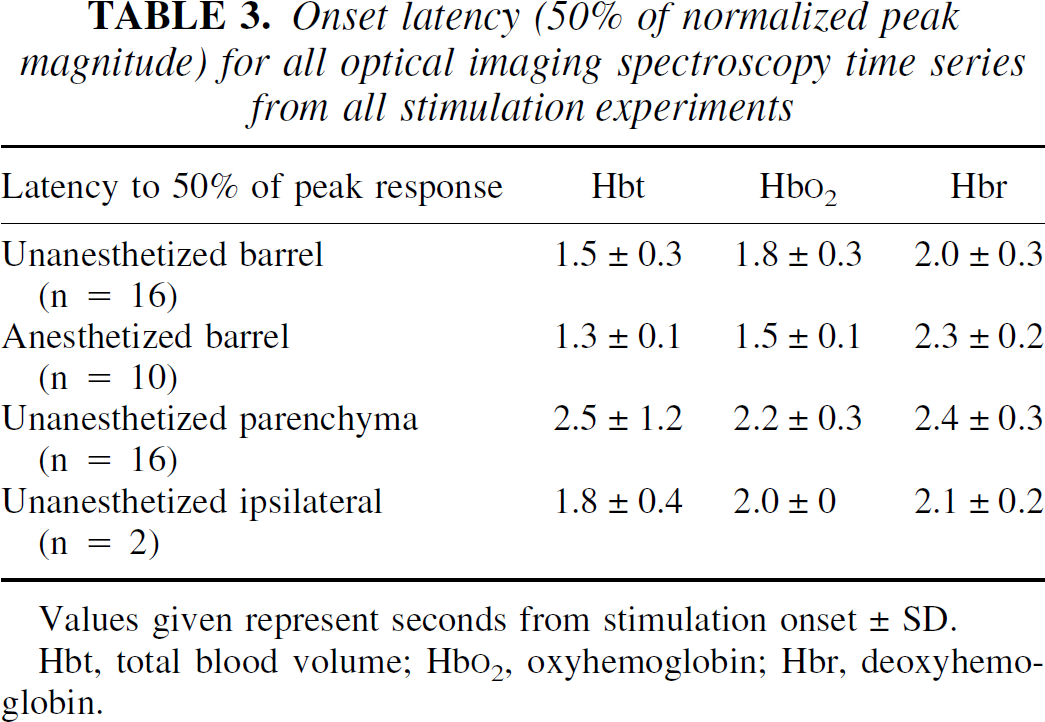
Values given represent seconds from stimulation onset ± SD.
Hbt, total blood volume; Hb
Unanesthetized group
Figure 2A shows the mean OIS time-series response to stimulation of the whole whisker pad in the unanesthetized rat. The time series shows a small and fast blood volume increase peaking approximately 0.7 seconds after the onset of stimulation. We refer to this component as the startle response (SR). After the SR, the deoxyhemoglobin decreased by approximately 3 μmol/L whereas Hbt and oxyhemoglobin increased by approximately 2.4 and 5.3 μmol/L, respectively, reaching a peak approximately 2.5 seconds after stimulation onset.
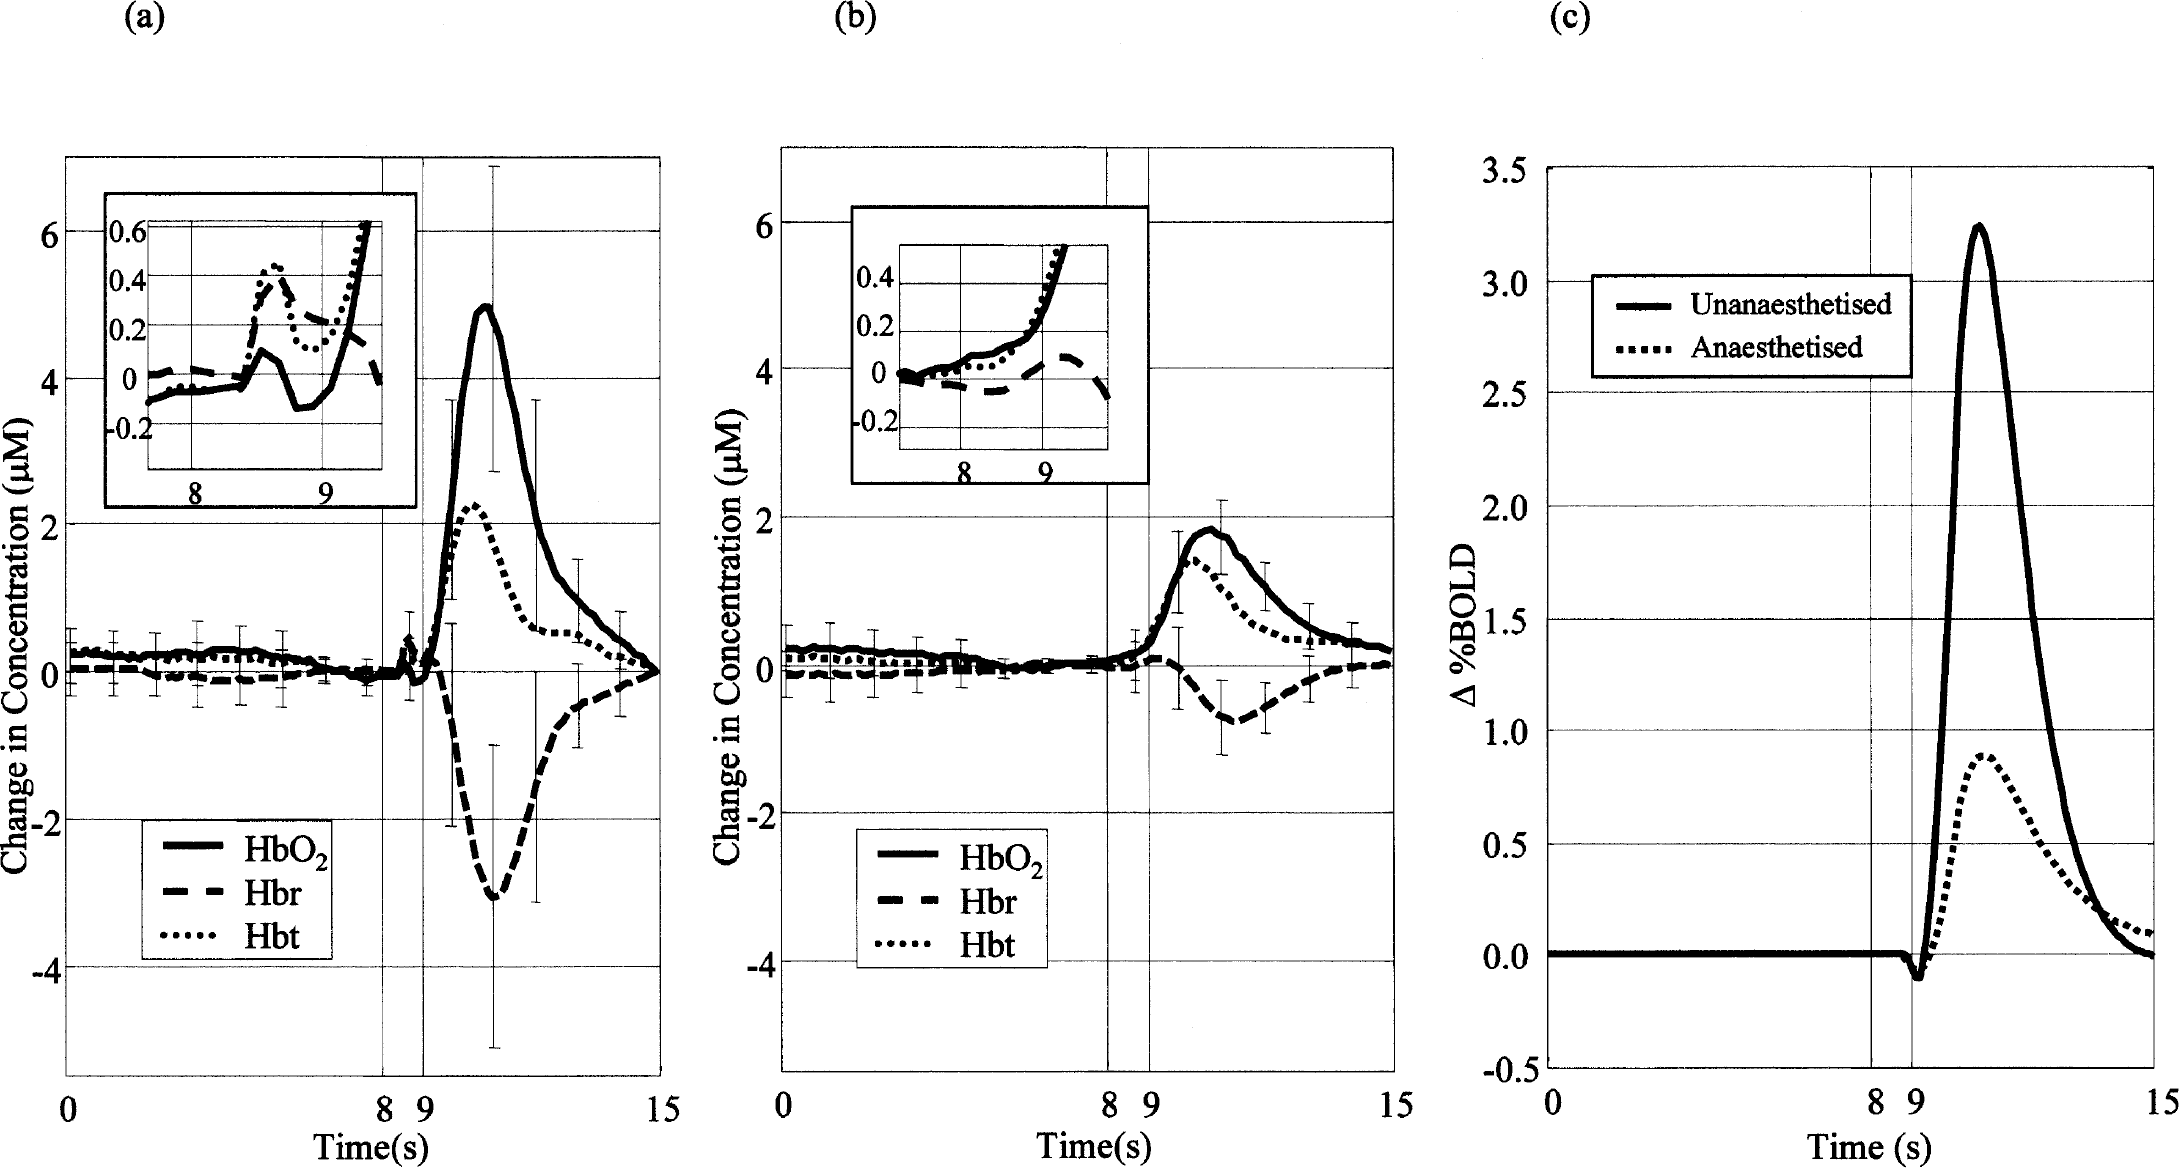
Mean times series of oxyhemoglobin, deoxyhemoglobin, and total blood volume from the barrel cortex in unanesthetized and anesthetized rats after air-puff whisker stimulation (for 1 sec at 5 Hz after 8 seconds).
Anesthetized group
Figure 2B shows the responses from the acute anesthetized preparation. The response was much smaller than in the unanesthetized preparation and the SR response was absent. Changes in deoxyhemoglobin showed a small increase peaking approximately 1.6 seconds after stimulus onset, followed by a decrease of approximately 0.8 μmol/L that reached a minimum approximately 0.4 seconds later than in the unanesthetized preparation. The time series of Hbt and oxyhemoglobin have a similar temporal profile to the unanesthetized animal data, but are approximately two and three times smaller, respectively (peak value ratios).
Unanesthetized animals control experiments
Figure 3A shows the response to contralateral stimulation in the unanesthetized rat in parenchyma regions outside the barrel cortex. Both a hemodynamic response and SR were present. Blood volume and deoxyhemoglobin again peaked at approximately 0.7 seconds, though the magnitude was smaller than that of the barrel region. The peak response in Hbt and oxyhemoglobin were slightly slower (approximately 0.5 and 0.2 seconds) but approximately four times smaller than the barrel responses. The deoxyhemoglobin decrease was approximately 0.2 seconds slower and one third the magnitude of the decrease in the barrel region. Figure 3B shows the barrel cortex response from one rat to ipsilateral stimulation. This response is similar to that of the parenchyma response to contralateral stimulation shown in Fig. 3A. Figure 3C shows that no hemodynamic response was produced when the air stimulator was directed away from the whisker pad.
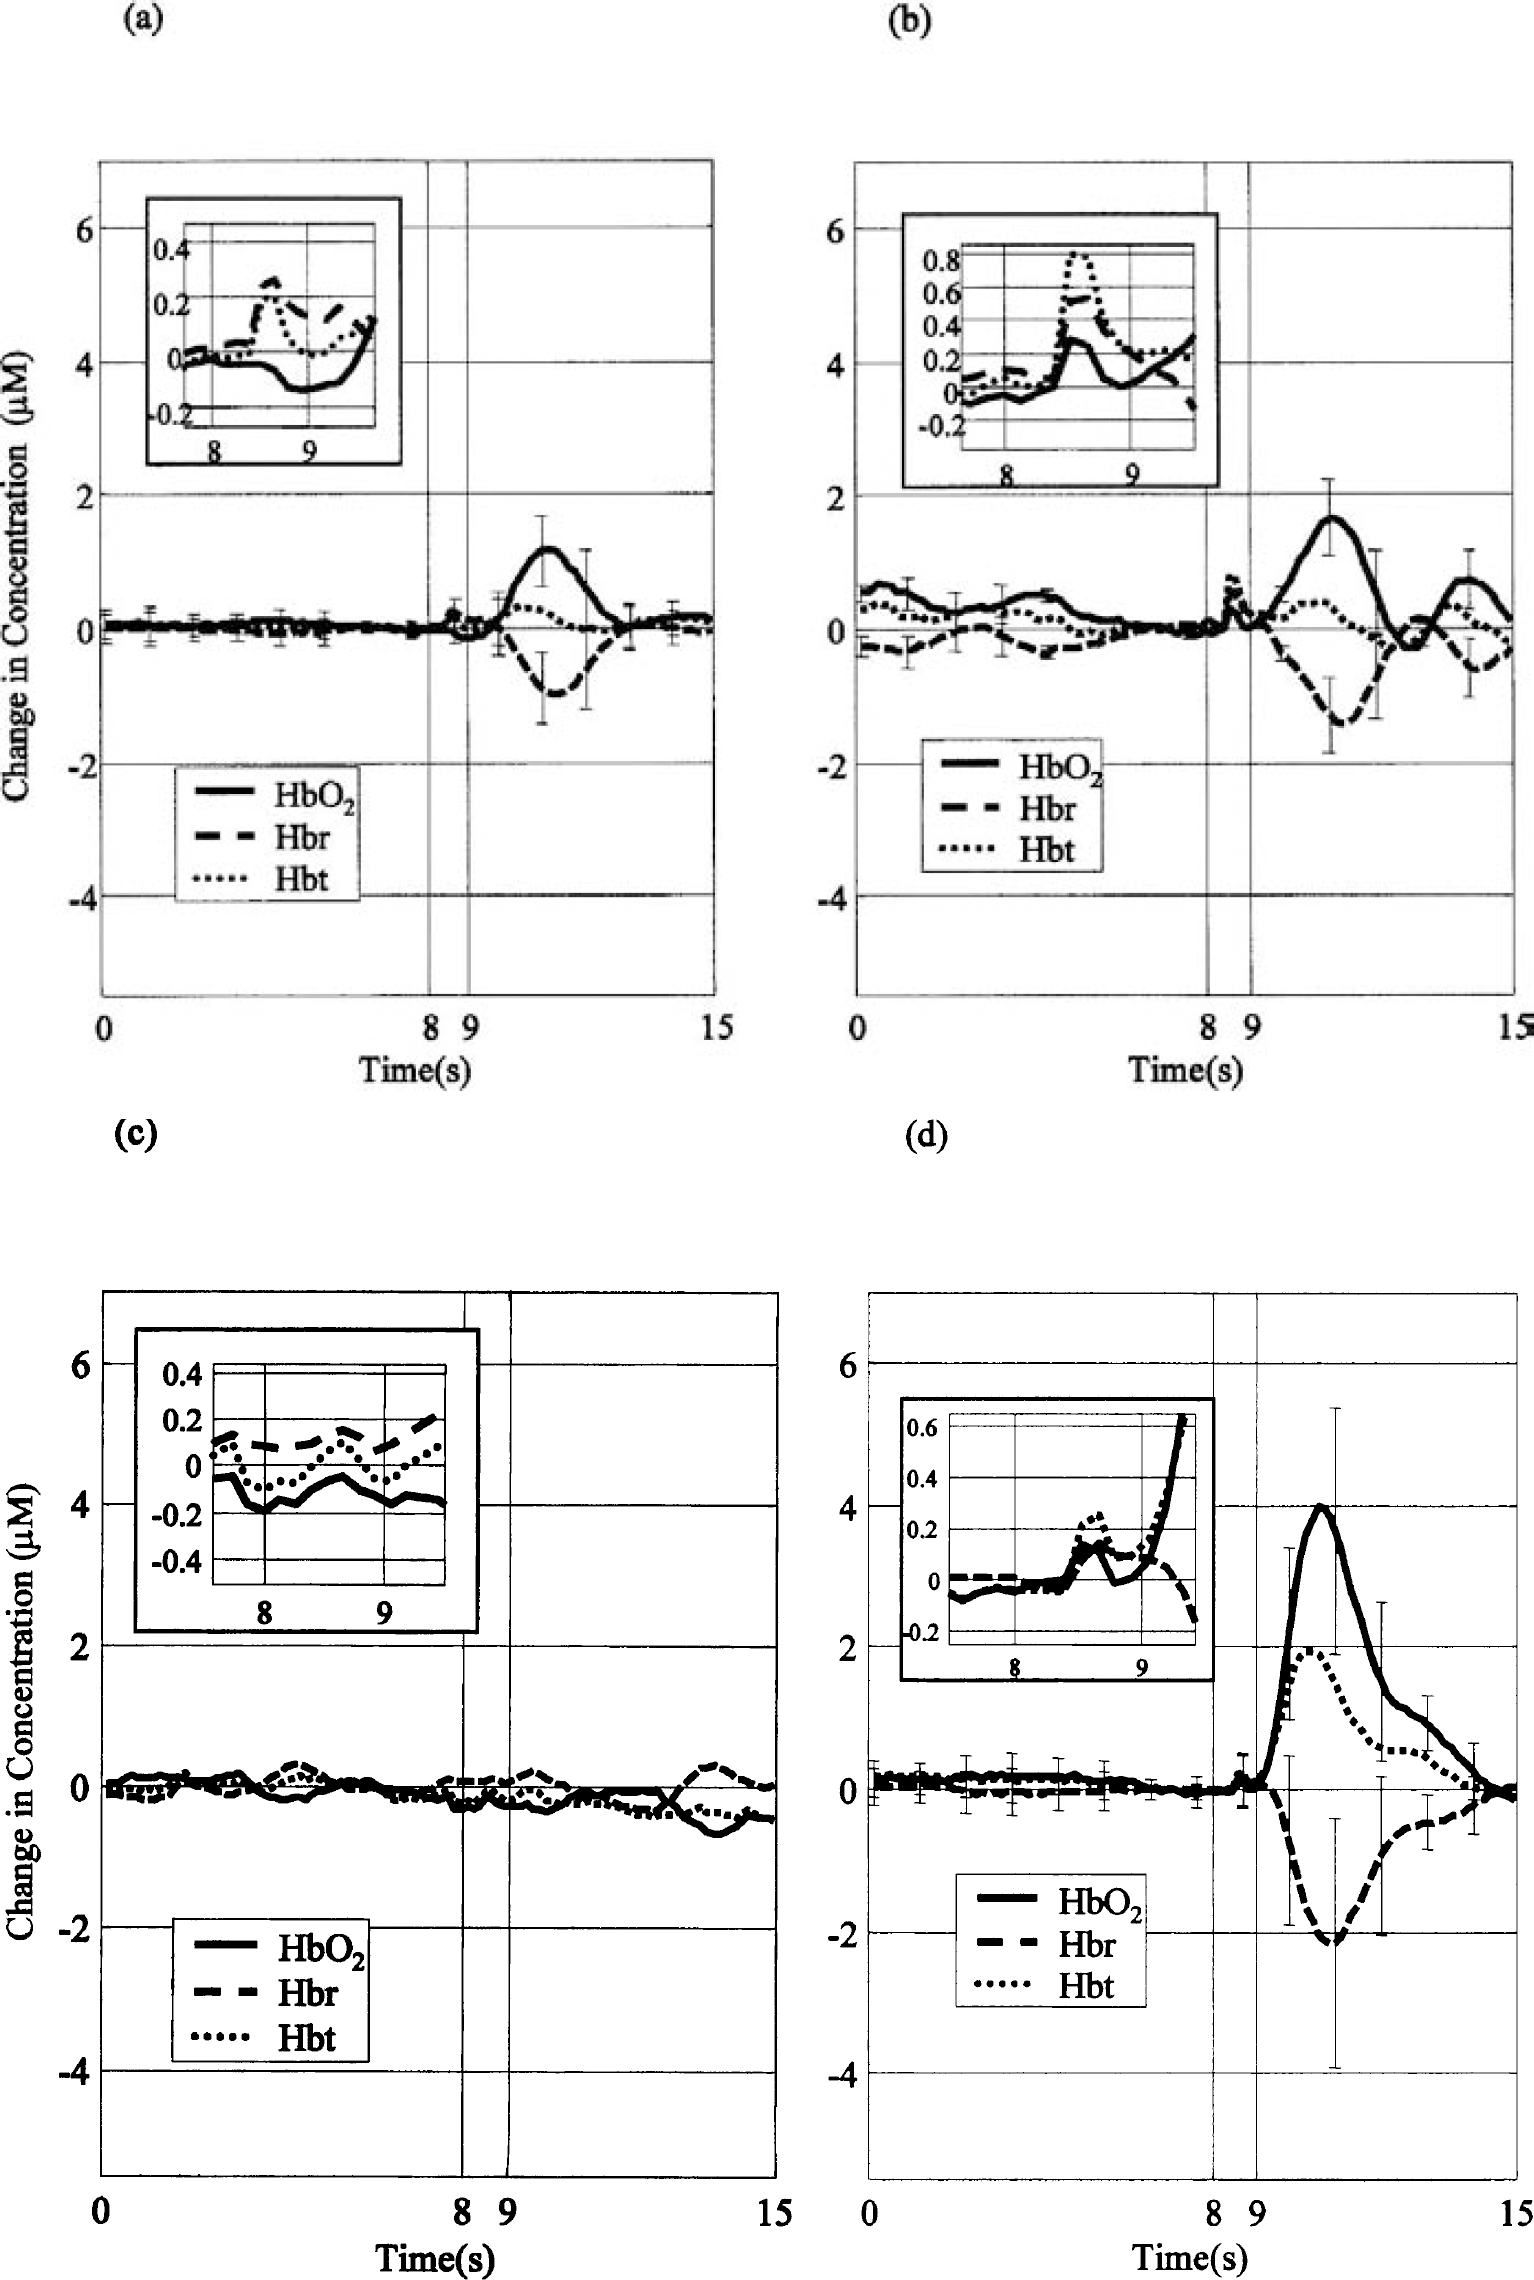
Control experiments: OIS time series in unanesthetized rats after 1-second air-puff stimulation (at 5 Hz after 8 seconds).
Figure 3D shows the hemodynamic response when the parenchyma control region was subtracted from the barrel region. Although the hemodynamic response is slightly reduced, it is still approximately two times the magnitude of the anesthetized data shown in Fig. 2B.
DISCUSSION
Comparison of hemodynamic responses after stimulation in the unanesthetized and anesthetized animals
The results presented here show marked differences in the hemodynamic response after physiologic stimulation between unanesthetized and anesthetized rats. The peak magnitude of the changes in oxyhemoglobin and deoxyhemoglobin are approximately two or three times greater in the unanesthetized than in the anesthetized preparation. Shtoyerman et al., (2000) in an OIS study also found larger hemodynamic responses in the unanesthetized primate compared with the anesthetized cat.
To compare our results with fMRI studies in the unanesthetized rat (Lahti et al., 1998, 1999; Peeters et al., 2001), we used the OIS time series data and the biophysical model proposed by Davis et al. (1998) based on the simulations of Boxerman et al. (1995a,b) to estimate the time series of the BOLD response:
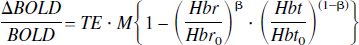
This equation relates fractional changes in the BOLD signal to fractional changes in the concentration of deoxyhemoglobin and Hbt under the assumption that TE and M are fixed parameters of the fMRI imaging sequence. The parameter 1 ⩽ β ⩽ 2 represents the partitioning of blood oxygenation-dependent susceptibility changes between micro- and macro-vasculature. We used a value of 1.5, but varying the value over the 1 to 2 range had little effect on the outcome. The predicted BOLD fMRI response for the unanesthetized group is larger than for the anesthetized group by a factor of between four and six (Fig. 2C). The relative size of the early deoxyhemoglobin increase (the “deoxy-dip,” so called in fMRI circles) in the predicted BOLD signal was much smaller than that in the measured changes in deoxyhemoglobin, and may explain why the deoxy-dip is elusive in fMRI studies using rats.
The cause of these differences in the hemodynamic response between unanesthetized and anesthetized preparations is not yet known. Urethane anesthesia produces a moderate cardiovascular depression (Field et al., 1993), whereas α-chloralose anesthesia reduces baseline CBF by more than 20% (Bonvento et al., 1994). The level of neural activity in response to stimulation may also be increased in unanesthetized animals because of an increased state of arousal (Lahti et al., 1998, 1999; Peeters et al., 2001). Although the mechanism remains to be elucidated, the hemodynamic response to stimulation is greatly increased in the unanesthetized preparation. Furthermore, the magnitude of the response to ipsilateral stimulation in the unanesthetized animal is of the same order as the response to contralateral stimulation in the anesthetized rat. We have not previously found a response to ipsilateral stimulation in anesthetized studies, though Shuler et al. (2001) recently showed that bilateral activity in the barrel cortex is callosally mediated.
The startle response
The temporal profile of hemodynamic responses in the unanesthetized group also differed from those in the anesthetized group. There was a fast and early rise in blood volume in the unanesthetized preparation that was not seen in the anesthetized animals or in any of our previous experiments (Jones et al., 2001; Mayhew et al., 2000, 2001b). This response, termed the startle response, was not the result of movement. “Movies” of the single-wavelength experiments were made from which the SR was clearly seen to arise from brain tissue and not in the surrounding skull. The SR was still present when the ipsilateral whiskers were stimulated (Fig. 3B), suggesting that it was a whole-brain response.
The SR is a common phenomenon found in both human and animal studies, usually in response to a loud acoustic stimulus. The control experiment, where the rat was subjected to the noise of stimulation only (Fig. 3C), showed that the SR was not driven acoustically. Some studies have monitored the SR arising from air-puff stimulation. Notably, Taylor and Printz (1996) found that stimulation onset gave rise to an increase in heart rate (tachycardia) with a latency of 0.8 seconds. This initial tachycardia has the same temporal characteristics as the fast response seen in our data. Although we did not expect to observe the SR, it is a phenomenon that has been extensively researched and even used as a behavioral tool to investigate sensorimotor information processing (Fendt and Koch 1999).
Figure 3A shows that the time series of the response in the unstimulated parenchyma contains both a short-latency component and, later, a component occurring at a similar time to the response from the barrel region in the unanesthetized animal. We examined the possibility that the greater amplitude of the response in the unanesthetized preparation is due to the summation of a “general” SR and the normal anesthetized response. After subtraction of the time series of the response of the parenchyma from the barrel region, the response in the barrel region of the unanesthetized animal was still approximately twice as large as that in the anesthetized preparation. Evidence for the early dip (also residues of the early component of the SR), albeit reduced, was still present (Fig. 3D). Even when the time series of the parenchyma region was scaled appropriately so that the subtraction procedure removed the initial component of the SR completely, the resulting time series of the deoxyhemoglobin from the unanesthetized barrel-region response still showed evidence of the deoxy dip. Although the initial component of the SR shows little variation in latency of onset in different brain regions, the later components of the “hemodynamic” response showed marked temporal differences (particularly after the initial first 2 seconds of the response). Hence, we explored the use of regression modeling techniques to separate the initial component of the SR from the time series of the hemodynamic response.
The deoxy-dip
One of the goals of this study was to examine whether the deoxy-dip routinely observed in our anesthetized preparation was still present in the unanesthetized animal. This was masked by the appearance of the initial short-latency SR in the unanesthetized preparation. We used general linear model analysis (Friston 1994; Friston et al., 1994; Mayhew et al., 1998, 1999b) to examine whether the deoxy-dip was present in the unanesthetized rat. The model shown in Fig. 4A contained the acute anesthetized data, the first differential of those time series, a DC component, and two components to account for the SR (the vectors 0, 0.5, 1 and 0.5, 1, 0.5 at frames 64–66). This design matrix was fitted to the unanesthetized barrel-cortex response using least-squares analysis. The results are shown in Figs. 4B and 4C. Figure 4B shows the raw data and the fit that the general linear model analysis provides. The model accounts for almost all the data from the unanesthetized time series. Figure 4C shows the residue of the model fit. Although the magnitude of the later blood volume increase caused an increase in the residue, little residue was seen at the time points of the deoxy-dip and startle (8–10 seconds). This is evidence that the early response in unanesthetized rat is a combination of both the SR and the deoxy-dip. The deoxyhemoglobin time series from the unanesthetized animal after subtraction of the SR (modeled by the two previously described vectors) can be seen in Fig. 4D plotted with the anesthetized deoxyhemoglobin time series.
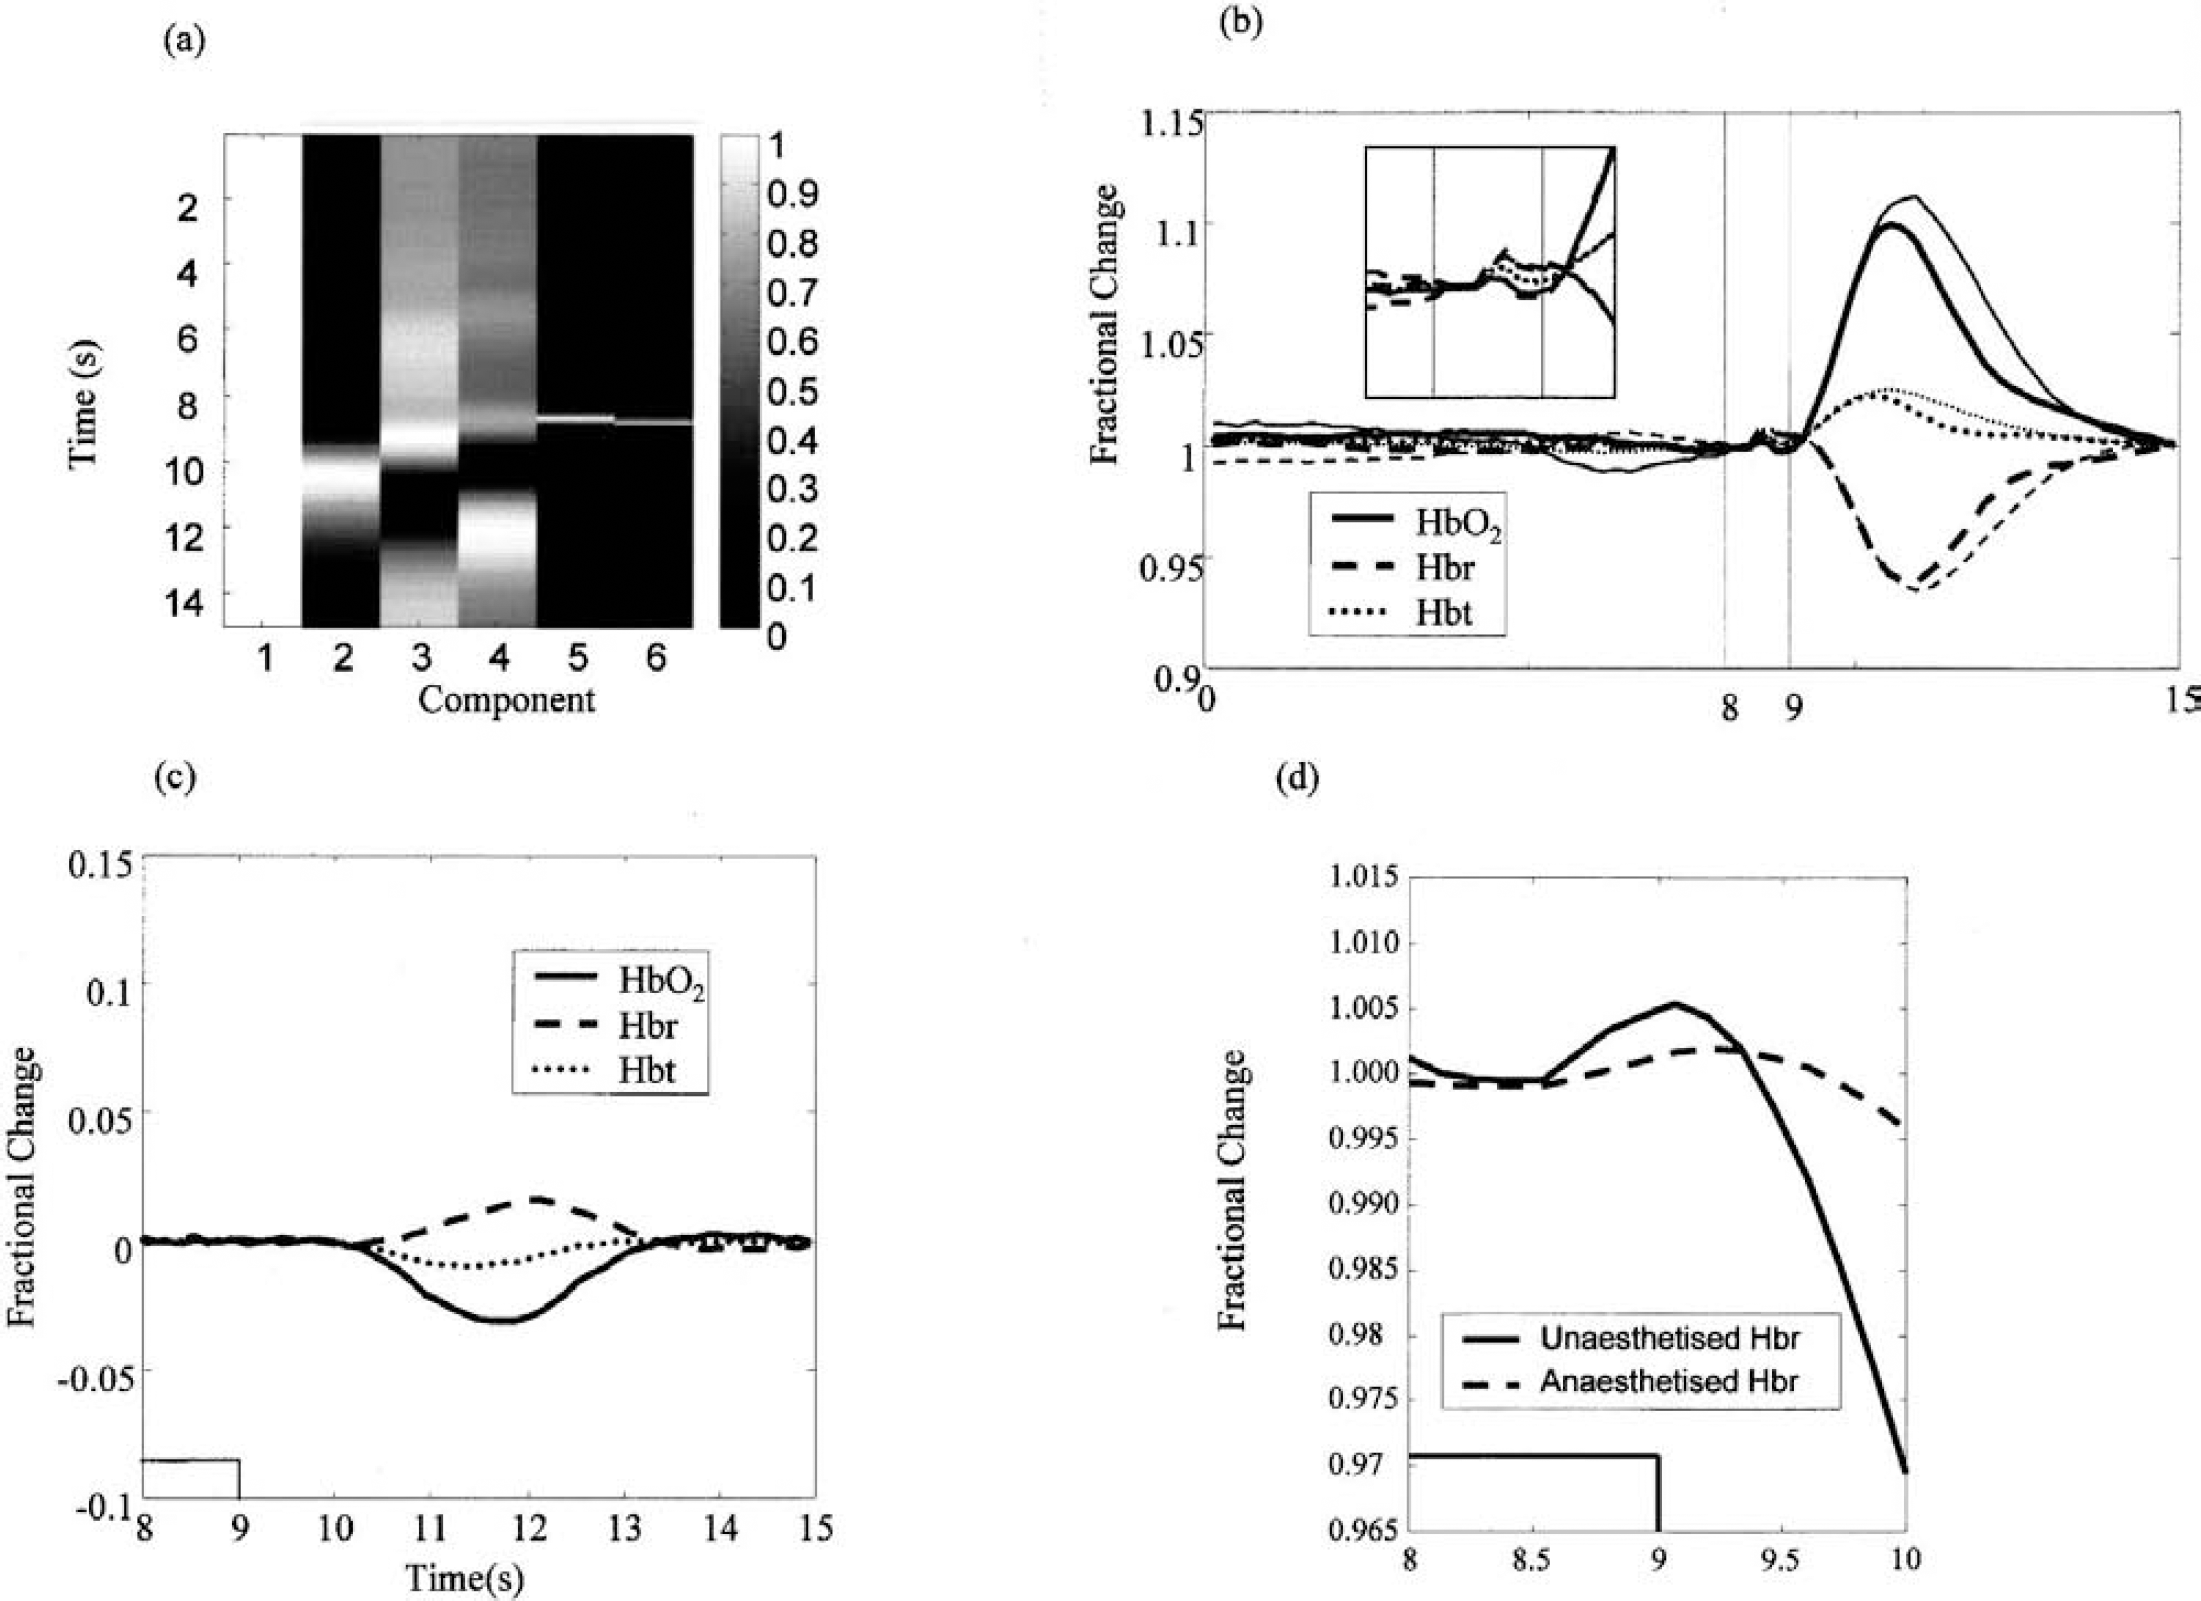
General linear model (GLM) analysis of the hemodynamic response in the unanesthetized rat.
There was an increase in deoxyhemoglobin peaking approximately 1 second after stimulus onset, which is approximately 0.4 seconds faster than the increase seen in the acute group. These data suggest that the presence of the deoxy-dip is not caused by the use of anesthetics in the experimental preparation, though it is slightly larger and peaks slightly earlier than that seen in the anesthetized group.
We are currently training animals to undergo event-related OIS (Martindale et al., 2000) to examine the effect of increased stimulus presentation frequency on the SR.
CMRo2 estimation and flow-blood volume relation
From OIS data, it is possible to calculate an estimate of cerebral metabolic rate of oxygen consumption using a modification of an equation used by Ogawa (1993b) and Mayhew (2001a).
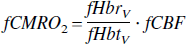
where f denotes fractional change with respect to baseline and the subscript v denotes venous compartment concentration. The normalization by blood volume (Hbt) accounts for the fact that OIS measures tissue concentrations rather than vascular concentrations. Although OIS measurements are from intrinsically well-mixed compartments, the assumption of a purely venous compartment provides a reasonable estimate of fCMR
Estimates of CMR
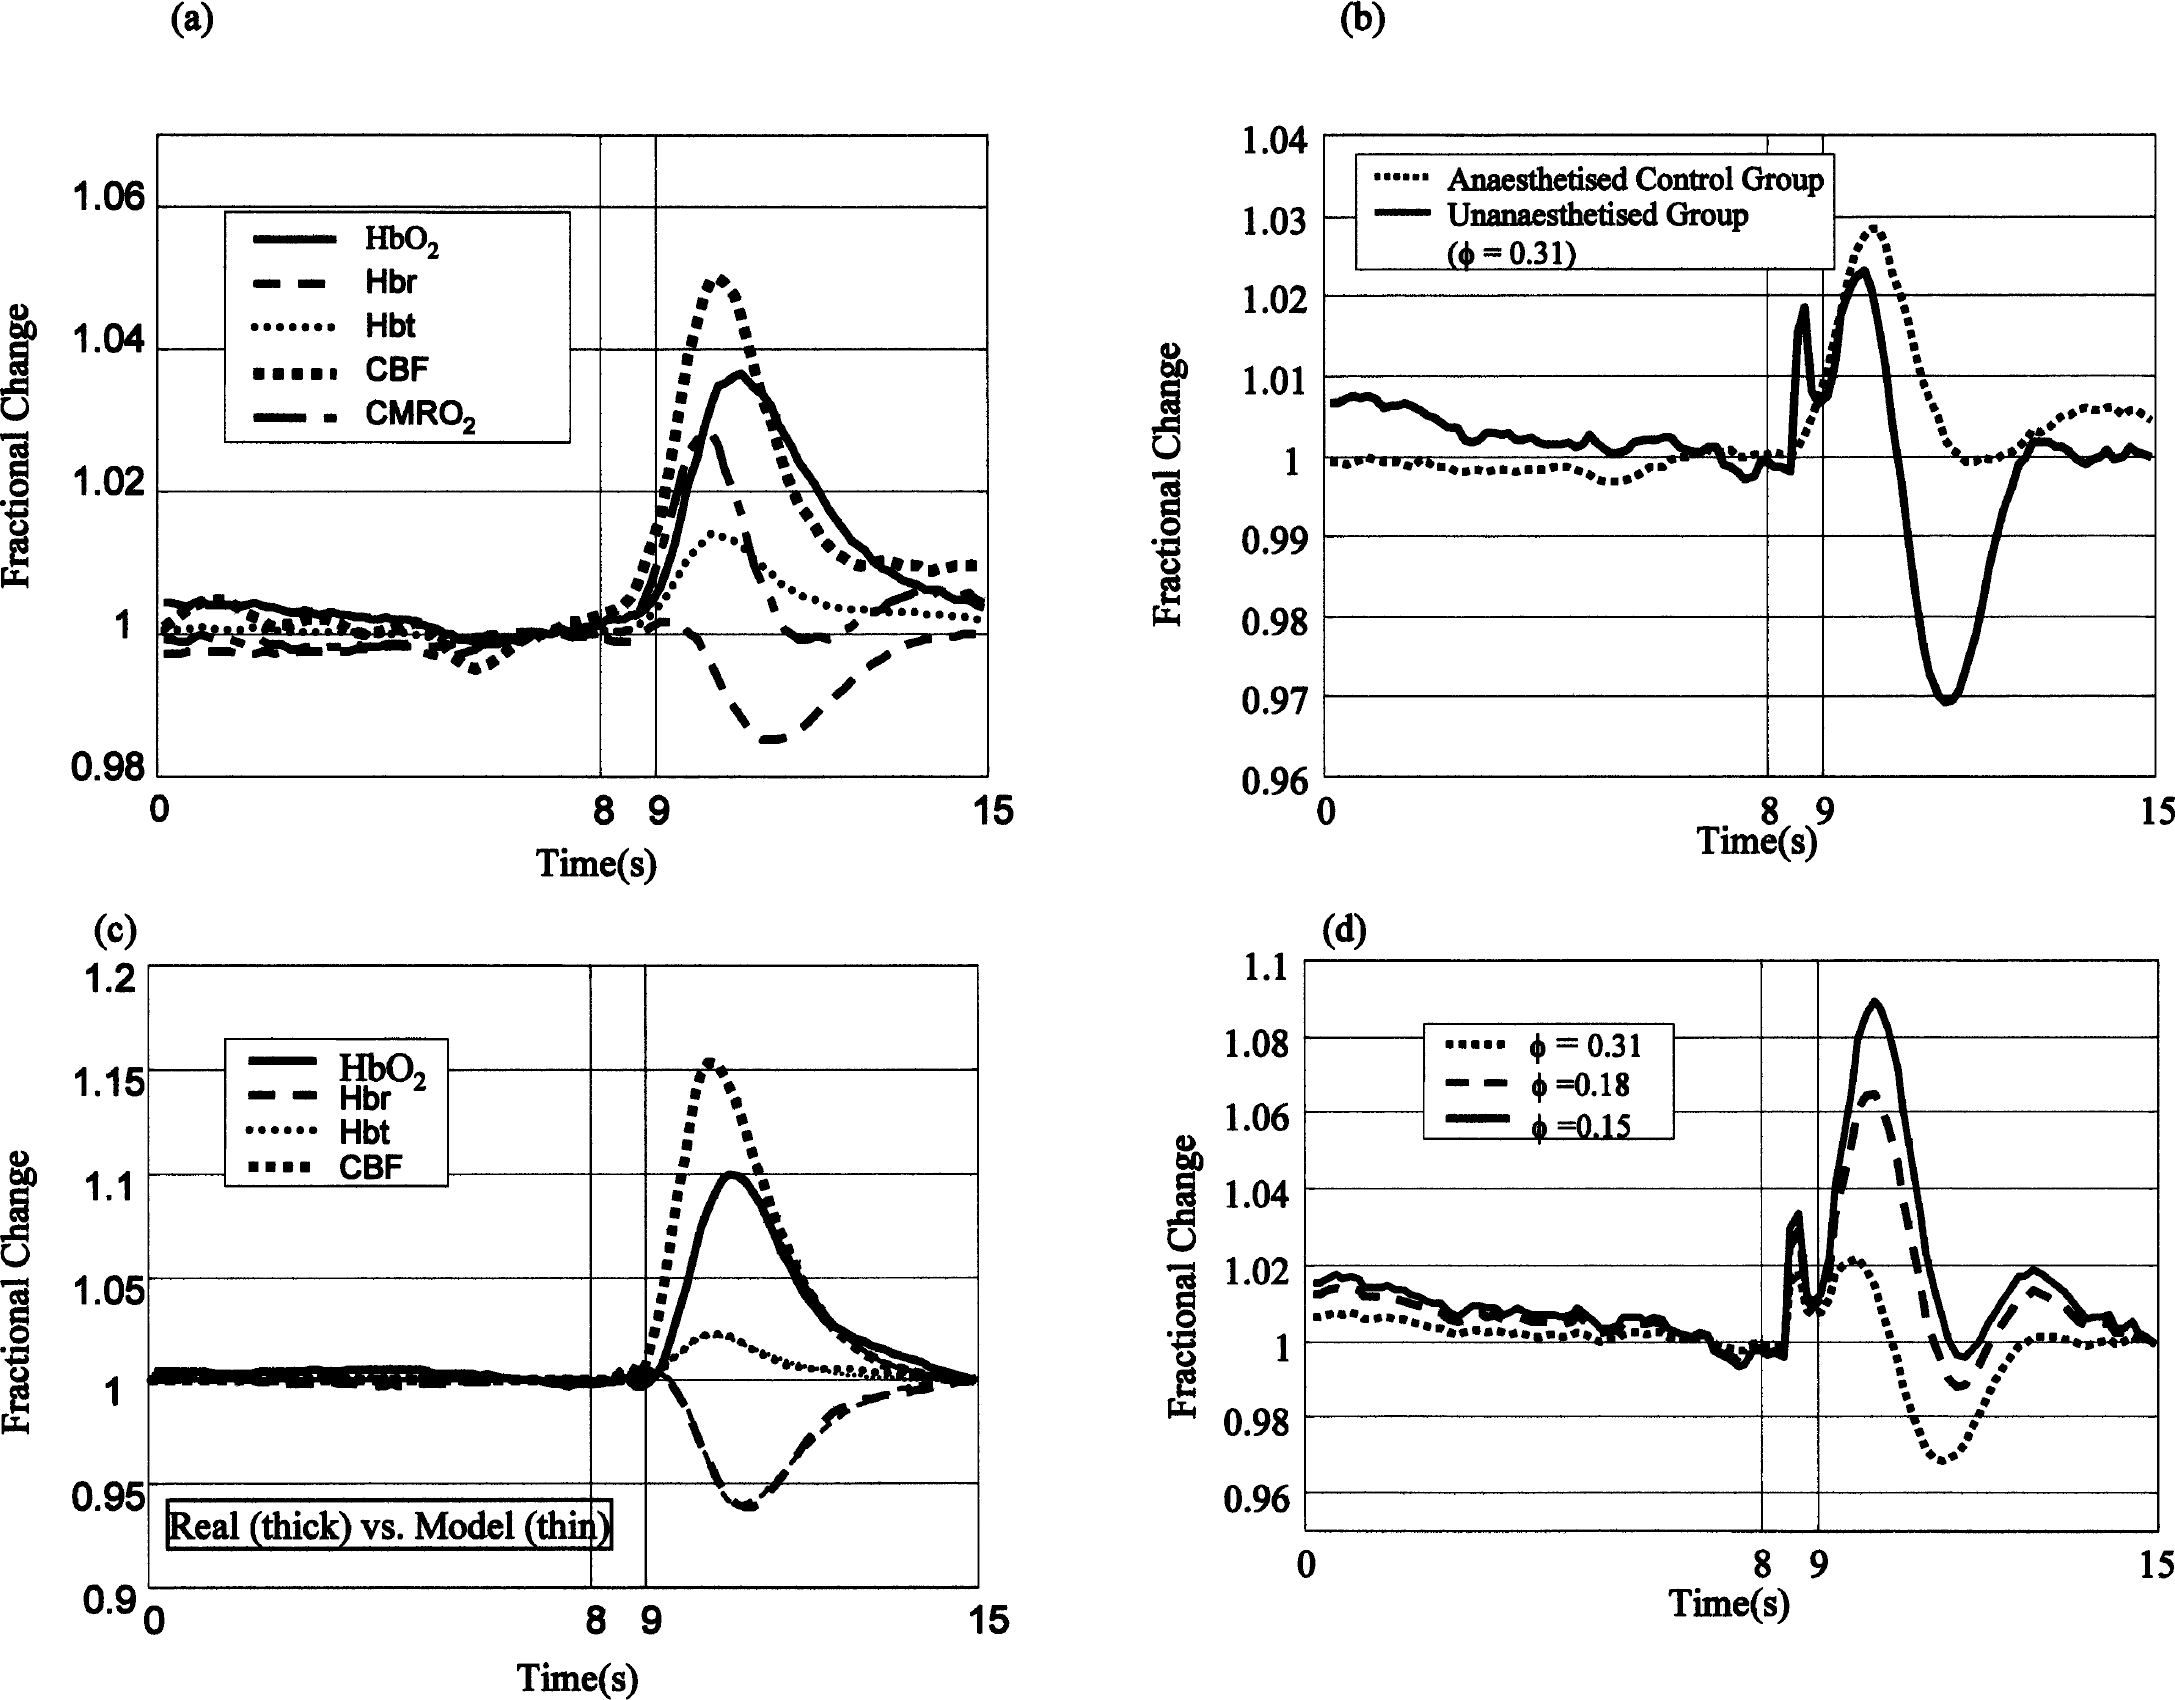
Using the concurrent OIS and LDF measures in the anesthetized animals, we obtained a value for φ of 0.3, which is in good agreement with our previous experiments (Jones et al., 2001, 2002). Using this value of φ and Eq. 3, an estimate of fCMR
Figures 5B and 5D indicate that the SR produces a marked spike in the time series of the estimates of CMR
Activation-flow coupling
The presence of the deoxy-dip in different studies may depend on factors in the preparation affecting the activation-flow coupling. There were slight differences (approximately 200 milliseconds) in the response latencies (Table 3). The measure of latency that we used was the time from stimulus onset to the time of normalized half-maximum excursion from prestimulation levels. Although the latencies for Hbt, oxyhemoglobin, and deoxyhemoglobin are slightly different in the separate conditions, the evidence for a difference in timing of the responses is neither striking nor convincing.
The major difference between the unanesthetized and anesthetized conditions was in the magnitude of the response amplitude. The amplitude of the Hbt change was approximately doubled in the unanesthetized animal, and the changes in oxyhemoglobin and deoxyhemoglobin were much larger.
These changes in the values of Hbt are “responsible” for the decreased exponent (0.3 to 0.15) in the relation linking volume changes to flow (Eq. 3). This admittedly indirect measure is further evidence suggesting that the coupling between blood flow and volume is significantly different in the unanesthetized and anesthetized animal.
Ideally, concurrent measures of CBF, Hbt, and deoxyhemoglobin in the unanesthetized animal should be taken, and we are currently developing a cranial well and imaging system that will house both the endoscope and the LDF probe to investigate this issue further.