
Abstract
The authors' high-spatial-resolution optical method was used to examine microvascular derangement in a focal cerebral cortex lesion in 12 Sprague-Dawley rats anesthetized with α-chloralose-urethane. A pial artery (approximately 40- to 50-μm diameter) was occluded by laser-beam cauterization (n = 6). Diluted carbon black suspension was injected into the internal carotid artery, and images in a 2-mm x 2-mm region of interest during tissue dye-dilution were recorded. Sequential frames were analyzed with Matlab software to evaluate blood distribution and mean transit time, affording a two-dimensional microflow map and histogram with first, second, third, and fourth moments. In the early phase of ischemia, blood distribution and average flow decreased (both P < 0.01), and the second moment (microflow heterogeneity) and third moment (skew to the left owing to increase in low-flow components) increased (P < 0.05 and P < 0.01, respectively). At approximately 2 hours, blood distribution decreased further in 3 cases, apparently because capillary stasis prevented carbon black filling. However, average microflow unexpectedly increased in 4 of 5 rats, presumably due to exclusion of unper-fused (low flow at the earlier stage) channels from the calculation. The authors conclude that flow in ischemic tissue is quite heterogeneous and that an averaged flow value tends to smear important information about ischemic microvascular derangement.
Keywords
Blood flow in ischemic regions of the brain is difficult to measure accurately. This is because no methods are available to determine absolute flow values without theoretical assumptions, most of which are practically difficult to validate. For example, the hydrogen gas clearance method, which was used to determine the values of ischemic threshold (Astrup et al., 1977, 1981), has a baseline instability, and the signal-to-noise ratio increases at low flow (Tomita et al., 1988). Autoradiographic methods using iodoantipyrine (Sakurada et al., 1978) suffer from not only variation of the partition coefficient (Λ) between blood and ischemic tissue, but also variability of a “factor m” described by Kety (1951). The factor m was defined by Kety as the effectiveness of the tissue-capillary diffusion equilibrium and can be a major source of error when chemical diffusible tracers are used (CBF = Λk/m) (Tomita and Gotoh, 1981; Tomita and Fukuuchi, 2001). In the ischemic tissue induced by middle cerebral arterial occlusion in cats, the factor m of hydrogen gas decreased from 1 to 0.64 (Tomita et al., 2001). This means that the assumption of instantaneous equilibrium of hydrogen gas at capillaries is not valid in ischemic tissue. Laser-Doppler flowmetry (Fabricius et al., 1997) measures averaged flow, smearing heterogeneity within a 1-mm2 region of interest (ROI), and missed a critical value in the ischemic core (Tomita et al., 2001). Even the scanning laser-Doppler technique (Heimann et al., 1994; Nielsen et al., 2000) yields only relative values with a limited temporal resolution owing to baseline instability. Dunn et al. (2001) reported a new method for dynamic imaging of blood flow using laser speckle. It has excellent spatial resolution, but measures only the flow in surface capillaries, missing intraparenchymal blood flow in layer IV, where synaptic activity is prominent. In general, we feel that more noninvasive techniques seem to require more assumptions, and the errors that may be involved seem to be larger. Accurate measurements of blood flow in ischemic tissue are still a matter of continuing investigation, because such measurements are essential for evaluating the pathologic condition of the ischemic tissue.
Recently, we reported an optical method (Schiszler et al., 1999, 2000) for measuring microvascular flow with a spatial resolution about 500 times higher than that of the laser-Doppler technique. Although our technique is invasive, tissue injury is likely to be less severe than that induced by a hydrogen electrode or microdialysis probe, which measures flow or substances in the target, but damaged, tissue in contact with the sensitive surface, whereas our technique measures flow in the intact layer between the light source and the brain surface. The method requires few assumptions, because it is based on small-pixel images of carbon black passage through capillaries after intracarotid injection of the dye. In addition, we can obtain histograms of microflow, which can be subjected to moment analysis (Tomita et al., 1983). The moments thus calculated provide additional information for evaluating microvascular derangement.
MATERIALS AND METHODS
All the procedures followed were in accordance with the guidelines of the Laboratory Animal Care and Use Committee of Keio University. Our optical method for measuring focal flow with a high spatial resolution was employed in food-deprived male Sprague-Dawley rats (n = 12), weighing about 250 g, under anesthesia induced by intraperitoneal administration of 70 mg/kg α-chloralose and 0.7 g/kg urethane. The details of this optical method have been reported elsewhere (Schiszler et al., 1999, 2000). Briefly, the rat sensorimotor cortex (about 1-mm thick) was transilluminated by optical fiber-conducted light from a halogen source through a band-pass filter at Λ = 550 ± 10 nm, one of the isosbestic points of hemoglobin. The transillumination technique was used because the transmitted light in a dark room consists purely of intrinsic signals of the cortex, especially from the intraparenchymal microvasculature, whereas reflected light arises mainly from the brain surface, is often disturbed with aberrant reflected light, and exhibits angular instability. A 200-μm outer diameter optical fiber (for comparison, the thickness of a human hair is approximately 80 μm) with a rounded tip was inserted into the brain parenchyma to deliver light from the light source (halogen lamp). The response of the brain tissue to microinjection of potassium solution was confirmed to remain unchanged after the lamp insertion, exhibiting repetitive concentric wave-ring spread of light transmission changes in the sensorimotor cortex accompanying spreading depression (Tomita et al., 2002). After the insertion of the fiber, a recovery period more than 1 hour was allowed before the experiment was commenced. Video recording of the transmitted light images through the cortex, focused on the pertinent microvasculature, was carried out by an SIT camera with a Nikon lens linked to a PC computer, and the images were also stored on videotape. To determine the regional mean transit time of blood, we used a carbon black suspension (CB: particle diameter 200 to 500 Å; the particles are invisible even under a high-power microscope) manufactured by Pelikan-Werke, Germany (which, however, has since ceased production of this suspension). A diluted CB suspension was prepared from one part of CB and 30 parts of Ringer solution, and a 25-μl aliquot was injected into the internal carotid artery. The optical density changes were monitored during the passage of the CB particles in the 2-mm x 2-mm ROI by capturing 200 frames at a rate of 10 frames/s through an 8-bit frame grabber card (Scion LG-3), and the time-sequence images obtained were stored. Figure 1 (upper) shows CB transit through artery, tissue, and vein in the form of subtraction images that were obtained by subtracting the first image of the brain surface (control video frame) from each subsequent experimental image. Differences were scaled to 8-bit images—that is, 1 (brightest) to 256 (darkest), with an intermediate level of 128—and displayed as pictures on the 256 grayscale, for which we employed arbitrary units of optical density (c) for convenience. With the aid of Matlab software (The MathWorks, Inc.), the ROI was divided into 50 × 50 matrices, creating 2,500 dilution curves (c[t]), where c denotes the dye concentration in a pixel at time t. Figure 1 (lower) illustrates dye dilution curves at all 2,500 pixels, an arterial curve recorded at arrow a, and a venous curve recorded at v. First, for all dye dilution curves, we calculated the height (H), which represents blood distribution to individual pixels or a scale factor of the dye dilution curves, and the mean transit time (MTT) of the dye. The calculation was based on the conventional equations (H = fc[t]dt and MTT = ft·c[t]dt/fc[t]dt). Changes in the height of the curve were calculated as the ratio of ΔH/ΔHc where c denotes the control. When a nondiffusible (intravascular) tracer is used, the flow changes depend largely on MTT, because MTT may vary many-fold from a control value to infinity, whereas CBV changes by only ± 20% at maximum. The error introduced by the assumption that CBV remains unchanged can therefore be regarded as negligible. (We previously observed that the CBV did not change during an exsanguination-reinfusion procedure, using the same method [Schiszler et al., 2000].) We tentatively defined 1/MTT as “microflow,” which was displayed on a two-dimensional (2-D) map and also plotted on the time variable as a frequency distribution (histogram). The microflow histogram was subjected to moment analysis using mathematical formulae that have been described previously (Tomita et al., 1983). The first moment represents the mean microflow value (mean) in the ROI. The second moment represents the standard deviation (SD) or dispersion of individual microflow values on the 2-D flow map. Because SD varies with mean, dimensionless dispersion (because curves were fitted to the γ distribution, we termed the dispersion “γ”) is a more practical measure, and was obtained as √SD/mean, resulting in an index of heterogeneity. The index varied between zero (homogeneous or uniform flow throughout the ROI) and unity (an exponential distribution). The third moment represents the skewness of the distribution, from which the coefficient of skewness (CS) was calculated. A positive value indicates a curve skewed to the right, and a negative value, one skewed to the left. The fourth moment yields the peakedness, or kurtosis. Curves with kurtosis less than 3 are calledplatykurtic, and those greater than 3, leptokurtic. Moments for each of the 6 rats were obtained both at 10 minutes after arterial occlusion (the “early” phase of ischemia) and at approximately 2 to 3 hours after arterial occlusion (the “late” phase).
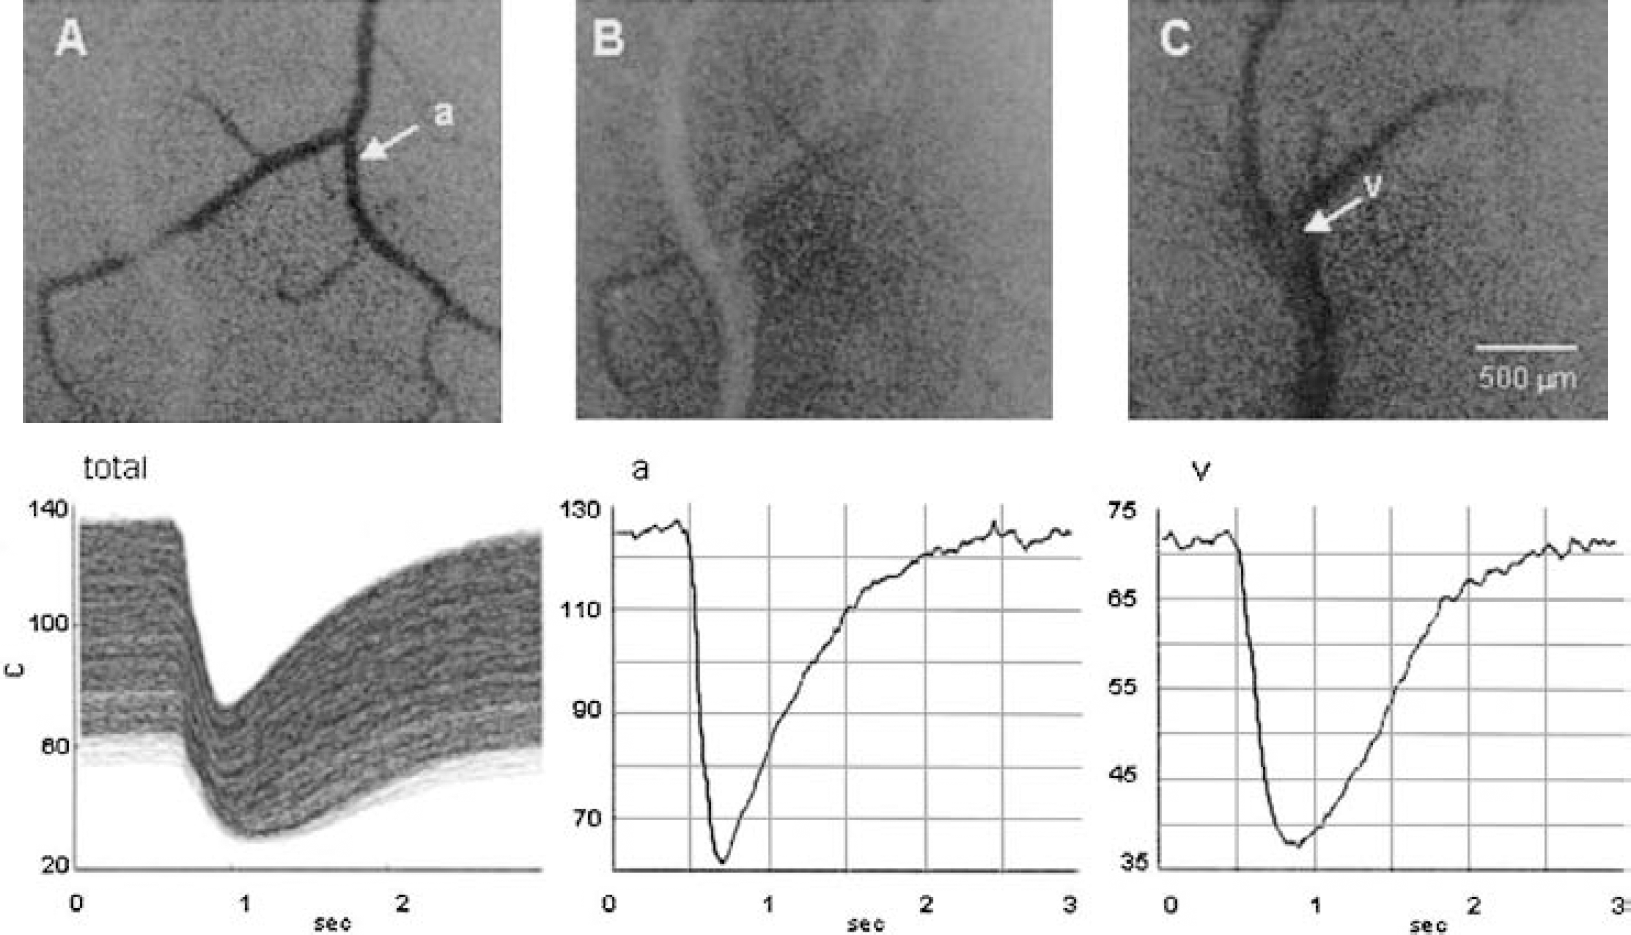
(upper)
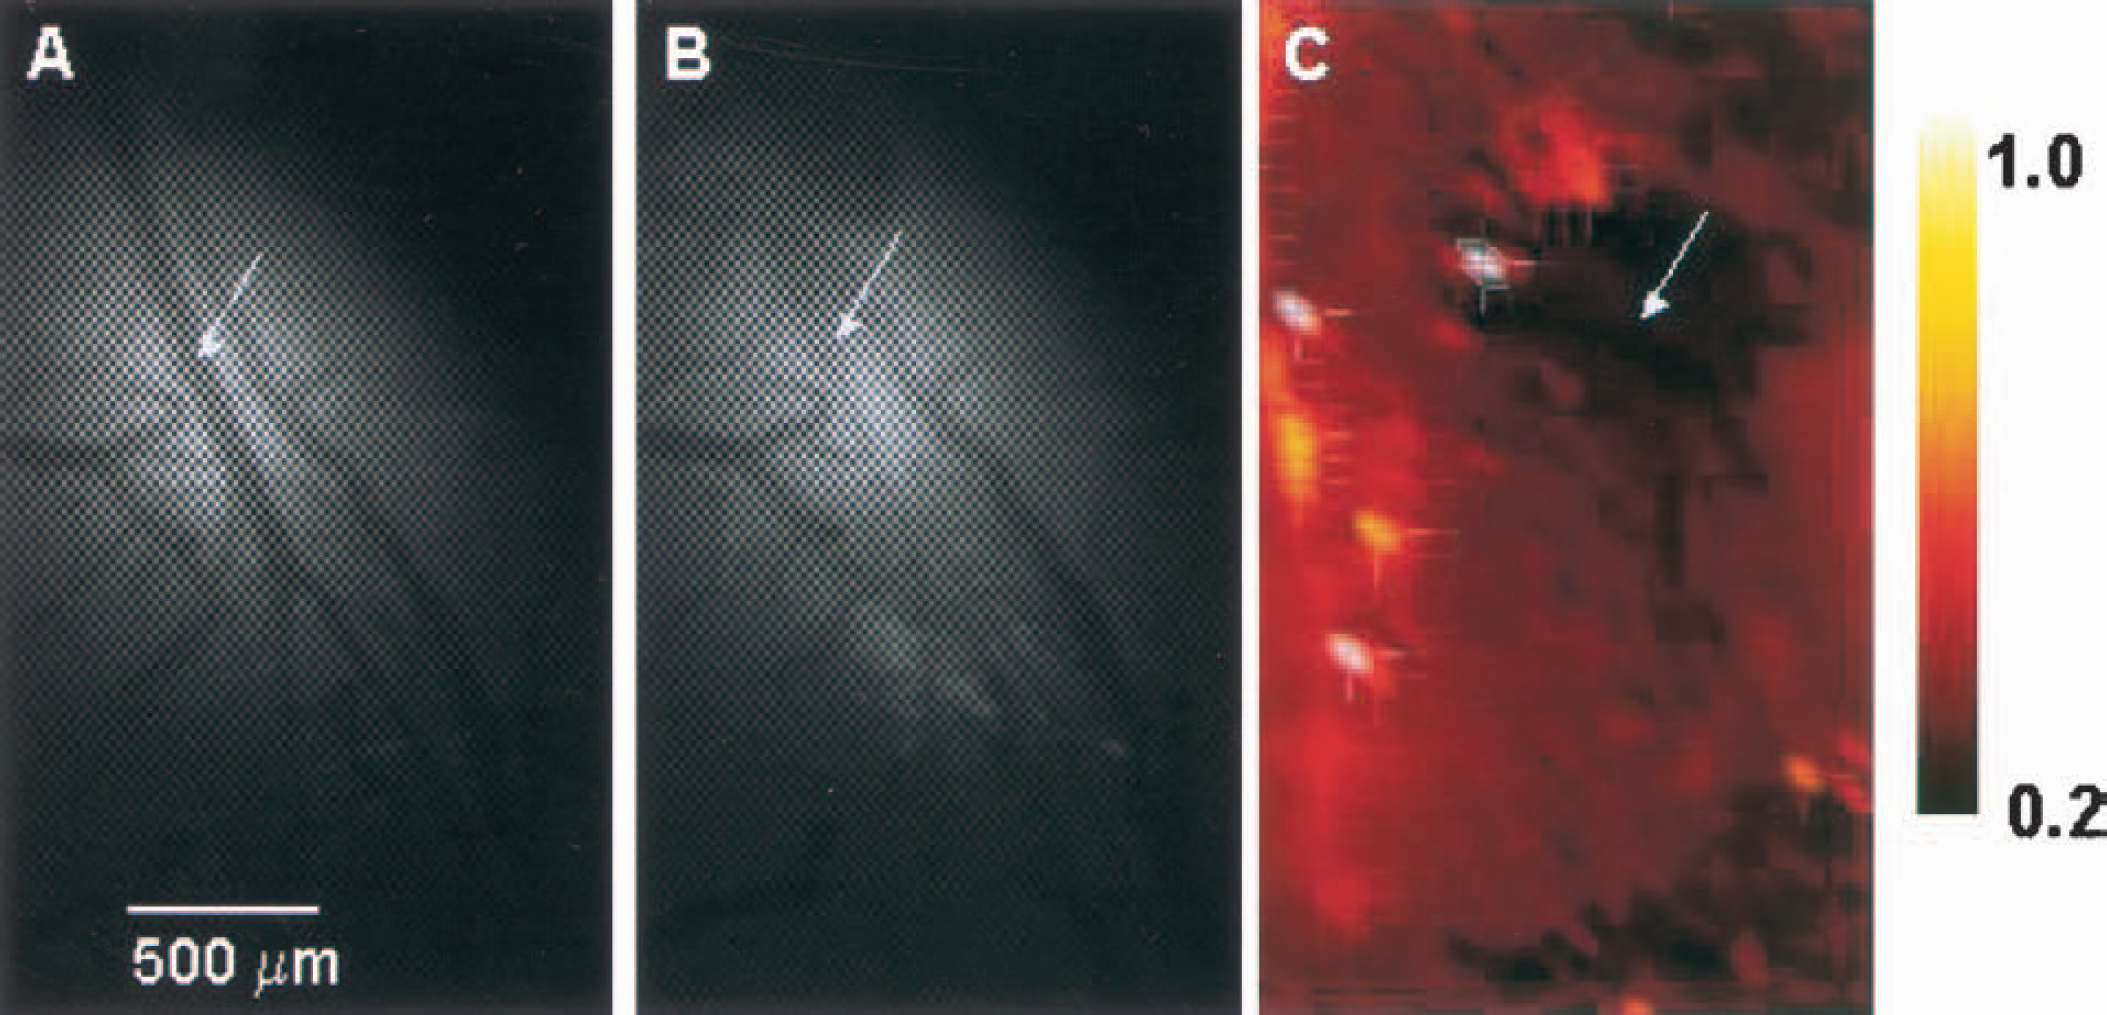
A small pial artery approximately 40 to 60 μm in diameter in the ROI was occluded by means of infrared laser-beam cauterization. The tip of a 250-μm glass fiber connected to a laser-beam generator (Olympus Co. Ltd.) was stereotaxically centered just above the small arterial branch to be coagulated, and a power spike (a single pulse) was delivered. The wavelength of the laser beam was 790 to 820 nm, the power was approximately 0.73 J/s, and the pulse length was less than 1 second. The method was therefore different from the widely used conventional method of photothrombotic occlusion using the photosensitizing dye rose bengal (Markgraf et al., 1993), which took more than 10 minutes to occlude small vessels. The present technique achieves rapid occlusion, and early flow changes can be evaluated from immediately after the occlusion. Capillary density was examined by a frame-by-frame subtraction technique during the tissue-darkening period after CB injection. Original brain surface images (microphotographs by transmitted light) on videotape were often played back to see the development of microvascular derangement (e.g., sludge formation, so-called particulated flow, pallor of the ischemic lesion, and edema). These features appeared to be well correlated to low-flow components in the region of focal ischemia estimated from moment analysis during both the early and the late phases. Spatial resolution of the method was 4 μm x 4 μm for microphotographs and 40 μm x 40 μm for 2-D flow maps. Statistical analysis was done by using the paired Student's t-test.
RESULTS
During experiments, the systemic blood pressure and the arterial blood gas values were within the normal ranges. In 3 control rats, the effect of glass fiber insertion into the cortex was examined. After implantation of a short-cut glass fiber into the brain tissue under halothane anesthesia, the rats awoke within approximately 30 minutes and became alert and attentive. They started to prowl about for food, drank water through a catheter, and resisted pulling of the tail. In another 3 control rats, we confirmed that without arterial occlusion the microcirculatory parameters remained unchanged for more than 3 hours.
As shown in Figs. 2A and B, success of the occlusion was confirmed visually by immediate closure of the peripheral part of the artery. Figure 2C shows the resultant microflow changes displayed on a 2-D flow map. Figure 3 shows a typical example of three-dimensional representation of 2-D flow maps. Figure 3A represents the control state, with a calibration scale in color representing graded microflow. If the relative microflow increases the color will be brighter (towards yellow), whereas a decrease appears darker (towards black). A bright yellow line represents an artery, and a red-to-black line (slow flow) represents a vein. Arterial occlusion produced an immediate decrease in the flow in downstream vessels (Fig. 2C and Fig. 3B). Flow in some areas decreased greatly, presumably forming an ischemic core. However, the subsequent time courses after the initial decrease were quite variable from rat to rat. Height of the curve decreased immediately upon arterial occlusion, which implies a decrease of blood (dye) amount distributed to the ischemic area. In some cases, height disappeared momentarily, followed by reappearance within 10 minutes after occlusion, confirming our previous observation in cats.
(A) Microphotograph of control. The arrow indicates the site of coagulation.
Three-dimensional representation of the two-dimensional flow maps and the histograms.
A summary of the histograms of the blood flow in the 6 cases is shown in Fig. 4. Upper graphs represent the control state of each experiment. Middle and lower graphs represent the states at the early and the late phases, respectively. In the rat 6 study, the histogram of the state in the late phase was not recorded because of technical failure. By comparing these postocclusion histograms with the control, we can easily note a shift to the left, meaning a decrease of the average flow value in the ROI, whereas the distribution becomes wider, meaning that the heterogeneity is increased. Most histograms just after occlusion show a flow decrease tailing to zero, whereas such smearing or low-flow components of the histogram had disappeared at 2 hours. Table 1 shows the results of moment analysis of microflows to obtain microcirculatory parameters from the histograms in the 6 cases. The value of height of the dilution curves decreased in all cases, indicating that redistribution of blood to the ischemic region decreased. The reciprocal MTT calculated from the first moment, or the mean flow values in the ROI, decreased in all cases on occlusion. In the 5 cases, the average flow values in the control (mean ± SD), in the early phase of ischemia, and in the late phase were 0.60 ± 0.21, 0.38 ± 0.14, and 0.39 ± 0.14, respectively, in arbitrary units. The flow decrease was statistically significant (P < 0.01). The values of the heterogeneity index γ (mean ± SD) were 0.43 ± 0.20 (control), 0.61 ± 0.19 (early phase), and 0.61 ± 0.20 (late phase). The values of 7 increased in 5 of 6 cases at the early phase. In addition, the coefficient of skewness decreased in all 6 cases (P < 0.01). The shape changes of the histograms (skewing to the left) indicate the appearance of a variety of low-flow values below the mean, smearing to zero. The mean values of microflow in the ischemic core were calculated to be 44%, 22%, 28%, 21%, and 12% of the control, being below the reported ischemic threshold of 30% except for one case. The kurtosis increased in 3 cases and decreased in 3 cases, suggesting opening of specific channels (e.g., thoroughfare or preferential channels) in the former, and equalization of channel numbers with various transit times in the latter.
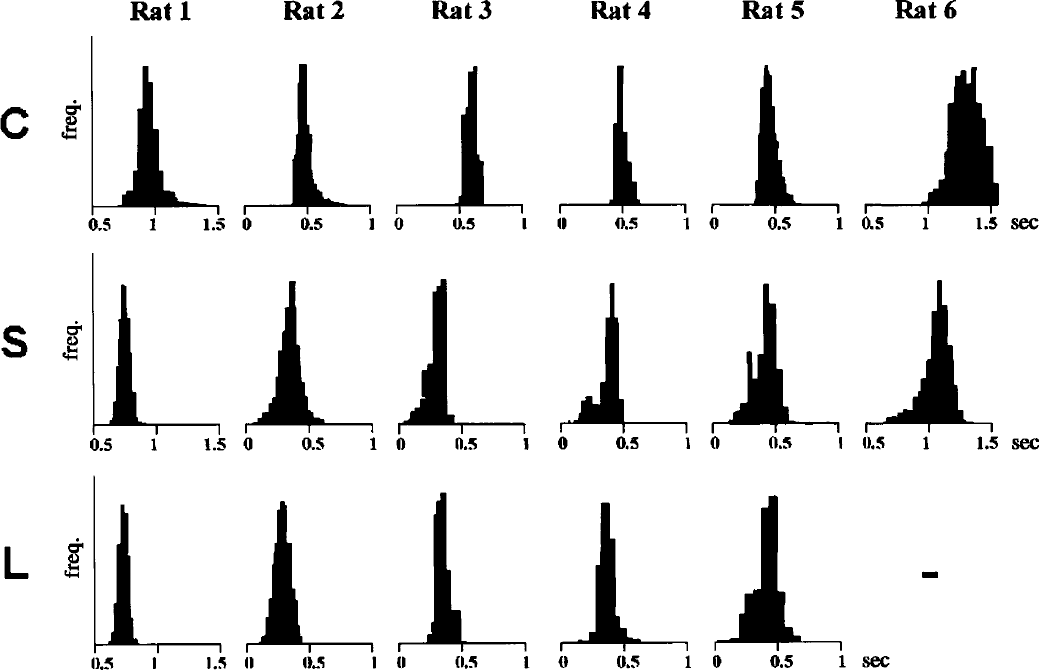
The histograms of the 6 cases. The ordinate is frequency. Upper graphs represent the control state (C) of each experiment. Middle and lower graphs represent the “early” (S; 10 minutes after occlusion) and “late” (L; 2 hours after occlusion) phases, respectively. In the rat 6 study, the histogram of the late phase was not recorded because of technical failure. On comparing these histograms after occlusion with the control, there is a clear shift to the left, meaning a decrease of the mean flow value in the region of interest. In addition, the distribution became wider and skewed to the left after occlusion.
Results of moment analysis of microflows
In the rat no. 6 study, the data at 2 hours after occlusion could not be calculated.
H, the height of the dye-dilution curve (Hc, height for control); mean, the mean flow value in the region of interest; SD, the standard deviation or dispersion of individual flow values in the two-dimensional flow map; −γ, the dimensionless dispersion (√ SD/mean), which is an index of heterogeneity; CS, the coefficient of skewness of the distribution (|, control; /, skew to the left; \, skew to the right); κ, the kurtosis of the distribution (<3, platykurtic; >3, leptokurtic); C, control state; S, the “early” (10 minutes after arterial occlusion) phase of ischemia; L, the “late” (2 hours after arterial occlusion) phase of ischemia.
P < 0.05, † P < 0.01, compared with control; statistical analysis was made on 5 rats.
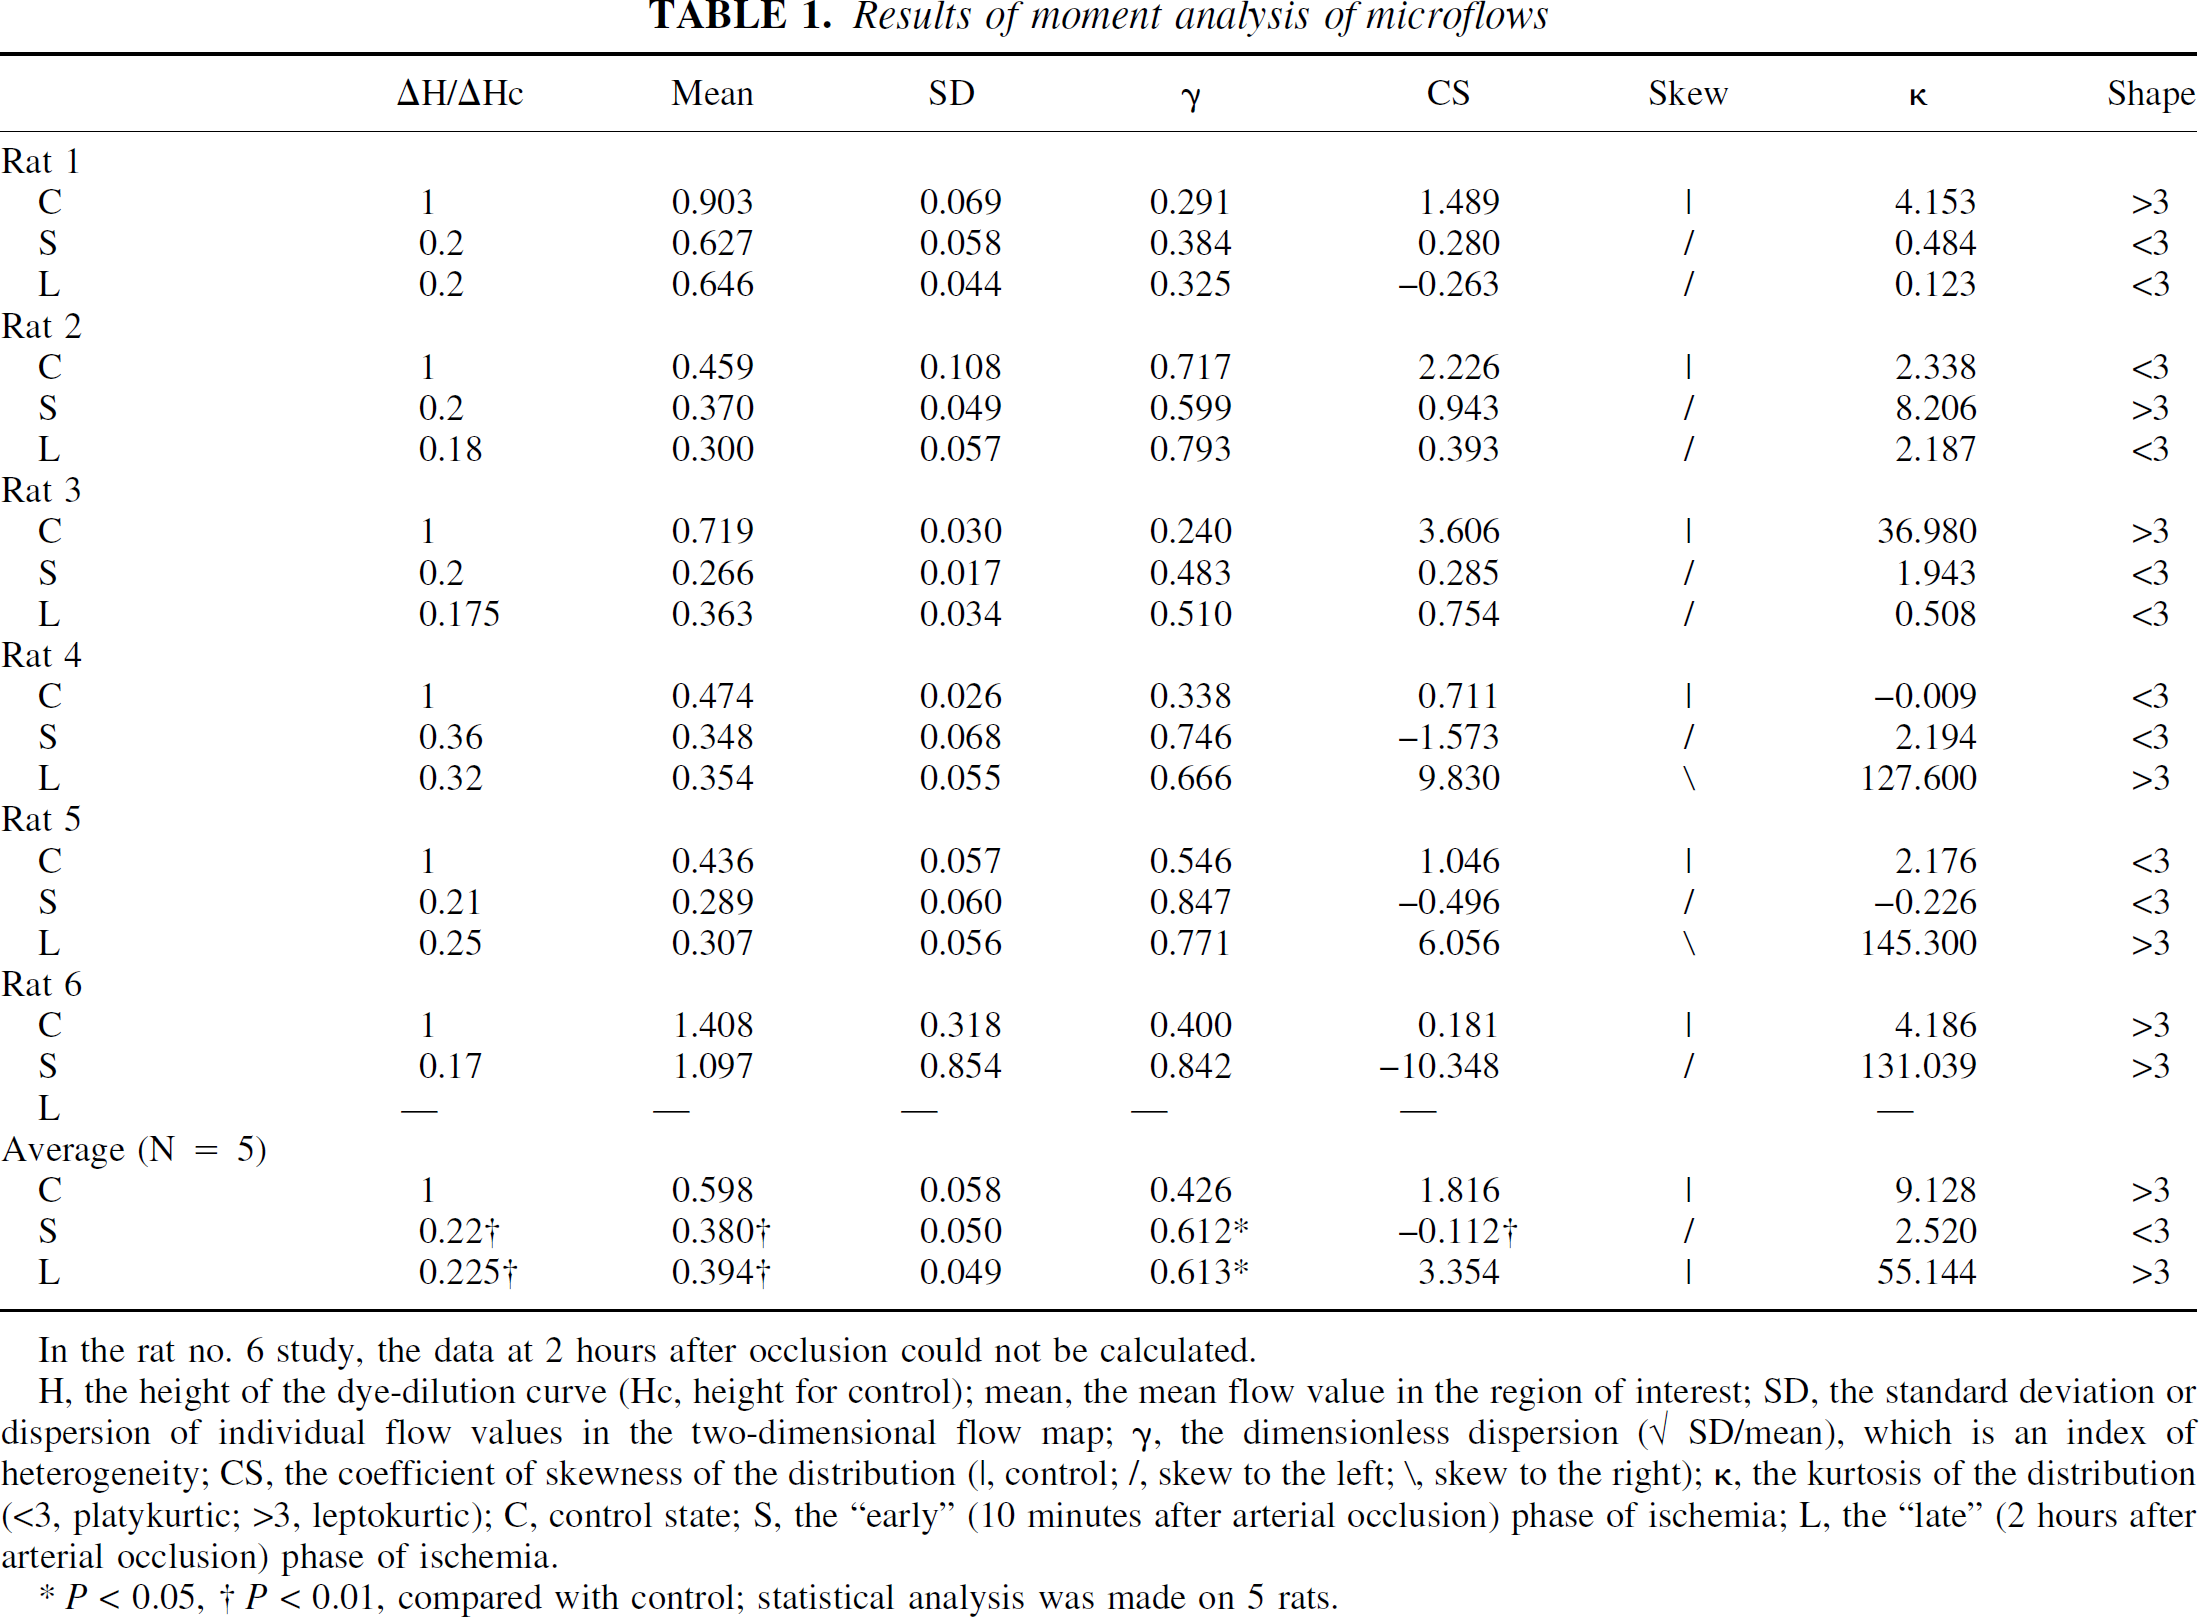
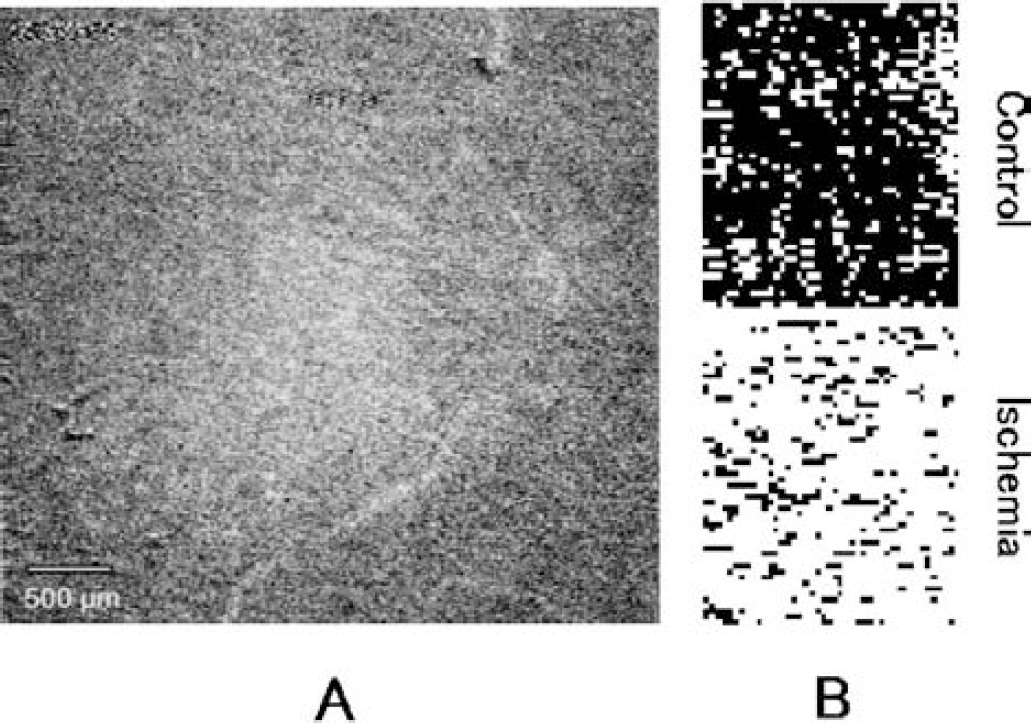
Microvascular features of the ischemic cortex on videotape exhibited a variety of appearances, depending on individual cases and changing with time. In more than half of the cases, a sludge of dark-colored aggregates was seen mostly at the branching sites of arterioles or feeding arterioles at more than 30 minutes after the start of ischemia. The sludge either remained like a plug at the same spot, or moved along microvessels like a “flying thrombus.” This material could be platelet aggregates bearing adsorbed CB particles. So-called particulated flow of red blood cell (RBC) aggregates was often seen. To check capillary patency under these conditions, CB passage through capillaries was examined by means of a frame-by-frame subtraction technique. Figure 5A is a subtraction picture of an image at maximum darkening in the late phase from an image just before CB injection. We see scattered CB-filled capillaries and lucent perivascular space along the microvessels. Because the latter cannot be observed in the early phase, it may represent swelling of the perivascular glial sheath. Figure 5B shows the capillary density at maximum darkening in the control, and the ischemia in the late phase. A well-organized distribution of CB-filled capillaries can be seen in the control tissue. On the other hand, the distribution in the late phase became scattered and the capillaries appeared less dense. The intercapillary distance was widened and the light transparency of the tissue was increased.
(A) A subtraction picture in the “late” phase (L; 2 hours after occlusion) at the time of maximum carbon black filling, acquired from continuous video monitoring frames (30 Hz). Note perivascular lucency.
DISCUSSION
The cardinal finding of the present experiment is that low-flow components observed in the early phase of ischemia disappeared in the late phase, 2 hours after occlusion of an upstream artery. This could have been detected only by the moment analysis of data obtained by our high-spatial-resolution method. If laser flowmetry had been used, it would have been impossible to observe such a heterogeneous microflow decrease in a small area of 2 × 2 mm2, because the flow would have been smeared, yielding only an average flow value lower than the control. Low average flow values alone do not necessarily represent microvascular derangement. However, if we have information on the height of the curve, or the amount of blood volume redistributed to the pertinent ischemic area, we can better assess the microvascular conditions. In the present experiment, we observed that both flow and height decreased at the early phase, and then flow tended to recover slightly, with or without further decrease in height. We reported previously a paradoxical state of decrease in blood flow but increase in blood volume as “low perfusion hyperemia” (Tomita et al., 1980), after middle cerebral artery occlusion in cats. This state may be interpreted as a slight recovery of flow and a marked increase in blood volume or pooling of blood in the venous compartment. These discrepant observations need to be studied further in connection with reversibility of the tissue state. Disappearance of low-flow components in the late phase would be due to stasis, where capillaries cease to be patent. With the exclusion of such low-flow components from measurement, the average flow reflects only the remaining flow through patent capillaries, despite the pallor of the focus or edematous appearance of the brain surface. Such flow values cannot be directly compared with those of the control, because flow units per tissue volume are dissociated. The widened intercapillary distance in ischemic tissue may impede instantaneous equilibration of gases at the capillary level, jeopardizing ischemic flow values obtained with diffusible tracers. The heterogeneous nature of the flow decrease brings into question the meaning of the threshold value for ischemia (Astrup et al., 1981), because the value could vary depending on the size of the target area selected for calculation.
Concerning the mechanisms leading from sluggish flow to stasis, the no-reflow phenomenon (Fischer, 1973) would be relevant. Fischer suggested two causative mechanisms. One was bleb formation from endothelial cells, impeding capillary flow; the other was RBC aggregation. Olsson and Hossmann (1971) reported that elimination of RBC by replacing blood with saline prolonged the ischemic tolerance of the cerebral tissue. However, this issue is still controversial, because we reported that RBC aggregation was not a primary factor for microvascular stasis, but rather was secondary to shear decrease (Tomita et al., 1991), though Mchedlishvili (2000) considered that RBC aggregation was the main factor in microvascular derangement. The microvascular stasis would involve hemorheologic events, complex interactions between blood components and endothelial cells, upregulation of adhesive molecules on endothelial cells, “sick” neurons, glial swelling, and so forth. All these factors would more or less contribute to a vicious circle leading to the closure of capillaries or to a no-reflow state.
However, we believe that stasis is still reversible if the perfusion pressure increases, whereas the no-reflow state is irreversible. Capillary stasis is the subject of continuing investigation, and we suggest that the technique used here will be a powerful tool for the detection of sluggish flow.