
Abstract
Magnetic resonance angiography (MRA) was performed in a thromboembolic stroke model of the rat to characterize intracranial vessel occlusion patterns and to test its predictive power for tissue recovery after recombinant tissue plasminogen activator (rt-PA) treatment. After rt-PA-treated selective middle cerebral artery (MCA) occlusion, full recanalization was observed in two of three animals, whereas additional occlusion of the circle of Willis (CW) resulted in full vascular flow restitution in only one of six rats. Tissue reperfusion markedly lagged the onset of treatment, and the delay correlated with the pattern of vessel occlusion (20 to 23 minutes for selective MCA occlusion vs. 71 to 79 minutes for combined MCA/CW occlusion). In lateral cortex and striatum the apparent diffusion coefficient decreased to 78 ± 15% of control after embolization, recovered to 80% to 85% after rt-PA treatment of selective MCA occlusion, but further declined to 66% to 69% after combined MCA/CW occlusion. Correspondingly, T2 relaxation time increased to 107% to 118% of control after selective MCA occlusion and to 112% to 124% after combined MCA/CW occlusion in these regions. The present investigation shows that MRA provides valuable information on the severity of thromboembolic stroke and has the power to predict, before the initiation of treatment, the functional tissue outcome after rt-PA-induced thrombolysis.
Keywords
Following the encouraging results of clinical recombinant tissue plasminogen activator (rt-PA) treatment trials, thrombolysis is increasingly used to treat acute ischemic stroke. However, because of the increased risk of intracerebral bleedings compared with untreated stroke, careful pretreatment screening is mandatory to exclude patients who cannot be expected to benefit from this therapy. At present, this is mainly done on an empirical time-window basis. By comparing the outcome after different treatment delays, evidence has been provided that the benefit of therapeutic vessel recanalization exceeds the risk of bleedings only when therapy is initiated within 3 hours after the onset of stroke (Marler et al., 1995). However, exceptions to this rule are not uncommon, probably because of uncertainties about the relation between thrombolytic recanalization of the occluded vessel and tissue reperfusion. Thus, both failure of reperfusion despite recanalization and improved perfusion despite persisting occlusion have been reported (Schellinger et al., 2000).
Permanent or transient focal ischemia caused by photothrombosis (Lee et al., 1996; Schroeter et al., 2001), thread occlusion (Mintorovitch et al., 1991; Moseley et al., 1990; Olah et al., 2000, 2001), and thromboembolism (Brinker et al., 1999; Busch et al., 1998; Franke et al., 2000; Overgaard et al., 1994) have been extensively studied by taking advantage of established magnetic resonance (MR) methods like perfusion-weighted imaging (PWI), diffusion-weighted imaging (DWI), and T2-weighted imaging (Hoehn et al., 2001). In Sprague-Dawley rats with thromboembolic stroke, multiparametric MR imaging revealed a statistical correlation between pretreatment ADC (apparent diffusion coefficient) and the probability of tissue recovery, but a reliable prediction of individual outcome was not possible (Pillekamp et al., 2001).
The recent availability of highly resolved, contrast-agent-free MR angiography (MRA) with sufficient sensitivity for application to rodents provides opportunity to obtain this information in combination with other MR imaging methods. Contrast-enhanced MR imaging, which is widely used in clinical application, provides excellent resolution even of small vascular branches (Leclerc and Pruvo, 2000), but this method cannot be interleaved with the MR measurements because the contrast agent heavily influences the magnetic properties of the tissue. This problem does not exist for contrast-agent-free angiographic methods like the presently used time-of-flight (TOF) technique, which detects the motion of water protons of inflowing blood by taking advantage of the intrinsic contrast with the saturated stationary tissue signal. With the advances in regional resolution, this technique succeeded to visualize the vascular anatomy in small rodents, both under physiologic (Beckmann, 2000; Beckmann et al., 1999; Mellin et al., 1994; Reese et al., 1999) and recently also under pathophysiologic conditions (Besselmann et al., 2001).
In the present investigation, we combined TOF-MRA with other multiparametric MR measurements in a remotely controlled thromboembolic stroke model of the rat, which permits initiation of focal cerebral ischemia within the magnet (Busch et al., 1997). The MR measurements were performed repeatedly before ischemia, after clot embolism, and during thrombolytic treatment with rt-PA. The aim of the study was to reveal the exact location and time course of vessel occlusion and recanalization using MRA, and to evaluate the functional consequences of vascular occlusion by the combination with other MR methods (PWI, DWI, T2-weighted imaging). The results of this study provide information regarding the relation between time course of vessel recanalization, tissue reperfusion, and tissue recovery, and may lead to new concepts for future treatment strategies.
MATERIALS AND METHODS
Animal model
All experiments were performed in accordance with the National Institutes of Health animal protection guidelines and approved by the local governmental authorities.
Surgical procedures have been described in detail elsewhere (Busch et al., 1998). In brief, male Wistar rats (n = 12) were anesthetized with 2% isoflurane (2:1 mixture of nitrous oxide to oxygen). Body temperature was measured with a rectal temperature probe and was maintained at 37°C throughout the experiment via a feedback-controlled heating pad. Femoral artery and vein were catheterized for monitoring of blood pressure and heart rate, and for blood gas analysis and intravenous administration of drugs, respectively. Blood samples were recorded every hour to keep blood gases within the physiologic range. After tracheotomy and mechanical ventilation, the animals were immobilized with pancuronium bromide (0.3 mg · kg−1 · h−1), and the isoflurane concentration was reduced to 1.5%.
The right pterygopalatine and occipital arteries were ligated and a catheter was inserted into the right external carotid artery for injection of clot emboli. The animals were then placed in a nonmagnetic stereotaxic frame for accurate positioning in the magnet. Focal cerebral ischemia was induced in the magnet by injection of autologous fibrin-rich blood clots (length, 1.5 mm; diameter, 0.35 mm) via the external carotid artery catheter. To induce a wide spectrum of vascular occlusion patterns, six animals were embolized by injection of six clots and another six animals by 12 clots. During embolization, the right common carotid artery was transiently occluded. One hour later, animals were treated by intraarterial administration of rt-PA at a dose of 10 mg/kg body weight. Ten percent of the drug was given as a bolus, whereas the rest was continuously infused over 1 hour.
Magnetic resonance imaging
All nuclear MR measurements were performed in a 4.7-T magnet (BioSpec 47/30, Bruker Medical, Ettlingen, Germany) equipped with actively shielded gradient coils (100 mT/m; rise time < 250 microseconds). Radio frequency transmission was achieved with a Helmholtz coil system (diameter, 12 cm) and signal was detected with a 22-mm diameter surface receiver coil positioned above the skull of the animal. The radio frequency coils were decoupled (the Helmholtz coil actively and the receiver coil passively). Gradient-echo fast-imaging pilot scans were used for accurate positioning of the head in the magnet.
Perfusion-weighted imaging was performed with arterial spin labeling (labeling time, 3 seconds). During the first acquisition, arterial spins flowing through the neck were inverted adiabatically (tagging) and the inflow of labeled spins was detected with a snapshot FLASH (fast low-angle shot imaging) sequence (Kerskens et al., 1996) as follows: repetition time (TR) = 7.4 milliseconds, echo time (TE) = 3.9 milliseconds, field of view (FOV) = 4 × 4 cm2, slice thickness = 2 mm, matrix = 128 × 64. The second acquisition left the inflowing spins undisturbed by changing the sign of the frequency offset (untagged image). Eight tagged and untagged images each were averaged to improve the signal-to-noise ratio. Perfusion-weighted imaging was recorded in a single slice through the center of the middle cerebral artery (MCA)-supplying territory.
Diffusion-weighted images were recorded with a multislice Stejskal-Tanner spin-echo sequence as follows: TR = 2325 milliseconds, TE = 35.2 milliseconds, FOV = 4 × 4 cm2, slice thickness = 1.21 mm, interslice distance = 1.75 mm, matrix = 128 × 128. Six coronal slices were acquired covering a volume extending 10 mm in rostrocaudal direction and centered around the MCA territory. Two sets of images were acquired with two different diffusion-encoding gradient strengths (b = 30 and 1,500 sec/mm2)in the dorsoventral direction, resulting in 10 minutes of experimental time for one complete data set.
The T2-weighted images were acquired with a multislice multiecho CPMG sequence as follows: TR = 3000 milliseconds, TE = 12.5 milliseconds, 16 echoes, FOV = 4 × 4 cm2, slice thickness = 1.21 mm, interslice distance = 1.75 mm, matrix = 128 × 128. Data were recorded in the same six slices chosen for DWI.
Magnetic resonance angiography was performed without contrast agent using the TOF method. A three-dimensional gradient-echo sequence was applied with TR = 50 milliseconds, TE = 6.3 milliseconds, pulse angle = 45 degrees, FOV = 4.71 × 3.8 × 3.8 cm3, matrix = 256 × 192 × 64, measurement time = 10 minutes.
Measurement protocol
Multiparametric MR imaging data sets consisting of PWI, DWI, T2-weighted imaging, and MRA were acquired before blood clot injection 0.5 hours after embolization and at 0.5, 1.5, 3, 6.5 hours (not all animals) after rt-PA administration.
Image analysis
Perfusion-weighted images were calculated by subtracting the averaged tagged image from the averaged untagged image using homemade software written in IDL (Interactive Data Language; Research Systems Inc., Boulder, CO, U.S.A.). For compensation of signal loss due to the use of the surface receiver coil, this difference image was then divided by the untagged image. Quantitative maps of the ADC were calculated pixelwise based on the monoexponential intravoxel incoherent motion model (Le Bihan et al., 1988), and T2 maps were calculated from the 16 acquired echoes, both using the MEMRIS software package (Eis and Hoehn-Berlage, 1995). Angiograms were reconstructed and zero-filled to a matrix of 2563. For a general survey of perfused intracranial vessels, coronal and sagittal maximum-intensity projection (MIP) maps were calculated. A three-step filter process further processed data. First, a nonlinear diffusion filter was used, which at the same time smoothed the image and increased the contrast between the signal of perfused vessels and the stationary tissue. Second, a three-dimensional multiscale line filter distinguished between lines (vessels) and other structures, thereby finding a maximum filtering result by multiscale integration; this operation also reduced noise and artifacts. The last step consisted in segmentation by simple thresholding. Based on these filtered data sets, MCA and the circle of Willis (CW) were visualized by selecting volumes of interest and by appropriate scaling of horizontal MIP maps of the angiograms (in-house-developed software, written in IDL).
For region-of-interest analysis of the various MR imaging parameters, three regions were defined on the ipsilateral hemisphere comprising the dorsomedial cortex (cortexmed), which is predominantly supplied by the anterior cerebral artery (ACA), the lateral cortex (cortexlat), and the caudate putamen (striatum), the latter two belonging to the MCA territory. All values were expressed in percent of the respective pre-ischemic MR parameter values of the chosen regions of interest.
The results of the region-of-interest analysis were tested for statistical significance using either a nonparametric Mann-Whitney test or a t-test for paired samples.
RESULTS
Clot embolization
By injecting different numbers of fibrin-rich autologous blood clots, we intended to induce a wide spectrum of vascular occlusions. This was, in fact, achieved, as shown by MRA findings ranging from no visible changes to complete MCA and CW occlusion. Two animals developed bleedings at the level of CW immediately after clot embolization, and in another animal, angiographic data were inadequate because of low signal-to-noise ratio. These animals were excluded from further analysis.
Physiologic observations
The physiologic parameters were within normal range during the whole experiment. Mean arterial blood pressure was 112 ± 5 mm Hg before embolization and 100 ± 10 mm Hg at 6 hours after the start of treatment. Changes between these two time points were also absent for body temperature (37.0°C ± 0.3°C and 37.1°C ± 0.2°C), heart rate (369 ± 29 and 388 ± 18 beats/min), and arterial pH (7.3 ± 0.1, both time points).
Perfusion-weighted imaging and apparent diffusion coefficient after embolization
After induction of thromboembolic stroke, the PWI signal decreased to 46% ± 18% of its preischemic value in lateral cortex and striatum, independent of the pattern of vascular occlusion. In the dorsomedial cortex, the signal decreased to 69% ± 37%.
At 1 hour after embolization, the ADC changes also differed depending on the analyzed regions. Although the dorsomedial cortex remained close to normal (97% ± 12% of control), a severe decrease to 78% ± 15% was observed in lateral cortex and striatum. Obviously, the dorsomedial cortex, which is supplied by the ACA, was only marginally affected by thromboembolic stroke, whereas the lateral cortex and the striatum suffered a reduction of ADC to a value that is close to the threshold (77%) reported earlier for breakdown of energy metabolism (Hoehn-Berlage et al., 1995; Olah et al., 2001).
Pattern of vascular occlusion
The signal of TOF-MRA reflects the travel time the blood requires to move after excitation to its actual position within the vasculature. Therefore, it is correlated with intravascular blood flow velocity, and, on condition of a constant vessel lumen, also with the flow rate. Angiographic MIP maps were computed before and during embolization, and after thrombolytic drug (rt-PA) administration. Although the site of vascular occlusion could be clearly detected on coronal MIP maps of whole data sets (Fig. 1A), a more detailed analysis was achieved by constructing horizontal MIP maps in a small volume of interest focused on the CW (Fig. 1B). The appearance of these horizontal MIP maps compares well with the photographic picture of the angioarchitecture at the base of a latex-perfused brain (Fig. 1C). With this display it was possible to classify vessel occlusions at the level of CW by evaluating flow at 30 minutes after thromboembolism.
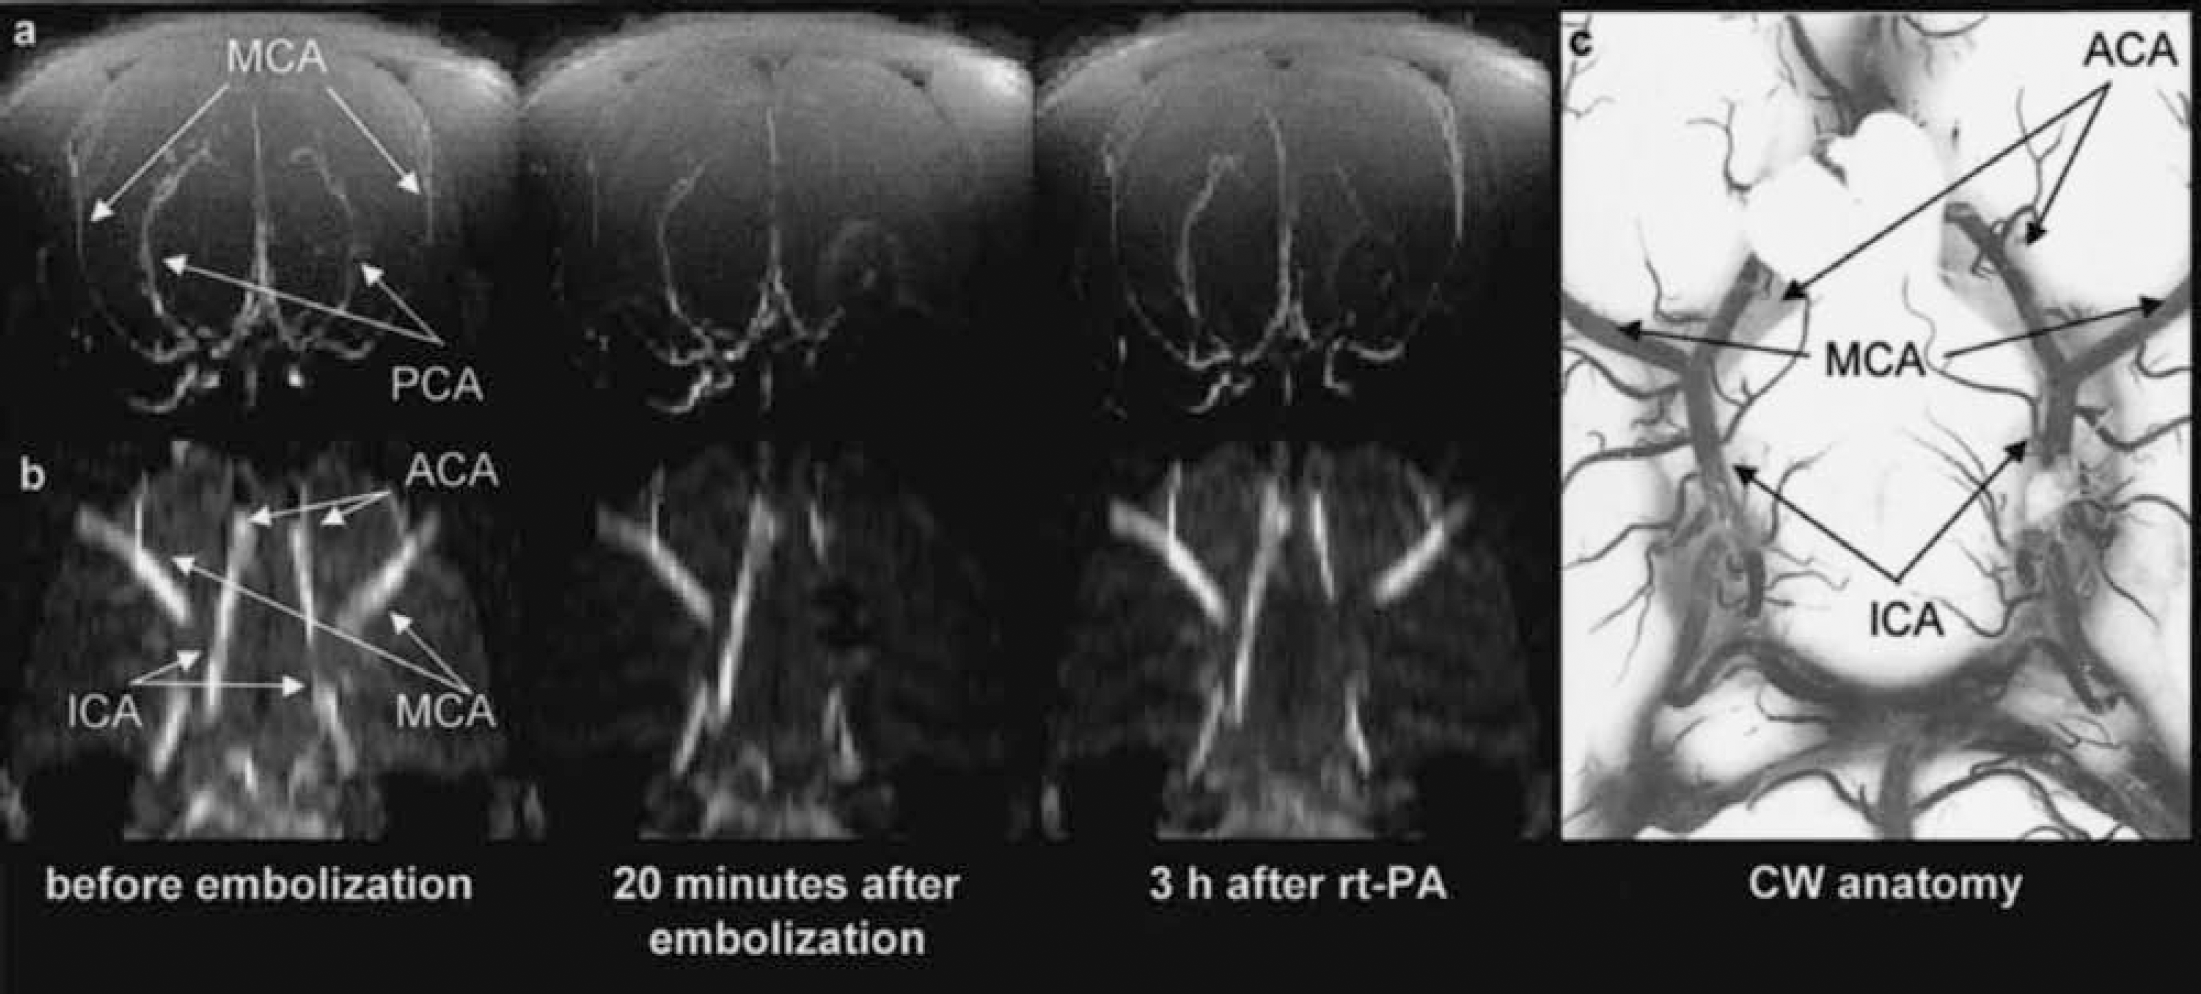
Maximum-intensity-projection maps of time-of-flight magnetic resonance angiograms showing the architecture of perfused intracranial vessels of a Wistar rat.
In two animals, no vascular occlusion was detected at this level. The perfusion deficit recorded by PWI is therefore thought to originate from a more distal MCA occlusion. One animal showed a proximal occlusion of the MCA stem in combination with reduced, but not abolished, flow through the ACA. In most of the investigated animals (n = 6), the MCA and a part of the CW (ACA or ICA) were occluded. The angiographic pattern of clot embolism could thus be differentiated into two classes, one representing selective proximal or distal MCA occlusion (n = 3), and the other one with an additional involvement of the ACA or ICA (combined MCA/CW occlusion; n = 6).
Multiparametric nuclear magnetic resonance imaging
Figures 2 to 4 show the lesion evolution, as reflected in the various MR parameter images, for three animals representing different degrees of tissue injury. The angiographic MIP maps at the level of the CW were combined with coronal PWI, ADC, and T2 images (single slice through the center of the MCA territory) to observe the effect of embolism on hemodynamic changes, diffusion, and T2 relaxation time, respectively.
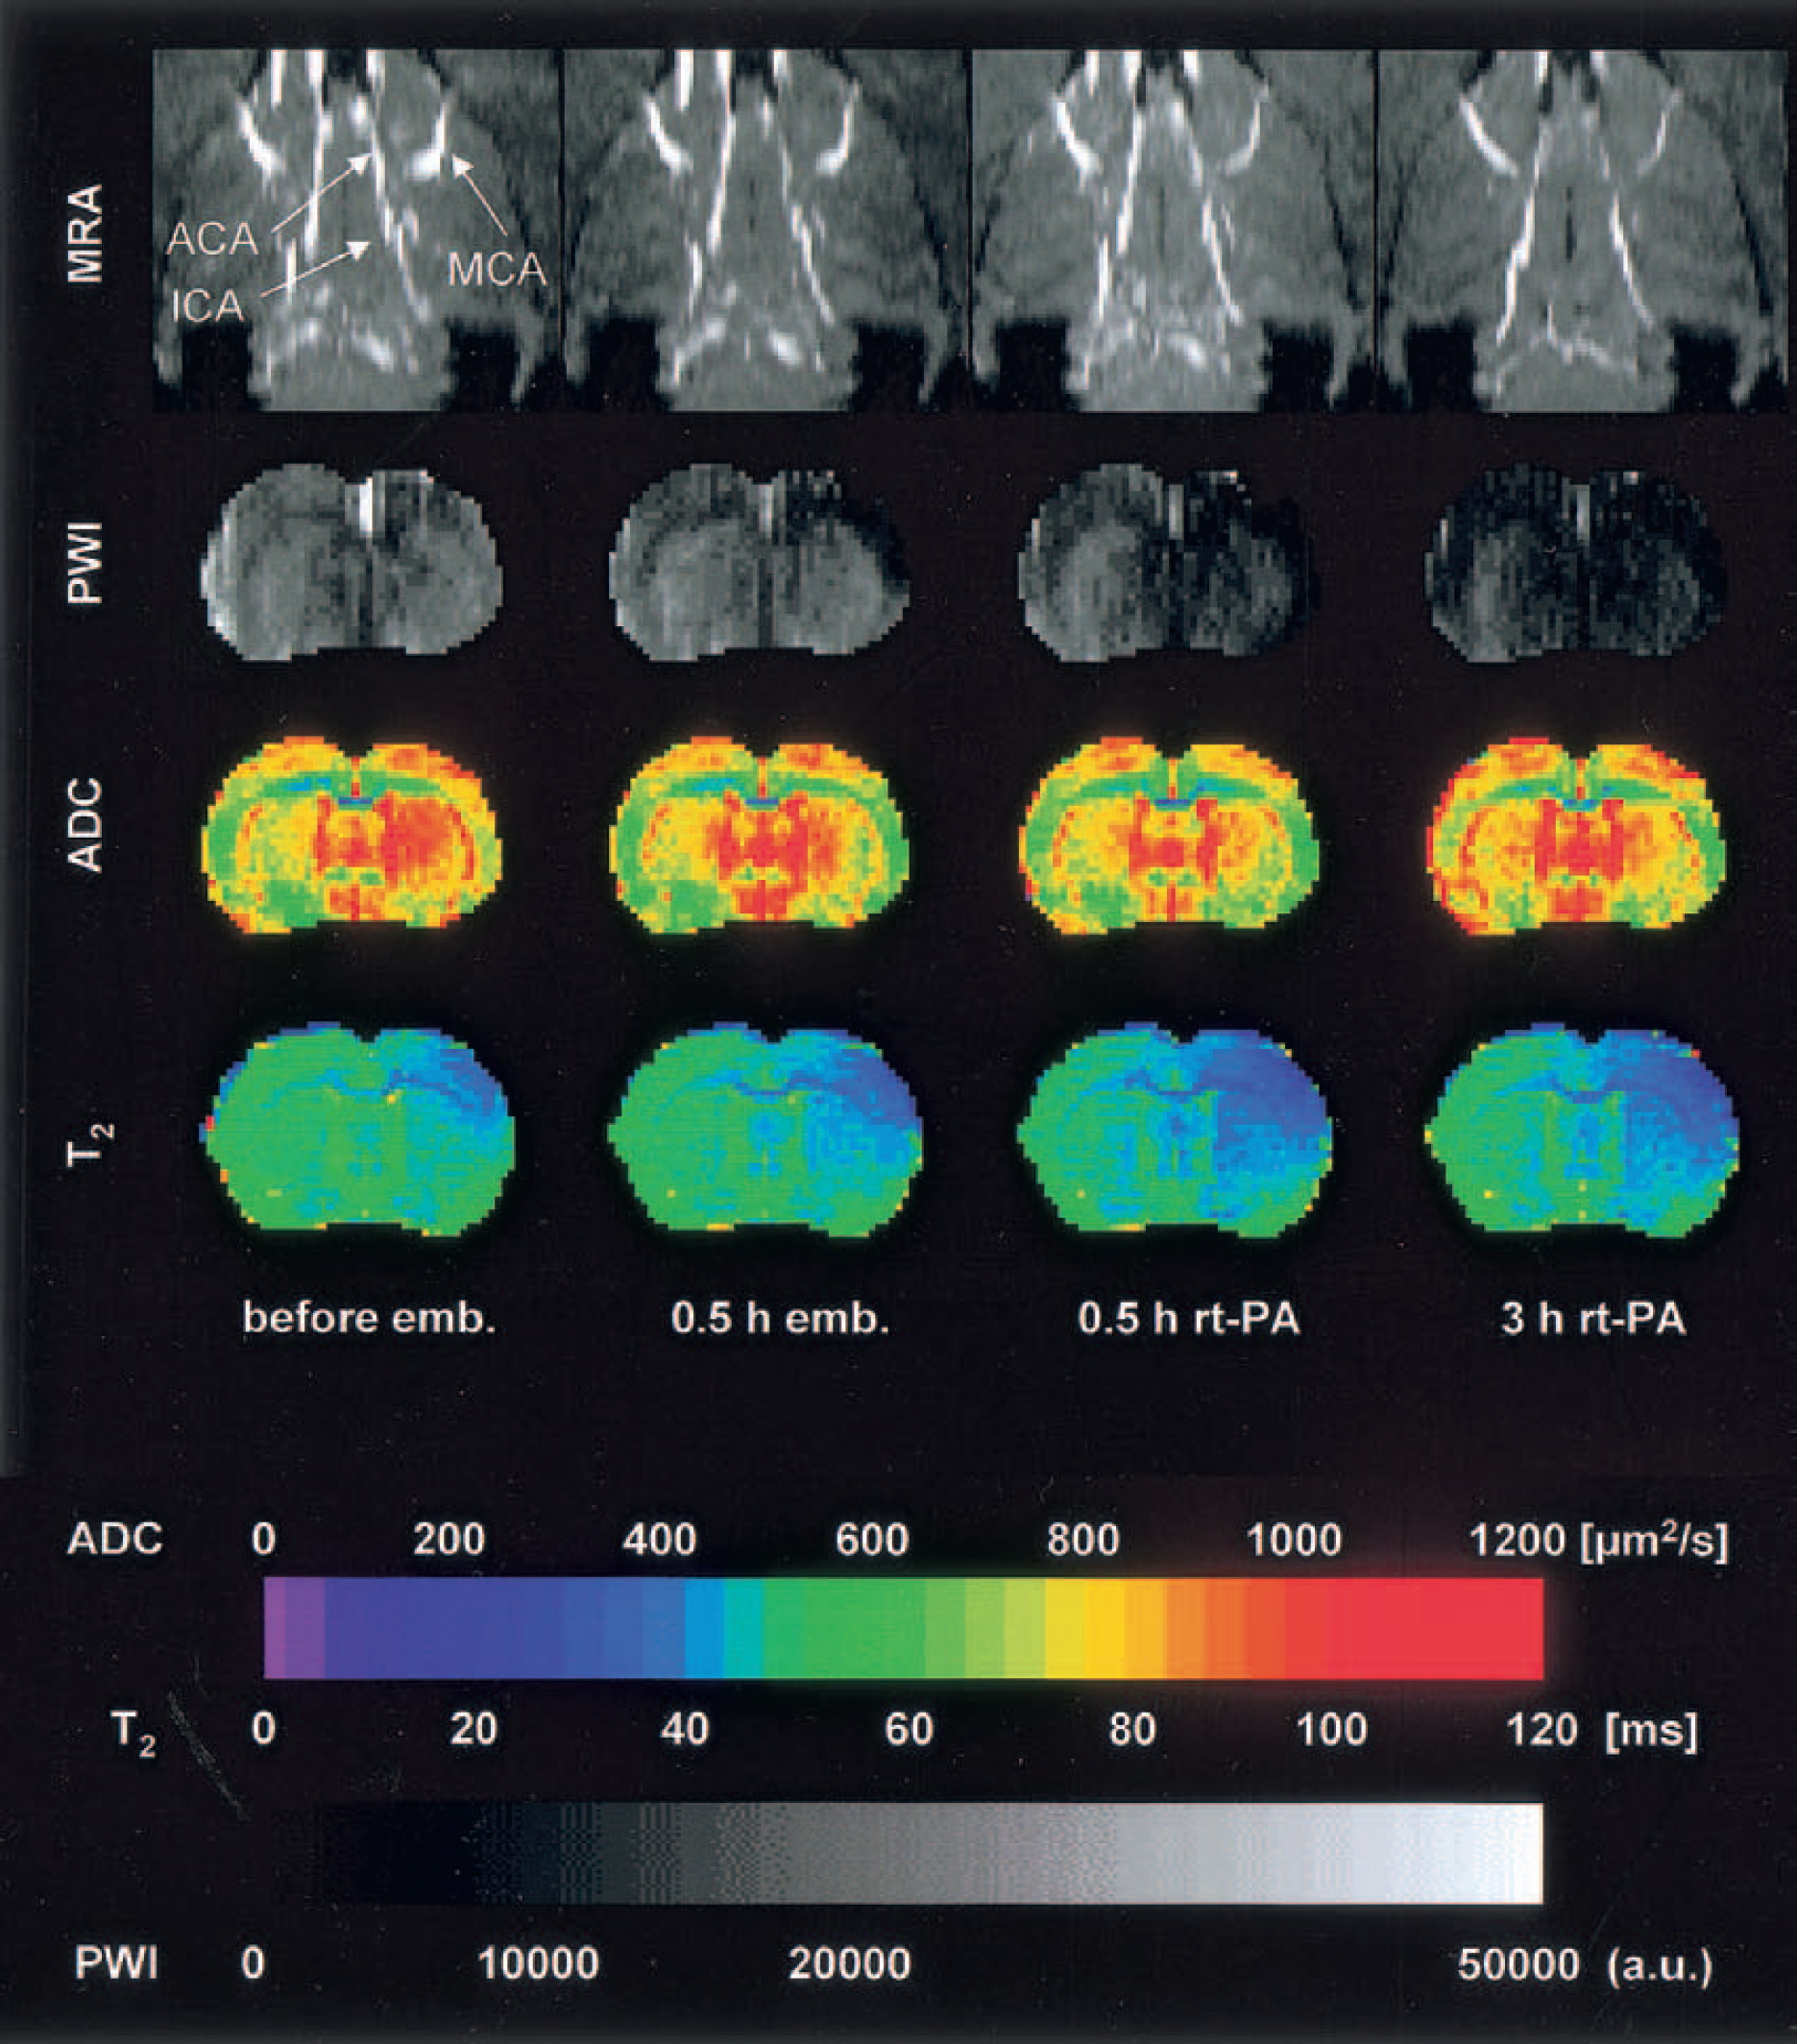
Multiparametric magnetic resonance imaging of rat brain before and after intracarotid clot embolism treated at 1 hour with intraarterial infusion of rt-PA. Magnetic resonance angiography denotes time-of-flight angiography (horizontal maximum-intensity projection maps focusing on circle of Willis); PWI, perfusion-weighted imaging; ADC, mapping of the apparent diffusion coefficient of water; T2, mapping of T2 relaxation time. In this example, embolism reduced tissue perfusion but did not obstruct the large brain vessels or induce ADC changes. The decline of T2 reflects the fractional rise of deoxygenated blood due to increased oxygen extraction.
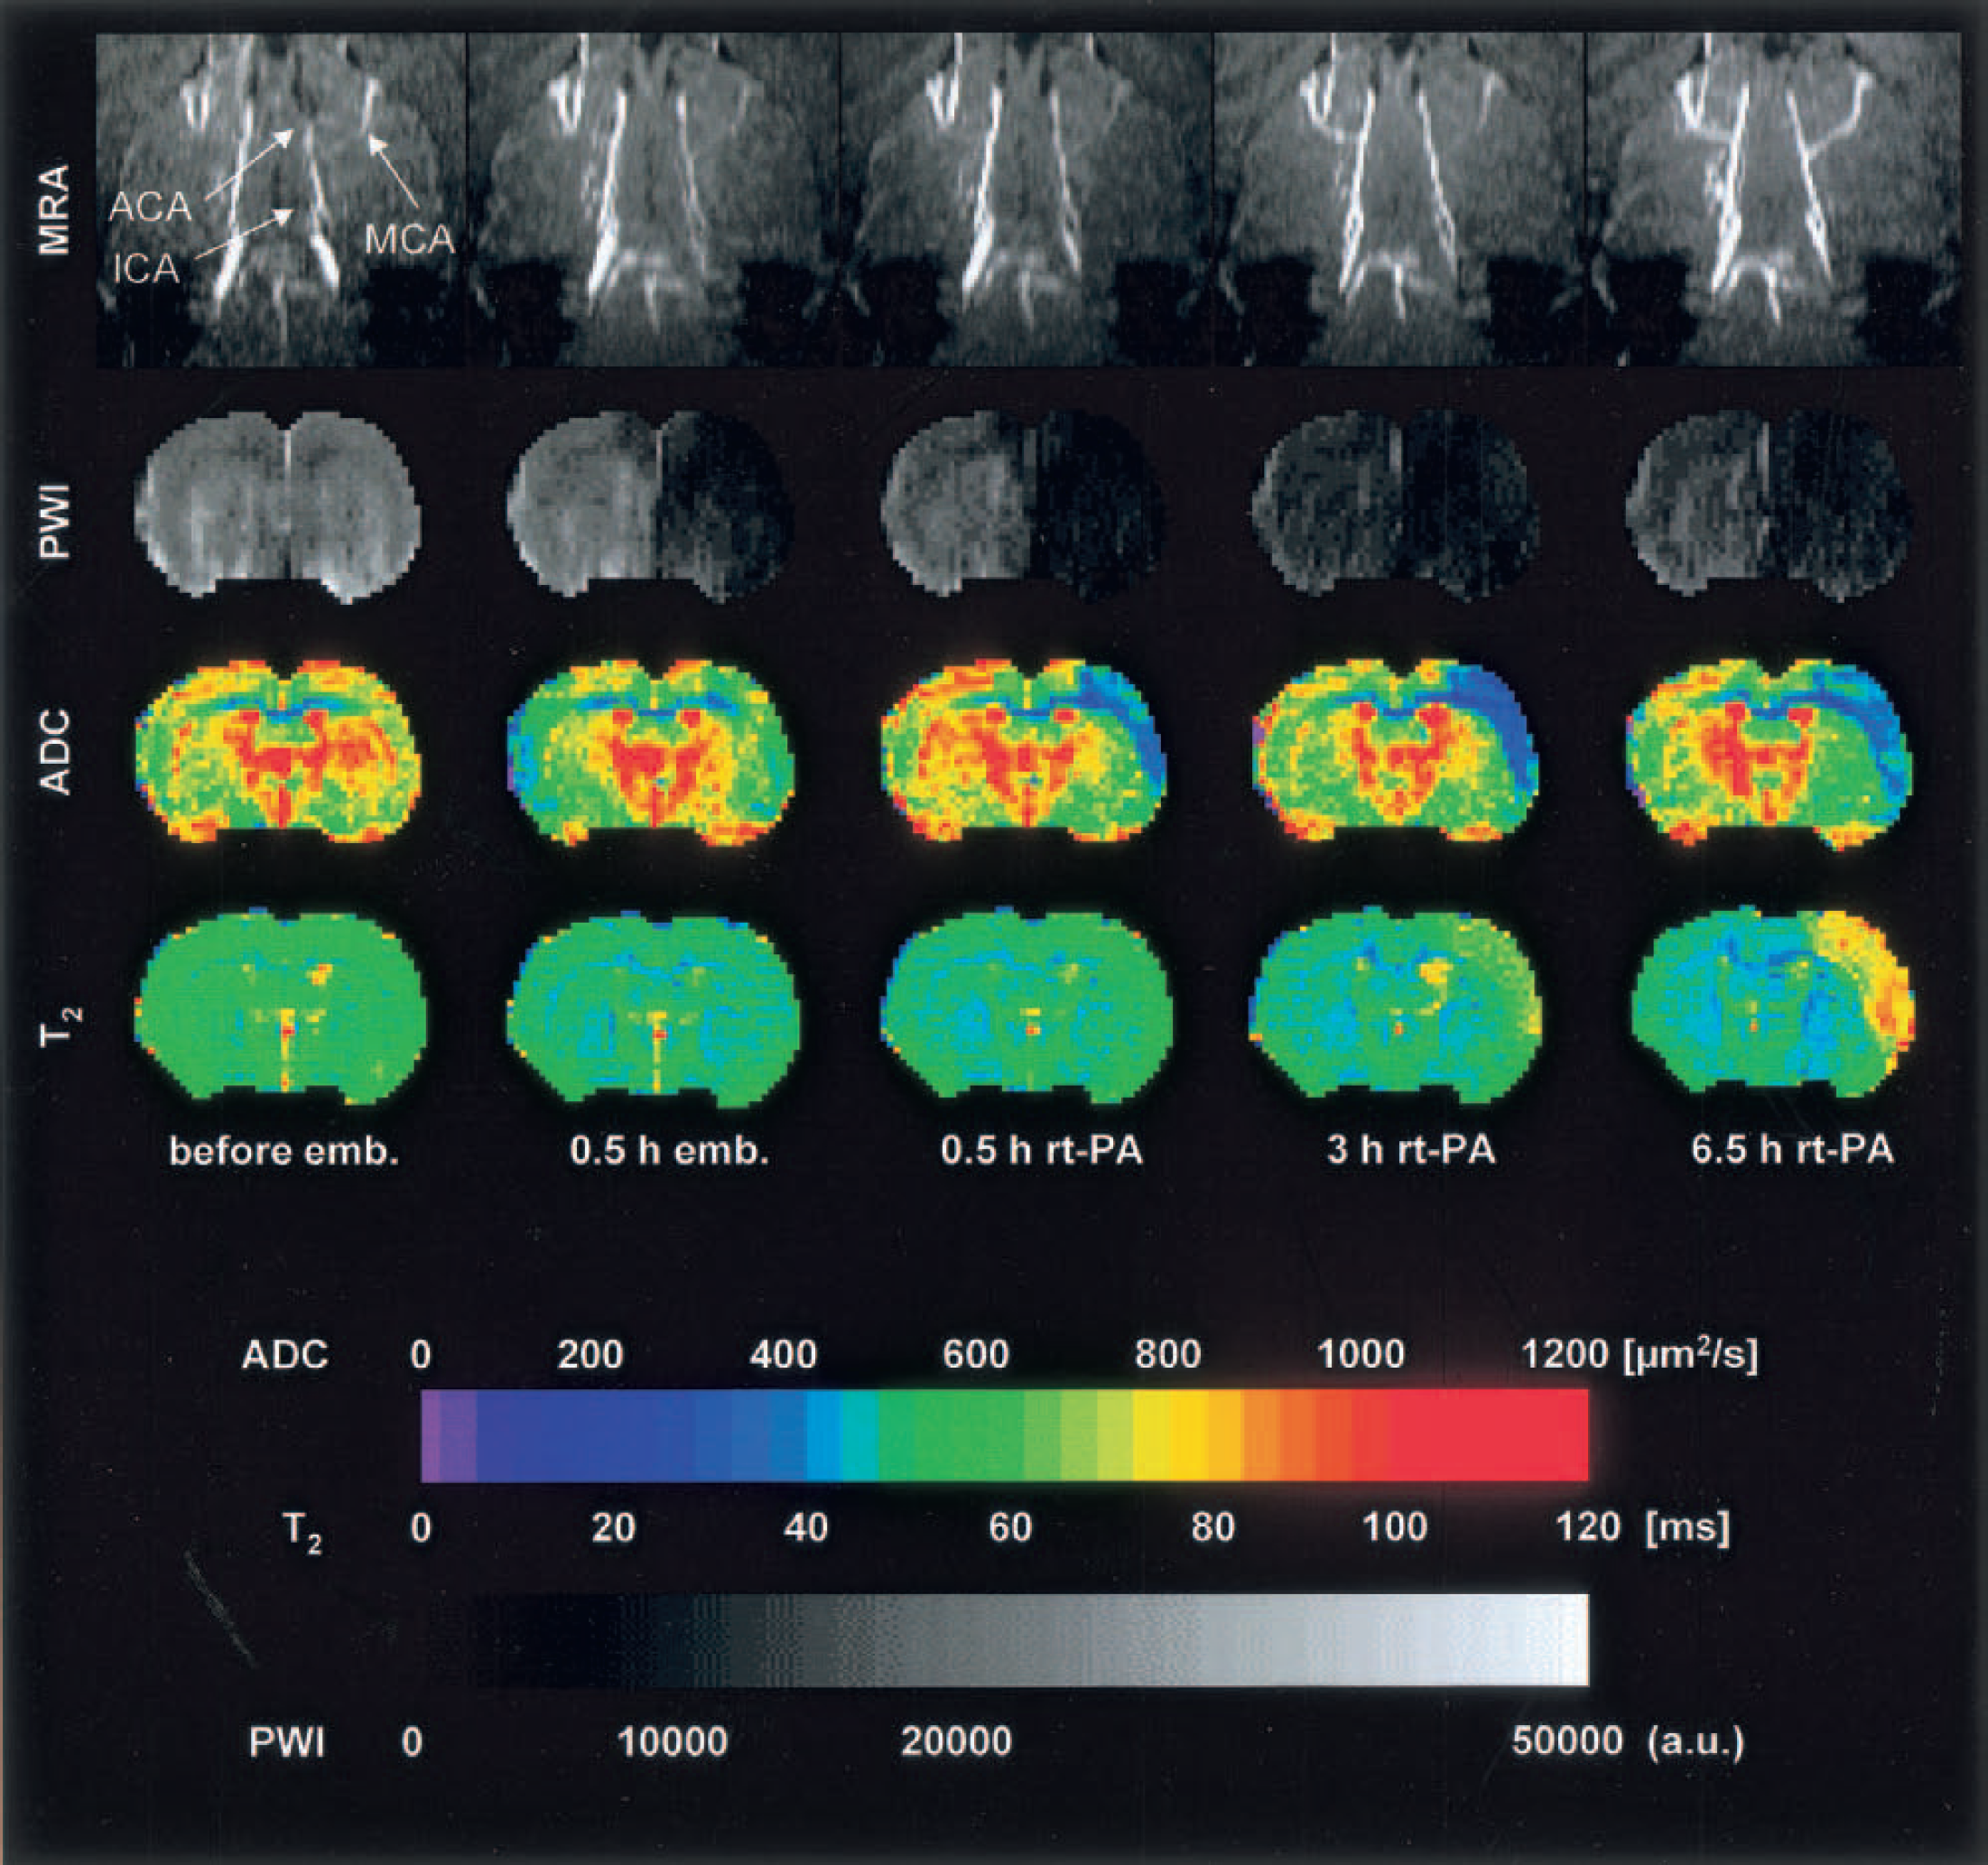
This figure depicts the same experimental setup as that shown in Fig. 2, but showing near complete obstruction of middle cerebral artery (MCA) after clot embolism followed by full recanalization after rt-PA treatment. Note the decrease of apparent diffusion coefficient in the lateral cortex at 0.5 hour and the increase of T2 at 6 hours after rt-PA treatment despite recanalization of MCA.
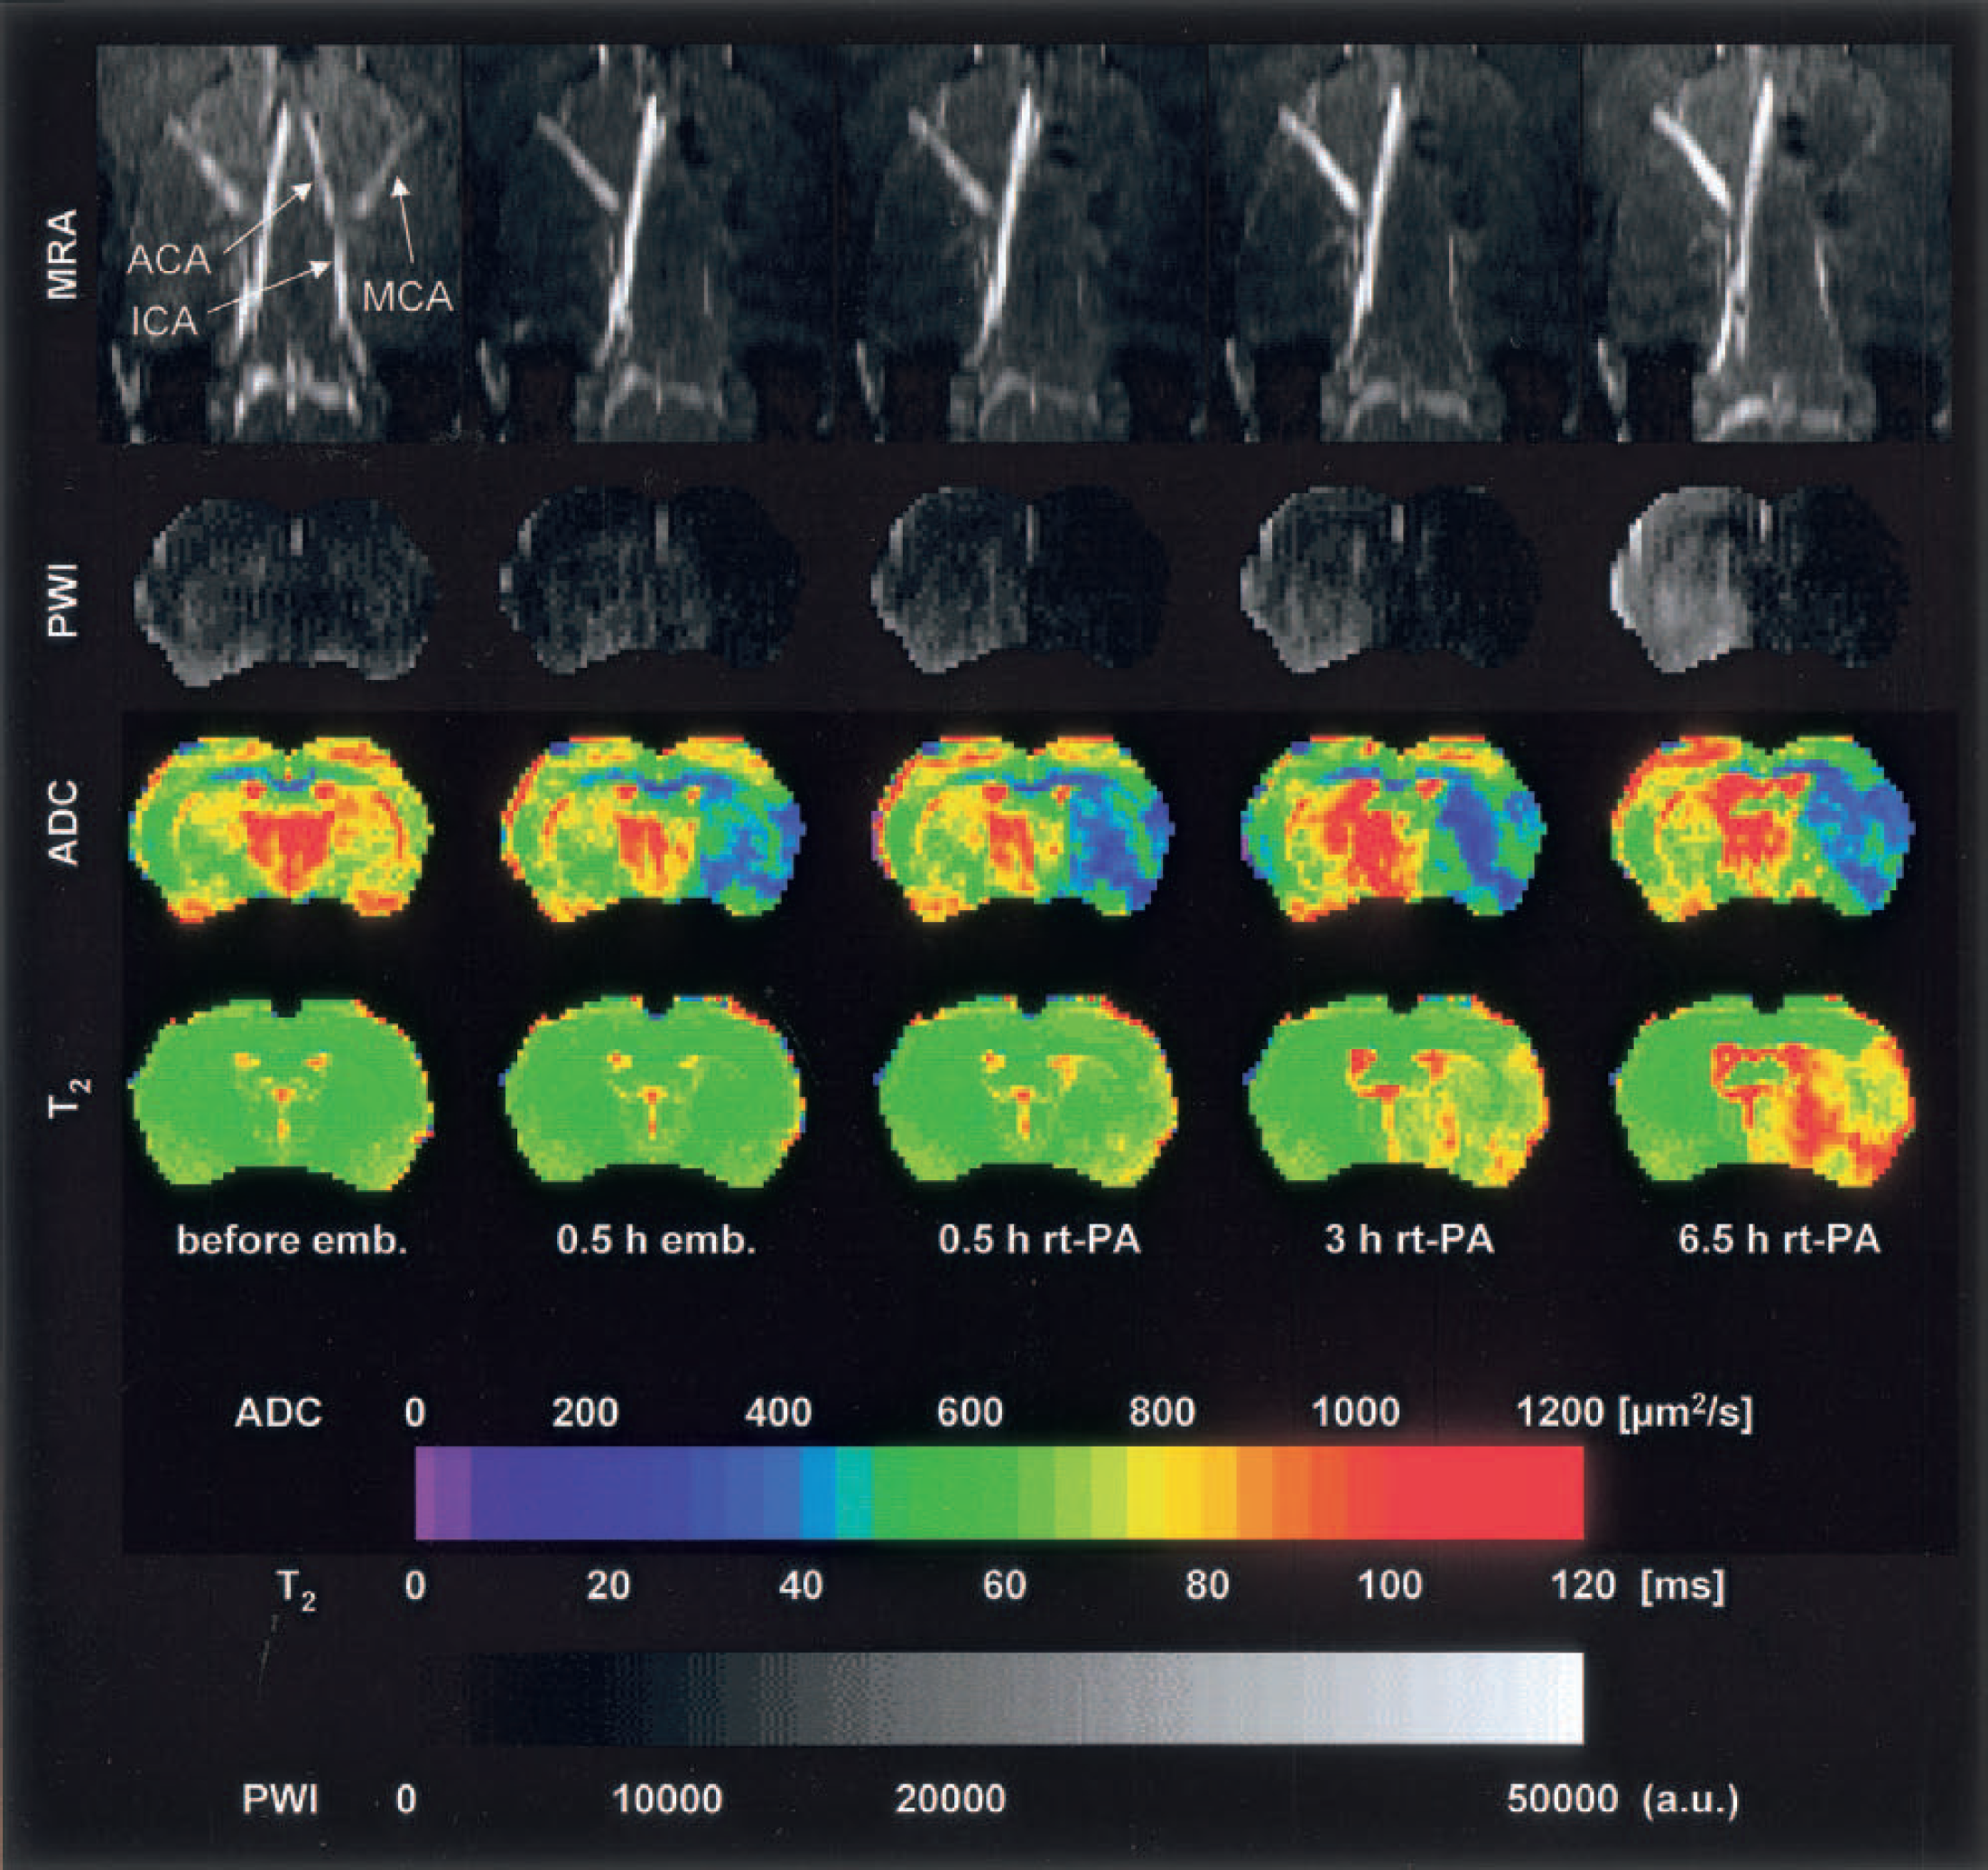
This figure depicts the same experimental setup as those shown in Figs. 2 and 3, showing irreversible occlusion of the middle and the anterior cerebral arteries after clot embolism. In this experiment, flow deficit and decline of apparent diffusion coefficient visible at 0.5 hour after embolism are not reversed by rt-PA treatment. The increase of T2 starting at 3 hours after treatment reflects the formation of vasogenic edema.
Figure 2 represents one animal without any detectable angiographic changes after clot embolization. However, in the PWI, a distinct reduction of perfusion signal intensity was observed immediately after embolization over the whole dorsolateral cortex, but this perfusion deficit was not severe enough to cause ADC changes. After application of rt-PA, the perfusion deficit spread into the ipsilateral striatum, corresponding to a decrease of the right MCA perfusion. A decreased T2 relaxation time was observed in the right dorsolateral cortex. This area expanded and intensified in correspondence to the reduced perfusion, but because ADC did not decrease, the tissue did not suffer ischemic injury. The decrease in T2 relaxation time thus reflects the increased oxygen extraction in the area of reduced perfusion, resulting from the fractional rise of deoxygenated (paramagnetic) blood.
A more severe degree of ischemic injury is shown in Fig. 3. At 30 minutes after embolization, blood flow through the right MCA and through the ipsilateral side of the CW was reduced. Three hours after induction of therapy, the intravascular flow increased again, starting at the CW and followed by a normalization of the MCA perfusion by 6.5 hours (full recanalization was achieved already after 4.5 hours, data not shown). Immediately after embolization, tissue perfusion declined not only in cortex but also in the striatum. At 30 minutes after the onset of thrombolysis, ischemia spread out over the whole right hemisphere but started to recover in some cortical and striatal areas at 3 hours, in accordance with the angiographic flow pattern. A marked ADC decrease was observed at 0.5 hours after application of rt-PA in the cortex, corresponding to the area of maximum perfusion signal reduction. The ADC decrease intensified first in this region (3 hours), then recovered slightly (6.5 hours). The same cortical region showed a delayed increase in T2 relaxation time (3 and 6.5 hours).
The most severe degree of ischemic injury evolved in animals with complete occlusion of both the MCA and the ipsilateral part of the CW (Fig. 4). A slight recanalization of the CW was detected at 3 hours after the start of thrombolytic therapy, and a very weak MCA vessel reperfusion appeared after 6.5 hours. The severe vascular occlusions caused a pronounced perfusion deficit covering most of the right hemisphere and even parts of the contralateral cortex. In the striatum, no recovery of flow was detected by 6.5 hours after treatment. Correspondingly, a marked ADC decrease was observed already 0.5 hours after embolization affecting the striatum and parts of the lateral cortex. The severity of the lesion intensified during the next 7 hours despite treatment. Analogous to the experiment shown in Fig. 3, a delayed increase in T2 relaxation time was registered in the region of reduced ADC.
Middle cerebral artery recanalization after rt-PA treatment
In eight of the nine investigated animals, MRAs could be successfully recorded throughout the observation time until 6.5 hours after initiation of rt-PA treatment. In three of these, MCA was normally perfused at the end of the experiment. Vessel recanalization was minor or absent in five animals. In two of three experiments, where occlusion was restricted to the MCA, full recanalization was observed, whereas only one of six animals showed full recanalization, if additionally part of the CW was occluded. Successful recanalization thus critically depends on the initial pattern of vascular occlusion.
Tissue reperfusion after rt-PA treatment
The dynamics of the tissue perfusion signal were analyzed by PWI in the three previously defined brain regions. Start of reperfusion was defined as the posttreatment increase of the perfusion signal by more than 10% (of the control value) above the embolization value. Using this definition, reperfusion started 24 to 59 minutes earlier in animals with selective MCA occlusion than in those with combined MCA/CW obstruction (Fig. 5).
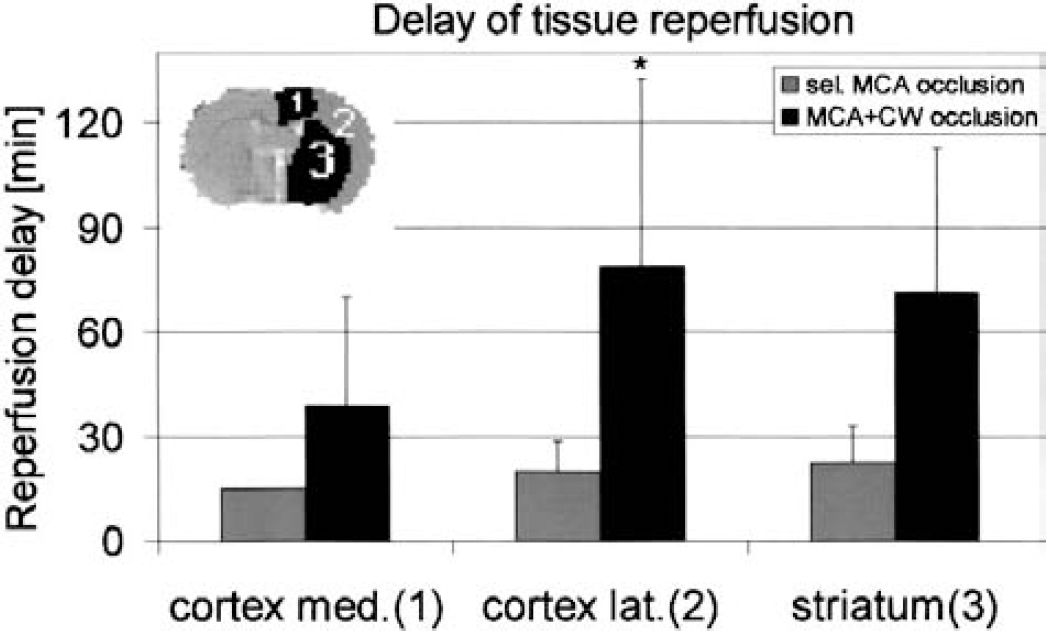
Delay of tissue reperfusion after rt-PA treatment of middle cerebral artery (MCA) clot embolism in the rat. Comparison of animals (means ± SD) with and without additional obstruction of the circle of Willis (CW). Regions of interest are identified in the insert. Note the marked increase in reperfusion delay after combined MCA/CW occlusion, particularly in the lateral cortex and striatum (P < 0.05).
The quality of reperfusion did not correlate with the vascular occlusion pattern, but clearly depended on the analyzed region. In the ACA-supplied dorsomedial cortex, rt-PA increased average perfusion from 69% ± 37% to 91% ± 28% (P < 0.001), and from 46% ± 18% to 61% ± 20% (P < 0.04) in both MCA-supplied lateral cortex and striatum (n = 8).
Apparent diffusion coefficient recovery after rt-PA treatment
The probability of tissue preservation at the end of the observation time (6 hours after start of treatment) was estimated by ADC mapping. For this purpose, the mean ADC values were computed in each of the previously defined regions of interest. The data obtained revealed a clear relationship between the severity of vessel occlusion and the relative ADC.
In the ACA-supplied dorsomedial cortex, in which tissue injury was least pronounced, relative ADC was 93% ± 12% after selective MCA occlusion, and 88% ± 11% after combined MCA/CW occlusion. Because essentially normal ATP levels are maintained in regions with ADC values higher than 77% of control (Hoehn-Berlage et al., 1995), tissue survival in this region is highly probable irrespective of the site of vascular occlusion (three of three and five of six animals, respectively). In the MCA-supplied territory, ADC markedly differed between the two groups, and was 85% ± 8% in the lateral part of cerebral cortex after selective MCA occlusion versus 69% ± 7% after combined MCA/CW occlusion (P < 0.03), and was 80% ± 17% in the striatum after selective MCA occlusion versus 66% ± 11% after MCA/CW occlusion (Fig. 6). These values suggest irreversible injury in one of three animals with selective MCA occlusion (and here only in striatum) but in five out of six animals after combined MCA/CW occlusion. Thus, thrombolytic treatment rarely prevents ischemic injury when CW is also occluded.
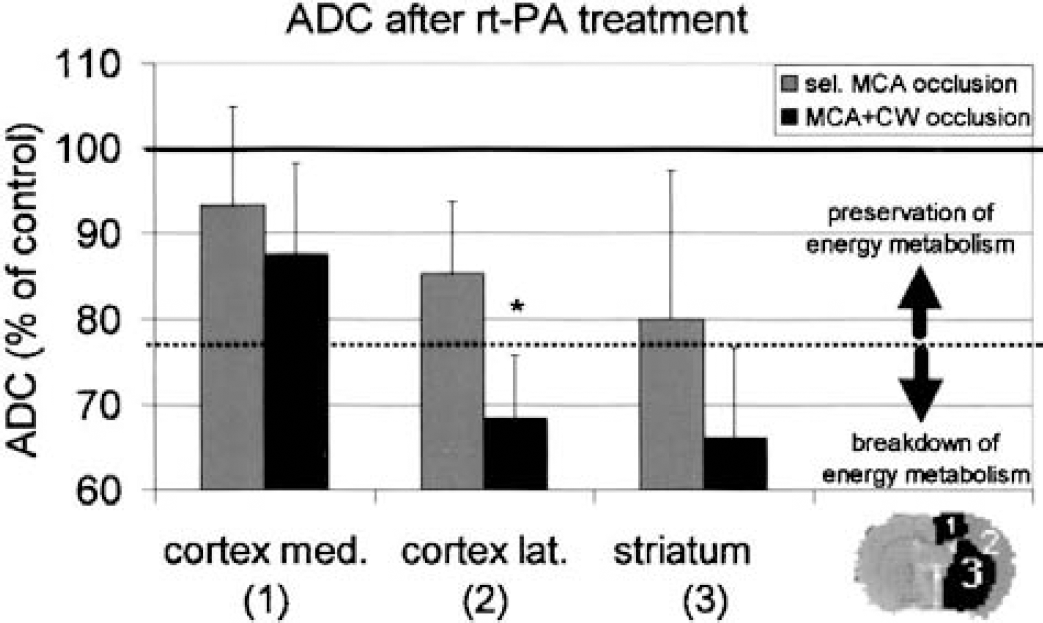
Apparent diffusion coefficient (ADC) measurements at 6 hours after rt-PA treatment of middle cerebral artery (MCA) clot embolism in the rat. Comparison of animals (means ± SD) with and without additional obstruction of circle of Willis (CW). The threshold of the ADC for the breakdown of energy (77% of control; Olah et al., 2001) is marked by the dotted line. Note the decrease of ADC below this threshold in lateral cortex and striatum of animals with combined MCA/CW occlusion but not in the medial cortex or in any region after selective MCA occlusion. These measurements underline the predictive power of magnetic resonance angiography for treatment outcome (P < 0.03).
Changes in T2 relaxation time
The relative T2 relaxation time was calculated within the three regions of interest. After thromboembolic stroke, an increase in T2 relaxation time, which is known to reflect the formation of vasogenic edema, was observed in the lateral cortex and the striatum. The relative T2 relaxation time at 6 hours after induction of rt-PA therapy showed indication to be correlated with the initial pattern of vascular occlusion and was region specific: T2 increased to 107% ± 28% (selective MCA occlusion) and 112% ± 11% (combined MCA/CW occlusion) in the lateral cortex and to 118% ± 25% (selective MCA occlusion) and 124% ± 12% (combined MCA/CW occlusion) in the striatum. The more pronounced striatal T2 increase corresponds to the lower relative ADC in this region (cf. Figure 6). In the ACA-supplied dorsomedial cortex, T2 remained normal: 100% ± 16% after selective MCA occlusion and 96% ± 3% after combined MCA/CW occlusion.
DISCUSSION
The present data show the importance of MR angiography in experimental stroke research. Because the effect of clot embolism ranged from no visible vessel occlusion to complete MCA and partial CW occlusion, MR angiography should be included in the multiparametric MR data-acquisition protocol. The same is true for thrombolytic recanalization of clot embolism, which also varied over a wide range from complete to absent. By combining MRA with previously established MR imaging methods, we were able to analyze in detail the consequences of different vascular occlusion patterns. To our knowledge, this is the first experimental study in which such an approach has been used.
Methodologic aspects
The three-dimensional TOF-MRA method applied in the present investigation uses a short repetition time (TR = 50 milliseconds), thereby effectively saturating all stationary tissue. Thus, only spins of inflowing (unsaturated) blood are detected. During this three-dimensional sequence the whole volume is excited at each RF excitation pulse; therefore, few excitation pulses are already sufficient to completely reduce the signal intensity of blood spins that have entered the excitation volume. Under these conditions, the distance that can be covered by the inflowing unsaturated spins is highly limited, depending crucially on the blood flow velocity. Because this velocity depends on the vessel diameter, it is difficult to detect slowly flowing blood in small arterial vessels, or slower-moving venous blood in general. Although TOF-MRA can discriminate the ramifications of cerebral arteries in the well-perfused healthy rat brain, the present study focuses on the large basal arteries because thromboembolic stroke reduces blood flow velocity. If this velocity falls below a threshold defined by the pixel resolution and the repetition time (TR = 50 milliseconds), intravascular movement of blood spins can no longer be detected. Assuming that the signal of inflowing blood will be attenuated to approximately 10% after five excitation pulses (flip angle = 45 degrees) (Haacke, 1999), the “time of flight” is limited to 250 milliseconds. In the present experiments, the lowest spatial resolution was in the rostrocaudal direction, amounting to 0.6 mm. Therefore, the minimum detectable blood flow velocity is given as vmin = 0.6 mm/250 msec = 2.4 mm/sec. Under normal physiologic conditions, the blood flow velocity within the carotid arteries of the rat has been estimated as 8 to 10 cm/sec (Burke, 2000). In consequence, our angiographic method permits the detection of blood flow over a wide range of flow velocities down to approximately 3% of normal. Therefore, we are confident that the presently used angiographic method reliably detects even small residual blood circulation after embolism and also minor changes at early stages of thrombolytic recanalization.
Vessel occlusion and recanalization
In the rat model of thromboembolic stroke, visualization of vascular occlusion and recanalization is of considerable importance for the estimation of the effective injury time because both the completeness of obstruction and the delay in recanalization may vary greatly in different experiments. However, recanalization of the MCA after reversible thread occlusion occurs immediately with thread withdrawal (Besselmann et al., 2001).
Our study shows that animals with selective MCA occlusion have a higher probability of recanalization than those with additional CW occlusion. Because the treatment protocol (10 mg/kg body weight rt-PA, intra-arterial injection) was the same in all animals, different outcome obviously depended on the site and severity of vascular obstruction. Depending on the individual vessel diameter, the local flow conditions and the number of clots, MCA was either selectively occluded or in combination with an obstruction of the CW (origin of ACA and/or distal part of ICA). The higher probability for recanalization, observed when CW remained open, could be caused by a more efficient exposure of clots in the MCA to the circulating drug. In contrast, drug supply is greatly impeded when CW flow is obstructed. In this case, thrombolytic substances would reach their target only by diffusion, which may explain the low success of recanalization. Therefore, the crucial requirement for an early recanalization seems to be the preservation of some residual CW flow. This observation is in line with clinical findings that recanalization after intraarterial urokinase treatment is much more likely after proximal obstruction of the horizontal portion of the MCA than after distal carotid occlusion (Suarez et al., 1999).
Lesion prediction and transient recovery
Our data show that angiographic evaluation of vessel occlusion is a better predictor of tissue injury than the changes observed in the PWI. If there is no visible change in angiographic vessel signal intensity, ADC does not decrease below the critical threshold of energy failure even if the perfusion signal (PWI) is significantly reduced (Fig. 2). A selective MCA occlusion without CW involvement results primarily in a cortical lesion, whereas both cortical and striatal lesions evolve after combined MCA/CW occlusion. Although no comparable animal study has dealt with lesion prediction based on angiographic data, several clinical trials are in line with this conclusion. In fact, both the early ischemic vessel occlusion pattern (Kucinski et al., 1998; Ringelstein et al., 1992) and the recanalization delay (Christou et al., 2000; Lev et al., 2001; Molina et al., 2001; Ringelstein et al., 1992) correlate with infarct volume.
A disappointing result of this study was the observation that in the vascular territory of the occluded MCA, ADC or PWI signal intensity never fully recovered, even in the few cases of full recanalization. In fact, blood flow after transient improvement tended to further decrease and remained at the lower level throughout the observation period. Ongoing hemodynamic impairment is an obvious reason for the limited therapeutic effect. Vessels may be recanalized too late, or secondary microembolism caused by thrombocytic activity may obstruct downstream branches after primary clot destruction (Zhang et al., 2001). Similar observations have been made before (Busch et al., 1998; Pillekamp et al., 2001) and explain that the main therapeutic effect of thrombolysis is the protection of periinfarct penumbral tissue rather than the reversal of the initial ischemic injury (Brinker et al., 1999; Busch et al., 1998).
Further studies should therefore aim at accelerating vessel recanalization and preventing secondary microembolism, such as by GPIIb/IIIa-receptor inhibitors (Choudhri et al., 1998; Yang et al., 2001). However, improvement of blood recirculation may not suffice to prevent tissue injury, as documented by reversible MCA thread occlusion (Du et al., 1996). Therefore, thrombolytic treatment of clot embolism will be only one component of a multifaceted therapeutical approach that requires considerable improvements before a major change of outcome can be expected.
Outlook
To improve the sensitivity of TOF-MRA for the detection of vascular occlusion and recanalization, it is possible to use a two-dimensional multislice MR angiographic method. With this technique only a single slice is saturated, allowing the detection of more slowly flowing blood. A disadvantage of this approach is veiling of arterial vascular structures by the venous system that will also be displayed, and which makes it more difficult to differentiate between arterial and venous vessel architecture. Moreover, blood movement cannot be detected in vessels that follow the plane of the selected slice, because saturation of this slice during acquisition results in high direction specificity.
To get more precise information about the exact position of clots and to differentiate between primary and secondary embolic events, we plan to label clots during preparation. Using MR imaging contrast-enhancing agents, the labeled clots should be identifiable due to their reduced longitudinal relaxation time, T1 or T2*.
CONCLUSIONS
We have shown that TOF-MRA can depict the anatomy of perfused cranial vessels not only under normal physiologic conditions, but also in the pathophysiologic situation of experimental thromboembolic stroke in the rat. Our data show that the initial pattern of vascular occlusion as detected by pretreatment MR angiography predicts tissue outcome at 6 hours after induction of thrombolytic therapy. The probability of vessel recanalization and of tissue survival and the delay of reperfusion depend on site of vascular obstruction, with selective MCA occlusion producing less severe injury than combined MCA/CW obstruction. Magnetic resonance angiography, in combination with multiparametric MR imaging, is a powerful tool for the detailed analysis of such types of cerebrovascular disorders.
Footnotes
Acknowledgements
The authors thank Hans-Jörg Busch for the photograph of the latex-perfused brain vessels.