
Abstract
It has been previously shown that T1 in the rotating frame (T1ρ) is a very sensitive and early marker of cerebral ischemia and that, interestingly, it can provide prognostic information about the degree of subsequent neuronal damage. In the present study the authors have quantified T1ρ together with the rate and other variables of magnetization transfer (MT) associated with spin interactions between the bulk and semisolid macromolecular pools by means of Z spectroscopy, to examine the possible overlap of mechanisms affecting these magnetic resonance imaging contrasts. Substantial prolongation of cerebral T1ρ was observed minutes after induction of ischemia, this change progressing in a time-dependent manner. Difference Z spectra (contralateral nonischemic minus ischemic brain tissue) showed a significant positive reminder in the time points from 0.5 to 3 hours after induction of ischemia, the polarity of this change reversing by 24 hours. Detailed analysis of the MT variables showed that the initial Z spectral changes were due to concerted increase in the maximal MT (+3%) and amount of MT (+4%). Interestingly, the MT rates derived either from the entire frequency range of Z spectra or the time constant for the first-order forward exchange (ksat) were unchanged at this time, these variables reducing only one day after induction of ischemia. The authors conclude that T1ρ changes in the acute phase of ischemia coincide with both elevated maximal MT and amount of MT. These changes occur independent of the overall MT rate and in the absence of net water gain to the tissue, whereas in the consolidating infarction the decrease in the rate and amount of MT, as well as the extensive prolongation of T1ρ, are associated with water accumulation.
Magnetic resonance imaging (MRI) is an invaluable tool for the assessment of brain under acutely compromised cerebral blood flow and ischemia (Baird and Warach, 1998; Gröhn and Kauppinen, 2001). This is largely due to the inherent sensitivity of water diffusion to the loss of energetic and ionic homeostasis within ischemic tissue (Moseley et al., 1990). The reduction in the water diffusion coefficient is now widely used in delineation of ischemic tissue by MRI, yet the biophysical mechanisms underlying the diffusion change are only partially understood. Several reports have shown that magnetic resonance (MR) contrast from prolongation of either T1 or T2 relaxation of tissue water protons develops only after several hours of ischemia and is an index of irreversible water accumulation (Buonanno et al., 1982; Kato et al., 1985; Knight et al., 1994). Based on the known temporal patterns, diffusion and T2 MRI have been exploited for monitoring the evolution of ischemic tissue damage (Welch et al., 1995).
Hemodynamic and metabolic factors cause early changes in MR relaxation times in ischemic brain. These include blood oxygenation level–dependent contrast on T2 (Gröhn et al., 1998) and T2* (De Crespigny et al., 1992; Roussel et al., 1995) and direct flow-related effects on cerebral T1 (Calamante et al., 1999; Kettunen et al., 2000). It should be noted that these changes involve relaxation of tissue water only indirectly. Nevertheless, evidence from animal stroke models suggest that changes in the tissue MR relaxation times may occur much earlier in acute ischemia than previously considered It has been shown that T1 increases within a few minutes of ischemia, exceeding the direct effect of reduced flow and preceding the net water gain to the tissue (Calamante et al., 1999; Kettunen et al., 2000). Furthermore, it has been shown that the on-resonance T1 in the rotating frame (T1ρ) increases on acute cerebral ischemia (Kettunen et al., 2001) and that the absolute T1ρ images provide predictive information from tissue outcome under conditions when data obtained by diffusion MRI are ambiguous (Gröhn et al., 1999, 2000). Our previous data show that the T1ρ increase precedes the decline of diffusion, suggesting that this MR relaxation contrast may be the earliest MRI marker of ischemia (Kettunen et al., 2001). The biophysical mechanisms affecting T1ρ relaxation are poorly understood. T1ρ is known to probe water with restricted mobility in a close interaction with immobile macromolecular proton pools (Kimmich et al., 1990; Brown and Koenig, 1992). One MRI method that is capable of probing the tissue-to-water interface is magnetization transfer (MT), and it would be of substantial interest to quantitatively compare changes in T1ρ with the characteristics of MT in ischemic stroke to elucidate the mechanisms affecting tissue T1ρ MRI.
It is well established that exchange of spins between the bulk water and macromolecular protons affects nuclear magnetic resonance (NMR) relaxation, and cerebral ischemia has been shown to influence the processes mediating the exchange (Ordidge et al., 1991; Ewing et al., 1999). It should be noted, however, that physical factors not directly affecting MT may affect the MR relaxation in acute ischemia (Henkelman et al., 2001) and they need to be quantified in parallel to the MT rate. In the present study we have carried out a quantitative and comprehensive MRI analysis of relaxation times and diffusion as well as determining the MT parameters (Henkelman et al., 1993; Morrison and Henkelman, 1995) from Z spectra (Grad and Bryant, 1990) in a rat model of focal cerebral ischemia.
MATERIALS AND METHODS
Theoretical considerations
The interactions of protons between bulk water and macromolecular pools (often referred to as a semisolid compartment) can be probed and quantified by MRI. There are two major pathways through which protons can communicate between the two pools: first, through proton exchange of macromolecular labile (exchangeable) groups such as –OH, –NH, –SH and amides; and second, through the molecular exchange of internal macromolecular water molecules (Venu et al., 1997; Henkelman et al., 2001). The former mechanism involves covalent bond formation whereas the latter exchange mechanism occurs through hydrogen bonding. Saturation transfer NMR methods allow for explicit determination of both longitudinal and transverse relaxations of the protons in the two pools as well as the magnetization exchange rate between the pools. In the present study we have used Z spectroscopy (Grad and Bryant, 1990) to probe the MT rate between the bulk and semisolid pools and the relaxation properties of protons in these pools. This procedure was chosen to quantitatively assess the possible changes in these variables in acute cerebral ischemia. In parallel to Z spectroscopy, we have also quantified on-resonance T1ρ at several spin-lock field amplitudes with the aim of determining the plausible contribution of MT and/or altered relaxation of protons in specific tissue compartments to T1ρ. In this way we hoped to gain mechanistic information about the fundamentals of the T1ρ change in the early minutes of cerebral ischemia (Gröhn et al., 1998, 2000). A number of studies have demonstrated that proton exchange can influence T1ρ relaxation (Rommel and Kimmich, 1989; Kimmich et al., 1990; Mäkelä et al., 2001), and thus T1ρ and conventional MT are expected to share sensitivity to the same biophysical processes. This is due to the fact that the condition given by

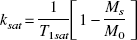
Extensive studies from tissue models and biological tissues have shown that the saturation transfer NMR data can be fully described by two-site models (Eng et al., 1991; Grad et al., 1991; Henkelman et al., 1993), thus this convention is adopted in the present study. Several methods have been proposed to quantify the interactions of spins by the saturation transfer method. A robust phenomenological measure given by the off-resonance saturation measurement is the magnetization transfer ratio (MTR) between signal intensities with (MS) and without the saturation pulse (M0) given by

It has been proposed that the time constant for the first-order forward exchange (ksat) given by
A comprehensive method for analyzing the MT data and relaxation rates of protons in the individual pools from the Z spectroscopy in quantitative terms has been described by Henkelman et al. (1993). In this analysis, appropriate absorption-line shape is fitted into the Z spectrum obtained at multiple off-resonance saturation field amplitudes. The MT variables are derived from a two-site mathematical model, based on the solutions of the Bloch equations (for details, see Henkelman et al., 1993). From the model, the longitudinal component of pool A magnetization, MZA, is given by
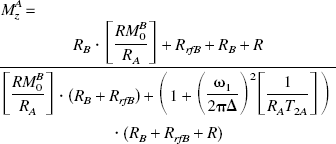
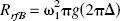
It has been shown that the super-Lorenzian line shape function most accurately fits the Z spectral data from immobilized protein phantoms (Morrison et al., 1995) and biological tissue (Morrison and Henkelman, 1995; Quesson et al., 1997), and we have used this line shape in fitting the cerebral Z spectroscopy data. Fitting the Z spectra into the Henkelman model and taking RB to be 1 s−1 (Henkelman et al., 1993), the following four parameters can be determined: R, T2A, RM0B/RA (an index of the amount of MT) and 1/RAT2A (an index of the direct saturation effect). The use of RB = 1 s−1 for brain Z spectral data is justified by the experimental evidence (Quesson et al., 1997), and, furthermore, the parameters derived by the Henkelman model have been shown to be insensitive to RB values between 0.5 to 3 s−1 (Lee and Dagher, 1997). It should be noted that the model is a steady-state one, requiring existence of a steady state between the two pools in the experiments. Therefore, one needs to use long saturation pulses (typically, greater than 2 seconds) for the cerebral MT studies at 4.7 T (Quesson et al., 1997).
As far as the biophysical mechanisms underlying the MT are concerned, a consensus prevails that the transfer of magnetization is governed by dipolar interactions between the two pools, leading to “spread” of magnetization in the immobile pool by spin diffusion (Grad et al., 1991; Ceckler et al., 1992; Henkelman et al., 2001). Even though the detailed chemical and molecular interactions behind the dipolar effects are not fully understood, it is likely that the molecular exchange of water (Henkelman et al., 2001), possible at the internal macromolecular sites (Venu et al., 1997), mediates the major part of exchange process. It is interesting to note that the chemical nature of the exchange processes affecting T1 and MT in model phantoms is apparently distinct, suggesting that, whereas the former variable is strongly influenced by proton exchange (Kimmich et al., 1990, Mäkelä et al., 2001), the latter is relatively insensitive to this pathway (Ceckler and Balaban, 1991; Grad et al., 1991). Therefore, it is expected that the two MRI contrasts may reflect distinct physico–chemical changes taking place in acute cerebral ischemia.
Experimental
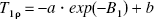
Sham-operated animals (n = 4) underwent the same procedure but without introducing the occluding thread.
Dav was quantified using eight bipolar gradients along each axis with b-values of 0, 493, 1,029, and 1,370 s/mm2 (time to repeat [TR] 2 seconds, TE 70 milliseconds) as described previously (Mori and van Zijl, 1995). Single Hahn spin-echo T2 was determined using seven TE values ranging from 15 to 120 milliseconds with a TR of 2 seconds. T1 and T1sat (two offset frequencies of 6,151 and 10,743 Hz with an off-resonance saturation pulse [B2] power of 0.051 G) were determined using eight inversion times ranging either from 50 to 2,500 milliseconds or from 50 to 1,500 milliseconds with a TR of 7 seconds, respectively. The on-resonance T1ρ was quantified using five adiabatic spin-lock pulses ranging from 10 to 90 milliseconds with a B1 from 0.4 to 1 G (TR 2.5 seconds, TE 15 milliseconds). The spin-lock sequence consisted of two adiabatic half-passages, joined by a spin-lock period followed by a crusher gradient in front of the line-scan acquisition (Kettunen et al., 2001). The T1ρ MRI method used has been shown to yield consistent T1ρ values in vivo with B1 fields of 0.2 to 1.8 G (Gröhn et al., 2000; Kettunen et al., 2001). The variables associated with MT (Henkelman et al., 1993) were quantified from the Z spectra acquired with 5-second B2 pulses (offset frequencies of 0.5 to 100 kHz) with four different pulse amplitudes ranging from 0.025 to 0.2 G (106 to 852 Hz). Since the model requires steady-state conditions, the off-resonance saturation pulse used was longer than that shown to give steady state in the rat brain at 4.7 T with similar B2 fields (Quesson et al., 1997). The Z spectra from model phantoms (Grad et al., 1990) and tissues (Eng et al., 1991; Grad et al., 1991; Ordidge et al., 1991) are symmetrical within the spectral resolution and, therefore, we have acquired only one half of the spectrum relative to the water resonance from the rat brain for the sake of experimental time.
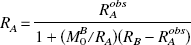
The Z spectra were analyzed by taking the water signal intensity obtained without off-resonance saturation immediately before and after Z spectral data collection as a reference value of unity (Grad et al., 1991). The data obtained with four B2 field strengths were fitted into the two-pool model of Henkelman et al. (1993) using super-Lorenzian line shape (Morrison and Henkelman, 1995) to yield the characteristics of the proton pools and their interactions as follows: R, T2B, RM0B/RA, and 1/RAT2A. In these computations, RB was taken to be 1 s−1 (Henkelman et al., 1993). The quality of each fit (designated “Sigma”) was evaluated as the average residual deviation per spectral point between the fit and the experiment (Stanisz et al., 1999). RA was estimated under the approximation of R ≫ (RB - RAobs) from
RESULTS
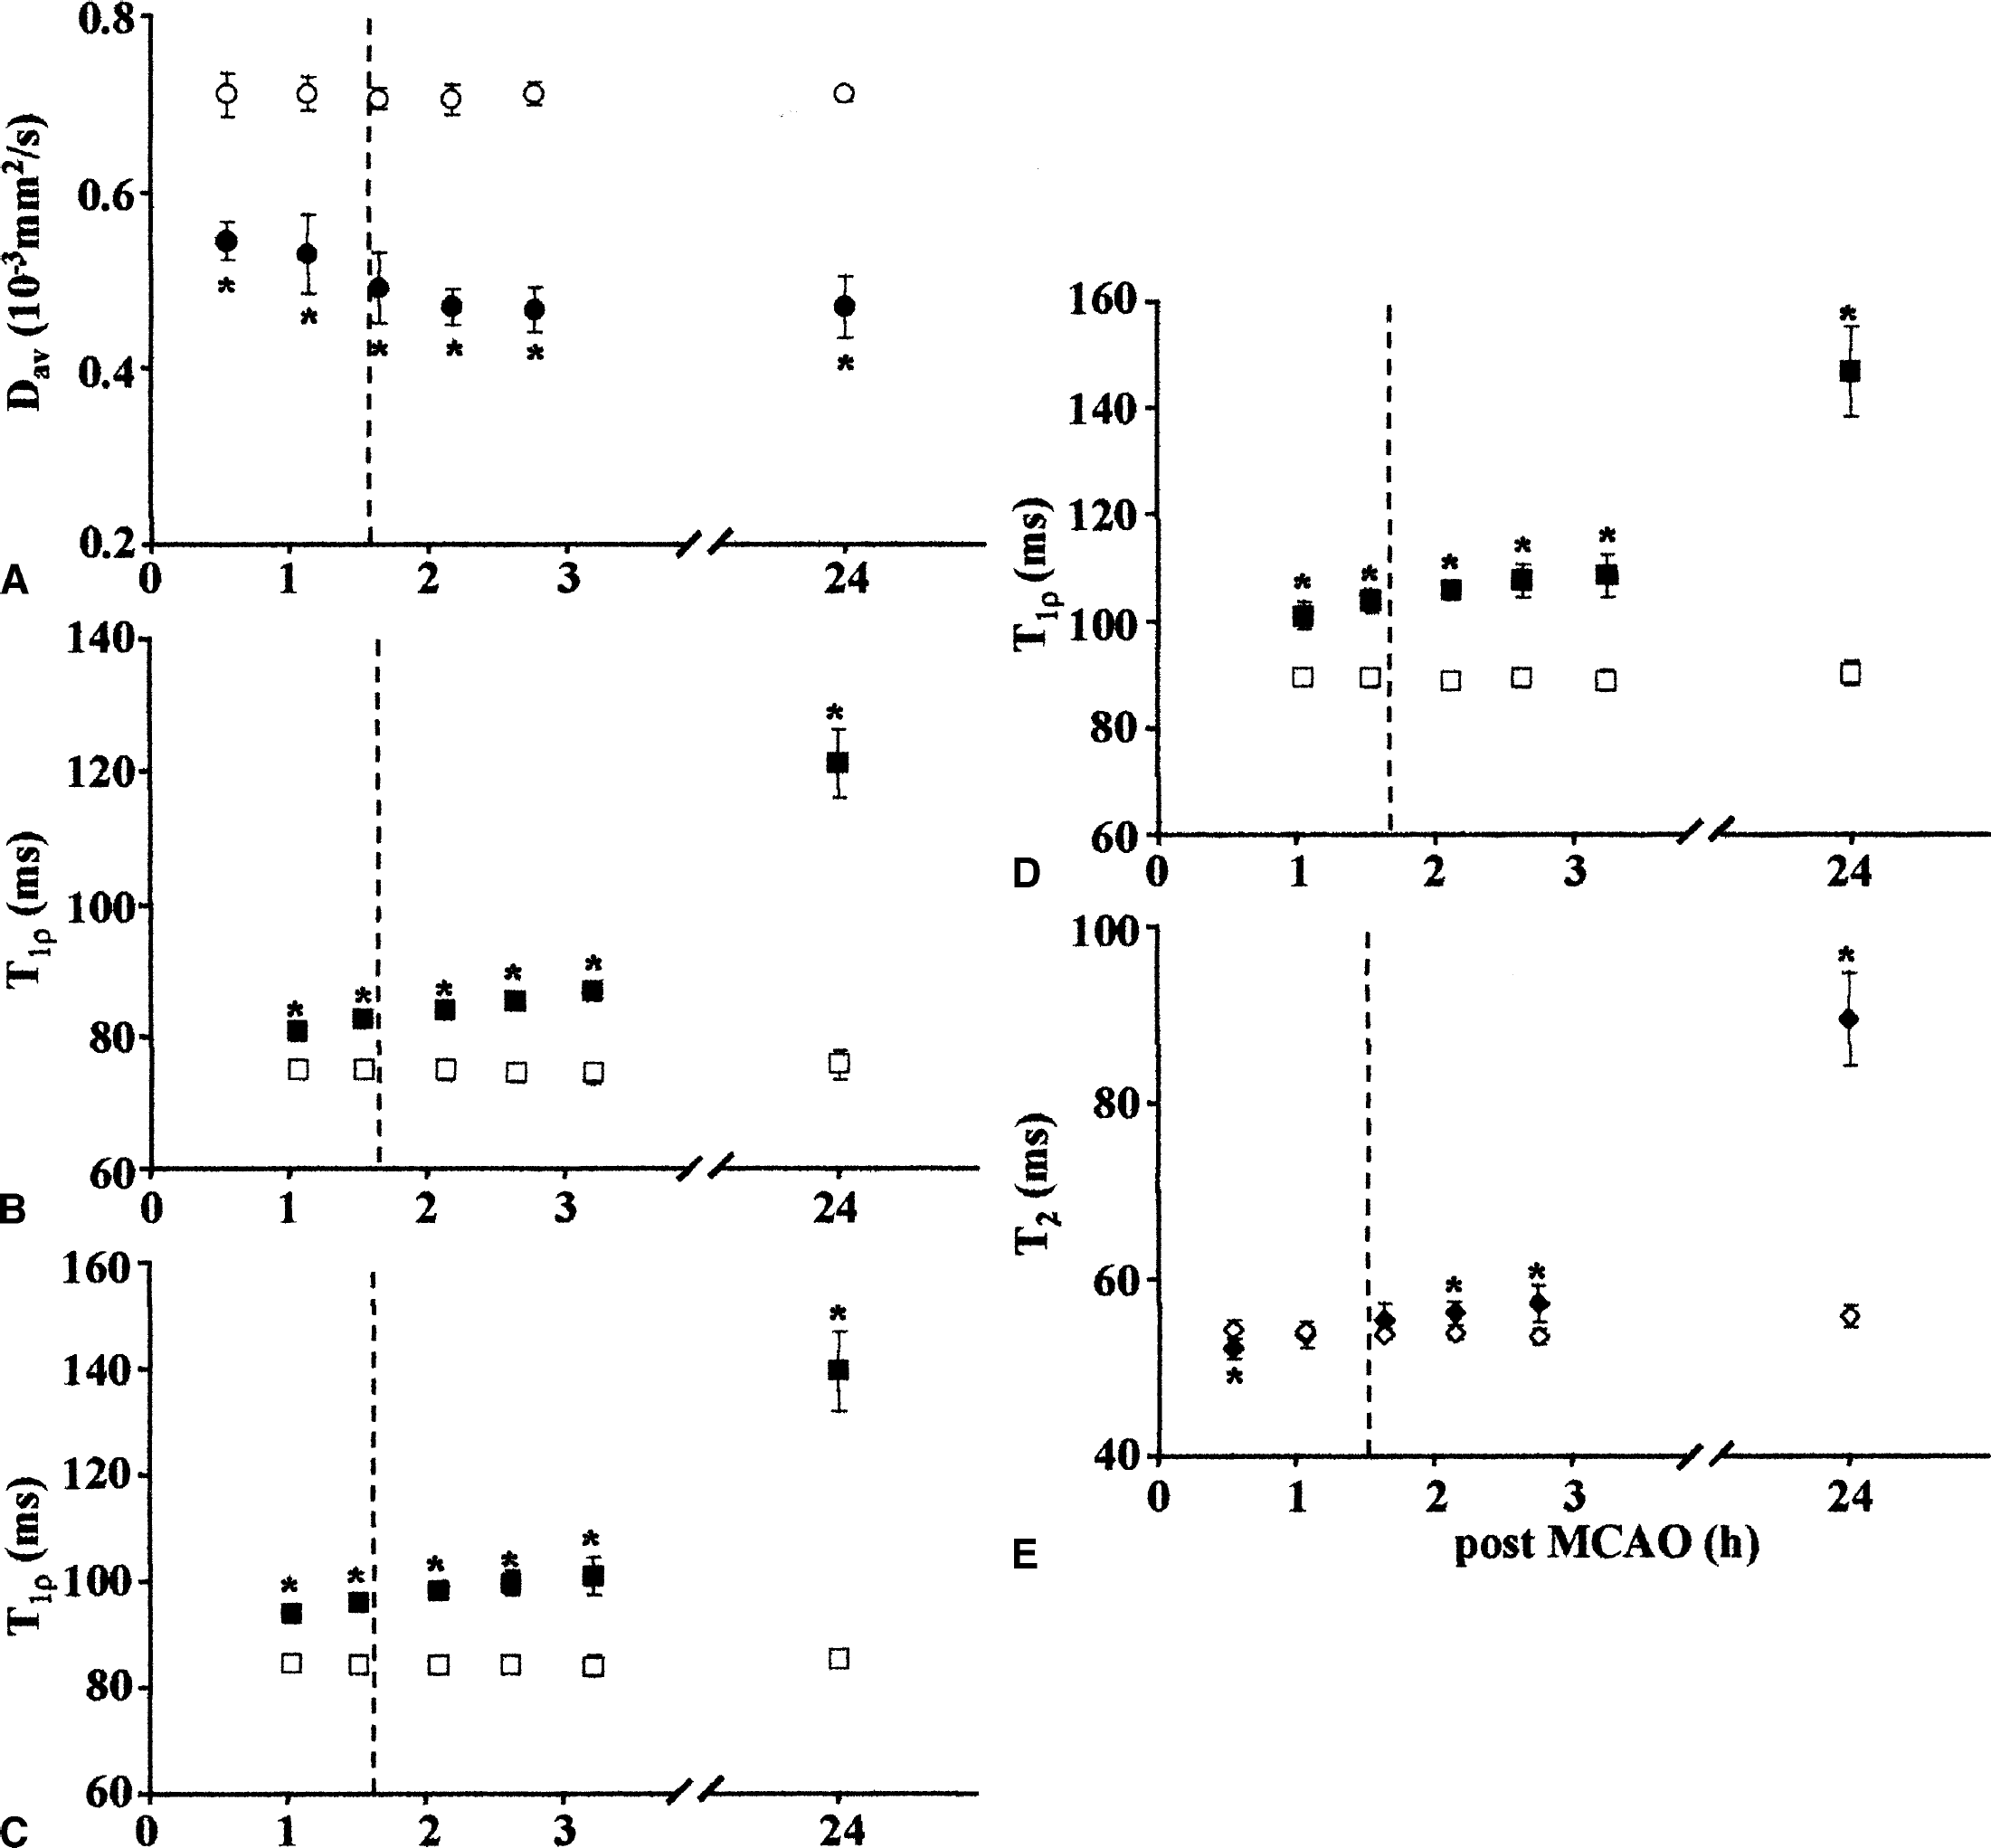
Other physiologic parameters were within normal range throughout the MRI experiments, but a mild hypercarbia occurred during prolonged anesthesia (Table 1). An axial MRI slice from an ischemia rat indicating the position of the imaging line and the positioning of ROIs is shown (Fig. 1A). The Dav profile shows a drop in the water diffusion coefficient by ∼0.25 × 10⁻³mm2 × s−1 (by ∼35%) in the ischemic ROI (Fig. 1B). Indeed, all the rats exposed to MCAO showed an average reduction of Dav by 0.2 × 10⁻³mm2 × s−1 in the ipsilateral hemisphere and no recovery of Dav was detected after retraction of the thread (Fig. 2A). In the sham-operated animals or in the contralateral ROI, the diffusion MRI remained unchanged.
Physiologic parameters
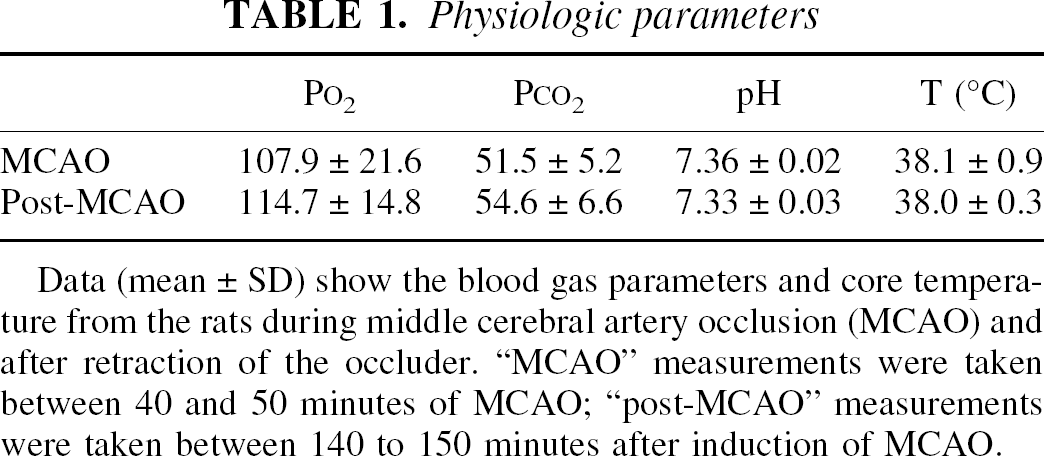
Data (mean ± SD) show the blood gas parameters and core temperature from the rats during middle cerebral artery occlusion (MCAO) and after retraction of the occluder. “MCAO” measurements were taken between 40 and 50 minutes of MCAO; “post-MCAO” measurements were taken between 140 to 150 minutes after induction of MCAO.
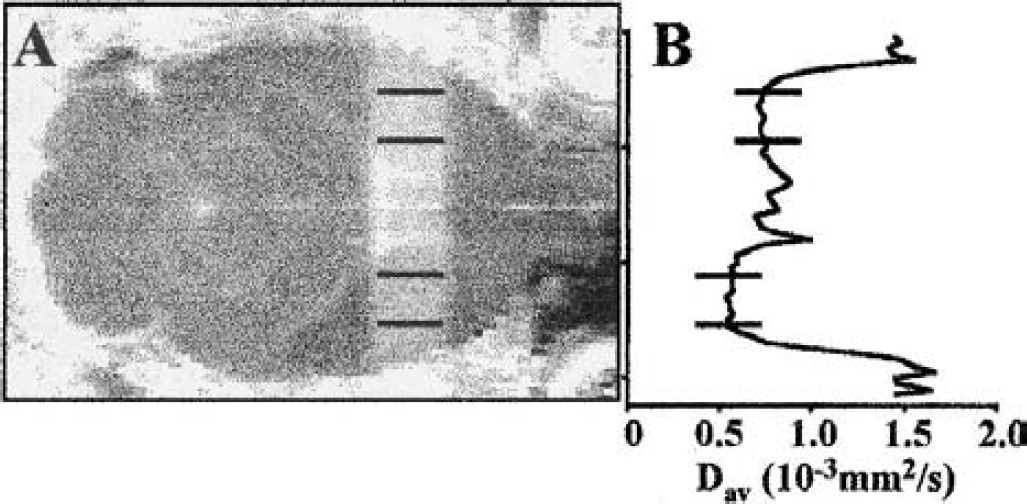
An absolute diffusion magnetic resonance (MR) image overlaid with the scanned MR line
Changes in relaxation times
The time courses of T1ρ, as determined by three B1 fields, showed a significant increase in the ischemic tissue (Figs. 2B to 2D). For instance, at 0.4 G the absolute T1ρ was about 40 milliseconds longer in the ipsilateral than in the contralateral volume one day after induction of ischemia (Fig. 2, Table 2). We have previously shown that neuronal loss of 60% to 70% occurs in the caudate and temporal cortex by 24 hours after 90 minutes of MCAO and the extent of T1ρ prolongation correlates with the severity of neuronal damage (Gröhn et al., 1999). T1ρ, as measured with B1 of 1 G, increased in the ipsilateral hemisphere by ∼20% during ischemia and reperfusion relative to the value of 89.4 ± 1.2 milliseconds in the contralateral ROI (Fig. 2D). The most pronounced effect was evident in dT1ρ, which increased extensively after the onset of ischemia (Table 2). This observation is consistent with our earlier report showing that dT1ρ is a more sensitive index of ischemic than T1ρ determined at a single B1 field (Gröhn et al., 2000). Taking these data into account, the extensive T1ρ and dT1ρ increase in the cortex and caudate one day after MCAO thus was considered as an expression of a very severe neuronal loss associated with a net water gain in the tissue.
Magnetic resonance imaging relaxation times, T1ρ dispersion and maximal magnetization transfer in the rat brain
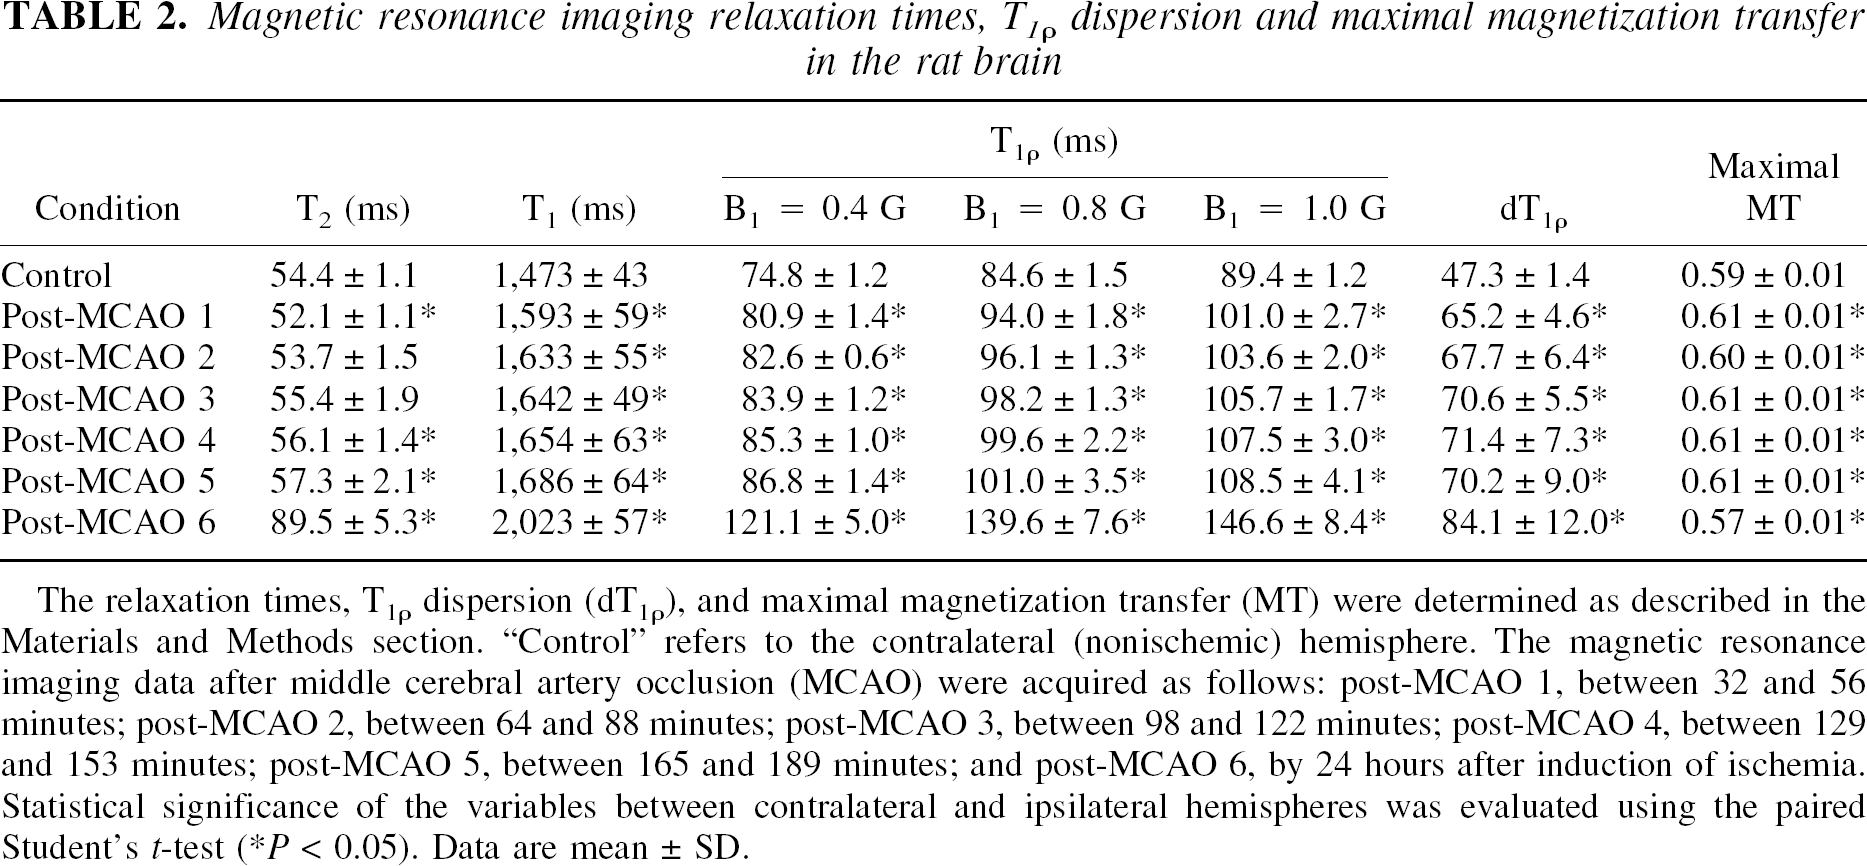
The relaxation times, T1ρ dispersion (dT1ρ), and maximal magnetization transfer (MT) were determined as described in the Materials and Methods section. “Control” refers to the contralateral (nonischemic) hemisphere. The magnetic resonance imaging data after middle cerebral artery occlusion (MCAO) were acquired as follows: post-MCAO 1, between 32 and 56 minutes; post-MCAO 2, between 64 and 88 minutes; post-MCAO 3, between 98 and 122 minutes; post-MCAO 4, between 129 and 153 minutes; post-MCAO 5, between 165 and 189 minutes; and post-MCAO 6, by 24 hours after induction of ischemia. Statistical significance of the variables between contralateral and ipsilateral hemispheres was evaluated using the paired Student's t-test (*P < 0.05). Data are mean ± SD.
Dav
T2 slightly decreased by 30 minutes of MCAO in the ipsilateral hemisphere relative to the contralateral value of 55.8 ± 1.2 milliseconds (Fig. 2E, Table 2). This is explained by negative blood oxygenation level–dependent contrast, in agreement with previous reports (Gröhn et al., 1998; Calamante et al., 1999). T2 was significantly increased at the time points beyond 2 hours after induction of MCAO, reaching the value of 89.5 ± 5.3 milliseconds by 24 hours (Fig. 2E, Table 2). The latter observation is attributable to irreversible tissue status and net water accumulation (Kato et al., 1985; Knight et al., 1994).
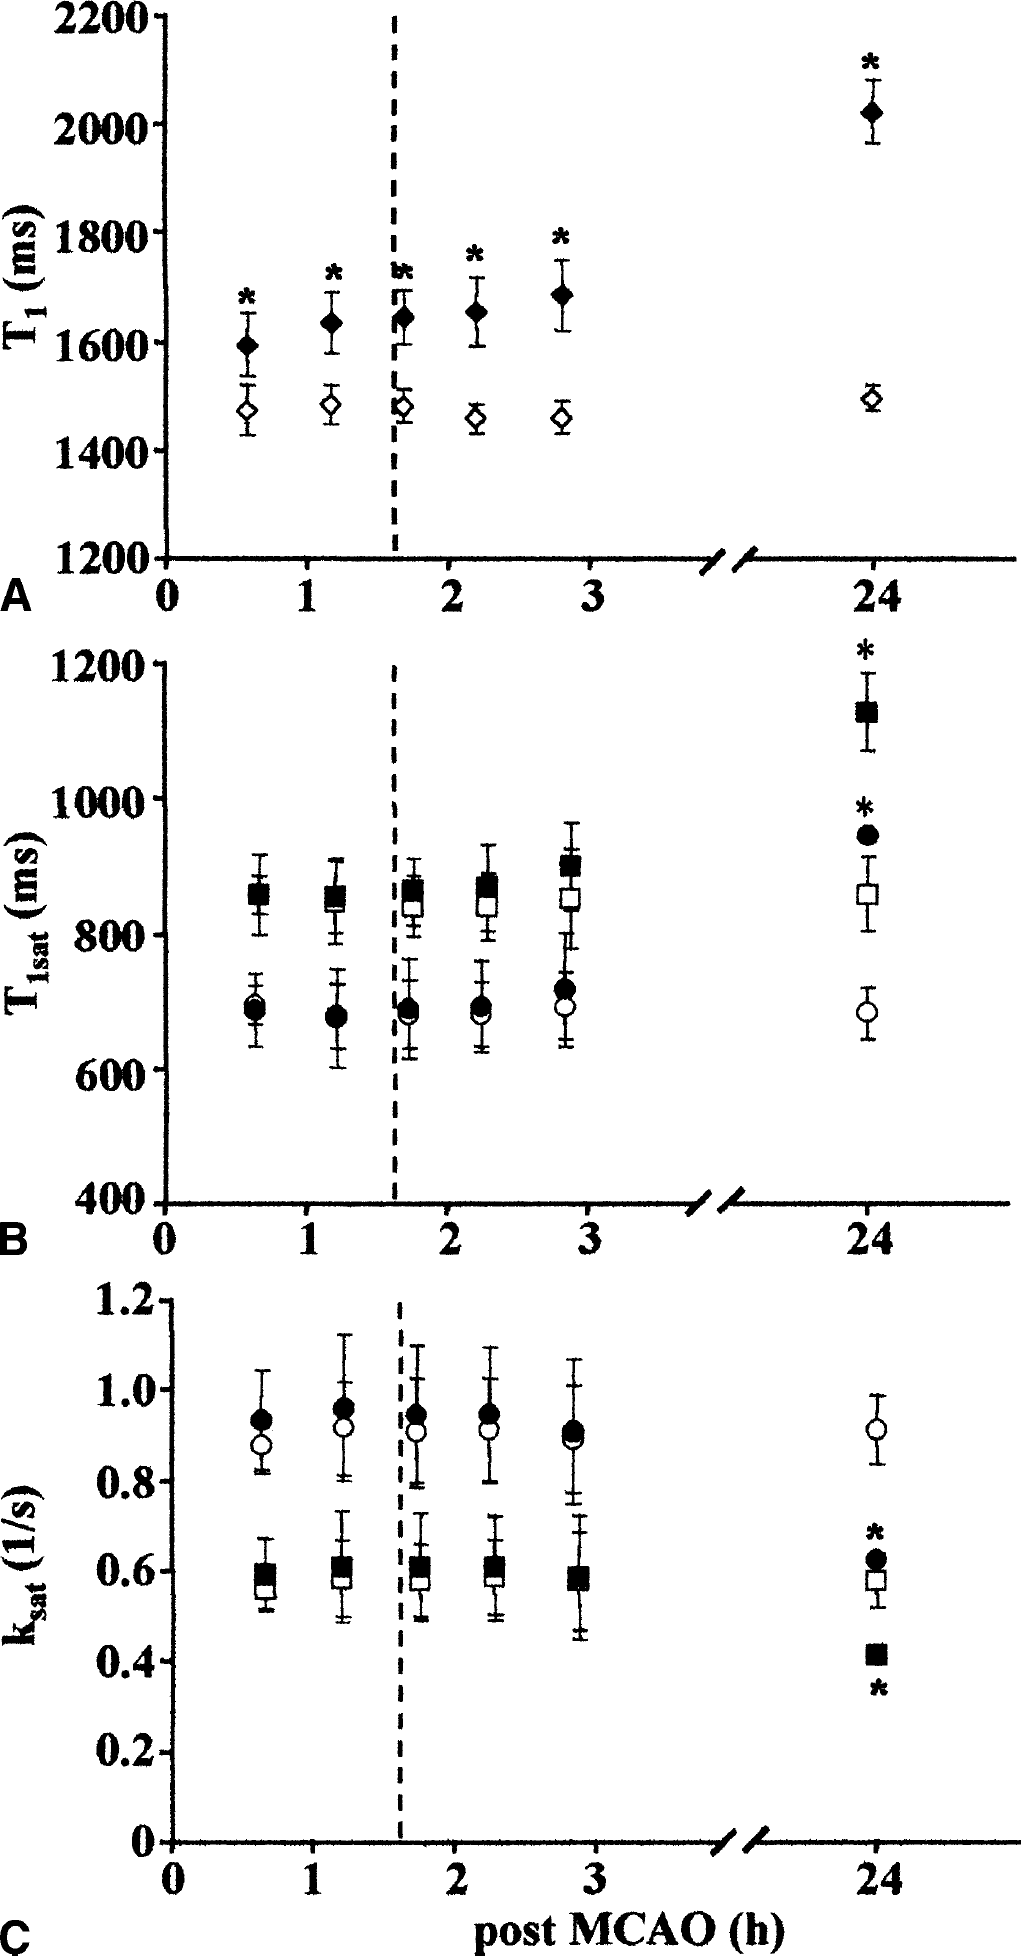
T1 showed prolonged values in the ipsilateral ROI at all time points, the relaxation time reaching a value that was ∼550 milliseconds longer in the ischemic volume than in the contralateral brain region by 24 hours (Fig. 3A, Table 2). Thus the patterns of diffusion and T1 were similar to those reported for permanent MCAO (Knight et al., 1994). T1sat obtained with two offset frequencies remained unchanged during the first hours of focal ischemia, followed by an extensive increase of 30% by 24 hours (Fig. 3B). In the sham-operated animals, the MR relaxation times were within the control values shown in Figs. 2 and 3. MR relaxation times from MCAO animals are also summarized in Table 2.
T1
Spin density determined from the M0 of T2 fits was close to one during the first three hours after induction of MCAO, and at 24 hours the ratio was 1.07 (Table 3). These observations together with the time course of T2 indicate net water accumulation in the present MCAO model only at the 24-hour time point (see also Kettunen et al., 2001).
Quantitative magnetic resonance imaging parameters from rat brain
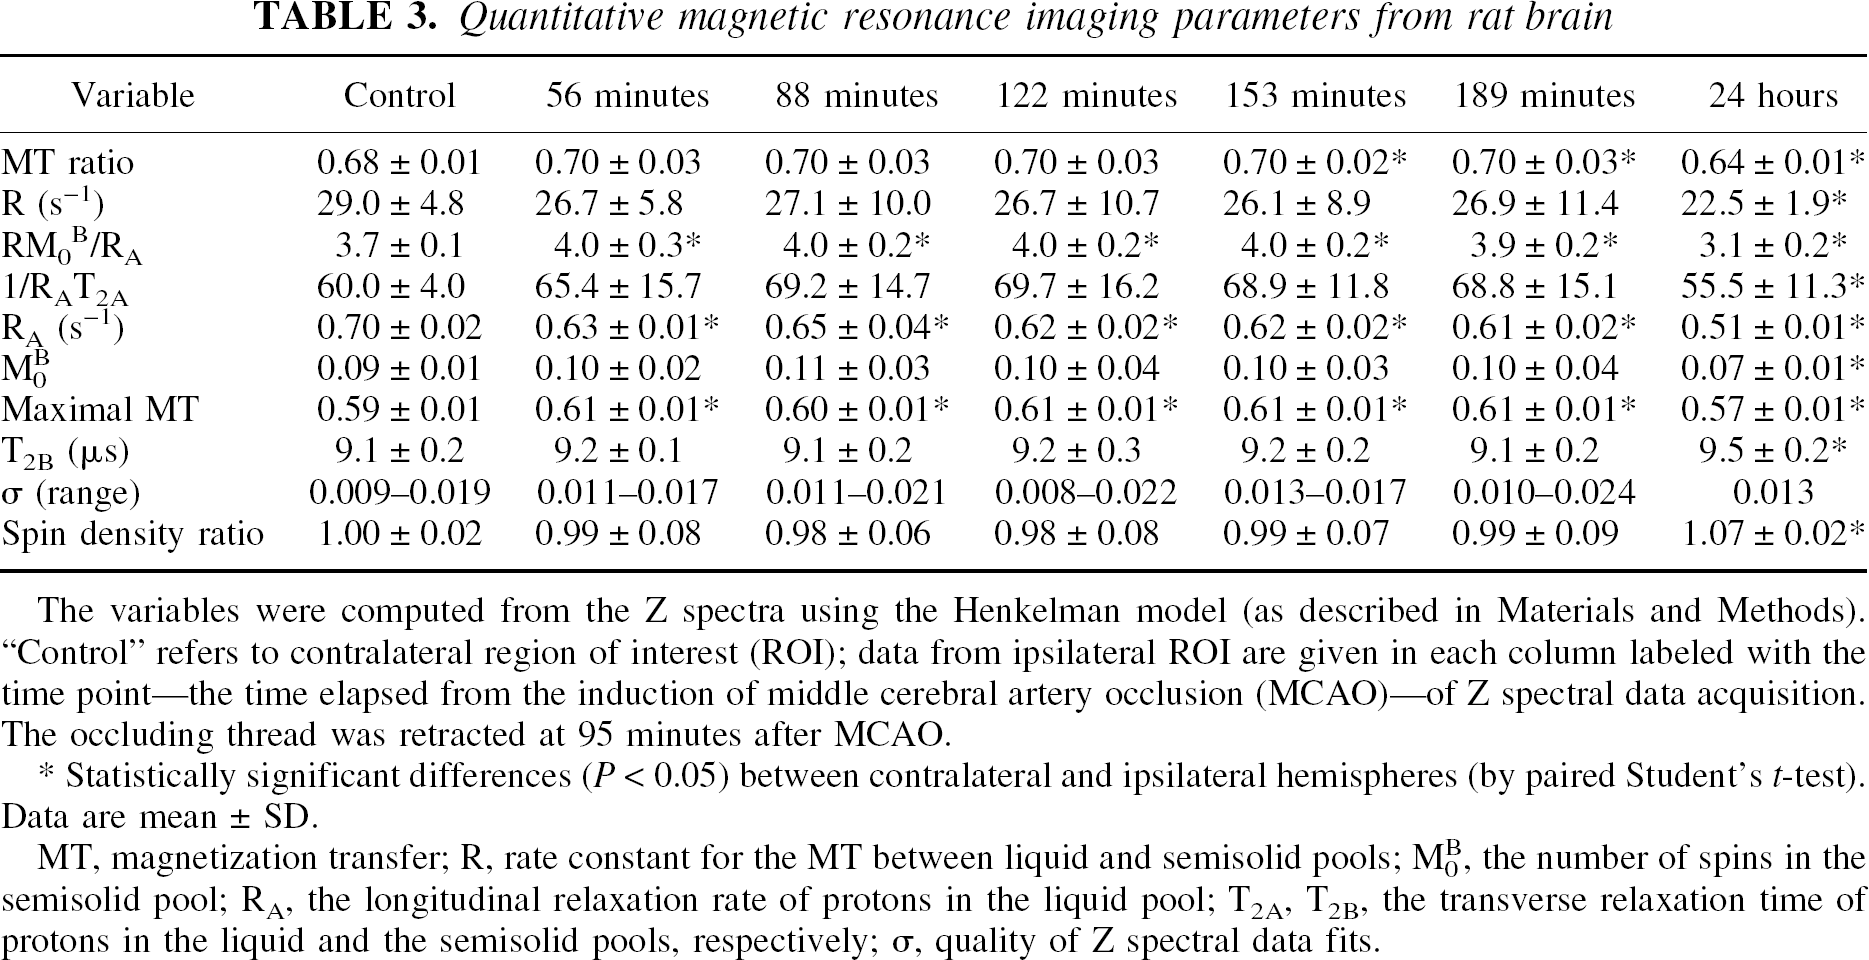
The variables were computed from the Z spectra using the Henkelman model (as described in Materials and Methods). “Control” refers to contralateral region of interest (ROI); data from ipsilateral ROI are given in each column labeled with the time point—the time elapsed from the induction of middle cerebral artery occlusion (MCAO)—of Z spectral data acquisition. The occluding thread was retracted at 95 minutes after MCAO.
Statistically significant differences (P < 0.05) between contralateral and ipsilateral hemispheres (by paired Student's t-test). Data are mean ± SD.
MT, magnetization transfer; R, rate constant for the MT between liquid and semisolid pools; M0B, the number of spins in the semisolid pool; RA, the longitudinal relaxation rate of protons in the liquid pool; T2A, T2B, the transverse relaxation time of protons in the liquid and the semisolid pools, respectively; σ, quality of Z spectral data fits.
Changes in magnetization transfer
As a simple estimate of contrast obtainable from MT experiments the MTR was computed (Table 3), and it showed an increasing trend during the early moments of ischemia followed by a substantial decrease 24 hours after the induction of MCAO. ksat computed using Eq. 3 was unchanged at the time points up to 3 hours after induction of MCAO; a decline of 30%, however, was evident at both offset frequencies at the 24-hour time point (Fig. 3C).
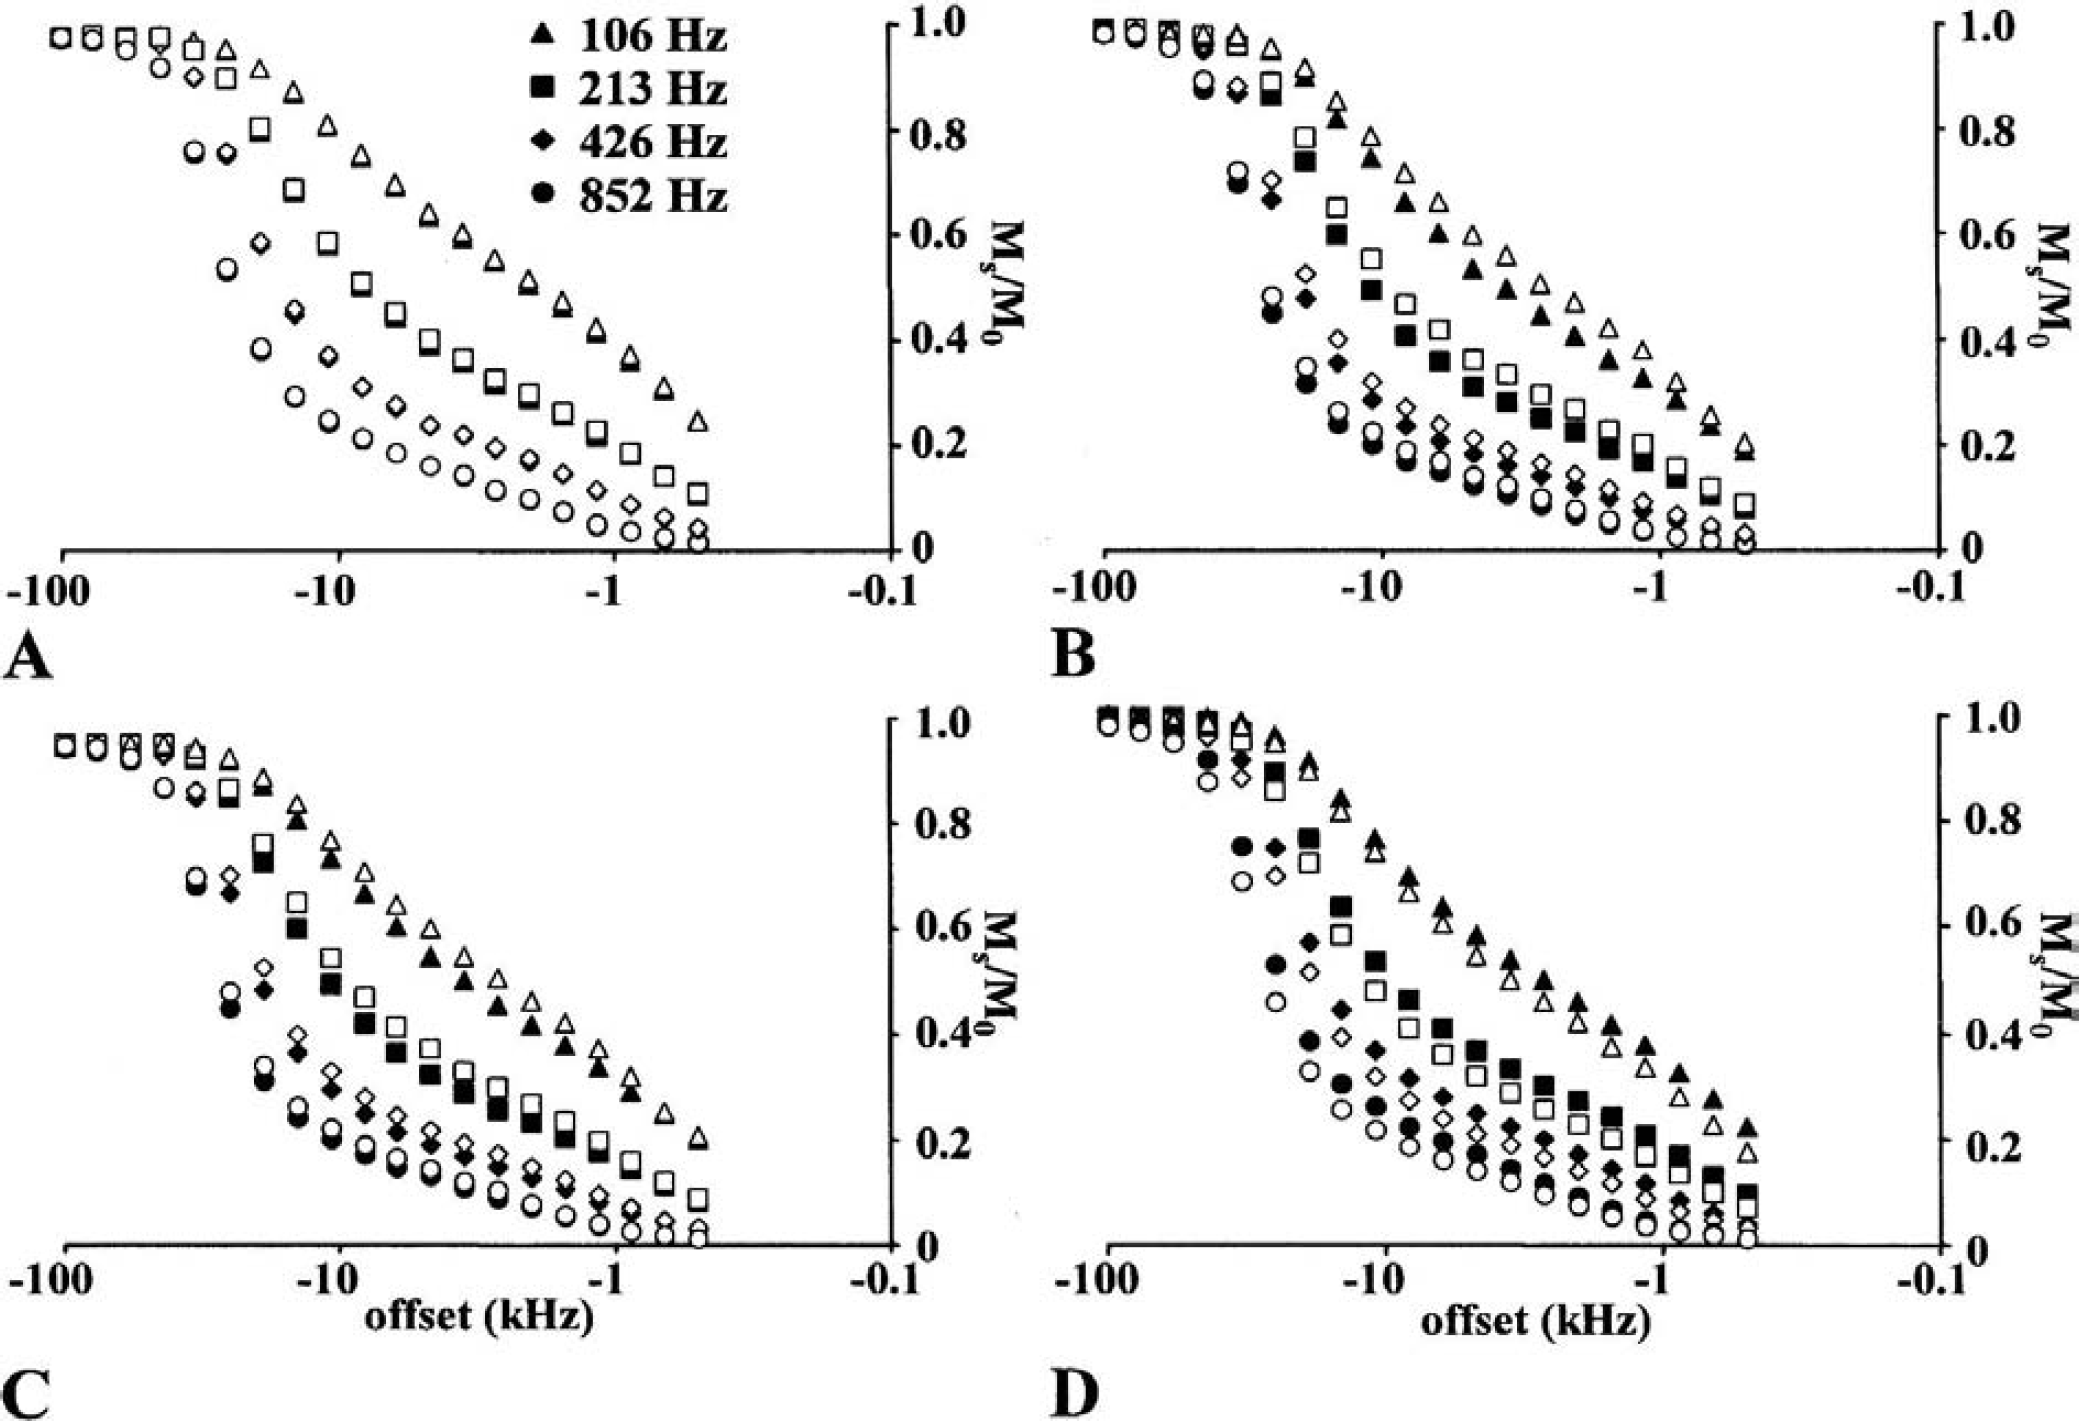
The negative-frequency part of typical Z spectra from rat brain are shown (Fig. 4). Under physiologic conditions the hemispheric Z spectra were identical (Fig. 4A) so that the interhemispheric difference spectra were virtually zero (Fig. 5A). In contrast, focal ischemia caused substantial time-dependent changes in the Z spectra. Both during MCAO (Fig. 4B) and 70 minutes after retraction of the occluder (Fig. 4C), greater saturation effects (i.e., smaller MS/M0) in the ipsilateral than contralateral side were evident, whereas the opposite was true 24 hours after the insult (Fig. 4D). The difference spectra (contralateral MS/M0 minus ipsilateral MS/M0) are shown to demonstrate the maximal offset and B2 frequencies at which ischemia affected the Z spectra (Figs. 5B to 5 D). It can be seen that at the early time points the difference was positive and greatest at low saturation fields (B2 of 106 and 213 Hz) close to the zero off-set (1 to 10 kHz) (Figs. 5B and 5C), whereas 24 hours after induction of MCAO the difference was negative, and it was spread more evenly over the B2 fields and offset frequencies (Fig. 5D).
Representative Z spectra from control rat
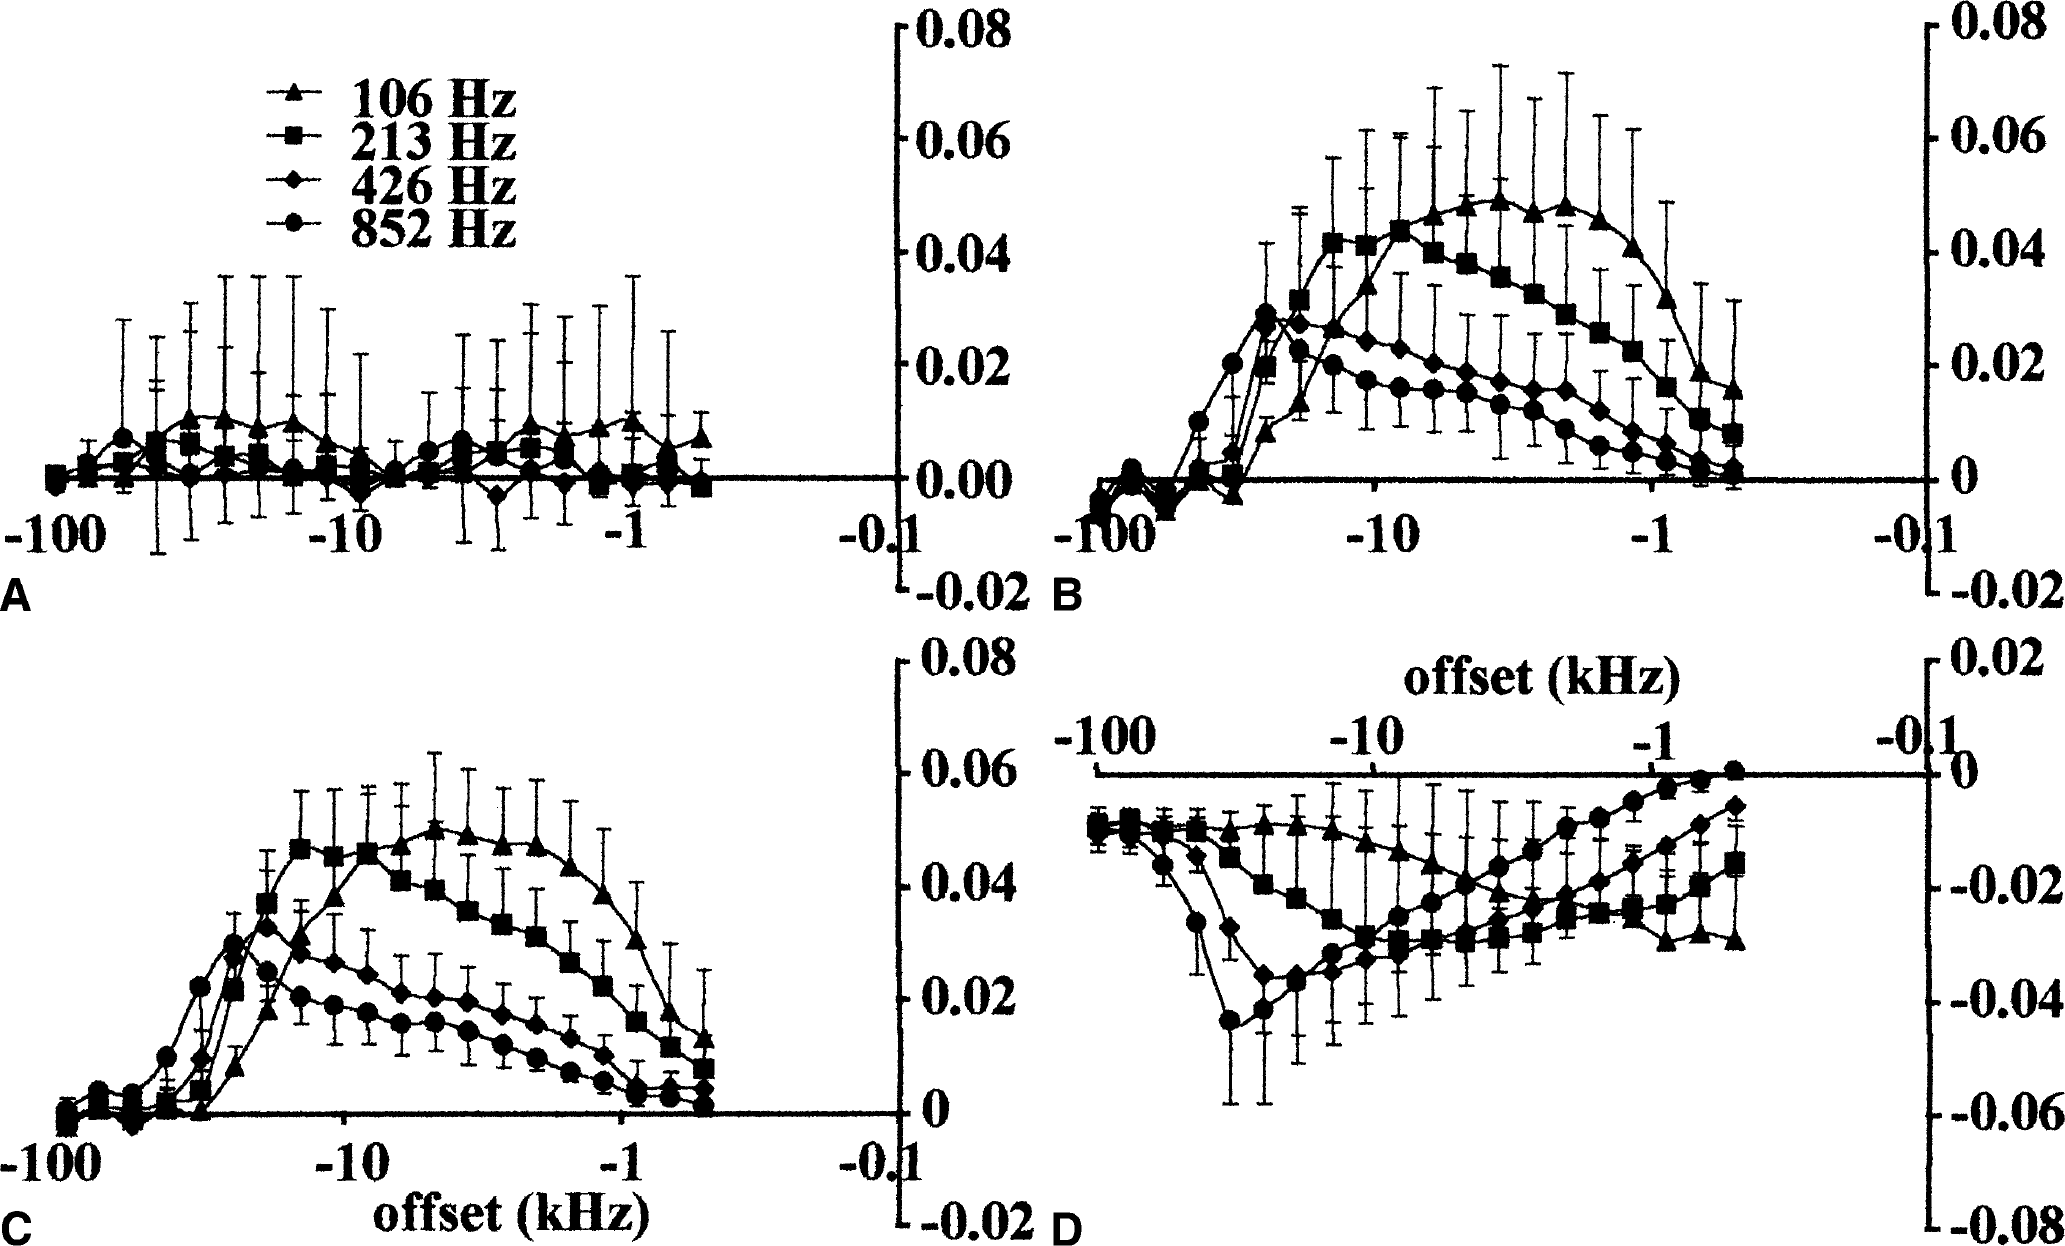
The difference Z spectra from control rats
The fitted variables describing the MT between the pools and the relaxation times of spins in the two-pool model indicated that R remained at the control level up to 3 hours after induction of MCAO. However, by 24 hours a decrease of 22% was evident (Table 3). Interestingly, RM0B/RA, a measure of the amount of MT, increased by 8% in the first five data points, followed by a decrease by 16% by 24 hours after MCAO. Similarly, 1/RAT2A initially showed an increasing trend, followed by a significant 8% drop below the control level one day after the induction of stroke (Table 3). Since RM0B/RA is influenced by the direct saturation effects and a change in this variable may not reflect the true MT change, we computed an estimate quantitatively indicating the contribution of direct saturation using the procedure described previously (Henkelman et al., 1993). In this procedure, the experimental MS/M0 is compared with that simulated for the condition where R = 0 for each B2 amplitude (Fig. 6A). The shaded area represents true MT and the maximal MT is defined as the maximum difference between the direct effect and experimental MS/M0. The maximal MT was detected at 10 kHz offset and with B2 of 426 Hz for control ROI (Figs. 6B and 6C). The maximal MTs were significantly higher in the ipsilateral than in the contralateral ROI at the early time points, but after 24 hours of induction of MCAO it had decreased below the contralateral value (Table 3). These data strongly argue for a true increase in the amount of MT in the early phase of ischemia before the decrease detected in irreversibly damaged tissue. Interestingly, T2B was insensitive to acute ischemia, but prolonged slightly by 24 hours (Table 3). RA showed a time-dependent decrease in the exposed tissue (cf., behavior of T1, Fig. 3A), whereas it was reduced only at the 24-hour time point (Table 3).
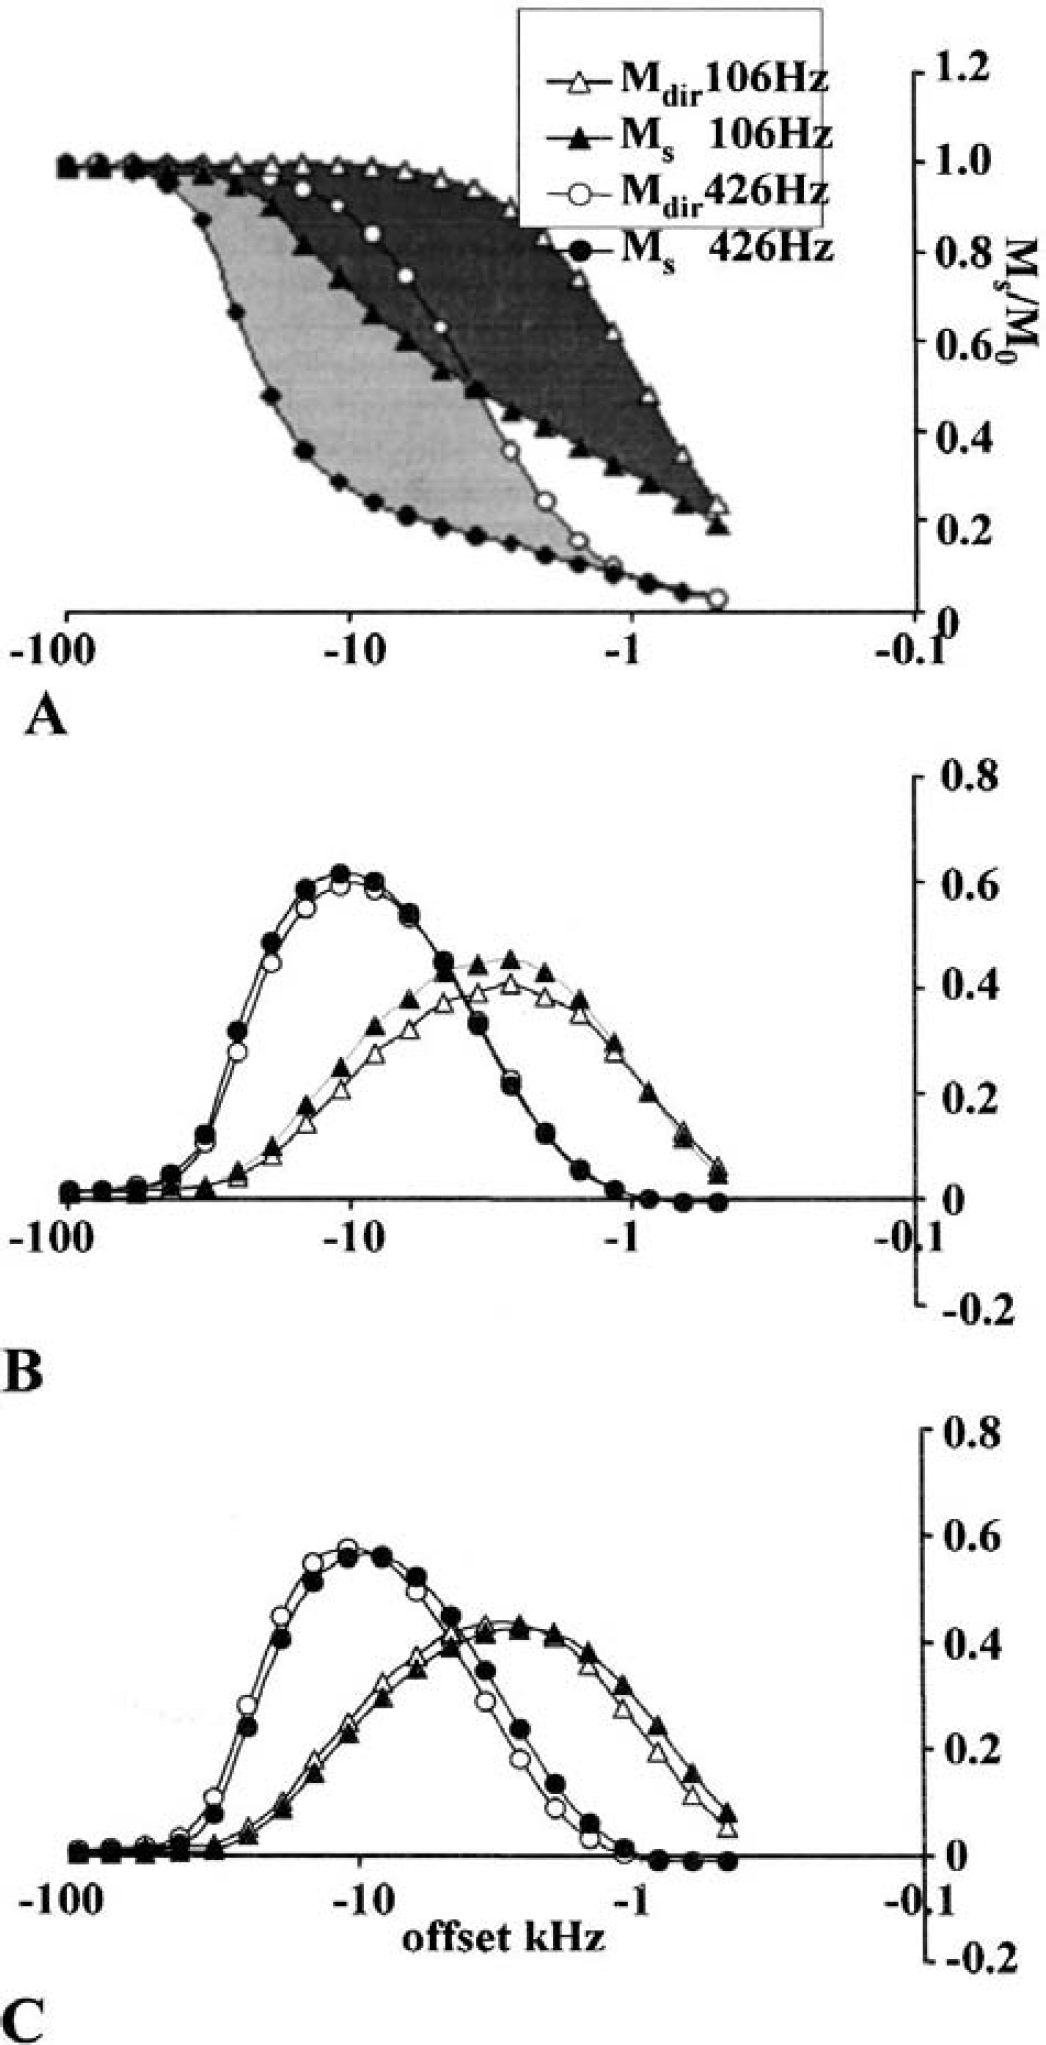
The direct saturation effect (Mdir) and measured saturation (MS) in the ipsilateral hemisphere obtained from a representative animal with B2 of 106 (△, ▲) and 426 ((○, ●) Hz 35 minutes after induction of middle cerebral artery occlusion (MCAO). The shaded area represents the true MT
DISCUSSION
Our data provide quantitative and comprehensive knowledge from the cerebral MR relaxation times and MT in the early phase of acute brain ischemia—to the best of our knowledge, for the first time—allowing for conclusions to be drawn with regard to the common mechanisms influencing these variables. Thus our results show that both the MRI relaxation times T1ρ and Z spectra undergo substantial alterations during the early moments of ischemia, despite the fact that the overall MT rate between the bulk water and the semisolid pool and the ksat remain unaffected. Thus our results strongly indicate that attention in MRI of acute stroke should be focused on MT acquired at certain frequencies rather than on R. It is very intriguing that maximal MT and amount of MT determined by 10 kHz off-resonance saturation increase much earlier than R or ksat and that Z spectra undergo major frequency-dependent changes during the evolution of ischemic damage. Furthermore, the absence of changes in R under these conditions argues in favor of distinct contributions of proton interactions on the water/macromolecule interface to conventional MT and T1ρ. As far as the chemical exchange mechanisms are concerned, it has been shown in phantoms that MT is affected both by molecule and proton exchange pathways (Kucharczyk et al., 1994; Mäkelä et al., 2001). However, within the tissue, MT has been shown to be mediated predominantly by the water molecule exchange pathway (Grad and Bryant, 1990; Eng et al., 1991; Henkelman et al., 2001). T1ρ relaxation is directly influenced by proton exchange, as shown by recent data from immobilized protein phantoms (Mäkelä et al., 2001). Thus there is experimental evidence pointing to differential sensitivities of MT rates and T1 to the physico–chemical changes taking place in the ischemic brain, and it may well be that the differential time courses of the two MR variables highlight their distinct values in imaging of acute ischemia.
The MT-based MR contrast has been previously exploited for imaging of acute cerebral ischemia. Ordidge et al. (1991) showed that ksat decreased one day after permanent MCAO in rats within the developing infarct expressing strong T2 hyperintensity and an increase in spin density. They proposed that reduced ksat resulted from the breakdown of cellular structures and an increase in free proton mobility. More recently, Ewing et al. (1999) using a permanent MCAO model reported that the ratio ksat in the nonischemic-to-ischemic tissue began to increase after two hours of ischemia. Interestingly, they observed that protein breakdown had a minimal contribution to the decrease in ksat in the evolving infarction; it was instead associated with the accumulation of water. The ratio of ksat in the ipsilateral and contralateral ROIs does not change in the present MCAO model during the first three hours of the insult (Fig. 3C), and neither does R (Table 3). It should be noted here that the evolution of ischemic damage in the aforementioned two distinct animal models might explain the differential time courses of ksat. Nevertheless, the overall MT rates show much slower kinetics than that of T1ρ in ischemic brain (Gröhn et al., 2000; Kettunen et al., 2001), and its kinetics is quite comparable to that reported for the development of T2 hyperintensity and water accumulation (Knight et al., 1994).
Even though R and ksat change relatively late during irreversible ischemia, a number of MT characteristics, such as RM0B/RA, 1/RAT2A, and maximal MT apparently change much earlier. It is evident from our results that the previously mentioned variables significantly differ between the time of irreversible ischemia (data from 24-hour time point) and the time points when the damage is evolving (Table 3). The key question to be addressed is the distinction between the true MT change from T1/T2 relaxation effect (i.e., direct saturation) as the underlying mechanism for the initial changes in the previously mentioned variables. The experimental evidence obtained here point to a genuine increase in the amount of MT. This conclusion is based on the analysis of the direct saturation effect (from maximal MT), abolishing the possibly altered recovery of longitudinal magnetization due to T1 effects, unequivocally demonstrating that our results are partially due to a true MT change (Fig. 6). This is very important, since both RA (Table 3) and tissue R1 (= 1/T1; Fig. 3A, Table 2) reduce early in MCAO. We estimate that about half of the observed increase in RM0B/RA is due to a T1 effect (Table 3), the other half representing the true MT.
It is well established that when the biochemical destructive processes have advanced to the stage of structural damage and eventually to loss of cells, net water accumulation is the key factor affecting MR relaxation, including T1ρ. Ewing et al. (1999) have concluded that reduced MT rate in the evolving infarction is also due to water gain, and only to a minor extent to degradation of macromolecules. Indeed, the spin density and T2 results show an increase in the damaged volume by 24 hours after MCAO that is of the same size as previously reported for rat MCAO (Ordidge et al., 1991). Thus our MRI observations concerning MT and T1ρ at the 24-hour time point (in the tissue expressing a clear and substantial cell loss; see Gröhn et al., 1999) can be ascribed to water accumulation. Furthermore, the changes 24 hours after MCAO in the characteristics of semisolid pool point to a reduced contribution from the semisolid protons (reduced M0B) and slightly altered mobility (prolonged T2B).
The physico–chemical and cellular mechanisms evoking the early changes in the amount of MT, T1, and T1ρ are apparently independent of water accumulation. This claim is supported by direct measurement of tissue water (Schwab et al., 1997) or the degree of edema by microgravimetry (Bell et al., 1985) after permanent MCAO. Bell et al. (1985) show that 30 minutes of MCAO does not induce edema in the ischemic tissue (flow <20 mL 100 g−1 min−1), but edema develops after 100 minutes without reperfusion or within 60 minutes of reperfusion. In this instance it should be noted that T1 has unavoidable sensitivity to flow (Kim, 1995), even though in the present experiments the flow sensitivity is minimized by the use of a large volume coil and nonselective inversion pulses. Furthermore, the variables derived from Z spectra are virtually flow-insensitive, yet the obtained RA and R1 figures are identical. Previous MRI evidence shows that the extent of proteolysis, starting minutes after induction of ischemia (Pettigrew et al., 1996), would be too small to cause large enough mobility changes in the semisolid pool to affect the rate of MT or relaxation times (Ewing et al., 1999). An inevitable time-dependent breakdown of macromolecules will expose proton exchange sites (for bulk water) resulting in conditions favorable for proton exchange. The pH of approximately 6.5 in the focal ischemia is predicted to inhibit proton exchange at amide and –NH protons, but it will not influence molecular exchange. An additional MR physical expression of ischemia is the severe impairment of diffusion. Therefore, the physico–chemical conditions may affect water exchange with macromolecules.
The magnitudes of both MT and T1ρ changes determined in the early phase of cerebral ischemia are rather small, typically a few percent, thus requiring high signal-to-noise ratio MR data. Signal-to-noise ratios in the data sets used for computations of T1ρ were greater than 33, allowing for accurate determination of the relaxation time. The T1ρ figures reported here are in good agreement with those previously reported for normal and ischemic rat brain using similar spin-lock amplitudes (Gröhn et al., 1998, 2000; Kettunen et al., 2001). With regard to the MT variables, ksat, determined by us at 4.7 T with an offset of 6.151 kHz in rat brain (0.9 s−1), agrees reasonably well with those reported at 7 T (1.25 s−1) with similar pulsing conditions (Ewing et al., 1999) and at 2 T (1.25 s−1) with an offset of 10 kHz (Ordidge et al., 1991). The variables derived from Z spectra are evidently dependent on the line shape used for the fitting procedure (Morrison and Henkelman, 1995; Quesson et al. 1997). Using the super-Lorenzian function, one can discern a remarkable agreement in T2B values with the present data and those reported for rat brain in vivo (Quesson et al., 1997) and human brain ex vivo (Morrison and Henkelman, 1995). The present figures for maximal MT are also consistent with those reported for rat brain at 4.7 T; however, the values published by Quesson et al. (1997) for both RM0B/RA and R were smaller, whereas those for 1/RAT2A were larger than the values shown in Table 3. The pulsing conditions used by Quesson et al. differ substantially from those used here; the duration of their saturation pulse, for instance, was only 2.4 seconds and the offset range only 500 to 20,000 Hz in front of a spin-echo MRI sequence. These factors are likely to affect the absolute values of MT variables, though they are not anticipated to influence the ability to quantify changes occurring in these variables.
The present methods for MT and T1ρ MRI are applicable only for experimental stroke studies for the assessment of ischemia due to high radio-frequency (RF) exposure, that is, the specific absorption rate (SAR) of energy. We have previously directly determined the temperature by MR means in normal and ischemic tissue immediately after T1ρ MRI, yielding peak SAR of 93 W/kg (Gröhn et al., 2000). The absence of a temperature change suggests that even in the ischemic tissue, the heating effect of such an RF deposit is negligible. We compute that in the present experiments the maximal SAR was 48 and 35 W/kg in T1 MRI (B1 = 1 G) and Z spectral (B2 = 0.2 G) data acquisition, respectively. Since the SAR scale approximately up with the second power of both B0 and B1 and reliable spin-lock condition under similar experimental conditions is achieved with B1 greater than 0.16 G (Gröhn et al., 2000), T1ρ is expected to be a feasible MRI contrast at commonly used clinical field strengths. Indeed, T1ρ MRI has been acquired from human brain at 1.5 T (Sammet et al., 2000). Furthermore, technical means are available to reduce the RF deposit of both MT and T1ρ MRI, such as pulsed saturation instead of a continuous RF field.
To conclude, in the acute phase of ischemia increases in the maximal MT and amount MT as well as in the T1ρ relaxation time are observed, yet the overall MT rate in the brain tissue remains unaffected. These data suggest differential sensitivities of MT and T1ρ MRI to the interaction of protons at the water-to-macromolecule interface. In the consolidating infarction, water accumulation is associated with substantial reduction of the MT rate and amount as well as an extensive prolongation of the T1ρ relaxation time. Thus, the present data clearly show that both MRI contrasts used here provide novel information for tissue status assignment in acute and sub-acute stroke.
Footnotes
Acknowledgments:
The authors thank Dr. G. J. Stanisz, of the University of Toronto, for the helpful discussions concerning the Z spectral data analysis; and Ms. Niina Kuhmonen, for her expert technical assistance.