
Abstract
We sought to identify magnetic resonance imaging (MRI) parameters that can identify as well as predict disruption of the blood–brain barrier (BBB) after embolic stroke in the rat. Rats subjected to embolic stroke with (n=13) and without (n=13) rt-PA treatment were followed with MRI using quantitative permeability-related parameters, consisting of: transfer constant (K i ) of Gd- DTPA, the distribution volume (Vp) of the mobile protons, and the inverse of the apparent forward transfer rate for magnetization transfer (kinv), as well as the apparent diffusion coefficient of water (ADCw), T2, and cerebral cerebral blood flow (CBF). Tissue progressing to fibrin leakage resulting from BBB disruption and adjacent tissue were then analyzed to identify MRI markers that characterize BBB disruption. Animals were killed after final MRI measurements at 24 h after induction of embolic stroke and cerebral tissues were perfused and stained to detect fibrin leakage. K i , Vp, and kinv were the most sensitive early (2 to 3 h) indices of the cerebral tissue that progresses to fibrin leakage. Cerebral blood flow was not significantly different between ischemic tissue with a compromised and an intact BBB. Our data indicate that compromise of the BBB can be sensitively predicted using a select set of MR parameters.
Keywords
Introduction
Hemorrhagic transformation (HT) of an ischemic brain occurs in up to 70% of stroke patients (Lodder et al, 1986). Interest in ways to identify and predict HT after ischemic stroke has been heightened by the introduction of reperfusion strategies designed to remove the occluding clot and reestablish cerebral blood flow (CBF). Reperfusion strategies with thrombolytic agents, such as rt-PA, effective in improving functional outcome after ischemic stroke, increase the risk of HT, which can be fatal (Furlan et al, 1999; NINDS, 1995; Pessin et al, 1991). To our knowledge, there are no systematic studies on ways to predict, identify, and characterize HT after stroke.
Currently, the diagnosis of hemorrhage is the domain of computed tomography (CT) rather than magnetic resonance imaging (MRI), especially in acute stroke (Higashida and Furlan, 2003; Higer et al, 1989; Jansen et al, 1998). However, diagnosis of symptomatic hemorrhage using CT is only 57% efficient (NINDS, 1997), and while CT can diagnose hemorrhage once it has occurred, it cannot predict hemorrhage unless high-dose contrast-enhanced CT is used (Hayman et al, 1981; Schulte-Altedorneburg et al, 1996). Magnetic resonance imaging, however, has demonstrated excellent predictive ability for hemorrhage (Jiang et al, 2002). The ability of MRI to sensitively detect and predict hemorrhage using a contrast agent and magnetization transfer MRI may be related to early endothelial damage leading to increased permeability to small molecules (i.e., Gd-DTPA contrast agent or small proteins) across the blood–brain barrier (BBB) (Jiang et al, 2002). However, our previous study using a contrast agent only provides indirect, parameter-dependent information of permeability increases because of BBB damage. Also, the areas with BBB damaged detected in MRI was much large than hemorrhage itself because of the smaller size of MRI contrast agent (Jiang et al, 2002). Subsequently, we developed quantitative permeability-related MRI measurements (Ewing et al, 2003) to evaluate BBB damage after embolic stroke in rat using intrinsic parameters. In the present study, we therefore evaluated permeability-related parameters of vascular integrity after embolic stroke in rat using MRI and fibrin staining, a marker of BBB damage and a component of hemorrhage with smaller size than with red blood cells. In addition, other MRI parameters, the inverse of the apparent forward transfer rate for magnetization transfer (kinv), ADCw, T2, and CBF, were also measured to characterize BBB damage after embolic stroke.
Materials and methods
All experimental procedures have been approved by the Institutional Animal Care and Use Committee of Henry Ford Hospital.
Animal Model and Experimental Groups
The method to induce embolic stroke and rt- PA treatment in this study has been previously described (Jiang et al, 1998; Zhang et al, 1997). Briefly, an aged white clot (prepared 24 h before ischemia) was slowly injected into the internal carotid artery to block the middle cerebral artery (MCA) (Zhang et al, 1997). This model of embolic stroke provides a relatively reproducible infarct volume localized to the territory supplied by MCA (Jiang et al, 1998; Zhang et al, 1997). The male Wistar rats (300 to 450 g) were randomly divided into two groups: the control group (n=13) received embolization without treatment and the treated group (n=13) received rt- PA 4 h after embolization.
Magnetic Resonance Imaging Measurements
Magnetic resonance imaging measurements were performed using a 7 T, 20 cm bore superconducting magnet (Magnex Scientific, Abingdon, UK) interfaced to an SMIS console (Surrey, UK). A 12 cm bore actively shielded gradient coil set, capable of producing magnetic field gradients up to 20 g/cm and a birdcage RF coil were used. Stereotaxic ear bars were used to minimize movement during the imaging procedure. During MRI measurements, anesthesia was maintained using a gas mixture of N2O (69%), O2 (30%), and halothane (0.75% to 1%). Rectal temperature was kept at 37°C±0.5°C using a feedback controlled water bath. A modified fast low angle shot (FLASH) (Haase et al, 1986) imaging sequence was employed for reproducible positioning of the animal in the magnet at each MRI session (Jiang et al, 1993). Permeability related parameters, transfer constant (K i ) of Gd-DTPA, the distribution volume of the mobile protons (Vp), the inverse of the apparent forward transfer rate for magnetization transfer (kinv), ADCw, T2, and CBF, were performed repeatedly for 4 to 5 h after onset of embolization, and at 24 h after onset of embolization. Measurements of kinv, ADCw, T2, and CBF were also performed before embolization.
Look–Locker T1 Measurements
An imaging variant of the Look–Locker (L–L) technique (Look and Locker, 1970) using the T-One by Multiple Read-Out Pulses (TOMROP) (Brix et al, 1990) sequence was used for a pixel-by-pixel estimate of T1. An initial inversion of magnetization, followed by a set of small-tip-angle gradient-echo readouts and a waiting period for the magnetization to recover toward equilibrium, results in a set of images that approached a steady-state magnetization with a time constant, T1*. Interleaved slices were acquired using a numerically optimized RF pulse (Matson, 1994). Inversion was accomplished using a nonselective hyperbolic secant adiabatic pulse of 12 ms duration. One phase-encoded line of 24 small-tip-angle gradient-echo images (TE 4 ms) was acquired at 50 ms intervals after each such adiabatic inversion for a total recovery time of 1200 ms with a 3 secs relaxation interval between each inversion. Matrix size was 128 × 64, field of view (FOV) 32 mm, and data from five 2 mm thick slices were obtained. With this sequence, sets of R1 (1/T1) maps can be obtained at 3-min intervals.
Measurement of Permeability-Related Parameters (K i and Vp)
To measure permeability-related parameters, five slice L–L was used to acquire dynamic R1 maps. After one R1 map is acquired, a bolus of 0.2 mmoL/kg Gd-DTPA was manually injected after a 0.4 mL saline flush. Twelve R1 maps were then acquired. Under the assumption that a change in R1 is linearly proportional to a change in both vascular and tissue concentration of contrast agent, and assuming that the constant of proportionality is the same for tissue and blood (Ewing et al, 2003), time-dependent changes in R1 were used to form a map of K i and Vp using Patlak matrix analysis of compartmental dynamics (Patlak and Blasberg, 1985; Patlak et al, 1983). The relation between tissue and plasma concentrations of indicator is described in the following equation (Ewing et al, 2003):
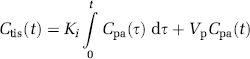
where K i is the blood-to-brain transfer constant, Ctis(t) is the tissue concentration of MR contrast agent as a function of time (mL/g), Cpa(τ) is the plasma concentration of MR contrast agent as a function of time (mol-mL/mL), and K i is the transfer constant of the ‘final,’ irreversibly-filling compartment. Estimates of Ctis(t) and Cpa(t) are made via changes in the R1 values of cerebral tissue and sagittal sinus blood. Vp is the ‘distribution space,’ which includes the entire volume of the rapidly filling subcompartments. One advantage of this approach is that the transfer constant (K i ) can be obtained from a graphical analysis of tissue and arterial concentrations. The plot is constructed with an ordinate C(t)/Cpa(t), and an abscissa of following equation:
This abscissa is referred to as ‘stretch time’. If there is a compartment into which some the indicator leaks irreversibly, the Patlak plot was a straight line. Its y-intercept is Vp, and its slope is the unidirectional K i of indicator between the two compartments (Ewing et al, 2003).
Measurement of MT Related Parameters (kfa and kinv)
A calculation of apparent forward transfer rate of magnetization (kfa) requires an estimate of T1sat, that is, T1 in the presence of an off-resonance irradiation of the macromolecules of the brain. For efficient T1 measurements, we used a variant of the TOMROP (Brix et al, 1990) pulse sequence with an increment of the initial phase step throughout each image acquisition. We have named this (single-slice) method PIPS (phase incremented progressive saturation) (Ewing et al, 1999). Sixty-four images (matrix 128 × 64, FOV 32 mm, slice thickness 2 mm) were taken using an RF-spoiled gradient echo sequence with TE/TR=7/40 ms, tip angle, θ, approximately 18°. The interval between each of the 64 images was 4.5 secs. Total imaging time for the acquisition of 64 images was approximately 9.6 mins.
Phase incremented progressive saturation was run in sets of two, with and without off-resonance CW power, providing for the estimate of Msat, T1sat, M0, and T1 (Ewing et al, 1999). The kfa was calculated from the following (Ewing et al, 1999):
For visual convenience, kinv=1/kfa was used in this study, so that areas of low kfa were displayed as bright areas in kinv maps.
Measurement of Trace ADCw
Trace ADCw was measured using the Stejskal-Tanner sequence with three b-values (10, 800, and 1800 secs/mm2) in each of three diffusion sensitizing directions, seven slices, 2 mm slice thickness, 32 mm FOV, 128 × 64 matrix, TR=1.5 secs; TE=40 ms. Each image required a scan time of 4.8 mins for completion. The total time for the entire sequence was approximately 14.4 mins.
Measurement of T2
T2 was measured using standard two-dimensional Fourier transform (2DFT) multislice (seven slice) multiecho (four echo) MRI. A series of four sets of images (7 slices for each set) were obtained using TEs of 30, 60, 90, and 120 ms and a TR of 3 secs. Images were produced using a 32 mm FOV, 2 mm slice thickness, 128 × 64 image matrix. The total time for the entire sequence was approximately 3.2 mins.
Measurement of Cerebral Blood Flow
Perfusion measurements were performed before each diffusion measurement using a technique described by Williams et al (1992). This method of CBF measurement is based on the selective inversion of blood water protons at the level of the carotid arteries before 1H MRI measurement in the brain. Two images were obtained for perfusion measurement with parameters: TR=1 sec, TE=30 m, 64 × 64 image matrix, 2 mm slice thickness, and a 32 mm FOV. In each animal, PWI was measured within a coronal section. The duration of the inversion pulse was 1 sec at a B1 amplitude of 0.3 kHz.
Tissue Preparation
Rats were transcardially perfused with heparinized saline and brains were rapidly removed after final MRI measurements 24 h after embolic stroke. The brains were embedded in Tissue-Tek OCT compound (Miles, Elkhart, IN, USA), frozen in 2- methylbutane (Fisher Scientific, Itasca, IL, USA), and cooled on dry ice. Coronal brain sections (8 μm thick) were cut on a cryostat, and thaw-mounted onto gelatin-coated slides. Fourteen 8 μm thick frozen coronal section from each of 1 mm thick sections were used for immunohistochemical staining.
Immunohistochemistry
For detecting parenchymal fibrin deposition, immunostaining was performed on frozen coronal sections (8 μm thickness), as previously described (Zhang et al, 1999b). A goat anti-mouse fibrinogen/fibrin antibody was used at a titer of 1:1000 to assess the deposition of fibrin in the brain (Accurate Chemical & Scientific, Westbury, NY, USA). Although this antibody detects both fibrin and fibrinogen in the rat, the titer of the antibody used in the present study primarily reacts with fibrin (Kitching et al, 1997; Ploplis et al, 1995).
Data Analysis
Magnetic resonance imaging measurements were analyzed in areas with fibrin leakage, in cerebral ischemic tissue adjacent to the tissue with fibrin leakage, and in homologous tissues in the contralateral hemisphere. Two different regions of interest (ROIs) were selected for analysis of MRI parameters. The first ROI was chosen in the area with fibrin leakage, as determined from histological sections. Regions of interest that anatomically matched areas with fibrin leakage were identified on the histological sections and were outlined on T2 maps obtained 24 h after embolization. The ischemic damaged region was identified by using the threshold T2 value of mean +2 standard deviations from T2 value measured in the contralateral hemisphere. The second ROI was identified by subtracting areas with fibrin leakage from the area of ischemia in T2 maps. Homologous ROIs to the fibrin leakage tissue and tissue adjacent to fibrin leakage tissue were also measured in the contralateral hemisphere.
Statistics
Observations are presented as mean±standard errors. Measurements of K i , Vp, kinv, T2, ADCw, and CBF were performed on ischemic and fibrin leakage ROIs. The relative changes of MR measurements in ischemic ROI (ischemia/preischemia) and fibrin leakage ROI (fibrin/preischemia) were calculated except K i and Vp, which were not performed preischemia. The effects of treatment and region were compared between rt-PA and control animals, and between ischemic and fibrin leakage ROIs, as well as, between ischemic and fibrin leakage homologous contralateral tissue. Magnetic resonance imaging measures in the contralateral region between ischemic and fibrin leakage ROIs were equivalent with no differences detected; therefore, the analysis of region or treatment effect were not adjusted for their contralateral regions. A paired t-test was used for all regional comparisons, with a significance level of 0.05.
The effect of rt-PA on MRI measurements after treatment was tested using a two sample t-test between the groups. There was no rt-PA effect on MRI measurements between ischemic and fibrin leakage regions observed at all time points after treatment, except for a difference on K i at 24 h (P=0.07). Therefore, except for K i at 24 h, data were combined between rt-PA treated and the nontreated groups for statistical analysis.
Results
Permeability-Related Measurements
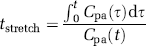
The temporal evolution changes of K i for a representative 4 h rt-PA-treated animal are shown in Figure 1. The K i maps (Figure 1A) reveal an increase in K i in the ventral and middle region of ipsilateral hemisphere. The regions with K i increase are clearly distinguished from the surrounding area, even at early time points (2 and 5 h) after embolization. Figure 1B shows temporal profiles of K i from the ROIs of ischemic tissue with fibrin leakage and adjacent ischemic tissue without fibrin leakage after embolization. The mean values of K i in the contralateral hemisphere were 2.0 × 10⁻⁵ mL/g-min at 2 h during ischemia. The increases in K i in the fibrin leakage ROI were significantly higher (P=0.04 at 2 h, P=0.025 at 5 h after embolization) than in the adjacent nonfibrin leakage ROI after embolization. There was a treatment by region interaction on K i (P=0.07) 24 h after ischemia, which indicates that K i is significantly increased (P=0.007) in the fibrin leakage ROI compared with the ischemic ROI in the nontreated group; however, there was only marginal K i increases between the two regions when rats were treated with t- PA (P=0.06). A statistically significant difference was also detected between the fibrin leakage ROI and its contralateral ROI (P<0.02 from 2 to 24 h after embolization).
(
However, there was no significant difference between the ROIs of ischemic tissue without fibrin leakage and its contralateral ROI. Furthermore, the difference in K i between areas with fibrin leakage and the remaining ischemic areas continuously increased up to 24 h after onset of ischemia.
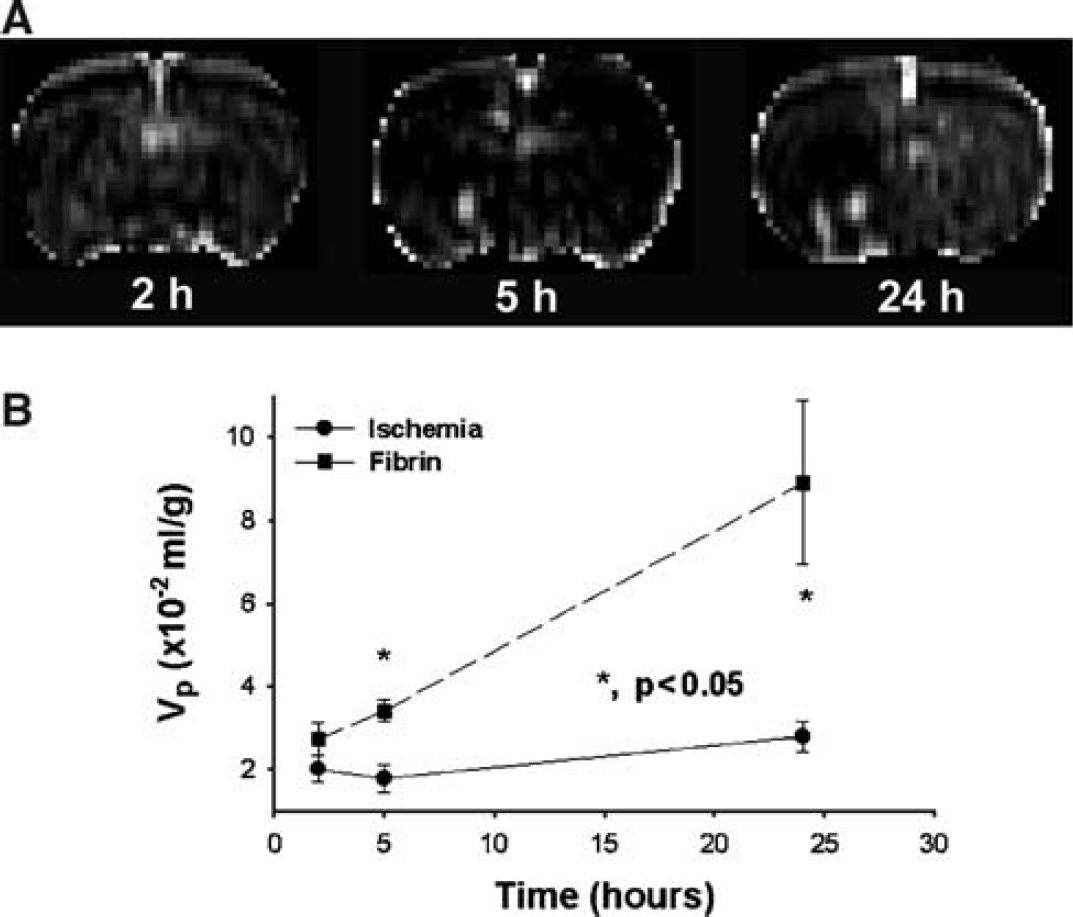
Figure 2 shows the temporal evolution of changes of Vp from a representative 4 h rt-PA treated animal (from the same animals shown in Figure 1). The Vp maps (Figure 2A) reveal an increase in Vp in the ventral and middle region of ipsilateral hemisphere. The regions with Vp increase are clearly distinguished from the surrounding area even at early time points (5 h) after embolization, although the regions with Vp increase are smaller than the regions with elevated K i . Vp exhibited similar temporal profiles as K i after ischemic damage. Figure 2B shows temporal profiles of Vp after embolization from the ROIs of ischemic tissue with fibrin leakage and adjacent ischemic tissue without fibrin leakage. The mean values of Vp in the contralateral hemisphere were 2.4 × 10⁻² mL/g at 2 h of ischemia. The increases in Vp in the fibrin leakage ROI were significantly higher (P=0.025 at 5 h, and P=0.019 at 24 h after embolization) than that in the adjacent non fibrin leakage ROI after embolization. A statistically significant difference was also detected between the fibrin leakage ROI and its contralateral ROI (P<0.047 from 2 h and 24 h after embolization). Similar to the changes of K i , the difference in Vp between areas with fibrin leakage and the remaining ischemic areas continuously increased up to 24 h after onset of ischemia.
(
kinv Measurements
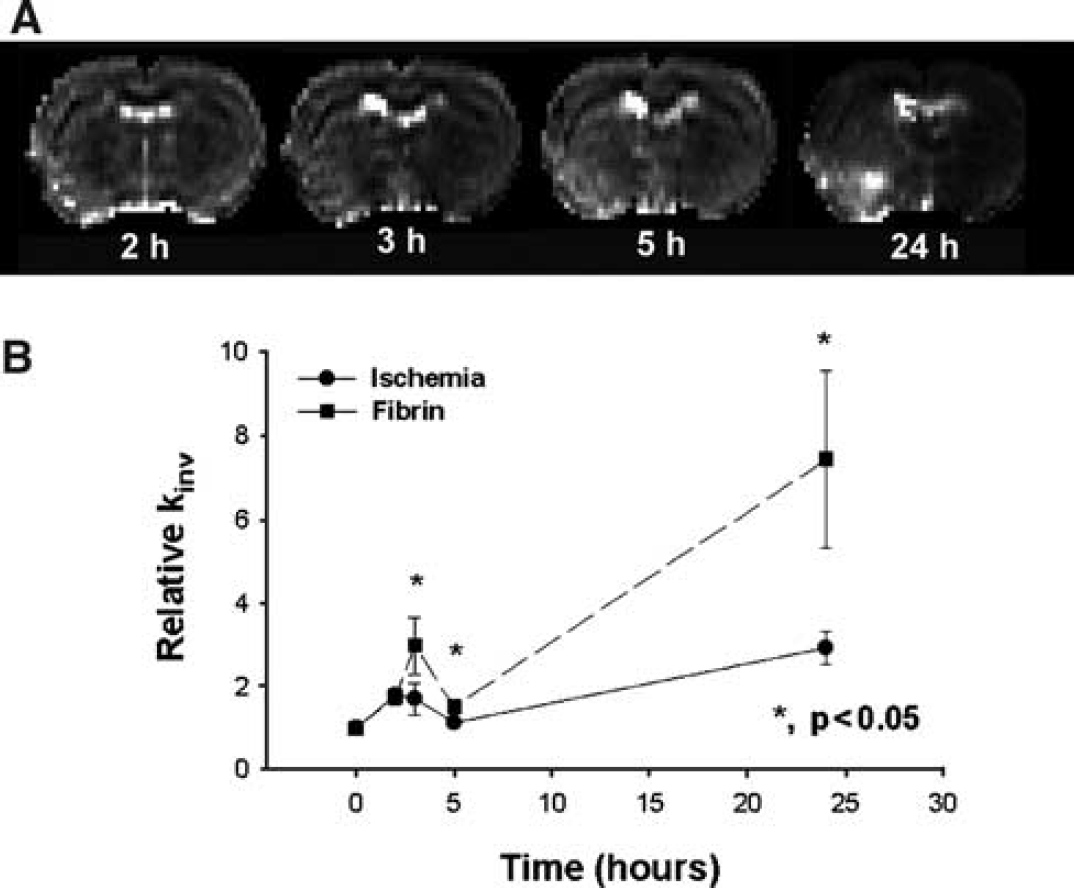
Figure 3 presents the temporal evolution of kinv obtained at various times from 2 h to 24 h after onset of embolic stroke from the same rat in Figure 1. Magnetic resonance imaging MT measurements reveal a small increase in kinv in the area encompassing the territory supplied by the MCA adjacent to tissue with hemorrhage (Figure 3A). A much larger increase in kinv was detected in the ventral and middle region of ipsilateral hemisphere where fibrin leakage was confirmed by histology. Figure 3B shows the temporal profiles of relative kinv for the ischemic tissue with and without fibrin leakage (the same ROI as that in Figure 1B). After embolization, the relative kinv values increased from preischemic values in both fibrin leakage and ischemic ROIs and maximized at 24 h after embolization. Higher mean relative kinv values were present from 3 to 24 h after embolization in the fibrin leakage ROI compared with the ischemic ROI. Statistically significant differences were detected in relative kinv values between the ROIs at 3 h (P=0.012), 5 h (P=0.012), and 24 h (P=0.027). A significant increase in kinv was also detected between the fibrin leakage ROI and its contralateral ROI (P≤0.01 from 3 to 24 h after embolization) as well as in the ROIs of ischemic tissue without fibrin leakage and its homologous contralateral ROI (P=0.028 at 5 h, and P=0.001 at 24 h after embolization).
(
T2 Measurements
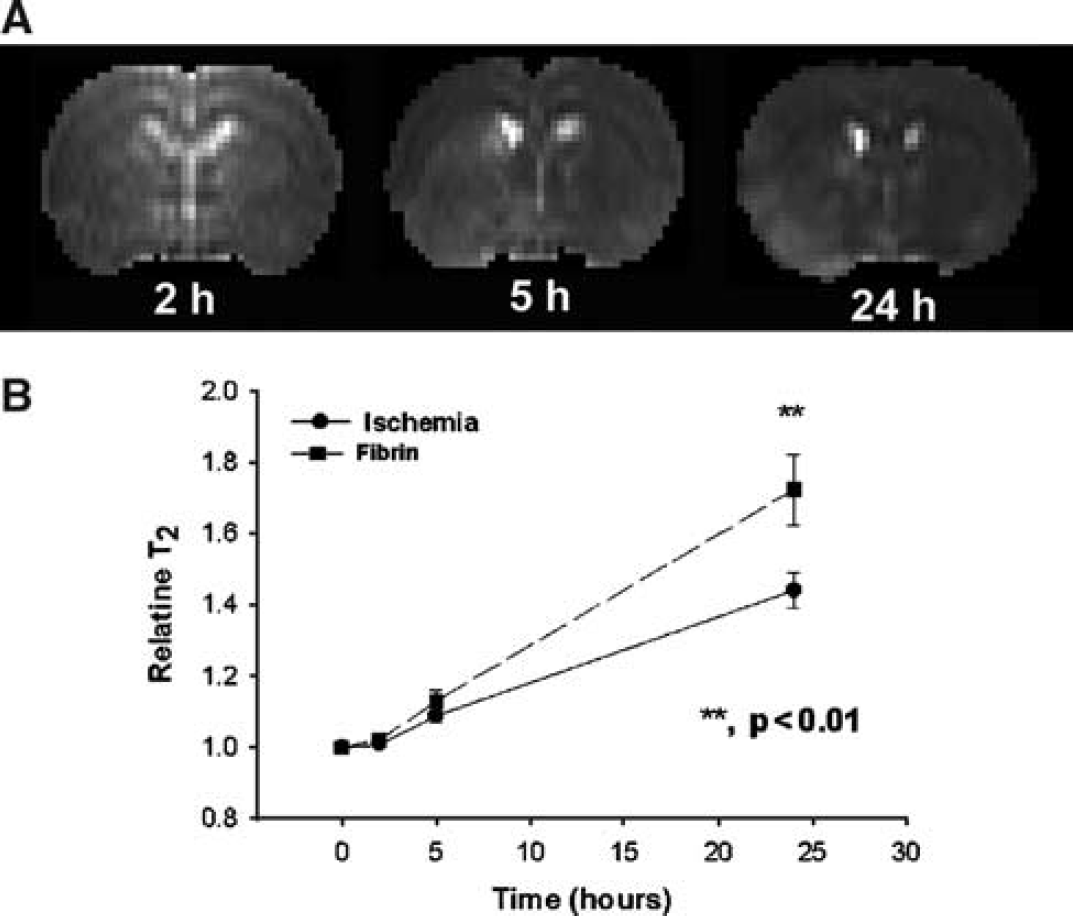
Figure 4 presents the temporal evolution of T2 obtained at various times from 2 to 24 h after injection of the embolus from the same rat in Figure 1. Magnetic resonance imaging T2 measurements reveal a slow increase in T2 after embolization in the area encompassing the territory supplied by the MCA (Figure 4A). The ventral and middle region of the ipsilateral hemisphere has a larger increase in T2 than in the remaining ischemic region, maximizing at 24 h after embolization. Compared with the K i , Vp, and kinv maps, however, the contrast in T2 maps between the ventral and middle region and the remaining ischemic region was lower, and the contrast increased in the T2 maps at a rate slower than that in the kinv maps. Compared with the hyperintense region in the K i , Vp, and kinv maps, the corresponding T2 maps showed a larger nonspecific region of hyperintensity, obscuring identification of BBB disruption. Figure 4B shows the temporal profiles of relative T2 for the ischemic tissue with and without fibrin leakage after embolization. After embolization, the relative T2 values slowly increased from preischemic values in both fibrin leakage and ischemic ROIs and maximized at 24 h after embolization. Higher mean T2 values were present from 5 to 24 h after embolization in the fibrin leakage ROI compared with the ischemic ROI. Marginal or significant differences were detected in relative T2 values between the fibrin leakage and ischemic ROIs at 5 h (P=0.055) and 24 h (P=0.004). A significant increase in relative T2 was also detected between the fibrin leakage ROI and its contralateral ROI (P<0.001 from 5 to 24 h after embolization) as well as between the ROIs of ischemic tissue without fibrin leakage and their homologous contralateral ROIs (P≤0.012 from 5 to 24 h after embolization). Compared with T2 measurements, K i , Vp, and kinv exhibited larger and earlier differences between fibrin leakage and ischemic regions.
(
ADCw Measurements
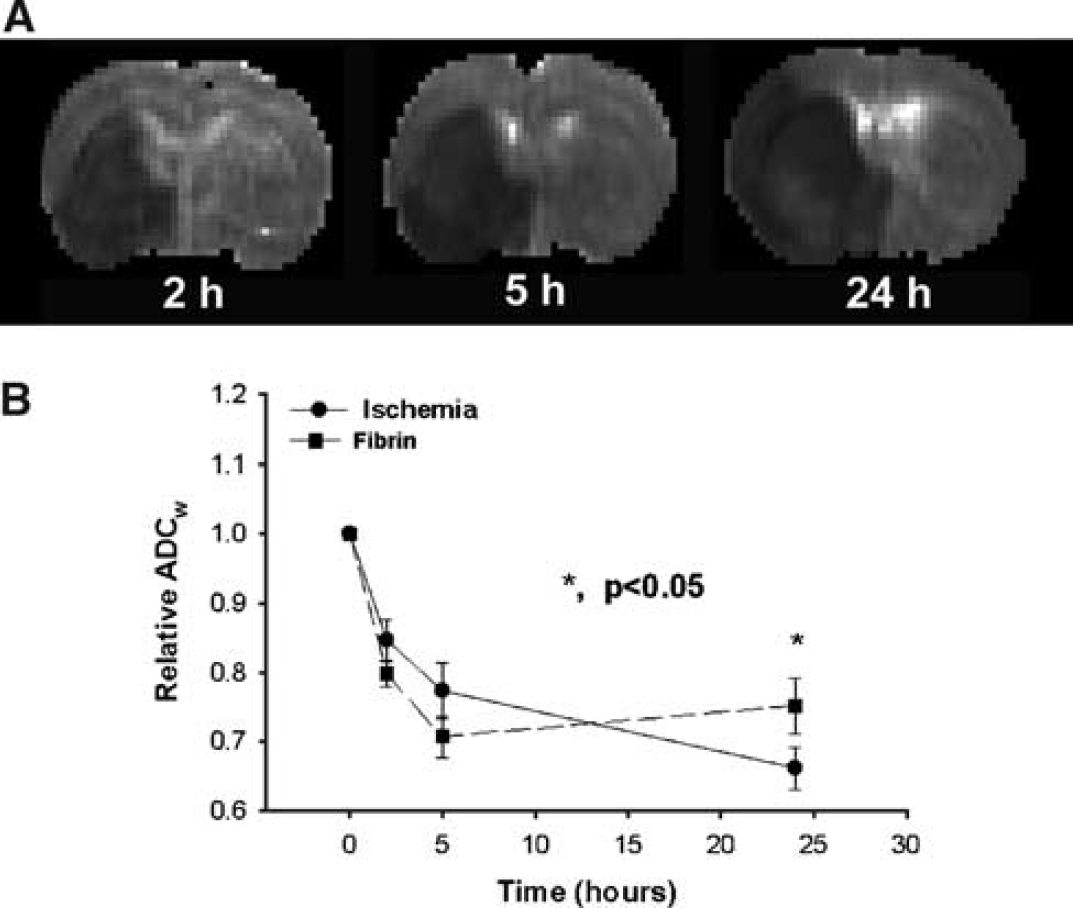
Figure 5 presents the temporal evolution of ADCw obtained at various times from 2 to 24 h after injection of the embolus from the same rat in Figure 1. Magnetic resonance imaging ADCw measurements revealed an early decrease in ADCw after embolization in the area encompassing the territory supplied by the MCA (Figure 5A). However, there were no clear differences in appearance between the ventral and middle region and the remaining ischemic region during the early period after embolization. The ventral and middle region of the ipsilateral hemisphere revealed a increase in ADCw than in the remaining ischemic region at 24 h after embolization. However, the contrast in ADCw maps between the ventral and middle region and the remaining area of ischemia was lower than in the K i , Vp, and kinv maps, and only appeared at 24 h after embolization. Figure 5B shows the temporal profiles of relative ADCw for their ischemic ROIs with and without fibrin leakage.
(
After embolization, the ADCw values decreased (P<0.001) from preischemic values in both fibrin leakage and ischemic ROIs up to 24 h after embolization. The mean ADCw values in the fibrin leakage ROI changed from below in early (2 to 5 h) to above values late (24 h) after embolization compared with the adjacent nonfibrin leakage ROI. Marginal or significant differences were detected in relative ADCw values between the fibrin leakage and adjacent nonfibrin leakage ROIs at 5 h (P=0.08) and 24 h (P=0.03) after embolization. A significant decrease in ADCw was also detected between the fibrin leakage ROI and its contralateral ROI (P<0.001) from 2 to 24 h after embolization, as well as between the ROIs of ischemic tissue without fibrin leakage and its contralateral ROI (P<0.001) from 2 to 24 h after embolization.
Blood Flow Measurements
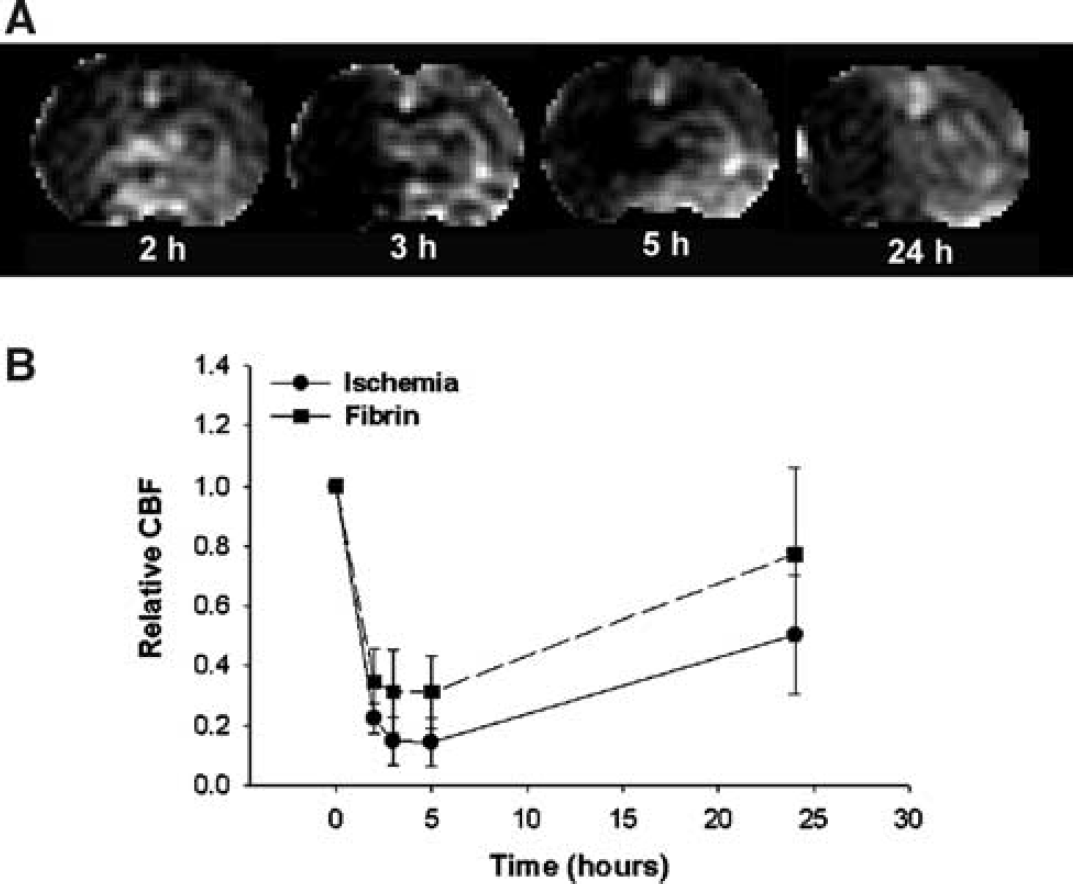
Figure 6 presents the temporal evolution of changes of CBF obtained at various times from 2 to 24 h after injection of the embolus from the same rat in Figure 1. Cerebral blood flow measurements revealed an early decrease in CBF in the territory supplied by the MCA (Figure 6A). However, CBF does not distinguish the area with fibrin leakage from the rest of the ischemic region. Figure 6B shows the temporal profiles of relative CBF for the ischemic tissue with and without fibrin leakage. The relative CBF values decreased from preischemic values in both fibrin leakage and ischemic ROIs up to 24 h after embolization (P<0.01). Although the CBF values were higher in the fibrin leakage than in the ischemic ROIs after embolization, there were no significant differences detected between the fibrin leakage and ischemic ROIs after embolization.
(
Discussion
In this study, we employed quantitative MRI to investigate whether MR parameters can distinguish ischemic tissue that progresses to fibrin leakage, indicative of severely compromised BBB, from ischemic tissue that does not progress to fibrin leakage. Our data suggest that K i , Vp, and kinv are highly sensitive as well as predictive of the tissue destined to exhibit fibrin leakage, and thus may provide an early identification of tissue which may progress to hemorrhage.
Our data show that permeability-related parameters measured by MRI are sensitive to BBB damage after ischemia. The BBB complex consists of endothelium, bounded by the basal lamina, and encompassed by the endfeet of astrocytes. A unique feature of the BBB, mainly controlled by the capillary endothelium, is its limitation of solute entry and the regulation of transit of substances to and from the plasma (Risau and Wolburg, 1990), During ischemia, changes of BBB permeability occurs (Betz et al, 1994; Dietrich et al, 1990; Risau et al, 1986; Risau and Wolburg, 1990), which include an increase in endothelial permeability, expression of leukocyte adhesion receptors mediating leukocyte adhesion, and transmigration, which affect permeability, and result in breakdown of basal lamina with loss of astrocyte and endothelial cell contact, and subsequent increase of permeability to fibrin and cells (e.g., erythrocytes) (Haring et al, 1996; Okada et al, 1994). A marked reduction in the basal lamina is present in regions of hemorrhage during focal ischemia (Hamann et al, 1996). The loss of basal lamina structure with breakdown of the extracellular matrix is the necessary step for the extravasation of plasma and at later times blood components into the brain parenchyma (Hamann et al, 1995, 1996). Other studies also show that the HT is related to early endothelial ischemic damage because of capillary swelling and increased BBB permeability to horseradish peroxidase (Garcia, 1983). Fibrin leakage from the microvasculature into the parenchyma indicates disruption of the BBB, and is likely a precursor of HT. In our study, we used fibrin leakage as the index of BBB breakdown.
Our MRI measurement of permeability-related parameters using the Patlak approach has been validated using well-accepted techniques of quantitative autoradiography (Ewing et al, 2003). Comparing the typical estimate of permeability-related parameter using a deconvolution procedure, the Patlak plot has a number of advantages in the analysis of MRI indicator data. The plot linearizes MRI estimation of Gd-DTPA transfer constants the influx data, allowing linear least-squares parametric estimation, and avoids the difficulties typical of deconvolution in the presence of noise. The Patlak model also has advantages in the short acquisition time for accurate estimate and the information to correct the tissue data for the amount of tracer in the tissue sampled in the plasma and other compartments on the luminal or blood side of the barrier and has not fluxed completely across the capillary wall (Ewing et al, 2003; Patlak and Blasberg, 1985; Patlak et al, 1983).
The y-intercept (Vp) of the Patlak analysis in the MRI data is different from the physiological meaning of original Patlak analysis in the quantitative autography (Vdist) (Ewing et al, 2003; Patlak and Blasberg, 1985; Patlak et al, 1983). The Vdist is a function of total amount of radiotracer in the tissue sample at the end of an experiment. In the event of a leaky BBB as in the ROIs, this indicator is in not only the microvascular plasma space but also the extracellular space of the surrounding tissue. In contrast, Vp is the volume of the various tissue compartments in which water with intravascular Gd changed relaxation rates distribute. In normal tissue, these compartments would be the plasma plus those adjacent to the plasma that has high membrane water permeability such as the red cell. When the BBB is open, such compartments could also include various elements of the brain parenchyma. Imaging of MR contrast agents and data analysis by the Patlak plot, thus, provides not only the rate of Gd-DTPA influx but also information on the intra- to extra-vascular exchange of mobile protons. Our data indicated that the Vp is also a sensitive marker to the early BBB damage leading to fibrin leakage at a later time.
The CT scan is currently the imaging modality most widely used to exclude the presence of hemorrhage in the evaluation of candidates for thrombolysis (NINDS, 1995). Magnetic resonance imaging has been used to detect hemorrhage (Thulborn and Atlas, 1996). However, the emphases of previous studies were focused on the MR properties of hemoglobin degradation products (Thulborn and Atlas, 1996). The hemoglobin in the blood extravasates into tissue and becomes deoxygenated. Deoxyhemoglobin produces a nonuniform magnetic field and results in signal loss (darkening) in T2 and T2* weighted MRI (Thulborn and Atlas, 1996). Since thrombolytic therapy must be performed within 3 h of ictus (NINDS, 1995), any MRI method to predict HT must do so before 3 h. The tissue destined for HT during the very acute phase after stroke may not involve erythrocyte leakage, but instead severe BBB damage may be present (Jiang et al, 2002; Knight et al, 1998). Our data on the embolic model of stroke indicate that hemorrhage is rarely present within the first few hours after stroke (Zhang et al, 1997). However, some animals develop hemorrhage within 24 to 48 h after stroke onset (Zhang et al, 1997). Our data show that MRI measurement of permeability-related parameters, K i and Vp, as well as kinv provide an early diagnosis of tissue at risk for fibrin leakage. These MR parameters may therefore be considered for the management of stroke patients.
Our data indicate that measurements of MT-related parameters are sensitive detectors of tissue with fibrin leakage. Maps of kinv in this model of embolic stroke detected tissue destined for fibrin leakage not only at the delayed time points, but also as early as 3 h after embolization. MT derives from the exchange of nuclear spin magnetization between ‘free’ and ‘bound’ protons. Changes of MT parameters can be derived either the amount of and/or the molecular binding of water, such as the process of edema and lyses of protein during ischemic insults (Neumar et al, 1996). Severe damage of the BBB during the acute ischemic period may involve a rapid loss of cellular structure through proteolysis and may cause leakage of water and small proteins (Ewing et al, 1999; Jiang et al, 2001, 2002; Neumar et al, 1996). This proteolysis and leakage of water and small proteins will reduce the weight of the macromolecule pool and therefore will increase kinv.
T2 measurements also exhibited an ability to detect differences between the tissue with fibrin leakage and nonfibrin leakage tissues at 24 h after stroke, although T2 was less sensitive than permeability-related MR measurements and MT. T2 values in the fibrin leakage area were higher than in the nonfibrin leakage ischemic areas, with significant differences evident at 24 h after embolization. The fibrin leakage-related region is associated with an increase in water content (edema) and plasma protein in the extracellular fluid (vasogenic edema) (del Zoppo and Hallenbeck, 2000; Hamann et al, 1995; Overgaard, 1994). Vasogenic edema develops when the BBB is disrupted. The elevated T2 in the fibrin leakage area may therefore indicate increased BBB disruption and more severe edema than that in the nonfibrin leakage area.
ADCw in the area with fibrin leakage reverts from below early in ischemia to above the ADCw values in the adjacent nonfibrin leakage region late after ischemia, and a significant difference was detected at 24 h after embolization. The decrease in ADCw value by either intra/extra cellular water shift (Benveniste et al, 1992; Moseley et al, 1990) or the changes of cell membrane permeability (Helpern et al, 1995) during acute ischemia is correlated with ischemic damage (Jiang et al, 1993). The region with severe BBB damage after the embolic stroke is most likely located at core of the lesion with severe ischemic damage and is expected to have a lower ADCw. However, leakage of water and small proteins from opening of the BBB will increase ADCw. The changes of ADCw in the area with fibrin leakage will be a balance of these two processes. Our results may indicate that the BBB leakage may play a minor role in the changes of ADCw during acute ischemia (few hours), but a major role in chronic (24 h) ischemia.
The sensitivity of ADCw in detecting BBB damage in the current study is different from our previous study which did not reveal differences between hemorrhagic and adjacent non hemorrhagic cerebral tissue (Jiang et al, 2002). A major difference between the present study and previous ADCw study is that trace ADCw was measured in the current study and traditional nontrace ADCw was measured in the previous study, that is, diffusion gradient only in x-direction. The ADCw values for cortex and caudate putamen differ by approximately 10% in the non-trace ADCw measurement (Jiang et al, 1993, 1997). Although the relative change in ischemic ROI (ischemia/preischemia) and fibrin leakage ROI (fibrin/preischemia) was used in this study to reduce the errors induced by regional differences, the diffusion gradient in the previous study may not be the most sensitive direction to the orientation of white matter fiber tracts undergoing fibrin leakage. The ADCw decrease in ischemic white matter was primarily in the λ1, the eigenvalue that coincides with the long axis of white matter fiber tract (Sotak, 2002). The sensitivity of ADCw in detecting of fibrin leakage may be related to both the direction of diffusion gradient and the orientation of white matter track in the fibrin leakage region. Further study of the effects of the direction of diffusion gradient and the orientation of white matter track on fibrin leakage is needed to improve the sensitivity of ADCw in detecting fibrin leakage.
Cerebral blood flow was not a sensitive predictor of tissue destined to fibrin leakage. CBF in the fibrin leakage area were not significantly different from the nonfibrin leakage ischemic area in the embolic model of ischemic rat. The embolic model of focal ischemia used in this study produces a low CBF for 24 h after embolization and causes severe ischemic damage in the core area of the lesion if the animal is not treated effectively (Jiang et al, 2000). The differences of CBF between fibrin leakage and nonfibrin leakage ischemic regions were small.
In the current study, differential effects of rt-PA on MRI measurements between ischemic and fibrin leakage regions were not apparent, except for marginal significance in K i detected at 24 h. The incidence of HT is increased by delayed rt-PA treatment after the embolic stroke (del Zoppo et al, 1990, 1992; Jiang et al, 2002; Overgaard, 1994) and is most likely caused by increased breakdown of small vessel walls in recanalized tissue at the later reperfusion times (Zivin and Choi, 1991) and the rt-PA amplification of the inflammatory response in the ischemic tissue (Zhang et al, 1999a), which exacerbates microvascular damage (Zivin and Choi, 1991). The reasons for the absent of rt-PA effects on MRI measurements between ischemic and fibrin leakage regions may be attributed to the observation that hemorrhage is localized to cerebral tissue with severe BBB disruption, Gd-DTPA and water may be insensitive to the rt-PA on the BBB permeability. The present data, however, are consistent with our previous study of MRI detection of HT with and without rt-PA treatment, while also fouled to identify the differences in MRI measurements between HT and ischemic regions with and without rt-PA treatment (Jiang et al, 2002).
In conclusion, our data indicate that multiparameter MRI show differential sensitivity in detecting and predicting tissue with fibrin leakage. Of these methods, permeability-related parameters K i , Vp, and kinv appear most sensitive in the detection and prediction of fibrin leakage at an early time after embolization. Our data suggest that K i , Vp, and kinv are potentially important methodologies for detecting tissue destined for fibrin leakage and for potential application to the management of stroke patients.
Footnotes
Acknowledgements
The authors thank Grenae Mosley for manuscript preparation.