
Abstract
To determine the role of calcium homeostasis in ischemic neuronal death, the authors used an in vitro model of oxygen–glucose deprivation in neuronal cell lines. Exposure of human neuroblastoma SH-SY5Y cells to 10- to 16-hour oxygen–glucose deprivation decreased viability to 50% or less, and longer exposure times killed almost all cells. The death following 10- to 16-hour oxygen–glucose deprivation was not manifested until 24 to 72 hours after exposure. Deprivation of both glucose and oxygen together was required for expression of toxicity at these exposure times. Dantrolene, which blocks the release of endoplasmic reticulum Ca2+ stores, partially protected SH-SY5Y cells from oxygen–glucose deprivation toxicity. The addition of dantrolene during the deprivation phase alone produced the maximal drug effect; no further protection was obtained by continued drug exposure during the recovery phase. Prevention of Ca2+ influx by chelation or channel blockade or the chelation of cytosolic Ca2+ did not inhibit oxygen-glucose deprivation toxicity. In contrast, increasing extracellular Ca2+ or stimulating Ca2+ influx did inhibit toxicity. Calcium measurements with fura-2 acetoxymethylester revealed that oxygen–glucose deprivation caused a significant reduction in thapsigargin-releasable endoplasmic reticular stores of Ca2+. These studies suggest that an important component of the neuronal toxicity in cerebral ischemia is due to disruption of calcium homeostasis, particularly to the depletion of intracellular Ca2+ stores.
Keywords
More than 70,000 patients will be resuscitated from cardiac arrest each year in the United States, but 60% of these patients will die in the hospital, and only 3% to 10% will survive without significant neurological impairment (White et al., 2000). Currently, little beyond supportive therapy can be offered to these patients. However, because much of the neuronal damage associated with cerebral ischemia is delayed by hours or days after the initial insult, it should be possible to intervene after the ischemic event to prevent or at least attenuate this damage. To devise proper therapy for such intervention, it will be essential to fully understand the nature of the cellular processes activated by cerebral ischemia that lead to the eventual death of neurons. Many lines of evidence suggest that a critical feature of ischemia-induced neuronal death, and neuronal death due to other insults, is the disruption of calcium homeostasis (Choi, 1995; Kristian and Siesjo, 1998; Orrenius and Nicotera, 1994). One theory suggests that the primary insult in ischemia is an excessive or prolonged increase in cytosolic calcium ([Ca2+]i), derived from influx through excitatory glutamate channels or other routes (Siesjo and Bengtsson, 1989). More recently, evidence has suggested that another type of calcium disruption—disruption of intracellular Ca2+ stores, particularly those of the endoplasmic reticulum (ER)—may contribute to neuronal death in ischemia and other pathological states (Paschen, 1996; Paschen and Doutheil, 1999; Wei and Perry, 1996).
The two primary cellular insults that occur during cerebral ischemia are the loss of oxygen and of glucose. Therefore, ischemia can be modeled in vitro by the depletion of oxygen and glucose, followed by the restoration of normal conditions. Such a model was devised by Goldberg and Choi (1993), who exposed primary cortical cultures from fetal mouse brain to varying times of oxygen–glucose deprivation (OGD), and showed that the resulting neuronal death had characteristics of cerebral ischemic neuronal death. This model has been invaluable for exploring cellular mechanisms associated with ischemic death.
The majority of OGD studies have used primary neuronal cultures. In the present study, we examined the effects of OGD on clonal neuronal cell lines. Studies using primary neuronal cultures have shown the importance of excitotoxicity (overactivation of glutamate receptors) in OGD-induced death (Dubinsky and Rothman, 1991; Goldberg and Choi, 1993; Kimura et al., 1998; Mattson et al., 1995; Seo et al., 1999). However, recent studies by Choi and colleagues have shown the presence of a nonexcitotoxic component of OGD-induced toxicity in primary neuronal culture (Gottron et al., 1997; Gwag et al., 1995). In contrast to excitotoxic death, which is mediated by large influxes of Ca2+ via N-methyl-
MATERIALS AND METHODS
Cell culture
SH-SY5Y cells (ATCC, Manassas, VA, U.S.A.) were cultured in Dulbecco modified Eagle medium (DMEM) supplemented with 10% fetal calf serum, 1 U/mL penicillin, and 1 μg/mL streptomycin, all of which were obtained from Biofluids (Rockville, MD, U.S.A.). The culture was maintained at 37°C with 95% humidified air and 5% carbon dioxide. The culture medium was changed twice weekly. Oxygen–glucose deprivation was achieved by placing cells for varying times in a 37°C incubator within an anaerobic chamber with a controlled atmosphere of 5% carbon dioxide, 85% nitrogen, and 10% hydrogen (Goldberg and Choi, 1993). For most experiments, aglycemia was achieved by replacing the standard medium with a basic salt solution (BSS; 120 mmol/L sodium chloride, 5 mmol/L potassium chloride, 1.2 mmol/L calcium chloride, 1.1 mmol/L potassium dihydrogen phosphate, 1.2 mmol/L magnesium sulfate, and 20 mmol/L sodium bicarbonate) with no added glucose or serum. In some experiments, BSS was replaced by DMEM with no added glucose or serum. In all cases, the DMEM or BSS added to the cells had been deoxygenated before the experiment by stirring overnight in the anaerobic chamber. After the appropriate time in the anaerobic chamber, cells were removed and either placed back into a standard carbon dioxide incubator or otherwise processed. Drugs to be tested were typically added at the start of the anaerobic exposure, and then re-added for the duration of the recovery as the medium was replaced. In some experiments, the drug was included only during the anaerobic or recovery phases. All drugs were made in 100X stock solutions in dimethyl sulfoxide or water before being added to cells.
Assessment of survival
Cell viability was determined by trypan blue (Sigma, St. Louis, MO, U.S.A.) exclusion. At the end of the anaerobic exposure, cells were removed from the chamber, and DMEM or BSS was removed and centrifuged 5 minutes at 250 g. The supernatant was discarded and the pellet was resuspended in fresh complete medium, which was then placed back onto the remaining cells in the well. Therefore, any cells that became detached during OGD exposure were included in the final tally. The plate was then placed back in a standard carbon dioxide incubator until further analysis (i.e., recovery phase). At the time of analysis, attached cells well were removed by trypsinization and pooled with the medium. Cells were centrifuged at 250 g for 5 minutes, and the pellet resuspended in complete DMEM with 0.1% trypan blue. After at least 5 minutes, cells were observed in a hemacytometer, and blue and white cells were counted. Viability was determined as the percent of total cells that excluded trypan blue (i.e., white cells). Results were the means of viabilities from three to six determinations; differences in mean values were assessed by analysis of variance followed by Tukey post hoc test, and statistical significance was accepted at P < 0.05.
Calcium imaging
Glass cover slips (15-mm round #1 glass) were coated with 2% gelatin and placed in 12-well culture plates. The SH-SY5Y cells were seeded into the dishes under standard culture conditions and grown to a 90% or greater confluency. After two washes with washing buffer (120 mmol/L sodium chloride, 5 mmol/L potassium chloride, 1.2 mmol/L calcium chloride, 1.1 mmol/L potassium dihydrogen phosphate, 1.2 mmol/L magnesium sulfate, 20 mmol/L glucose, and 25 mmol/L HEPES, pH 7.4), cells were incubated with 5 μmol/L fura-2 acetoxymethylester (Molecular Probes, Eugene, OR, U.S.A.) for 1 hour at room temperature, followed by two additional washes with washing buffer, and an additional 15-minute incubation in DMEM without phenol red. For cells exposed to OGD, the fura-2AM loading was performed inside the anaerobic chamber during the final 75 minutes of OGD. Cover slips were then removed from the culture plates and mounted onto a sealed holder connected to a perfusion apparatus (VC-6 controller; Warner Instruments, Hamden, CT, U.S.A.) and installed in a Nikon (Tokyo, Japan) TE200 microscope. Cells were continuously perfused with washing buffer and drugs were added by continuous perfusion. Fluorescence excitation was measured at 340 and 380 nm (emission, 510 nm) with a MiroMAX digital camera system using an RTE/CCD-1300-Y/HS camera (Princeton Instruments, Trenton, NJ, U.S.A.); analysis was performed using Metafluor 4.0 (Universal Imaging, West Chester, PA, U.S.A.). Data were collected for a minimum of six cells per image, and expressed as a ratio of the 340/380-nm excitation intensities. Ratios for all cells were averaged for plotting.
Calcium measurements in cell suspensions
SH-SY5Y cells were maintained in complete DMEM until 90% confluence was reached. Cells were then trypsinized, centrifuged, and resuspended in complete DMEM without phenol red at a concentration 5×10⁶ cells/mL. Cells were then loaded with 5 μmol/L fura-2AM by incubation at room temperature for 1 hour. At the end of the incubation, cells were centrifuged and resuspended with complete DMEM without phenol red to wash away extracellular fura-2AM, then incubated for another 15 minutes at room temperature to allow for complete intracellular hydrolysis of fura-2AM. Throughout the preparation steps, 1 mmol/L probenecid (Sigma) was added to reduce fura leakage. Cytosolic calcium was quantified using a Perkin-Elmer (Norwalk, CT, U.S.A.) LS50B Luminescence Spectrometer, with the excitation wavelengths at 340 and 380 nm and the emission at 510 nm. Calcium concentrations were calculated using standard methods (Tsien et al., 1982) using a Kd for fura-2 of 224 nmol/L (Grynkiewicz et al., 1985). Minimum values were obtained by addition of 5 mmol/L ethyleneglycoltetracetic acid (Sigma) and adjusting pH to 7.4, whereas maximal values were attained by the addition of 10 μg/mL ionomycin (Calbiochem, La Jolla, CA, U.S.A.) and 10 mmol/L calcium chloride.
RESULTS
The toxicity of prolonged OGD to neurons was tested in a neuronal cell line, the human neuroblastoma SH-SY5Y (Fig. 1). Exposure to 8-hour OGD caused little or no toxicity when viability was assessed up to 72 hours after the start of the exposure. Intermediate times of 10 and 12 hours produced substantial but not complete toxicity, with approximately 50% viability at 72 hours. Exposure of 16 or 24 hours, however, led to essentially complete cell death by 72 hours, though there was some survival after 16-hour OGD in some experiments. Expression of the toxicity was delayed, with little cell death apparent at 24 hours.
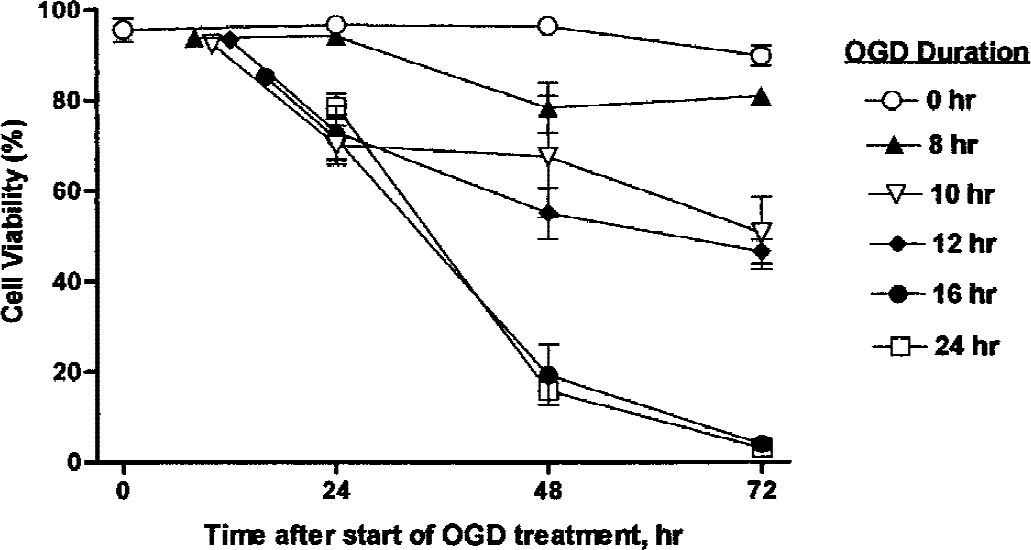
Time course of SH-SY5Y neuronal cell death induced by oxygen–glucose deprivation (OGD). The SH-SY5Y cells were incubated the indicated times either in an anaerobic chamber with balanced salt solution without glucose or serum (OGD) or in a normal carbon dioxide incubator with a complete medium (controls). After incubation, cells were returned to standard conditions and viability was determined by trypan blue exclusion at indicated times after the start of the OGD treatment. Data are expressed as mean ± SD of cell viability for each condition.
Hypoxia and aglycemia can each induce cellular damage. To test for the different contributions of these insults, we exposed SH-SY5Y neuronal cells to hypoxia or normoxia in the presence of a normal medium or a medium deprived of serum, glucose, or both. After 16 hours, cells were returned to the normal medium and atmosphere until viability was assessed at 48 hours. Removal of glucose or serum or both for 16 hours had only a slight (nonsignificant) toxic effect on SH-SY5Y neuronal cells (Fig. 2). Likewise, 16-hour hypoxia had no significant toxic effect on cells maintained in a complete or even serum-deprived medium. However, viability was reduced to 10% when both glucose and oxygen were removed, and the removal of serum further reduced viability to almost zero. In these experiments, we used DMEM for medium controls and a BSS for serum- or glucose-deprived conditions. To test whether small differences in composition between DMEM or BSS contributed to these findings, we tested for the effect of glucose deprivation using DMEM instead of BSS, and both solutions yielded similar results.
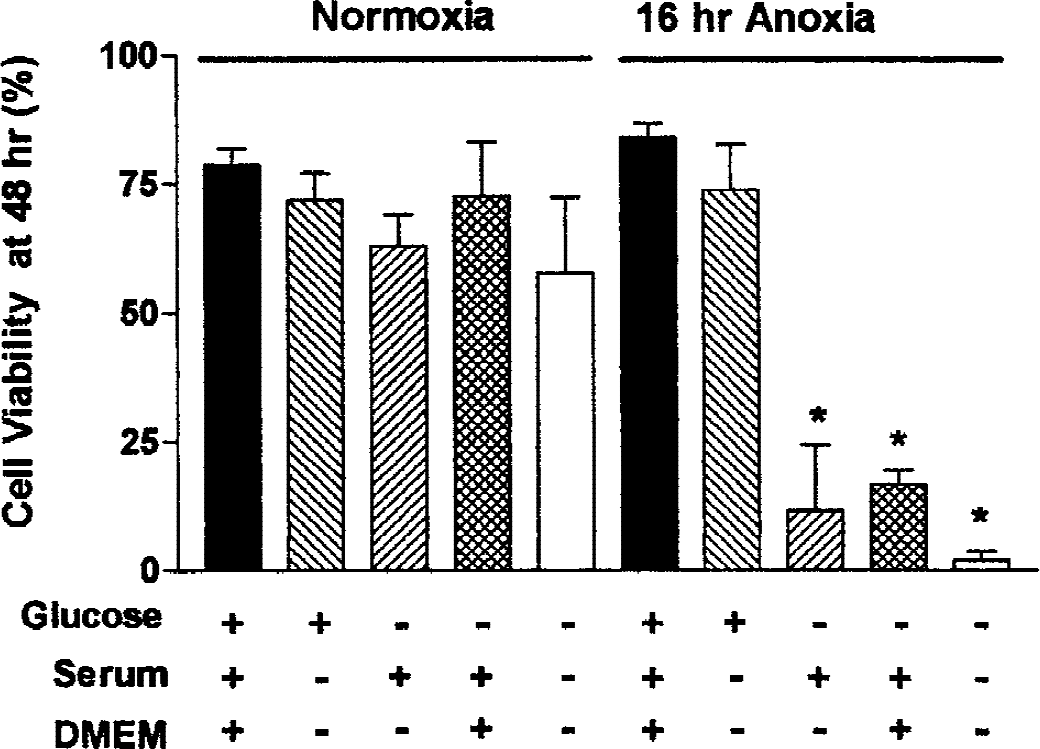
Effect of deprivation of oxygen, glucose, or serum on the viability of SH-SY5Y neuronal cells. The SH-SY5Y cells were incubated for 16 hours in an anaerobic chamber or in a normal carbon dioxide incubator, in balanced salt solution (BSS) or Dulbecco modified Eagle medium (DMEM), with or without added glucose or serum (as indicated). After incubation, cells were returned to standard conditions and viability was determined by trypan blue exclusion 48 hours after the start of oxygen–glucose deprivation. Data are expressed as mean ± SD of cell viability for each condition. *Significantly lower viability compared with normoxic controls (P < 0.001). Viability seen after the removal of serum, glucose and oxygen (final condition) was not significantly lower than that seen with removal of oxygen and glucose only. No differences in similar treatments with DMEM or BSS were detected.
Oxygen–glucose deprivation exposure to primary neuronal cultures has been shown to cause death, primarily by a mechanism of excitotoxicity (Dubinsky and Rothman, 1991; Goldberg and Choi, 1993; Kimura et al., 1998; Mattson et al., 1995; Seo et al., 1999). We used several methods to test whether SH-SY5Y cells had functional ionotropic glutamate receptors. Treatment with 1 mmol/L glutamate, kainic acid, or N-methyl-
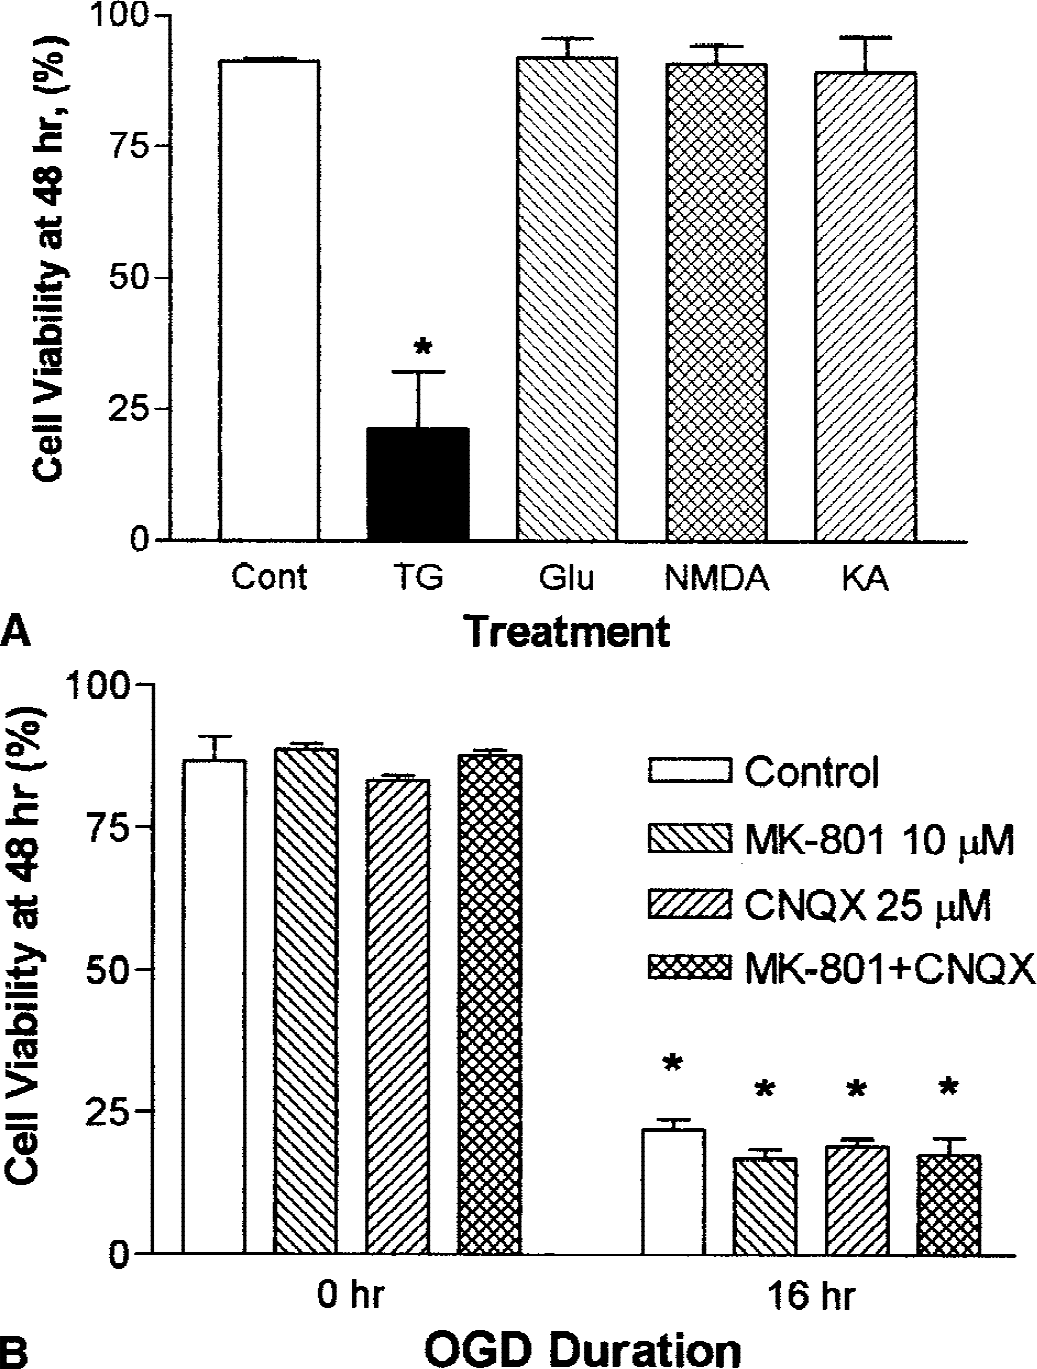
The SH-SY5Y neuronal cells do not express functional ionotropic glutamate receptors.
In the absence of excitotoxicity, another possible source of toxicity from OGD could be release of ER Ca2+ stores. Dantrolene blocks release of ER Ca2+ via ryanodine receptor channels (Ward et al., 1986), and has been shown to be neuroprotective in several models (Frandsen and Schousboe, 1991, 1993; Lei et al., 1992; Mody and MacDonald, 1995; Wei and Perry, 1996; Zhang et al., 1993). We tested the effects of dantrolene added to SH-SY5Y cells for the duration of a 12-hour OGD exposure and recovery. Figure 4 shows that 40 μmol/L dantrolene gave substantial neuroprotection, and more than doubled the viability of cells exposed to OGD without drug (P < 0.001). No additional protection was seen with 80 μmol/L dantrolene. The ER Ca2+ release may occur during the OGD exposure or during the recovery phase. We treated SH-SY5Y neuronal cells with 40 μmol/L dantrolene during 16-hour OGD, the recovery phase alone, or during both periods. In Fig. 5, we show that the maximal drug effects were obtained by including during the OGD phase alone; no additional benefit was obtained by continuous exposure during recovery. A trend (nonsignificant) toward protection was seen when dantrolene was included during recovery only.
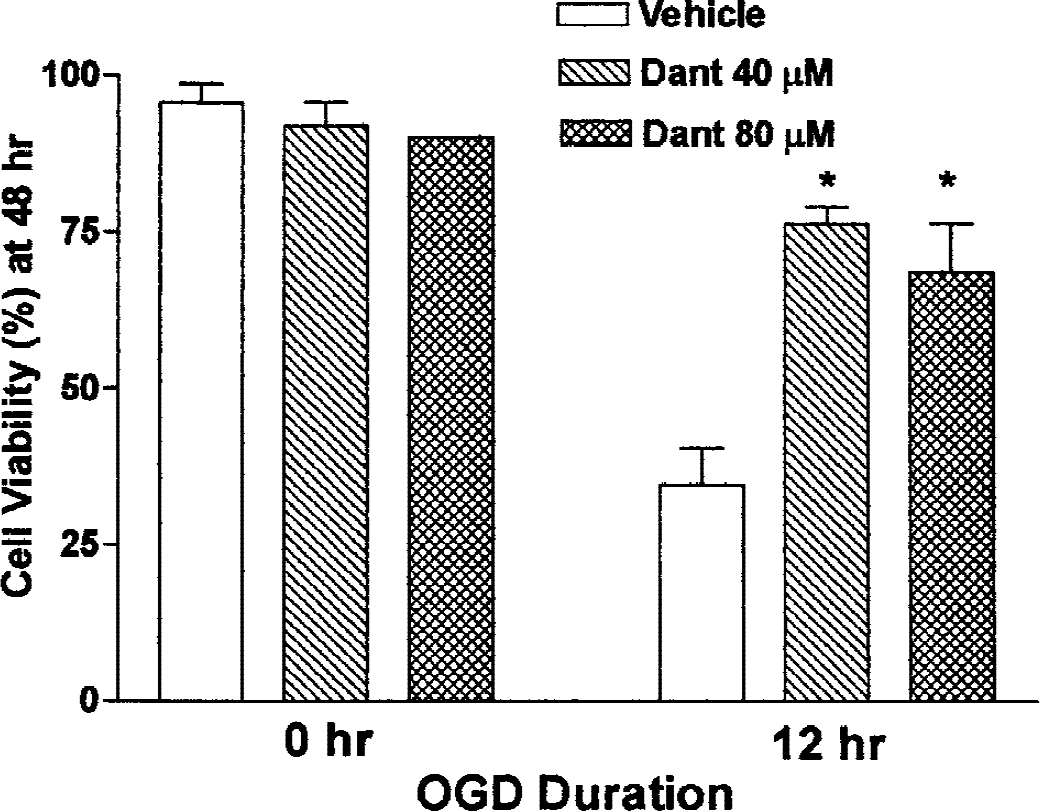
Dantrolene partially inhibits oxygen–glucose deprivation (OGD)-induced toxicity in SH-SY5Y neuronal cells. The cells were incubated for 12 hours either in an anaerobic chamber with balanced salt solution without glucose or serum (OGD) or in a normal carbon dioxide incubator with complete medium (controls). They were then transferred to standard conditions until viability was assessed with trypan blue 48 hours after the start of OGD. Dantrolene (40 or 80 μmol/L) was included throughout the entire 48-hour period in the indicated samples. *Hypoxic samples treated at either dose of dantrolene had significantly higher viability than nontreated samples (P < 0.001). There was no significant difference in the response to the two doses.
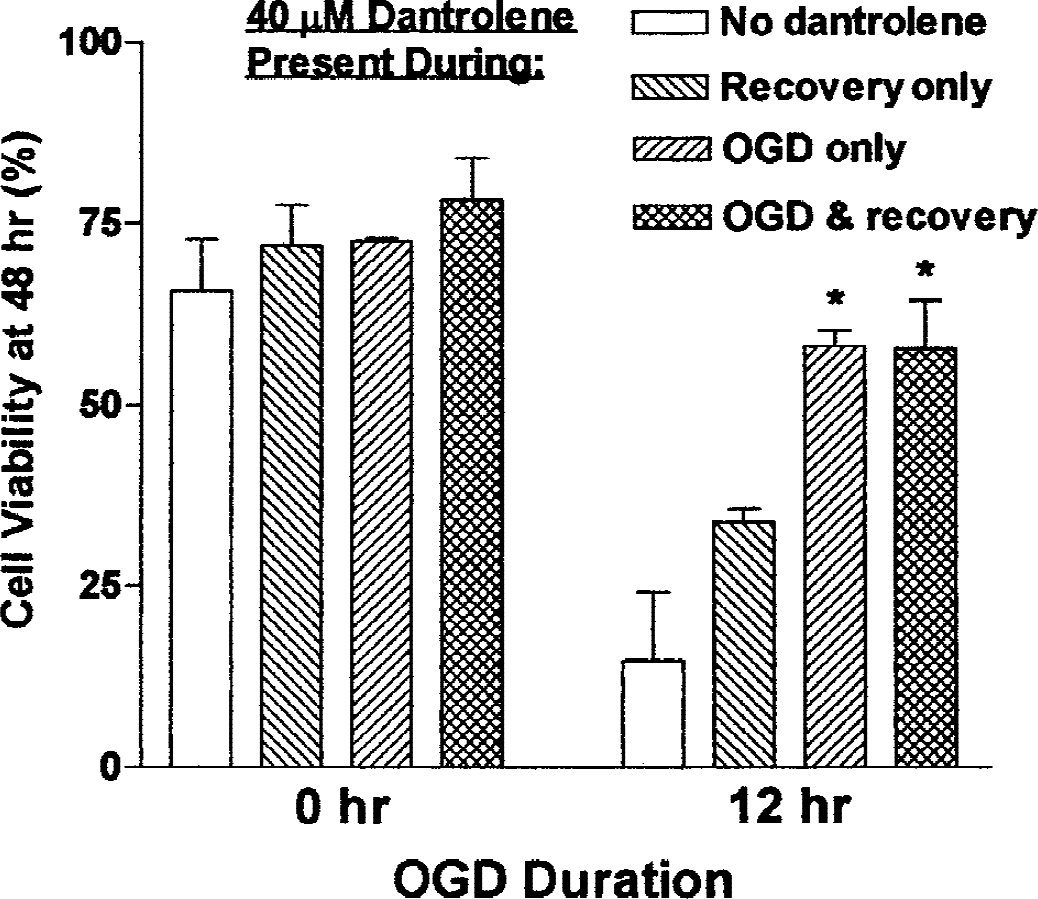
Dantrolene protection of SH-SY5Y neuronal cells from oxygen–glucose deprivation (OGD)-induced toxicity occurs primarily during the OGD phase. The SH-SY5Y cells were incubated for 16 hours either in an anaerobic chamber with balanced salt solution without glucose or serum (OGD) or in a normal carbon dioxide incubator with complete medium (controls). They were then transferred to standard conditions until viability was assessed with trypan blue 48 hours after the start of OGD. Dantrolene (40 μmol/L) was included during the 16-hour OGD only, during the 32-hour recovery only, or during both periods, as indicated. Data are expressed as mean ± SD of cell viability for each condition. The increased viability in hypoxic samples seen with exposure during recovery only was nonsignificant. Inclusion of dantrolene during the OGD phase gave enhanced viability compared with OGD when no drug was added (P < 0.001); these samples were not significantly different from normoxic controls.
Protection by dantrolene implies that OGD toxicity is caused in part by the release of ER Ca2+ stores. One consequence of such release would be an increase in [Ca2+]i, with a component of the increase coming both from ER stores and from the capacitative influx of extracellular Ca2+. To blunt any increases in [Ca2+]i, we preloaded SH-SY5Y cells with the intracellular Ca2+ chelator BAPTA-AM. As shown in Fig. 6, BAPTA-AM was not protective, and in fact was by itself toxic. Another approach to inhibiting the increase in [Ca2+]i associated with the release of ER Ca2+ stores is to prevent the associated capacitative influx. However, neither chelation of extracellular Ca2+ by ethyleneglycoltetracetic acid nor the blockade of Ca2+ influx by lanthanum chloride protected against OGD-induced death (Fig. 6). The other consequence of ER Ca2+ release is a depletion of ER Ca2+ stores. To increase [Ca2+]i and counteract any store depletion, we directly raised extracellular Ca2+ and stimulated the influx via voltage-dependent calcium channels by depolarization (potassium chloride) or a channel “agonist” (BayK 8644). As shown in Fig. 7, increasing levels of extracellular Ca2+ by twofold to fourfold gave significant protection against cell death from 16-hour OGD, as did stimulation of influx via potassium chloride or BayK 8644.
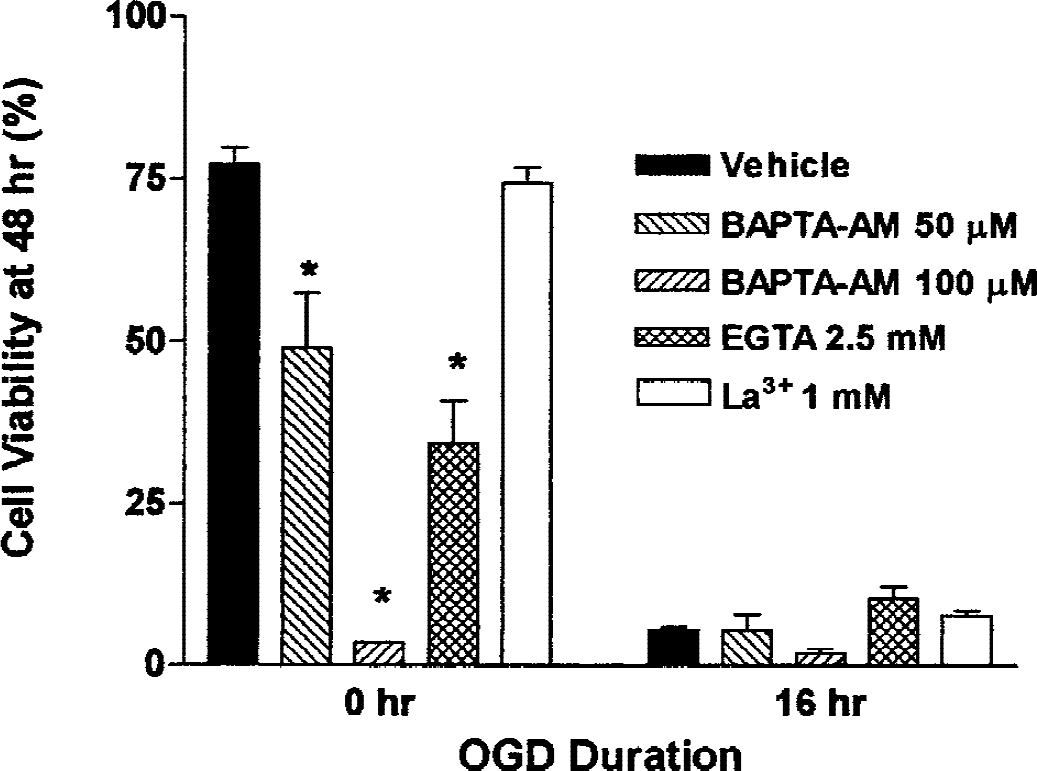
Neither preventing Ca2+ influx nor chelating [Ca2+]i protects SH-SY5Y neuronal cells from oxygen–glucose deprivation (OGD)-induced toxicity. The SH-SY5Y cells were incubated for 16 hours either in an anaerobic chamber with balanced salt solution without glucose or serum (OGD) or in a normal carbon dioxide incubator with complete medium (controls). They were then transferred to standard conditions until viability was assessed with trypan blue 48 hours after the start of OGD. Ethyleneglycoltetracetic acid (2.5 mmol/L), BAPTA-AM (50 or 100 μM), or lanthanum chloride (1 mmol/L) was included throughout the entire 48-hour period in the indicated samples. Data are expressed as mean ± SD of cell viability for each condition. No significant protection was detected. *Normoxic samples treated with both chelators showed significantly lower viabilities than untreated controls (P < 0.001).
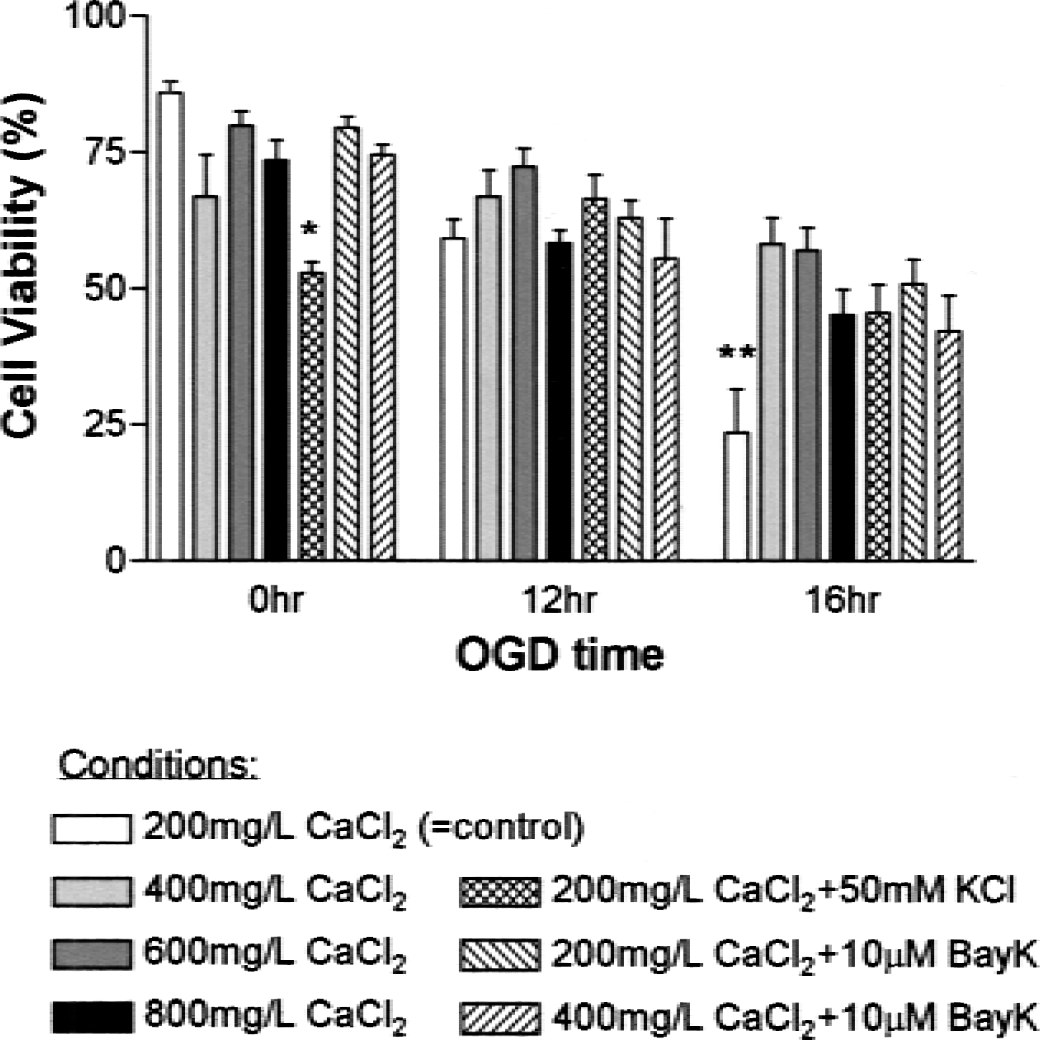
Increased levels of extracellular Ca2+ protected SH-SY5Y neuronal cells from oxygen–glucose deprivation (OGD)-induced toxicity. The SH-SY5Y cells were incubated for 12 or 16 hours in OGD conditions, or for 16 hours in standard conditions (0 hr). During these 12 or 16 hours, extracellular Ca2+ was either maintained at control conditions (calcium chloride, 200 mg/L, or 1.8 mmol/L) or supplemented as indicated. In other samples, 50 mmol/L potassium chloride or 10 μmol/L BayK 8644 was included. Cells were then transferred to standard conditions without other additions until viability was assessed with trypan blue 48 hours after the start of OGD. Data are expressed as mean ± SD of cell viability for each condition (n = 6). For cells not exposed to OGD, treatment with 50 mmol/L potassium chloride significantly decreased viability compared with all other treatments (*P < 0.05). No significant differences were detected among treatment groups after 12-hour OGD. For cells treated with 16-hour OGD, all treatment groups were significantly more viable than the controls (**P < 0.05).
We then directly measured the effects of OGD on [Ca2+]i by calcium imaging with the fluorescent dye fura-2 AM. Figure 8 shows that after 5-hour OGD, both the basal level of [Ca2+]i and the increase in [Ca2+]i occurring after challenge with 100 nmol/L thapsigargin (a measure of ER Ca2+ stores) are lower than in control cells. We repeated this experiment twice; the average increase after thapsigargin challenge was 51% of the control level (average baseline level, 76% of control). Similar results were obtained after 3-hour OGD (data not shown). Because of the difficulty in maintaining cells attached to a glass coverslip after OGD, we used a suspension method to measure effects of longer OGD times on [Ca2+]i. Figure 9 shows [Ca2+]i levels before and after challenge with 300 nmol/L thapsigargin in control cells and after 12- and 16-hour OGD exposure (similar results were obtained when 100 nmol/L thapsigargin was used in these cells). Thapsigargin-releasable Ca2+ levels remained low, at 53% of control levels after 12-hour OGN (n = 5) and at 59% of control levels after 16-h OGD (n = 6); both decreases were statistically significant (P < 0.05). Rather than a decrease in [Ca2+]i, a slight increase was seen in these experiments (average: 52 nmol/L in controls, 63 nmol/L after 12 hours, 61 nmol/L after 16 hours; P < 0.05).
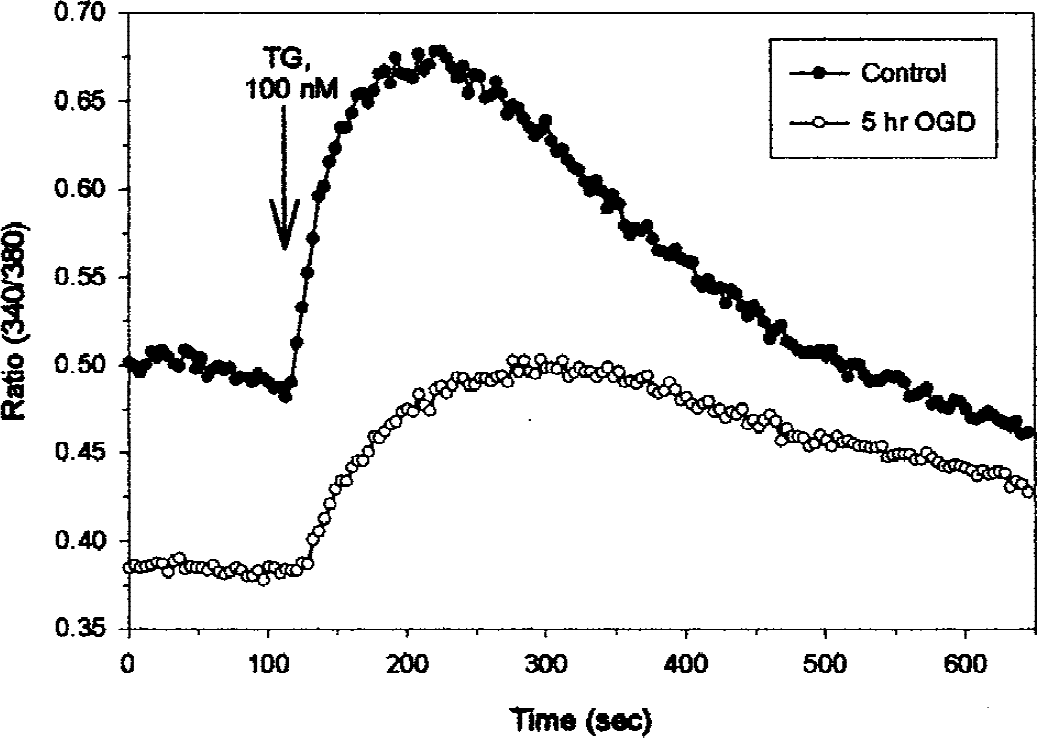
Five-hour oxygen–glucose deprivation (OGD) lowers basal [Ca2+]i and thapsigargin-releasable Ca2+ in SH-SY5Y neuronal cells. The SH-SY5Y cells grown on gelatin-coated cover slips were incubated for 5 hours either in an anaerobic chamber with balanced salt solution (BSS) without glucose or serum (OGD) or in a normal carbon dioxide incubator with complete medium (controls). For the final 75 minutes of incubation, 5 μmol/L fura-2AM was added. Cover slips were then removed and installed in a microscope holder and continuously perfused with BSS buffer. The 340/380-nm fluorescence ratio was determined and averaged over a 10-minute period, and 100 nmol/L thapsigargin was added to release endoplasmic reticular stores of Ca2+. Values shown are averages of six to 12 cells per field; the experiment was repeated twice.
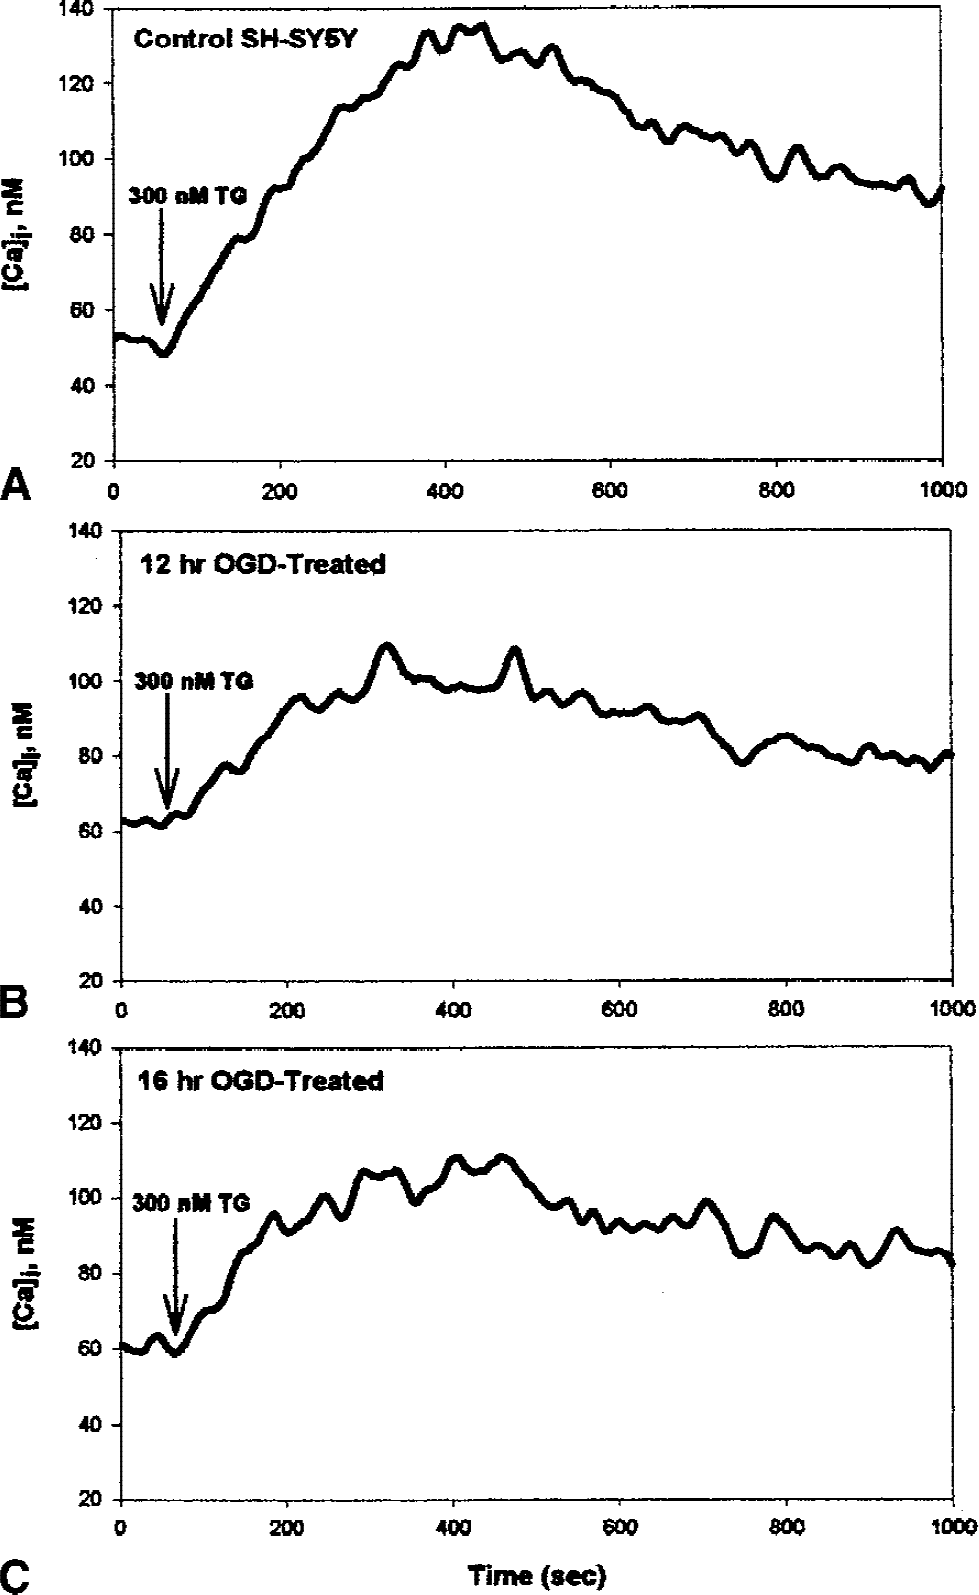
Twelve- or 16-hour oxygen–glucose deprivation (OGD) lowers thapsigargin-releasable Ca2+ in SH-SY5Y neuronal cells. The SH-SY5Y cells were incubated (A) for 16 hours in a normal carbon dioxide incubator with complete medium (controls), or in an anaerobic chamber with balanced salt solution without glucose or serum (OGD) for (B) 12 hours or (C) 16 hours. At the end of this period, cells were transferred to standard conditions and incubated for 1 hour with 5 μmol/L fura-2AM. Cells were then trypsinized and centrifuged to remove extracellular fura-2AM, and transferred to cuvettes in a spectrofluorimeter, where the 340/380-nm fluorescence ratio was determined, allowing calculation of [Ca2+]i. After establishing basal levels of [Ca2+]i, 300 nmol/L thapsigargin was added to release endoplasmic reticular Ca2+ stores. Tracings are averages of five to seven separate experiments.
DISCUSSION
Most studies of the effects of OGD on neurons have used a model of primary neuronal culture. As others have shown (Goldberg and Choi, 1993; Kimura et al., 1998), a major component of OGD-induced toxicity in this in vitro model of ischemia is due to excitotoxicity. However, several lines of evidence suggest that mechanisms other than excitotoxicity may contribute to neuronal death after cerebral ischemia. For example, in vivo studies with glutamate receptor blockers have found that these drugs yield only partial efficacy as neuroprotectants (Buchan et al., 1991). Also, OGD in primary neuronal cultures is not a perfect model of the in vivo situation. First, glutamate receptor density can vary dramatically during development in utero and also with number of days in vitro (McDonald et al., 1997; Ye and Sontheimer, 1998). Second, the most abundant forms of the glutamate transporter (EAA1, EAA2) are located largely on glial cells (Sutherland et al., 1996). Because nonneuronal cells are largely lacking in most in vitro preparations, the effects of extracellular glutamate in cultures are likely to be magnified by the relative lack of glutamate clearance by glial uptake. Recently, researchers reported that OGD could still cause toxicity in mouse cortical cultures in the presence of glutamate receptor blockers (Gottron et al., 1997; Gwag et al., 1995). This “blocked OGD” necessitated a longer OGD exposure (110 vs. 90 minutes), was slower to develop, and had characteristics of apoptosis (i.e., it could be blocked by treatment with caspase inhibitors). This group subsequently reported that blocked OGD is accompanied not by an increase in [Ca2+]i as would be expected with excitotoxicity, but by a decrease in [Ca2+]i, and that various treatments to prevent this decrease in cytosolic Ca2+ were also neuroprotective (Babcock et al., 1999).
To better understand the nonexcitotoxic component of OGD-induced neuronal death, and by extension of ischemic neuronal death, we chose to examine the effects of this insult using a neuronally derived cell line, SH-SY5Y. We found no evidence that these cells express functional ionotropic glutamate receptors. As was previously shown for primary neuronal cultures (Goldberg and Choi, 1993), both hypoxia and aglycemia together seemed to be needed for OGD-induced death. As expected, the most significant difference between the primary neuronal culture model and the neuronal cell line model was that OGD-induced toxicity in neuronal cell lines was not blocked by glutamate receptor antagonists. The primary mechanism thought to mediate excitotoxic neuronal death the massive influx of Ca2+. However, what might be the mechanism for nonexcitotoxic ischemic neuronal death? Disruption of calcium homeostasis is still a likely culprit because there are numerous ways in which this process can contribute to cell damage or death (Orrenius and Nicotera, 1994). We and others have demonstrated that drugs like thapsigargin that stimulate release of ER stores of Ca2+ cause apoptosis and cell death in a variety of cell types (Bian et al., 1997; Furuya et al., 1994; Lam et al., 1994; Paschen and Doutheil, 1999; Wei and Perry, 1996). Such release can be at least partially blocked by dantrolene, a drug used to manage malignant hyperthermia, which is caused by massive release of Ca2+ from sarcoplasmic reticular stores (Ward et al., 1986). Dantrolene blocks the ryanodine receptor channel, one of two Ca2+-release channels in the ER (the other being the channel activated by inositol trisphosphate). We previously demonstrated that dantrolene significantly inhibits the toxicity of thapsigargin in GT1–7 neuronal cells (Wei and Perry, 1996). In the present study, we found that this drug also inhibits a portion of OGD-induced toxicity in SH-SY5Y neuronal cells. This finding suggests that OGD causes the release of ER Ca2+ via ryanodine receptor channels, which contributes to the subsequent cell death. The protection was not complete, possibly because dantrolene does not block Ca2+ release through the inositol trisphosphate channel. Because the inclusion of the dantrolene during the OGD phase alone gave the same protection as did inclusion during both the OGD phase and the recovery phase, it is likely that the Ca2+ release occurs primarily during the OGD insult and not during the recovery. (Although viability of cells treated during recovery alone was double that of nondrug-treated controls, this increase was not statistically significant.)
Release of ER Ca2+ has two separate consequences, each of which could play a role in toxicity. One consequence is an increase in cytosolic levels of Ca2+ ([Ca2+]i). Excess levels of [Ca2+]i, which can occur by various mechanisms, is associated with cytotoxicity, possibly through activation of Ca2+-regulated enzymes (Laitusis et al., 1999; Orrenius and Nicotera, 1994). Independently of any changes in cytosolic Ca2+, the prolonged release of ER Ca2+ can also deplete ER Ca2+ stores, which has profound effects on cell viability. Calcium plays an important role in the functional activities of the ER, including protein folding and processing. The depletion of ER Ca2+ can disrupt these processes and induce a form of “ER stress” (Brostrom and Brostrom, 1990; Doutheil et al., 1999; Li et al., 1993; Pahl and Baeuerle, 1997a; Paschen and Doutheil, 1999; Wang et al., 1996). This ER stress triggers several signaling pathways from the ER to the nucleus, including activation of transcription of specific genes such as GRP78, an ER- resident chaperone protein (Li et al., 1993), and activation of transcription factors such as NF-κB (Pahl and Baeuerle, 1997b). This ER stress can also cause apoptosis (Doutheil et al., 1997; Paschen and Doutheil, 1999). Therefore, an insult that causes prolonged depletion of neuronal ER Ca2+ stores can induce cell death by this mechanism.
We used several approaches to determine which of these two effects was responsible for OGD-induced death of SH-SY5Y cells. BAPTA-AM is trapped within the cytosol, where it is converted by esterases to BAPTA, which acts to chelate cytosolic free Ca2+ ([Ca2+]i). If OGD toxicity is secondary to an increase in [Ca2+]i, then BAPTA-AM should protect against OGD (Dyatlov et al., 1998; Tymianski et al., 1993). This was not the case, and in fact the higher concentration of BAPTA-AM was toxic. We previously reported that BAPTA-AM was also toxic to GT1–7 cells (Wei et al., 1998). One explanation for such toxicity is that the cytosolic chelation causes a shift in the balance of free Ca2+ between the ER and cytosolic compartments, further exacerbating ER Ca2+ depletion. Release of ER Ca2+ stores has also been shown to induce influx of extracellular Ca2+ by capacitative influx in most cells, including SH-SY5Y (Grudt et al., 1996; Putney and Bird, 1993; Wei et al., 1998). If this influx contributes to OGD-induced death, then its prevention should be protective. Treatment with ethyleneglycoltetracetic acid to chelate extracellular Ca2+ (McGinnis et al., 1999), or with lanthanum chloride to inhibit capacitative calcium influx channels (Grudt et al., 1996), each failed to protect against OGD-induced death. Ethyleneglycoltetracetic acid has been shown to induce apoptosis to SH-SY5Y cells by lowering [Ca2+]I (McGinnis et al., 1999), and also to exacerbate OGD toxicity in NG108–15 neuroblastoma-glioma hybrid cells (Morimoto et al., 1997). This effect could also be due to a shift in equilibrium of Ca2+ levels between extracellular and intracellular spaces, thereby depleting cellular Ca2+.
If increased [Ca2+]i did not mediate OGD-induced death, then it seems likely that the dantrolene protective effects were due to its ability to prevent a destructive depletion of ER Ca2+ stores. To obtain further evidence to support this conclusion, we used two approaches. First, we reasoned that if we could counteract the effects of ER Ca2+ depletion, we should protect against OGD-induced toxicity. One way to accomplish this would be to increase cytosolic Ca2+, and thus shift the equilibrium from the cytosol to the ER lumen. This was done by increasing extracellular Ca2+ levels, or by stimulating influx through voltage-sensitive calcium channels; both approaches gave significant protection. Because so much literature has documented the toxic effects of high cytosolic levels of Ca2+, such a finding may seem paradoxical. It is important to note that the protective effects were achieved at relatively low levels of supplementation, which presumably only produced modest increases in [Ca2+]i. Also, some of the treatments actually produced evidence of toxicity in control cells and evidence of protection in OGD-cells. This finding would make sense if OGD depleted ER and cellular Ca2+, in which case the supplementation would restore [Ca2+]i to near-normal levels in these cells, but might increase [Ca2+]i to abnormally high levels in control cells. This is consistent with the concept of the calcium set-point, whereby neuronal toxicity can be caused by [Ca2+]i levels that are too high or too low (Deckwerth and Johnson, 1993; McGinnis et al., 1999).
In addition to pharmacologic approaches, we used fluorescent indicators to measure to infer effects of OGD on ER Ca2+ and to measure [Ca2+]i. We found that thapsigargin-releasable Ca2+ stores were decreased to half that of controls by 5 hours, and remained at that level after 12 and 16 hours. Baseline cytosolic Ca2+ levels were slightly low at the earlier time points, and slightly high at the later time points. One interpretation of this finding is that OGD only became toxic when Ca2+ homeostasis mechanisms allowed cytosolic Ca2+ to increase to sufficiently high levels. However, it seems unlikely that an increase in [Ca2+]i from 50 to 60 nmol/L would be toxic to any cell, whatever the duration. The lack of protection from BAPTA-AM also argues against this interpretation.
If death was caused by ER Ca2+ depletion, why do cells not die after 5-hour OGD, when the depletion was clearly evident? The simplest explanation would be that this insult becomes toxic only after sufficient duration. These results are consistent with findings that treatment with drugs that reversibly inhibit the ER Ca2+-ATPase pump and thus rapidly deplete ER Ca2+ (e.g., cyclopiazonic acid) are toxic to SH-SY5Y cells, but only after exposure of several hours (Nguyen et al., 2002, in press). These findings are also consistent with results from Choi and colleagues that OGD-induced death in primary neuronal culture in the presence of glutamate antagonists was accompanied by decreased [Ca2+]i (Babcock et al., 1999), and could be inhibited by treatments to increase [Ca2+]i. Note that the apparent depletion of ER Ca2+ was only partial (approximately 50%, even as late as 16 hours). This lack of complete depletion may be a reason why a relatively long OGD exposure is needed to produce toxicity. It is also possible that detection of ER Ca2+ stores by this indirect method does not precisely reflect the changes in ER Ca2+ stores.
In summary, we have demonstrated that deprivation of oxygen and glucose, to mimic the insults occurring in cerebral ischemia, caused cell death in a neuronally derived cell line. In contrast to OGD-induced death in rat primary neuronal cultures, this response necessitated somewhat longer exposure, and was not caused by excitotoxicity. The OGD-induced death necessitated both oxygen and glucose deprivation. Three lines of evidence support a conclusion that depletion of ER Ca2+ stores plays a critical role in this model of cerebral ischemia. First, death was partially inhibited by dantrolene, which acts to block release of ER Ca2+ via the ryanodine receptor. Second, OGD caused a decrease in thapsigargin-releasable Ca2+ stores. Third, prevention of increased [Ca2+]i by several different pharmacologic approaches failed to protect against OGD, whereas treatments to increase [Ca2+]i levels and thereby restore ER Ca2+ stores were protective. This model should prove useful to further elucidate the mechanisms of, and potential therapies for, ischemic neuronal death.
Footnotes
Acknowledgments:
The authors thank Martin Bui and Lara Richmond for excellent technical assistance.