
Abstract
Forty rats were subjected to 3 hours of focal ischemia by occluding the left middle cerebral and left common carotid arteries. The propagation of recurrent depolarization around the ischemic core was analyzed using direct-current potential and NADH (reduced nicotinamide adenine dinucleotide) fluorescence images by irradiating the parietal-temporal cortex with ultraviolet light. Based on histological evaluation at direct-current recording sites, the total time of depolarization causing 50% neuronal injury was estimated to be 18.2 minutes. The sites showing recurrent depolarizations resulted in 23 ± 29% neuronal injury due to the short depolarization time, whereas the sites showing recurrent depolarizations and eventually persistent depolarization resulted in infarction. The NADH fluorescence images showed that recurrent depolarizations propagated along the margin of the ischemic core. In 85.9% of the recurrent depolarizations, the fluorescence disappeared without leaving any traces and did not affect the area of the ischemic core. However, in 47.5% of the animals, 14.1% of recurrent depolarizations merged with the ischemic core and increased the area by 6 ± 4 mm2. These findings suggest that recurrent depolarization increases the severity of neuronal injury but does not cause infarction by itself if persistent depolarization does not follow, and that the area of persistent depolarization is enlarged with 14.1% of recurrent depolarizations.
Keywords
In focal ischemia, the persistently depolarizing ischemic core is surrounded by a marginal zone called penumbra, in which neuronal cells are viable but nonfunctioning (Astrup et al., 1981). In 1983, recurrent depolarization similar to spreading depression in a waveform was found in the penumbra (Strong et al., 1983a, b ) and was suggested to contribute to the growth of infarct volume due to the shortage of oxygen supply during depolarization (Back et al., 1994). Because there is a positive relation between growth of infarct volume and frequency of recurrent depolarization (Chen et al., 1993; Otsuka et al., 2000), and because suppression of recurrent depolarization in the penumbra using glutamate antagonists [e.g., MK-801 (Iijima et al., 1992) and NBQX (Mies et al., 1994)] resulted in significant reduction of infarct volume, recurrent depolarization has been thought to be one of the major factors causing an increase in infarct volume during the acute stage of focal ischemia. Clinical trials have been performed to find pharmacologic treatments that reduce infarct volume by blocking the glutamate receptor without producing major side effects, such as psychotomimetic or psychostimulant effects (Albers et al., 1989; Gill, 1994; Mueller et al., 1999). Although the suppression of recurrent depolarization has been thought to be a rational approach for the treatment of acute focal ischemia, the direction and area of propagation is not clearly understood, and the dynamics of the growth of infarct volume due to the propagation of recurrent depolarization has not been elucidated in focal cerebral ischemia.
Nicotinamide adenine dinucleotide is an electron carrier in the mitochondrial respiratory chain. The reduced form (NADH) fluoresces blue light (460 nm) when excited with ultraviolet light (366 nm), whereas the oxidized form (NAD+) does not. Therefore, NADH fluorescence has been observed to elucidate the mitochondrial redox state both in vivo (Ince et al., 1992) and in vitro (Eng et al., 1989). Because membrane depolarization is accompanied by an increase in energy demand that leads to an accumulation of endogenous NADH in mitochondria, Strong et al. (1996) and Hashimoto et al. (2000) (in our laboratory) studied the dynamic changes in NADH fluorescence on the cortical surface associated with the propagation of membrane depolarization in vivo with the use of a charge-coupled device (CCD) camera in the cat and gerbil cerebral cortex, respectively.
In the present study, the dynamics of the growth of infarct volume due to the propagation of recurrent depolarization was examined using NADH fluorescence images and direct-current (DC) potential of the rat cerebral cortex. The relation between DC deflection and histologic outcome was also examined to determine the threshold of total depolarization time for neuronal injury in focal ischemia. A series of NADH fluorescence images, taken with an electrically cooled CCD camera (resolution, 80 × 124 μm) mounted on a surgical microscope, were constructed into a “pseudo movie” (Strong et al., 1996) for better visualization of the changes in NADH fluorescence with propagation of recurrent depolarization.
METHODS
Forty-three male spontaneously hypertensive rats (Charles River Japan, Yokohama, Japan), weighing 261 ± 32 g, were used in this study. The animals were fed ad libitum before the experiments. All experiments were performed in accordance with the National Institutes of Health Animal Care Guidelines and were approved by the Animal Research Control Committee of Okayama University Medical School.
General procedures
Anesthesia was induced with a mixture of 3% halothane in oxygen. After oral tracheal intubation, anesthesia was maintained by artificial ventilation (SN-480-7; Shinano, Tokyo, Japan) with 1% halothane in 30% oxygen balanced with nitrogen. A polyethylene catheter (PE50) was placed in the right femoral artery for continuous mean arterial blood pressure monitoring and blood sampling. Blood gases were measured (ABL4; Radiometer, Copenhagen, Denmark) and maintained within the normal range. As shown in Fig. 1, after placement in a stereotaxic apparatus (Narishige, Tokyo, Japan), a large cranial window (10 × 14 mm) was made on the left parietal-temporal bone. The dura was kept intact. To monitor the cortical depolarization associated with the initiation of focal ischemia, two glass microelectrodes (tip diameter, < 5 μm) (DC potential) were inserted in the cranial window at a depth of 750 μm through dural incisions. The positions of the electrodes were 3 mm anterior to the bregma and 1 mm and 2 mm lateral from the sagittal line (n = 10 and 5, respectively), on the bregma level and 1, 2, 3, 4, 5 and 7 mm lateral from the sagittal line (n = 6, 8, 7, 17, 14, and 8, respectively), and 5 mm posterior to the bregma and 1 mm lateral from the sagittal line (n = 5). To measure regional cerebral blood flow (CBF), a laser-Doppler flow probe (ALF2100, Advance, Tokyo, Japan) was placed adjacent to the distal DC electrode. Rectal temperature was monitored and maintained at 37.0 ± 0.5°C using a heated water blanket. Brain-surface temperature was maintained at 37.0 ± 0.5°C with a gentle flow of warmed saline (38.0 ± 0.5°C) that perfused over the skull surface.
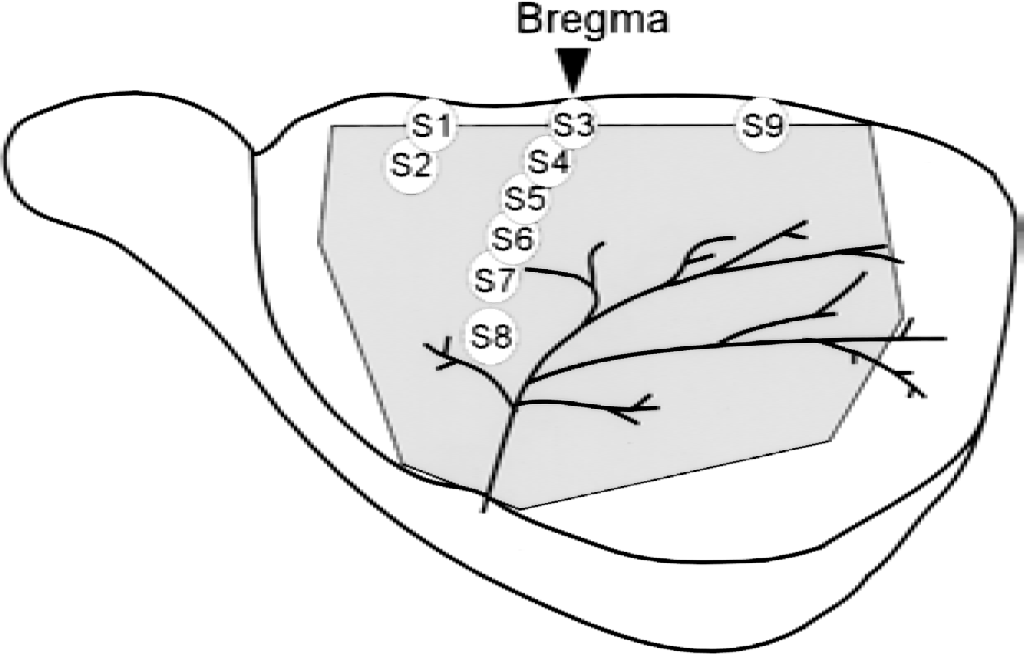
Location of direct-current recording sites. S1 and S2: 3 mm anterior to the bregma and 1 mm and 2 mm lateral from the sagittal line (n = 10 and 5, respectively). S3–S8: on the bregma level and 1, 2, 3, 4, 5, and 7 mm lateral from the sagittal line (n = 6, 8, 7, 17, 14, and 8, respectively). S9: 5 mm posterior to the bregma and 1 mm lateral from the sagittal line (n = 5). The shaded area represents the large cranial window (10 × 14 mm) made on the left parietal-temporal bone.
Surgical preparation for the initiation of focal cerebral ischemia was performed as described by Brint et al. (1988). A loose ligature was placed around the left common carotid artery through a medial cervical incision. The left middle cerebral artery was accessed by piercing dura inside the cranial window 0 to 1 mm above the rhinal fissure. Ischemia was initiated in 40 rats by tightening the left common carotid artery ligature and occluding the middle cerebral artery by lifting the vessel 1 mm above the cortical surface with an 80-μm stainless steel hook attached to a micromanipulator.
Reperfusion was initiated after 3 hours of focal ischemia. The adequacy of recirculation on release of middle cerebral and common carotid artery occlusion was assessed by direct visual observation with a surgical microscope and by observing the increase in laser-Doppler flowmetry. Three rats underwent a sham operation in which the hook was placed under the middle cerebral artery and removed without lifting the artery.
Sequential imaging of cortical NADH fluorescence
The technique for cortical NADH fluorescence imaging was described previously (Hashimoto et al., 2000). In brief, the cortical surface was illuminated using a 200-W Xenon lamp (Hamamatsu Photonics, Hamamatsu, Japan) equipped with a 366-nm bandpass filter (Asahi Spectra, Tokyo, Japan) to excite NADH in the cortical tissues. Images of NADH fluorescence were obtained by using an electrically cooled CCD camera (ST-6UV; SBIG, Santa Barbara, CA, U.S.A.) mounted on a surgical microscope with a 460-nm bandpass filter. The images (250 × 121 pixels, width × height) were taken at a rate of four images per minute, and each pixel corresponded to a 80 × 124-μm area of the parietal-temporal cortex. A CCD signal contains both the signal intensity of NADH fluorescence (460 nm) and also thermal and readout noises generated by the heat of a CCD detector and the readout process from CCD pixels, respectively, which are identical in each pixel under controlled temperature conditions. To exclude these noises from the original CCD data, the temperature of the CCD was maintained at 4°C using a thermoelectric cooler, and dark images (i.e., images obtained without the use of light) were obtained using the original function of the CCD camera. The dark image contains thermal and readout noises but no signals of light. The CCD controller then automatically subtracted these noises from the original CCD data in each pixel to acquire images of NADH fluorescence. Data regarding each pixel in each image of NADH fluorescence were divided by those of the control image obtained before the initiation of focal ischemia, and the percent change in NADH fluorescence was expressed in each pixel with 256 gray scales.
Histologic evaluation
Twenty-four hours after the onset of ischemia, all animals were deeply anesthetized with pentobarbital for perfusion-fixation. After inserting a cannula into the ascending aorta through the left ventricle, each animal was perfused by heparinized physiologic saline (20 u/mL) and 6% paraformaldehyde in 0.1 mol/L phosphate buffer (pH 7.4). After in situ fixation for 2 to 4 days, the brain of each animal was removed, paraffin-embedded, and sectioned coronally (thickness, 5 μm) at the levels of DC measurement. To identify the DC recording site, the location was recorded in a drawing in which arteries and veins inside the cranial window were schematized for each rat at the time of electrode insertion. Because arteries and veins on the cortical surface can move with swelling or shrinkage of the cerebral cortex, the DC recording site was identified after the perfusion-fixation. The sections were then stained with hematoxylin-eosin. Number of injuries appearing in pyramidal neurons in the fifth layer of the parietal-temporal cortex was counted at the sites of DC measurement by an observer who was blinded to the study protocol.
Statistical analysis
Values are expressed as mean ± SD. A logistic regression curve (probit curve) was used to evaluate the correlation of neuronal injury with the total time of depolarization. Because it is assumed that the probability of neuronal injury converges to 100% with a long duration of ischemic depolarization, linear regression was not used to evaluate the correlation. Instead, a probit curve was used, which expresses the probability of occurrence and is generally used to search for the median lethal dose in toxicology. The probit curve was drawn using personal-computer software (Microcal Origin 5.0; Microcal Software, Northampton, MA, U.S.A.). All statistical comparisons were performed with the Student's t-test. A level of P < 0.05 was considered to be significant in all statistical tests.
RESULTS
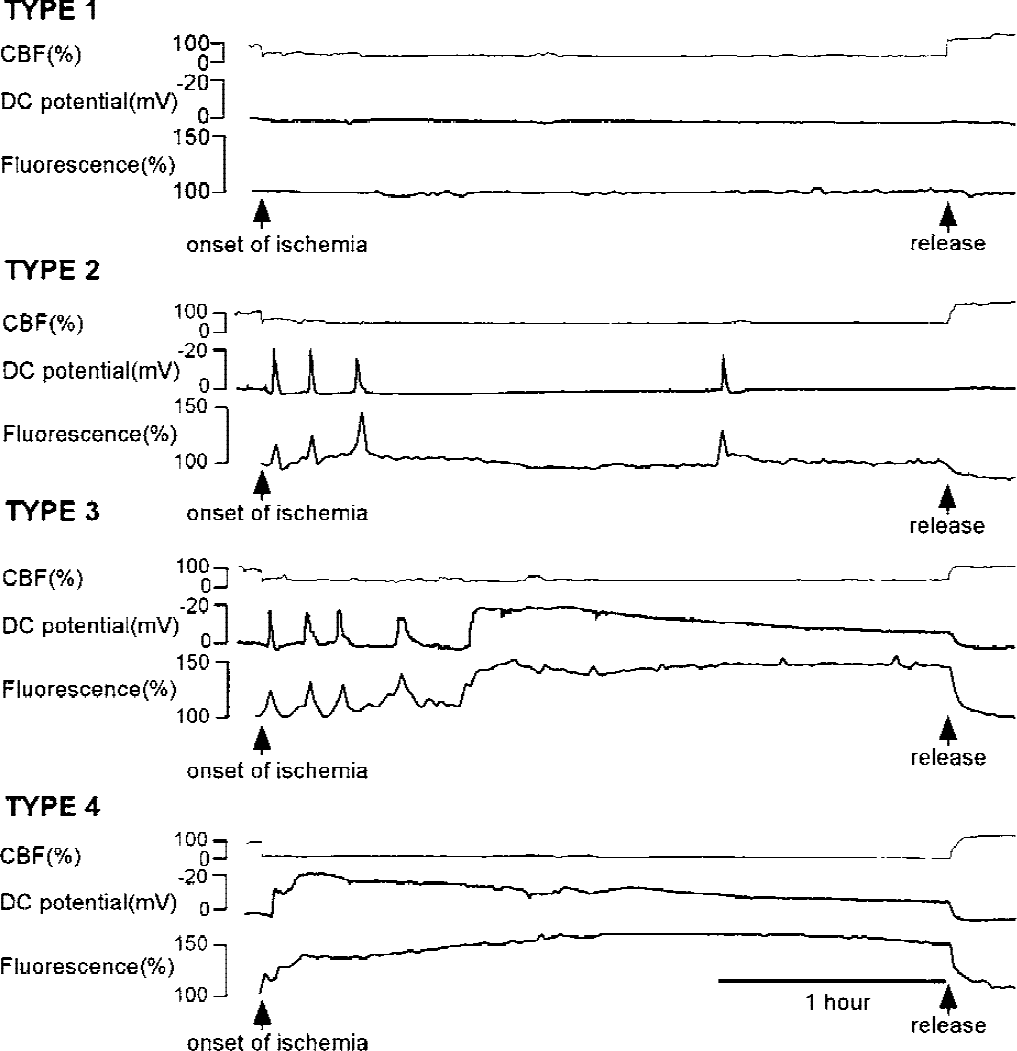
The values of physiologic parameters obtained before and at 1, 2, and 3 hours after the onset of focal ischemia are shown in Table 1. The values of all parameters were maintained within normal limits during the experimental period.
Physiological parameters before and at 1, 2, and 3 hours after the onset of ischemia
Values are mean ± SD.
PaCO2, partial pressure of carbon dioxide (arterial); PaO2, arterial oxygen pressure; MABP, mean arterial blood pressure; Hb, hemoglobin; BS, blood sugar.
Measurements of direct-current potential
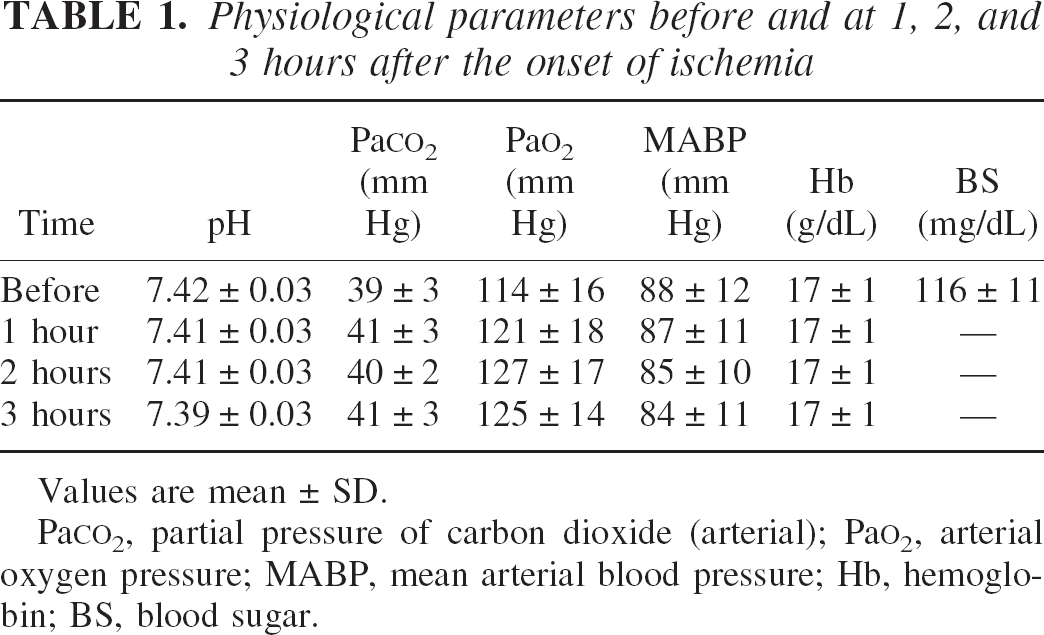
Direct-current potential was successfully measured at a total of 80 sites in 40 animals. As shown in Fig. 2, the DC recording was divided as follows into four types according to the pattern of the negative DC deflection: type 1, in which no DC deflection was observed during the 3-hour ischemic period (n = 5); type 2, in which the DC potential showed recurrent depolarization during the 3-hour ischemic period (n = 46); type 3, in which the DC potential showed recurrent depolarization and eventually persistent depolarization (n = 9); and type 4, in which persistent depolarization was observed throughout the 3-hour ischemic period (n = 20). A summary of DC potentials at the recording sites is presented in Table 2.
Direct-current (DC) recordings were classified into four of the following groups: type 1, in which no DC deflection was observed; type 2, in which DC potential showed recurrent depolarization; type 3, in which DC potential showed recurrent depolarization and eventually persistent depolarization; and type 4, in which persistent depolarization was observed. Changes in NADH fluorescence and cerebral blood flow were also measured adjacent to the DC electrode. The waveform of NADH fluorescence was analogous to that of the DC potential. Cerebral blood flow was stable and was not affected by the occurrence of recurrent depolarization.
Number of DC-deflection types in each recording site
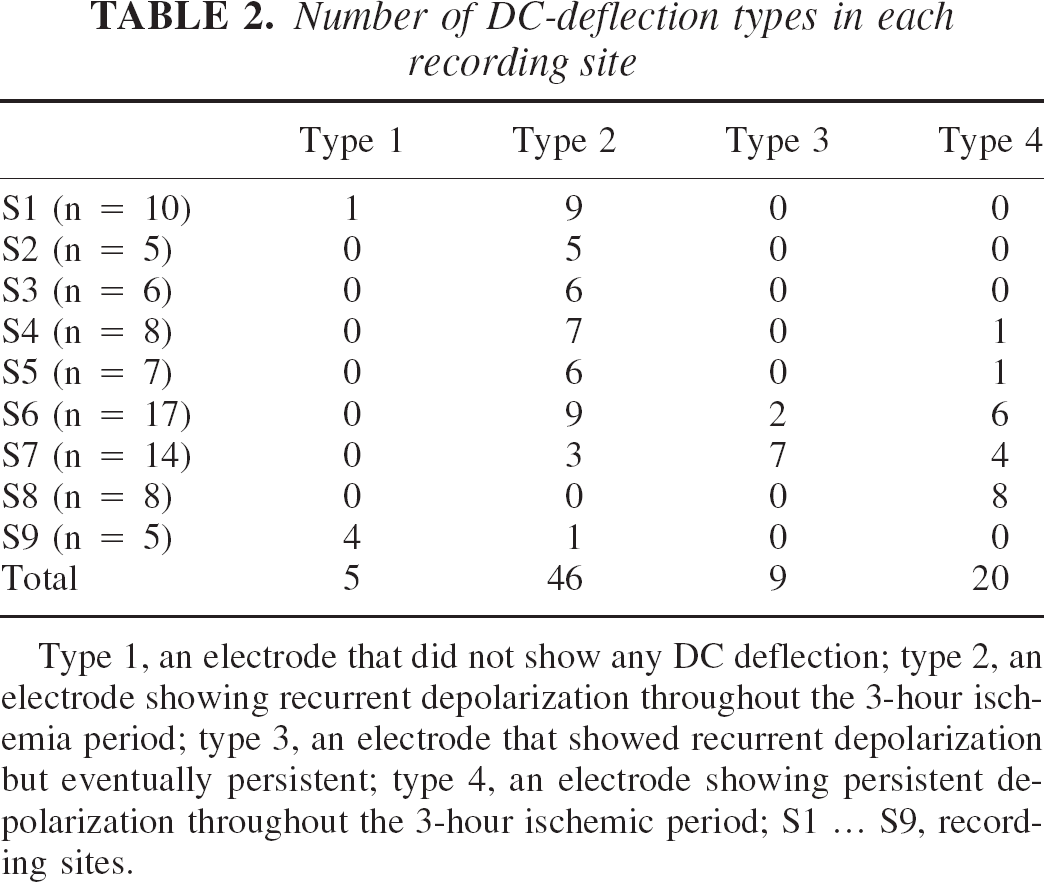
Type 1, an electrode that did not show any DC deflection; type 2, an electrode showing recurrent depolarization throughout the 3-hour ischemia period; type 3, an electrode that showed recurrent depolarization but eventually persistent; type 4, an electrode showing persistent depolarization throughout the 3-hour ischemic period; S1 … S9, recording sites.
Figure 3A shows the close relation between total time of depolarization during the 3-hour ischemic period and histologic outcome at DC recording sites, as determined by a logistic regression curve (probit curve, r2 = 0.71, P < 0.0001). Using the regression curve, the total times of depolarization (with a 95% confidence interval) causing ischemic cell change in 30%, 50%, and 70% of the pyramidal neurons in the fifth layer of the parietal-temporal cortex were estimated to be 12.9 (9.9–15.2), 18.2 (15.8–21.7) and 23.4 minutes (20.5–29.3 minutes), respectively. The depolarization time at sites that showed recurrent depolarization (type 2) during the 3-hour ischemic period rarely exceeded 18.2 minutes (only 5 of 46 sites showed more than 18.2 minutes of depolarization time). The rate of damaged neurons (damage was characterized by eosinophilic cytoplasm and pyknotic nuclei) at type 2 sites was 23 ± 29% (median = 6.1%). In contrast, all of the sites that persistently depolarized (type 4) or eventually depolarized (type 3) during the 3-hour ischemic period had a long depolarization time (> 69 minutes) and resulted in infarction (100% neuronal damage).
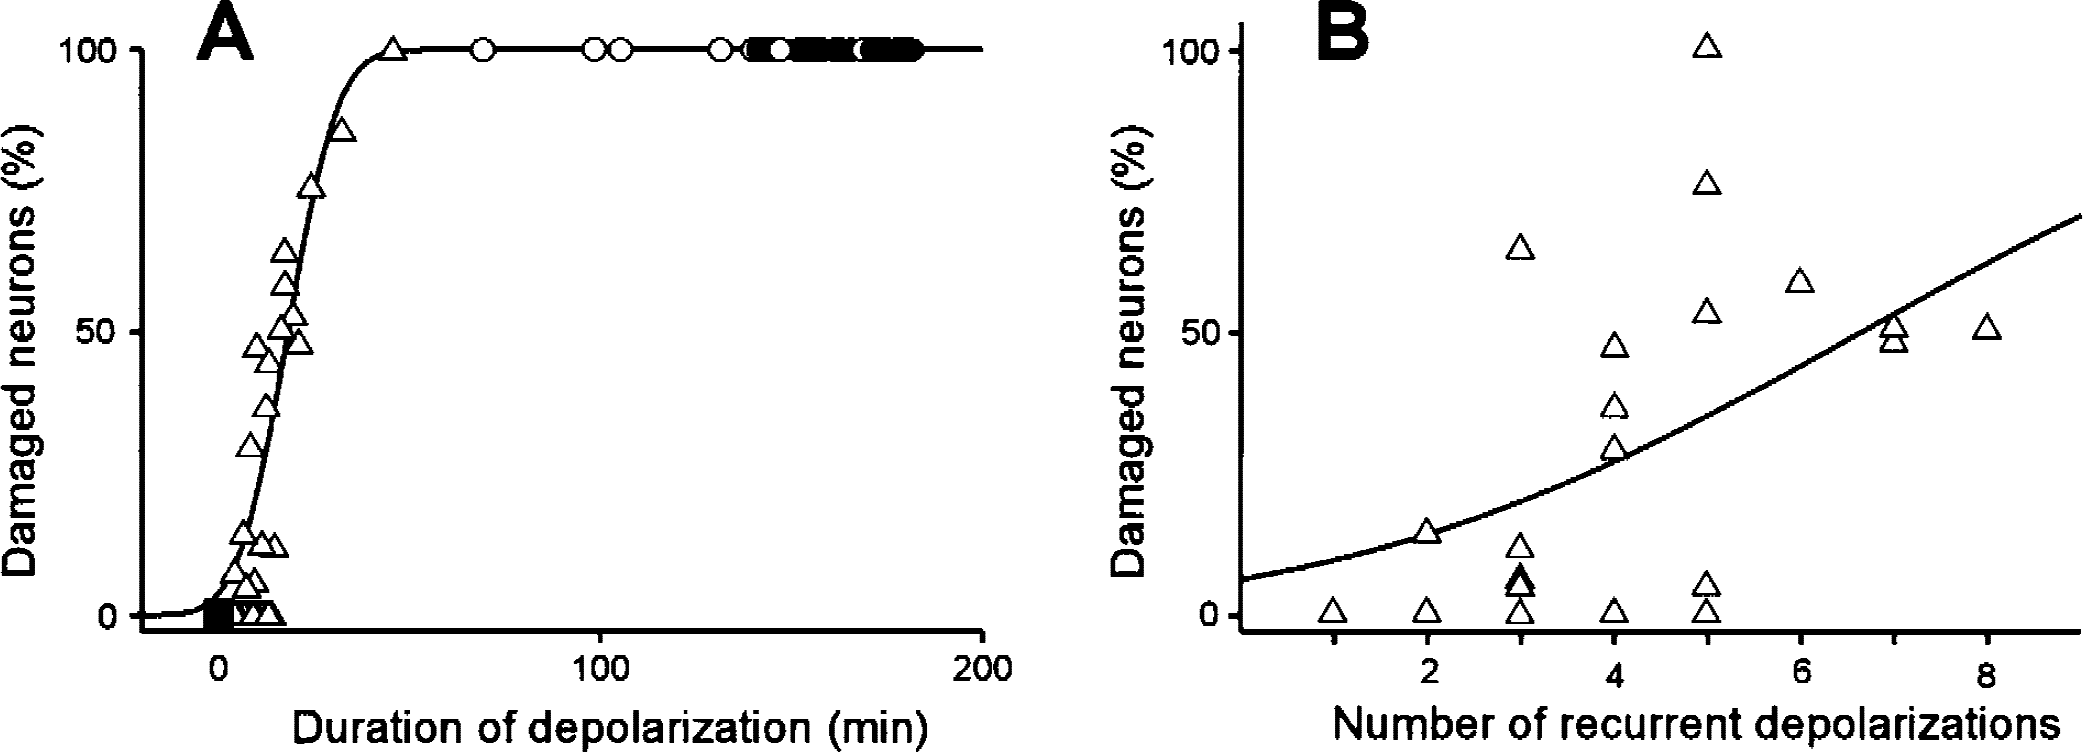
Percentage of damaged pyramidal neurons at the direct-current (DC) recording site in the fifth layer of the parietal-temporal cortex. Filled squares, open triangles, open circles, and filled circles represent type 1, 2, 3, and 4 DC recordings, respectively.
Figure 3B shows the relation between number of recurrent depolarizations and histologic outcome at type-2 DC recording sites (n = 46). The logistic regression curve exhibited a relatively poor relation between the number of depolarizations and probability of neuronal damage (r2 = 0.28, P = 0.04) compared with that of the total time of depolarization. The number of depolarizations causing ischemic cell change in 50% of the pyramidal neurons in the fifth layer of the parietal-temporal cortex was estimated to be 6.6.
Measurements of NADH fluorescence and cerebral blood flow
In Fig. 2, changes in NADH fluorescence in an area (3 × 3 pixels, 240 × 372 μm) adjacent to the DC recording site are plotted with changes in DC potential. At type-2 DC recording sites (n = 46), the waveform of NADH fluorescence was analogous to that of the DC potential (Fig. 2, type 2). The peak value of NADH fluorescence (percent change in control) was closely related to the magnitude of negative DC deflection (Fig. 4, r2 = 0.73, P < 0.0001). At type-4 DC recording sites (n = 20), although the magnitude of negative DC deflection gradually decreased due to the diffusion of extracellular electrolytes, the signal intensities of NADH fluorescence during persistent depolarization were stable and were 146 ± 13%, 151 ± 14%, and 154 ± 15% at 1, 2, and 3 hours after the onset of ischemia, respectively. Because the lowest value of NADH fluorescence in the persistently depolarized ischemic core was 120% of the control level, the area that persistently showed NADH fluorescence of more than 120% of control level was considered to be the ischemic core in the present study.
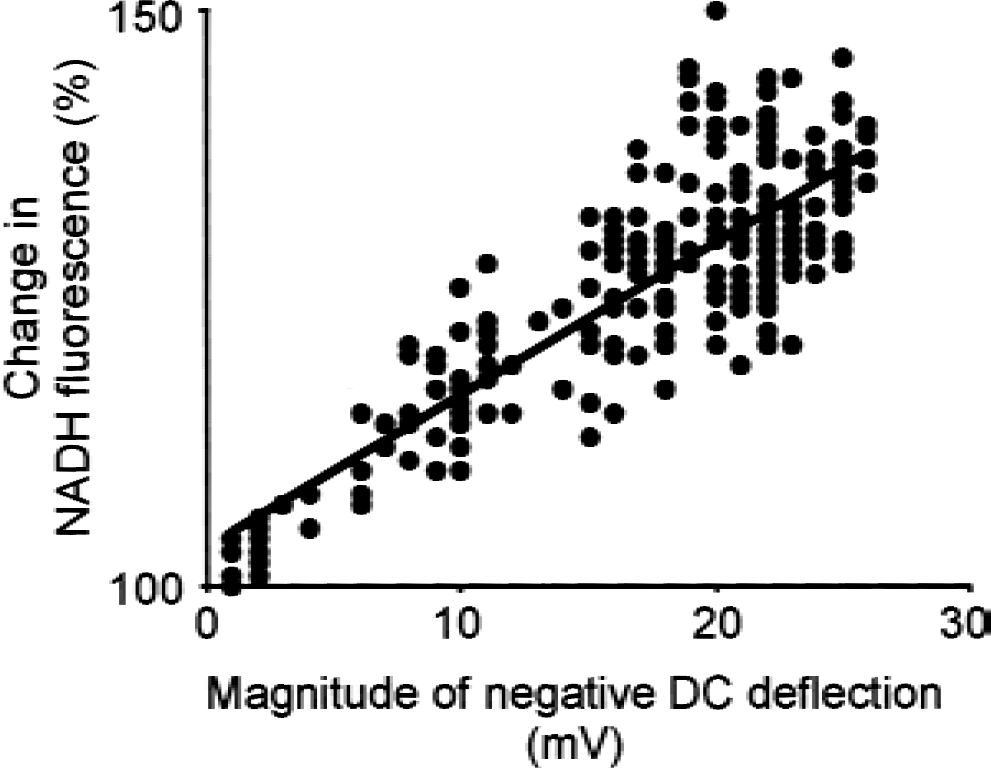
Close relation between changes in NADH fluorescence and magnitude of negative direct-current deflection (r2 = 0.73, P < 0.0001).
Cerebral blood flow was observed using a laser-Doppler flowmeter placed adjacent to the distal DC electrode, and was successfully measured at 36 sites. As shown in Fig. 2, CBF was almost stable in each site during the 3-hour ischemic period. Although a minimal increase in CBF synchronizing to the depolarization was observed in limited cases (in which recording was made at the outer limit of the ischemic periphery) CBF was not generally affected by the propagation of recurrent depolarization.
In sham-operated rats, no changes were observed in DC potential, NADH fluorescence, and CBF during the 3-hour observation period. No neuronal damage was detected by microscopic observation 24 hours later.
Dynamic changes in NADH fluorescence
After the initiation of ischemia, formation of the ischemic core was observed using a series of NADH fluorescence images. As shown in Fig. 5A, the ischemic core was rapidly formed from the proximal portion of the middle cerebral artery. The areas of the ischemic cores that initially formed with the initiation of ischemia varied in the animals. Propagation of recurrent depolarization (Figs. 5B, 5C) was observed as a wave of high signal intensity that originated at the edge of the ischemic core and moved at a speed of 2 to 4 mm per minute. Recurrent depolarization neither spread straight nor propagated through the entire hemisphere, but moved along the round margin of the ischemic core at a width of 2–4 mm. Unexpectedly, some of the recurrent depolarizations made one revolution around the ischemic core (Fig. 5C).
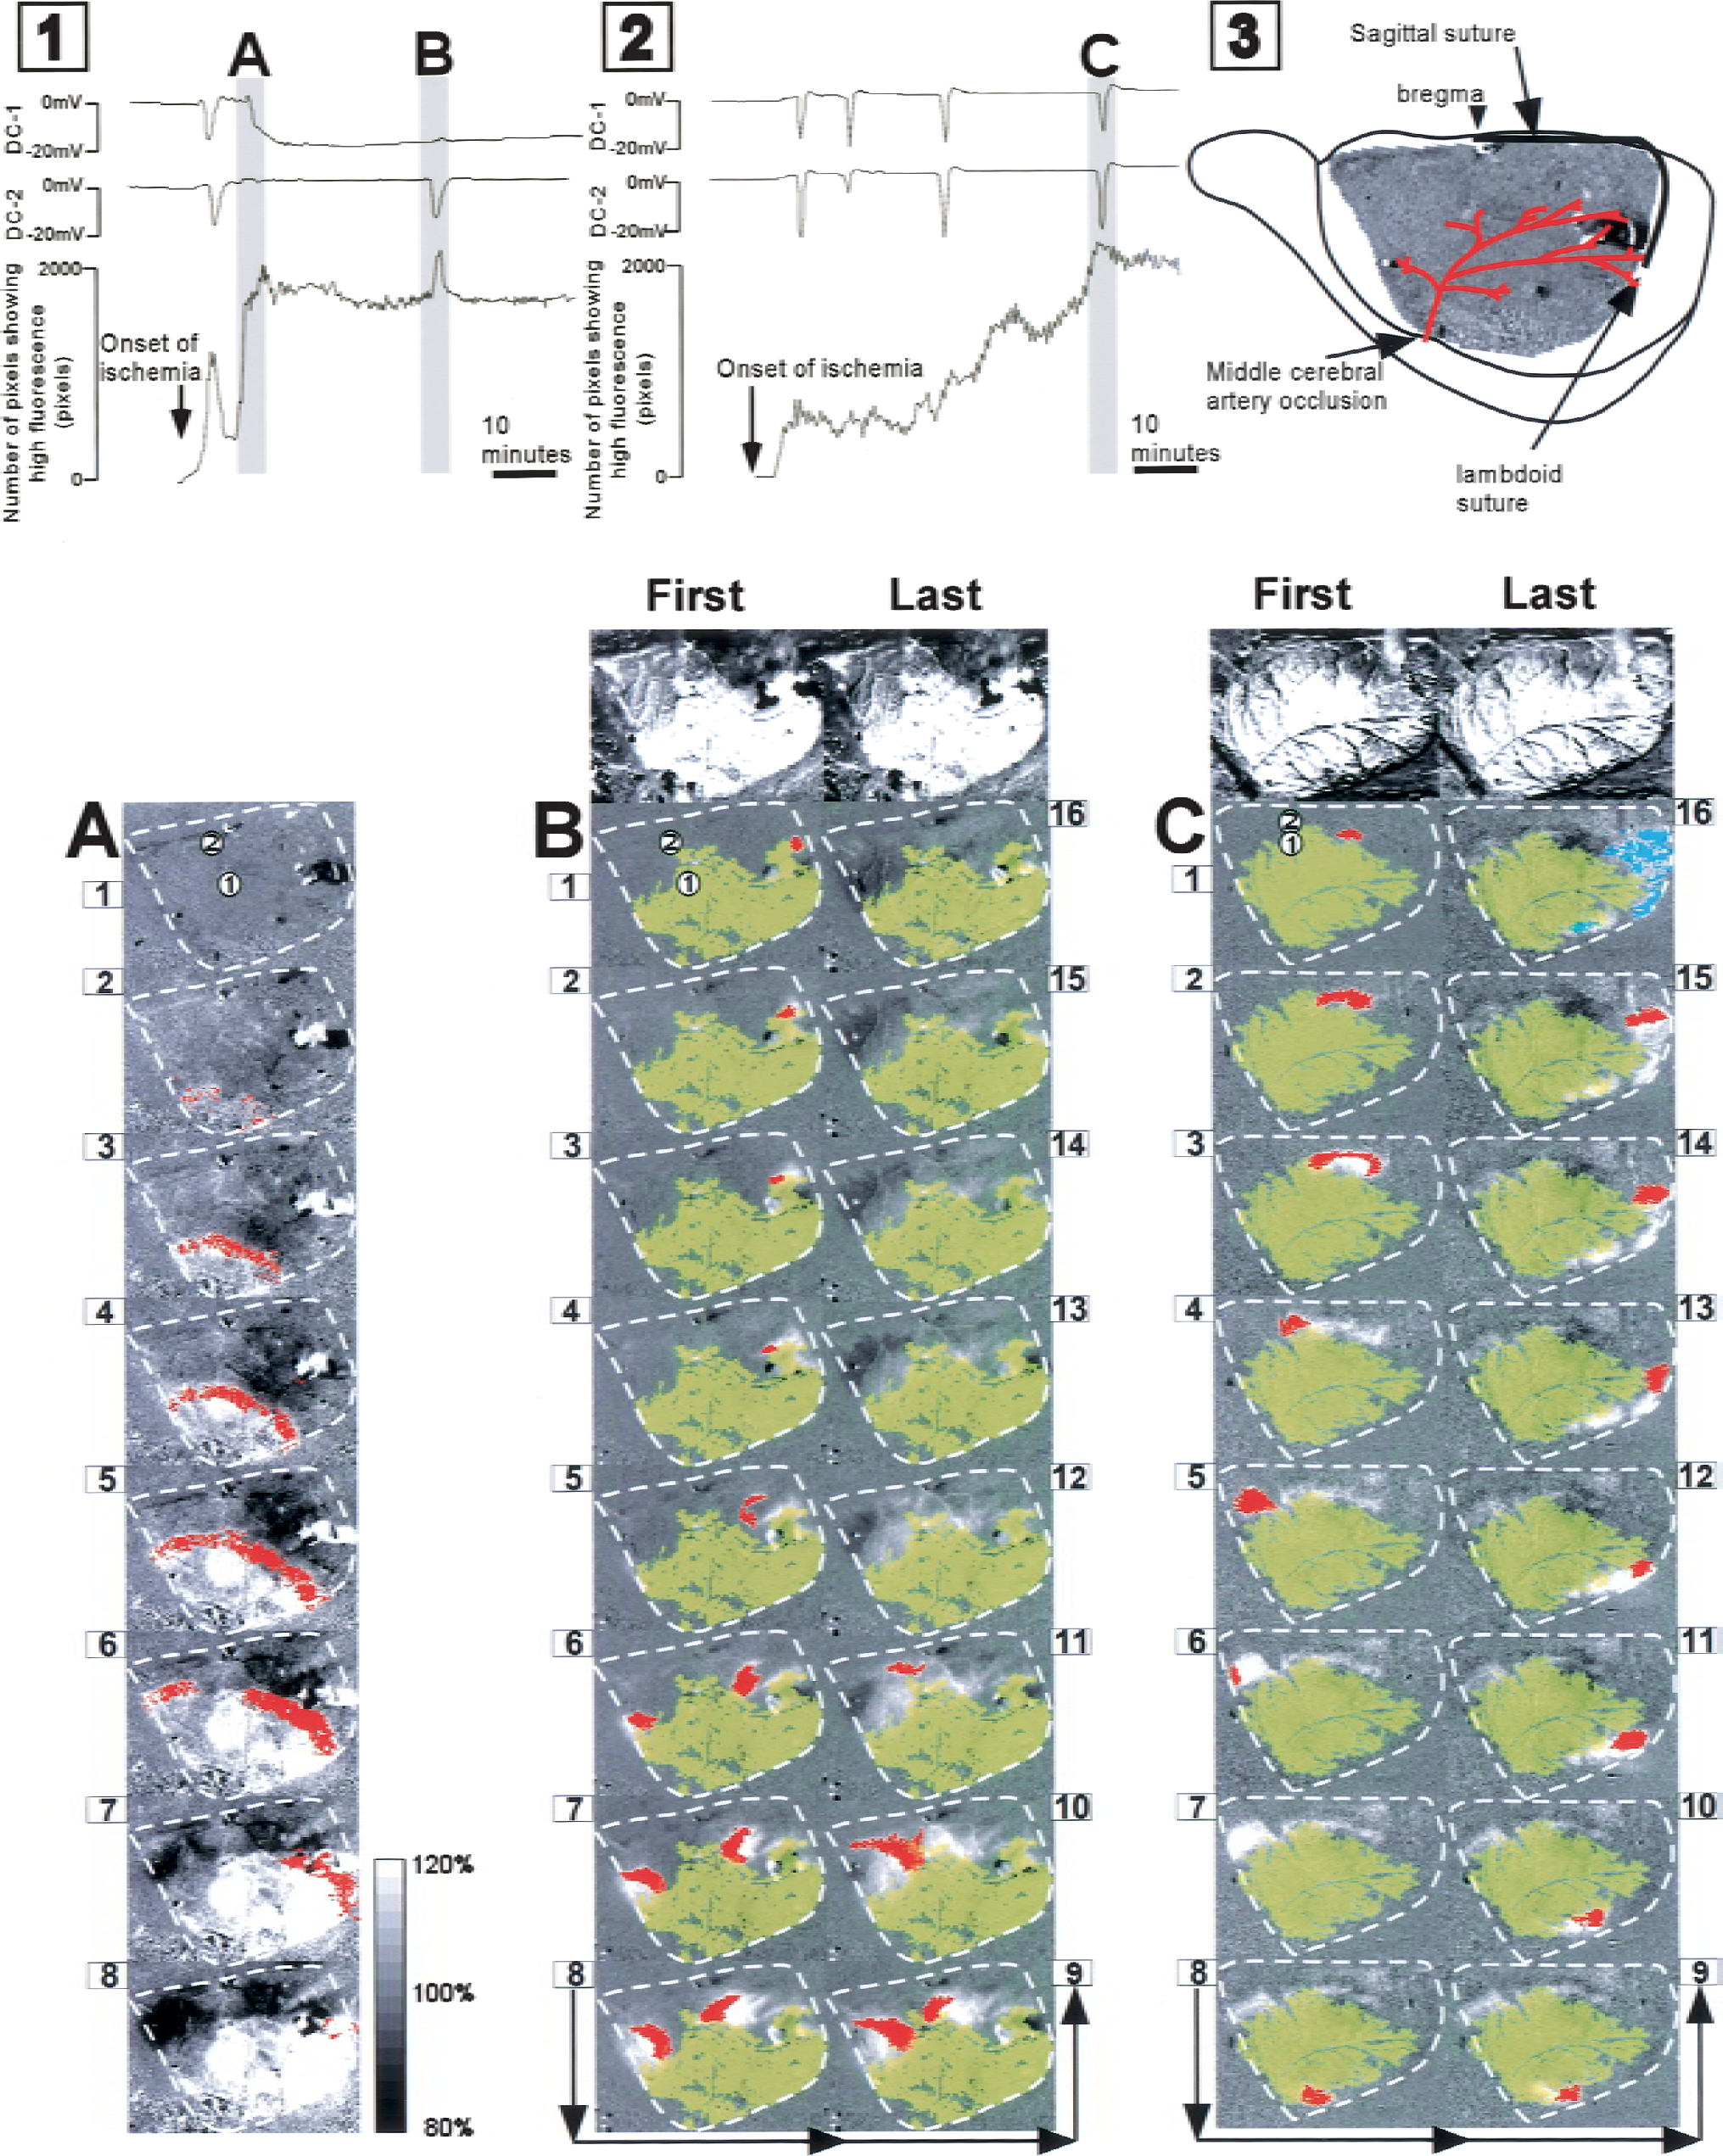
Sequences of NADH fluorescence images. Figure 1 and 2 are representative polygraphs showing direct-current (DC) potentials and the number of pixels showing more than 120% NADH fluorescence. An arrangemental schematic of the cranial window is presented in Fig. 5–3.
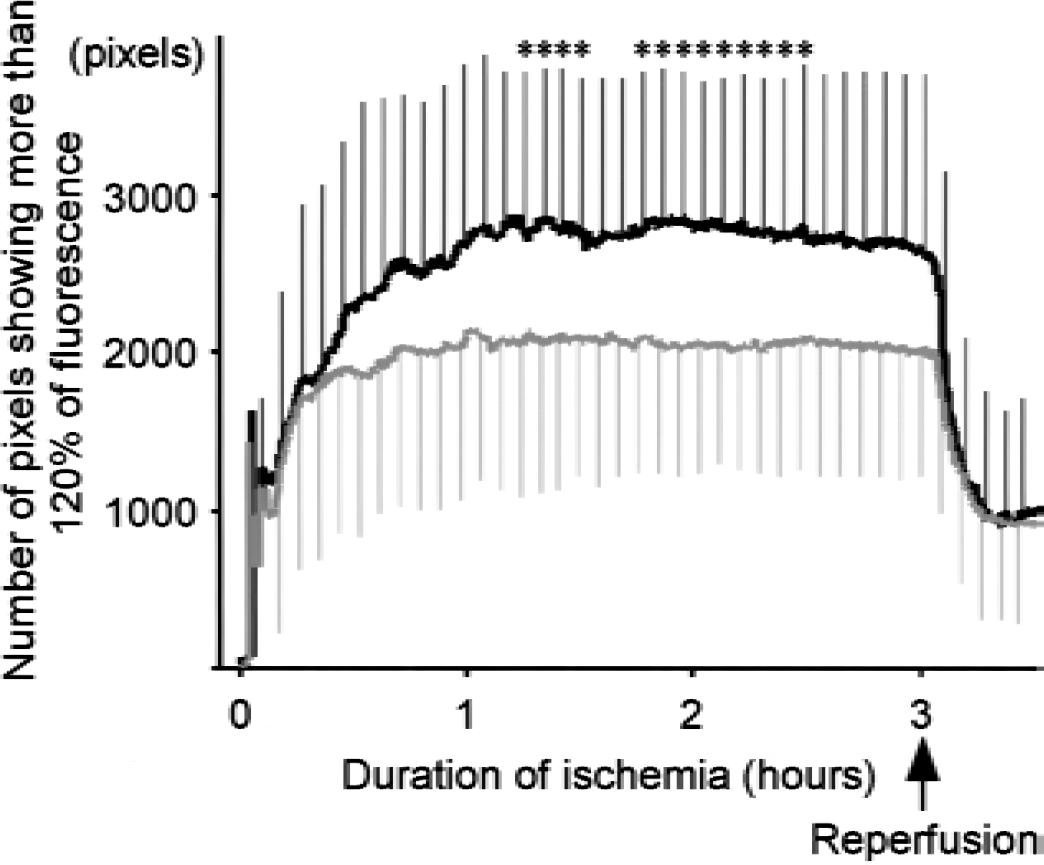
Growth of the ischemic core. The number of pixels showing more than 120% NADH fluorescence was counted as the area of the ischemic core. The black line represents the animals in whom recurrent depolarization did not disappear and merged with the ischemic core. The gray line represents the animals in which recurrent depolarizations disappeared without leaving any traces. * P < 0.05.
Using NADH fluorescence images, a total of 206 recurrent depolarizations were detected in 40 animals during the 3-hour ischemic period. In 162 of the 206 recurrent depolarizations, a wave of high signal intensity moved over the DC recording sites and simultaneously induced a negative DC deflection. However, no DC deflection was observed without an accompanying increase in NADH fluorescence.
Each wave of NADH fluorescence (recurrent depolarization) was classified into two types according to the consequence of recurrent depolarization. As shown in Fig. 5B, 177 (85.9%) of the recurrent depolarizations disappeared without leaving any traces and did not affect the area of the ischemic core. As shown in the polygraph in Fig. 5, –Fig. 1, the number of pixels showing more than 120% of the control level of NADH fluorescence transiently increased with the propagation of recurrent depolarization, but returned to the original level thereafter. In contrast, a part of the NADH fluorescence did not disappear and eventually merged with the ischemic core in 29 (14.1%) of the recurrent depolarizations (Fig. 5C). The increase in the area of the ischemic core with each recurrent depolarization was 621 ± 402 pixels (6 ± 4 mm2). This type of recurrent depolarization was observed in 19 (47.5%) of the animals used in the present study. As shown in the polygraph in Fig. 5–2, the number of pixels showing more than 120% of the control level of NADH fluorescence increased with the propagation of recurrent depolarization, suggesting an increase in the area of the ischemic core.
Growth of the ischemic core
In the animals (n = 19) in which recurrent depolarization merged with the ischemic core, the area of the ischemic core increased during the first 60 minutes, and the maximum level was maintained thereafter (2,780 ± 947 pixels, 28 ± 9 mm2, measured at 2 hours after the onset of ischemia) (Fig. 6). In contrast, the animals (n = 21) in which recurrent depolarization did not affect the area of the ischemic core showed growth of the ischemic core during the first 40 minutes of ischemia. The area of the ischemic core (2,058 ± 817 pixels, 20 ± 8 mm2, measured 2 hours after the onset of ischemia) was significantly smaller than that in the former group (P = 0.02).
DISCUSSION
In the present study, the signal intensity of NADH fluorescence was related to the magnitude of DC deflection. Because an increase in energy demand for the restoration of ion homeostasis is related to the magnitude of DC deflection, a large DC deflection may initiate a large amount of glycolysis and lead to an increase in NADH levels in mitochondria. In this context, Strong et al. (1996) and Hashimoto et al. (2000) (in our laboratory) observed an increase in NADH fluorescence during the propagation of recurrent depolarization and that of spreading depression in the cat and gerbil, respectively. The latter group also assayed the content of NADH at DC recording sites and found that the NADH content increased to up to 230% of the control level 15 seconds after the onset of depolarization.
The signal intensity of NADH fluorescence in vivo can, to various degrees, be affected by numerous factors other than changes in NADH content (e.g., changes in hemoglobin concentration, scattering of light, the ratio of oxyhemoglobin to deoxyhemoglobin, and the ratio of protein-binding NADH to free NADH). Although we expected that changes in CBF would affect the signal intensity of NADH fluorescence to a large degree at the onset of ischemia, NADH fluorescence was changed only in the vicinity of the middle cerebral artery (data not shown). Because the CBF as measured by laser-Doppler flowmeter was greatly reduced with the initiation of ischemia, the small effects on NADH fluorescence suggest that the rate of blood flow (but not blood volume in the cerebral cortex) was reduced with the initiation of ischemia.
With the use of a regression curve, the total depolarization time causing 50% of neuronal damage was estimated to be 18.2 minutes. Because the regression curve showed a high regression coefficient (r2 = 0.71), the total time of depolarization seems to have been an important factor determining the severity of ischemic damage during the 3-hour ischemic period. Interestingly, the current estimation is close to that in a previous study performed in our laboratory in which four-vessel occlusion was used instead of focal ischemia, and in which the duration of depolarization for neuronal injury in 50% of neurons in the parietal cortex in that study was estimated to be 20.3 minutes (Li et al., 2000). Although there are differences between the durations of ischemia (i.e., 3 hours vs. 20 minutes) and between residual blood flows (i.e., > 19 ± 4 mL·100 g−1 ·minute−1 (Brint et al., 1988) vs. 4 mL · 100 g−1 · minute−1 (Bromont et al., 1989)) in the ischemia models used in the current study and in the previous study, the similarity in these two estimations imply that the duration of derangement of ion homeostasis involves a common mechanism for neuronal injury in focal and global ischemia. Further experiments are needed to elucidate this mechanism.
Although numerous studies (Iijima et al., 1992; Chen et al., 1993; Mies et al., 1993; Mies et al., 1994; Dijkhuizen et al., 1999; Otsuka et al., 2000) have shown that recurrent depolarization causes an increase in infarct volume, it is not clear whether the propagation of recurrent depolarization causes infarction without triggering persistent depolarization. In the present study, the site of recurrent depolarization (type 2) showed a short depolarization time (rarely exceeding 18.2 minutes) during the 3-hour ischemic period and resulted in 23 ± 29% neuronal injury (Fig. 3). In contrast, the site that initially showed recurrent depolarization and then changed to persistent depolarization (type 3), suggesting involvement in the ischemic core, showed a long depolarization time and resulted in infarction (100% neuronal damage). These results suggest that the propagation of recurrent depolarization increases the severity of neuronal injury but does not increase the area of infarction if persistent depolarization does not follow. Consistent with our observation, Back et al. (1996), who elicited spreading depression at the ischemic periphery using an electrical stimulator, observed that the area of neuronal injury is enlarged with the initiation of spreading depression. The volume of total ischemic injury (including infarct volume) was closely related to the integrated magnitude of the DC deflection curve.
Despite the pathological importance of recurrent depolarization, the direction and area of propagation has not been completely elucidated. Only Strong et al. (1996) have shown, using NADH fluorescence, that recurrent depolarization is initiated at the edge of the ischemic core and propagates throughout the periinfarct zone in the cat cerebral cortex. The present study showed that recurrent depolarization propagated along the margin of the ischemic core and sometimes made one revolution around the ischemic core (Figs. 5B, 5C). Because spreading depression, which is similar to recurrent depolarization in terms of waveform, is known to propagate straight over the entire hemisphere (Hashimoto et al., 2000), the round propagation of recurrent depolarization was unexpected. It is known that increases in glutamate and potassium are related to the mechanism of the propagation of spreading depression (Marrannes et al., 1988). Because the concentration of glutamate (Takagi et al., 1994) and that of potassium (Sick et al., 1998) are higher in the penumbral area than those outside the penumbra, these factors may be involved in the mechanisms of round propagation of recurrent depolarization.
In the present study, 85.9% of the recurrent depolarizations (Fig. 5B) disappeared without leaving any traces. However, the remaining 14.1% of the recurrent depolarizations (Fig. 5C) merged with the ischemic core and enlarged its area in 47.5% of the experimental animals. Because changes in NADH fluorescence are closely related to the magnitudes of negative DC deflection, these data imply that 14.1% of recurrent depolarizations initiate persistent depolarization at the margin of the ischemic core and contribute to the enlargement of the persistently depolarized ischemic core. The area of the ischemic core in these 47.5% of animals was 8 mm2 larger than that in the other animals. The difference in the areas of the ischemic core indicates that the cortical lesion area is increased with the fusion of 14.1% of recurrent depolarizations with the ischemic core. Consistent with this finding, Busch et al. (1996), who elicited spreading depression in the ischemic hemisphere by microinjection of potassium acetate and monitored the cortical lesion area using diffusion-weighted magnetic resonance imaging, observed that the increase in the lesion area is induced synchronously with the elicitation of spreading depression and is attenuated with the administration of a glutamate antagonist.
In the present study, CBF was almost stable in the ischemic core and in the ischemic periphery during the ischemic period, and was not generally affected by the propagation of recurrent depolarization (Fig. 2). Therefore, it is unlikely that the decrease in CBF is related to the mechanism by which 14.1% of the recurrent depolarizations did not disappear and merged with the ischemic core. Although recurrent depolarization increases energy demand to restore ion homeostasis, energy supply is severely curtailed in the ischemic periphery due to the limitation of CBF. Because tissue-oxygen pressure (Back et al., 1994) and regional glucose content (Takeda et al., 1993) are decreased by the propagation of recurrent depolarization, it is more likely that the increase in oxygen and glucose consumption to meet the energy demand triggers a collapse of the energy balance in the marginal zone. Consistent with this notion, Sunami et al. (2000) demonstrated in our laboratory that 2-hour administration of hyperbaric oxygen (100% oxygen, 3 ATM absolute), initiated 10 minutes after the onset of ischemia reduces infarct volume by 18% in rats, with a 20% increase in oxygen supply to the ischemic periphery (Sunami et al., 2000).
The cortical NADH fluorescence used in the current study was useful for real-time monitoring of the growth of the ischemic core. The area of the ischemic core reached a maximum level within 60 minutes after the onset of ischemia. Consistent with this finding, Kohno et al. (1995), who observed diffusion-weighted magnetic resonance images in rat focal ischemia that enabled detection of the area causing membrane depolarization, found that the threshold for high signal intensity increases from 34 to 41 mL·100 g−1 ·minute−1 between 30 minutes to 2 hours after the onset of ischemia. These investigators suggested that the area of infarct core increases rapidly during the first 2 hours.
In conclusion, the propagation of recurrent depolarization and growth of the ischemic core were examined using DC potential recordings and images of cortical NADH fluorescence. The histologic outcome at the DC recording site was closely related to the total time of depolarization, and the time of depolarization causing 50% neuronal damage was estimated to be 18.2 minutes. Because the site of recurrent depolarization showed a short depolarization time (rarely exceeding 18.2 minutes), it is thought that the propagation of recurrent depolarization increases the severity of neuronal injury but does not increase the area of infarction if persistent depolarization does not follow. The images of NADH fluorescence showed that recurrent depolarization propagated along the margin of the ischemic core with a width of 2 to 4 mm, and that 14.1% of recurrent depolarizations merged with the ischemic core and enlarged that area in 47.5% of the animals. These recurrent depolarizations may contribute to the growth of infarct volume by increasing the area of the ischemic core.