
Abstract
The coupling of electrical activity in the brain to changes in cerebral blood flow (CBF) is of interest because hemodynamic changes are used to track brain function. Recent studies, especially those investigating the cerebellar cortex, have shown that the spike rate in the principal target cell of a brain region (i.e. the efferent cell) does not affect vascular response amplitude. Subthreshold integrative synaptic processes trigger changes in the local microcirculation and local glucose consumption. The spatial specificity of the vascular response on the brain surface is limited because of the functional anatomy of the pial vessels. Within the cortex there is a characteristic laminar flow distribution, the largest changes of which are observed at the depth of maximal synaptic activity (i.e. layer IV) for an afferent input system. Under most conditions, increases in CBF are explained by activity in postsynaptic neurons, but presynaptic elements can contribute. Neurotransmitters do not mediate increases in CBF that are triggered by the concerted action of several second messenger molecules. It is important to distinguish between effective synaptic inhibition and deactivation that increase and decrease CBF and glucose consumption, respectively. In summary, hemodynamic changes evoked by neuronal activity depend on the afferent input function (i.e. all aspects of presynaptic and postsynaptic processing), but are totally independent of the efferent function (i.e., the spike rate of the same region). Thus, it is not possible to conclude whether the output level of activity of a region is increased based on brain maps that use blood-flow changes as markers.
Functional activation may be defined as any change of brain metabolism or perfusion that accompanies variations in neuronal activity. The literature on functional activation is overwhelming, but the several reviews cover some of the interesting aspects of the field (Rosenblum, 1965; Lassen et al., 1978; Lou et al., 1987; Roland, 1993; Jueptner and Weiller, 1995; Villringer and Dirnagl, 1995; Raichle, 1998; Tagamets and Horwitz, 1998; Iadecola, 1998). A major limitation of functional neuroimaging data interpretation is a shortage of knowledge about the types of nerve-cell activity that generate increases of blood flow, or oxygen and glucose consumption. By analogy to techniques that record neuronal activity by measuring electrical and magnetic variables, one can define a “direct problem” as the changes in nerve-cell activity that support changes of blood flow or metabolism. The “inverse problem” may be defined as the difficulties in defining the types of nerve-cell activity that underlie a given change of blood flow or metabolism, given knowledge about the neuronal circuits in which these changes have occurred. Clearly, the direct problem needs to be addressed before the inverse problem can be approached. This review describes some of the results that others and we describe in addressing the direct problem.
We are, by pragmatic means, slaves of the available techniques. The invention of laser-Doppler flowmetry and the application of this technique to brain circulation have bridged the temporal gap between vascular physiology and electrophysiology (Mathiesen et al., 1998). Thus, it has become possible to relate changes of neuronal function as indicated by single-cell recordings or field potentials to changes of blood flow in real time within the same small brain region. Activated regions, which are commonly outlined in brain maps as colored spots, suggest to most readers that a number of functional elements have become more active, and that communication takes place between different brain regions. Functional connectivity maps are created on this basis. However, several lines of evidence speak against the idea that spiking activity triggers the changes of function used in functional neuroimaging. Spike activity in unmyelinated nerve fibers contributes little to the overall energetic costs of brain function, which relates more closely to synaptic function (Creutzfeldt, 1975). However, renewed theoretical calculations suggest that the high signaling costs in the cortex are dominated by action-potential propagation along axon collaterals and postsynaptic currents (Laughlin, 2001).
Information processing associated with synaptic activity is complicated. Neurons in central nervous system vertebrate have complex membrane properties that are nonhomogeneously distributed over the somadendritic membrane, and that characterize each class of neurons (Llinas, 1988; Steriade et al., 1990; Creutzfeldt, 1995). Therefore, different categories of nerve cells respond differently to different synaptic inputs, and the same cell may be part of several neuronal circuits with different signaling costs and vascular changes. This inherent complexity of the central nervous system at work forced us to look for a brain region in which activation could be studied in neuronal circuits with a known functional anatomy (i.e., known input functions, target cells, transmitters, postsynaptic receptors, and output functions). The cerebellar cortex in rats was chosen for that purpose.
We hypothesized that passive and active synaptic events triggered and determined the amplitude of the CBF increase. These events include the interaction of the neurotransmitter with the receptor, external and internal gating of ion conductances, the production of second messengers (including calcium), the generation of action potentials, neurotransmitter reuptake, and recovery of intracellular and transmembrane ionic gradients. We expected that the relative requirements of these events in terms of energy metabolism and blood flow differed among neuronal circuits and regions depending on the properties of the neuronal circuits stimulated. Complementary studies of neurovascular coupling mechanisms in the neocortex by others and by us indicated differences among brain regions. The key to an understanding of the mechanisms was assumed to be studies that related reliable changes of neuronal function, in terms of spiking or field potentials, to the secondary variables under study—in our case, CBF. Our review is selective rather than encyclopedic in that the focus is on aspects of neuronal function in relation to blood-flow regulation rather than vascular physiology. We also discuss the spatial specificity of hemodynamic responses in relation to neuronal function, the origin of the vascular response in terms of presynaptic and postsynaptic cellular elements, the metabolic and vascular impact of neuronal deactivation and inhibition, and the putative vascular mediators.
THE CEREBELLAR CORTEX IS AN APPROPRIATE PREPARATION FOR STUDIES OF FUNCTIONAL ACTIVATION
The cerebellar cortex is incapable of generating epileptic neuronal activity because of the absence of excitatory collaterals from Purkinje cell axons and the massive inhibitory synaptic activity due to the large density of interneurons. Second, episodes of cortical spreading depression are not easily evoked in the cerebellar cortex. These two characteristics distinguish the cerebellar cortex from the neocortex. Third, the cellular organization of the cerebellar cortex approximates a Cartesian coordinate system (Fig. 1). Therefore, it is possible to measure changes of neuronal activity and CBF in excited or inhibited regions by appropriate positioning of stimulating and recording electrodes and probes. Fourth, the neuronal circuits of the cerebellar cortex are well defined and the basic electrophysiology is well established. Thus, the cerebellar cortex does readily lend itself to local stimulation of defined inputs and recordings of physiologic variables elicited by monosynaptic or disynaptic responses at the neuronal network level. Stimulation of local circuits is interesting because connections in the central nervous system are local and excitatory (Douglas et al., 1995; Young and Scannell, 2000). In terms of preserving ‘natural’ neuronal activity, the cerebellar cortex is a tough preparation (Krebs, 1975); the toughness refers to the stability of the cerebellum in face of various experimental stresses, such as stimulation for long periods or at high frequencies. These properties of the cerebellar cortex were essential for our experiments, which would have been impossible to carry out in the cerebral cortex because of generation of seizures or spreading depression (Lauritzen, 1994). It is not possible to record an electroencephalogram from the surface of the cerebellar cortex because of the absence of synchronized activity under normal conditions. This aspect is an advantage because variations in background electrical activity do not interfere with the evoked responses, and baseline CBF in the cerebellum is more stable than in the cortex. Further details about the function of the cerebellar cortex are given in Box 1.
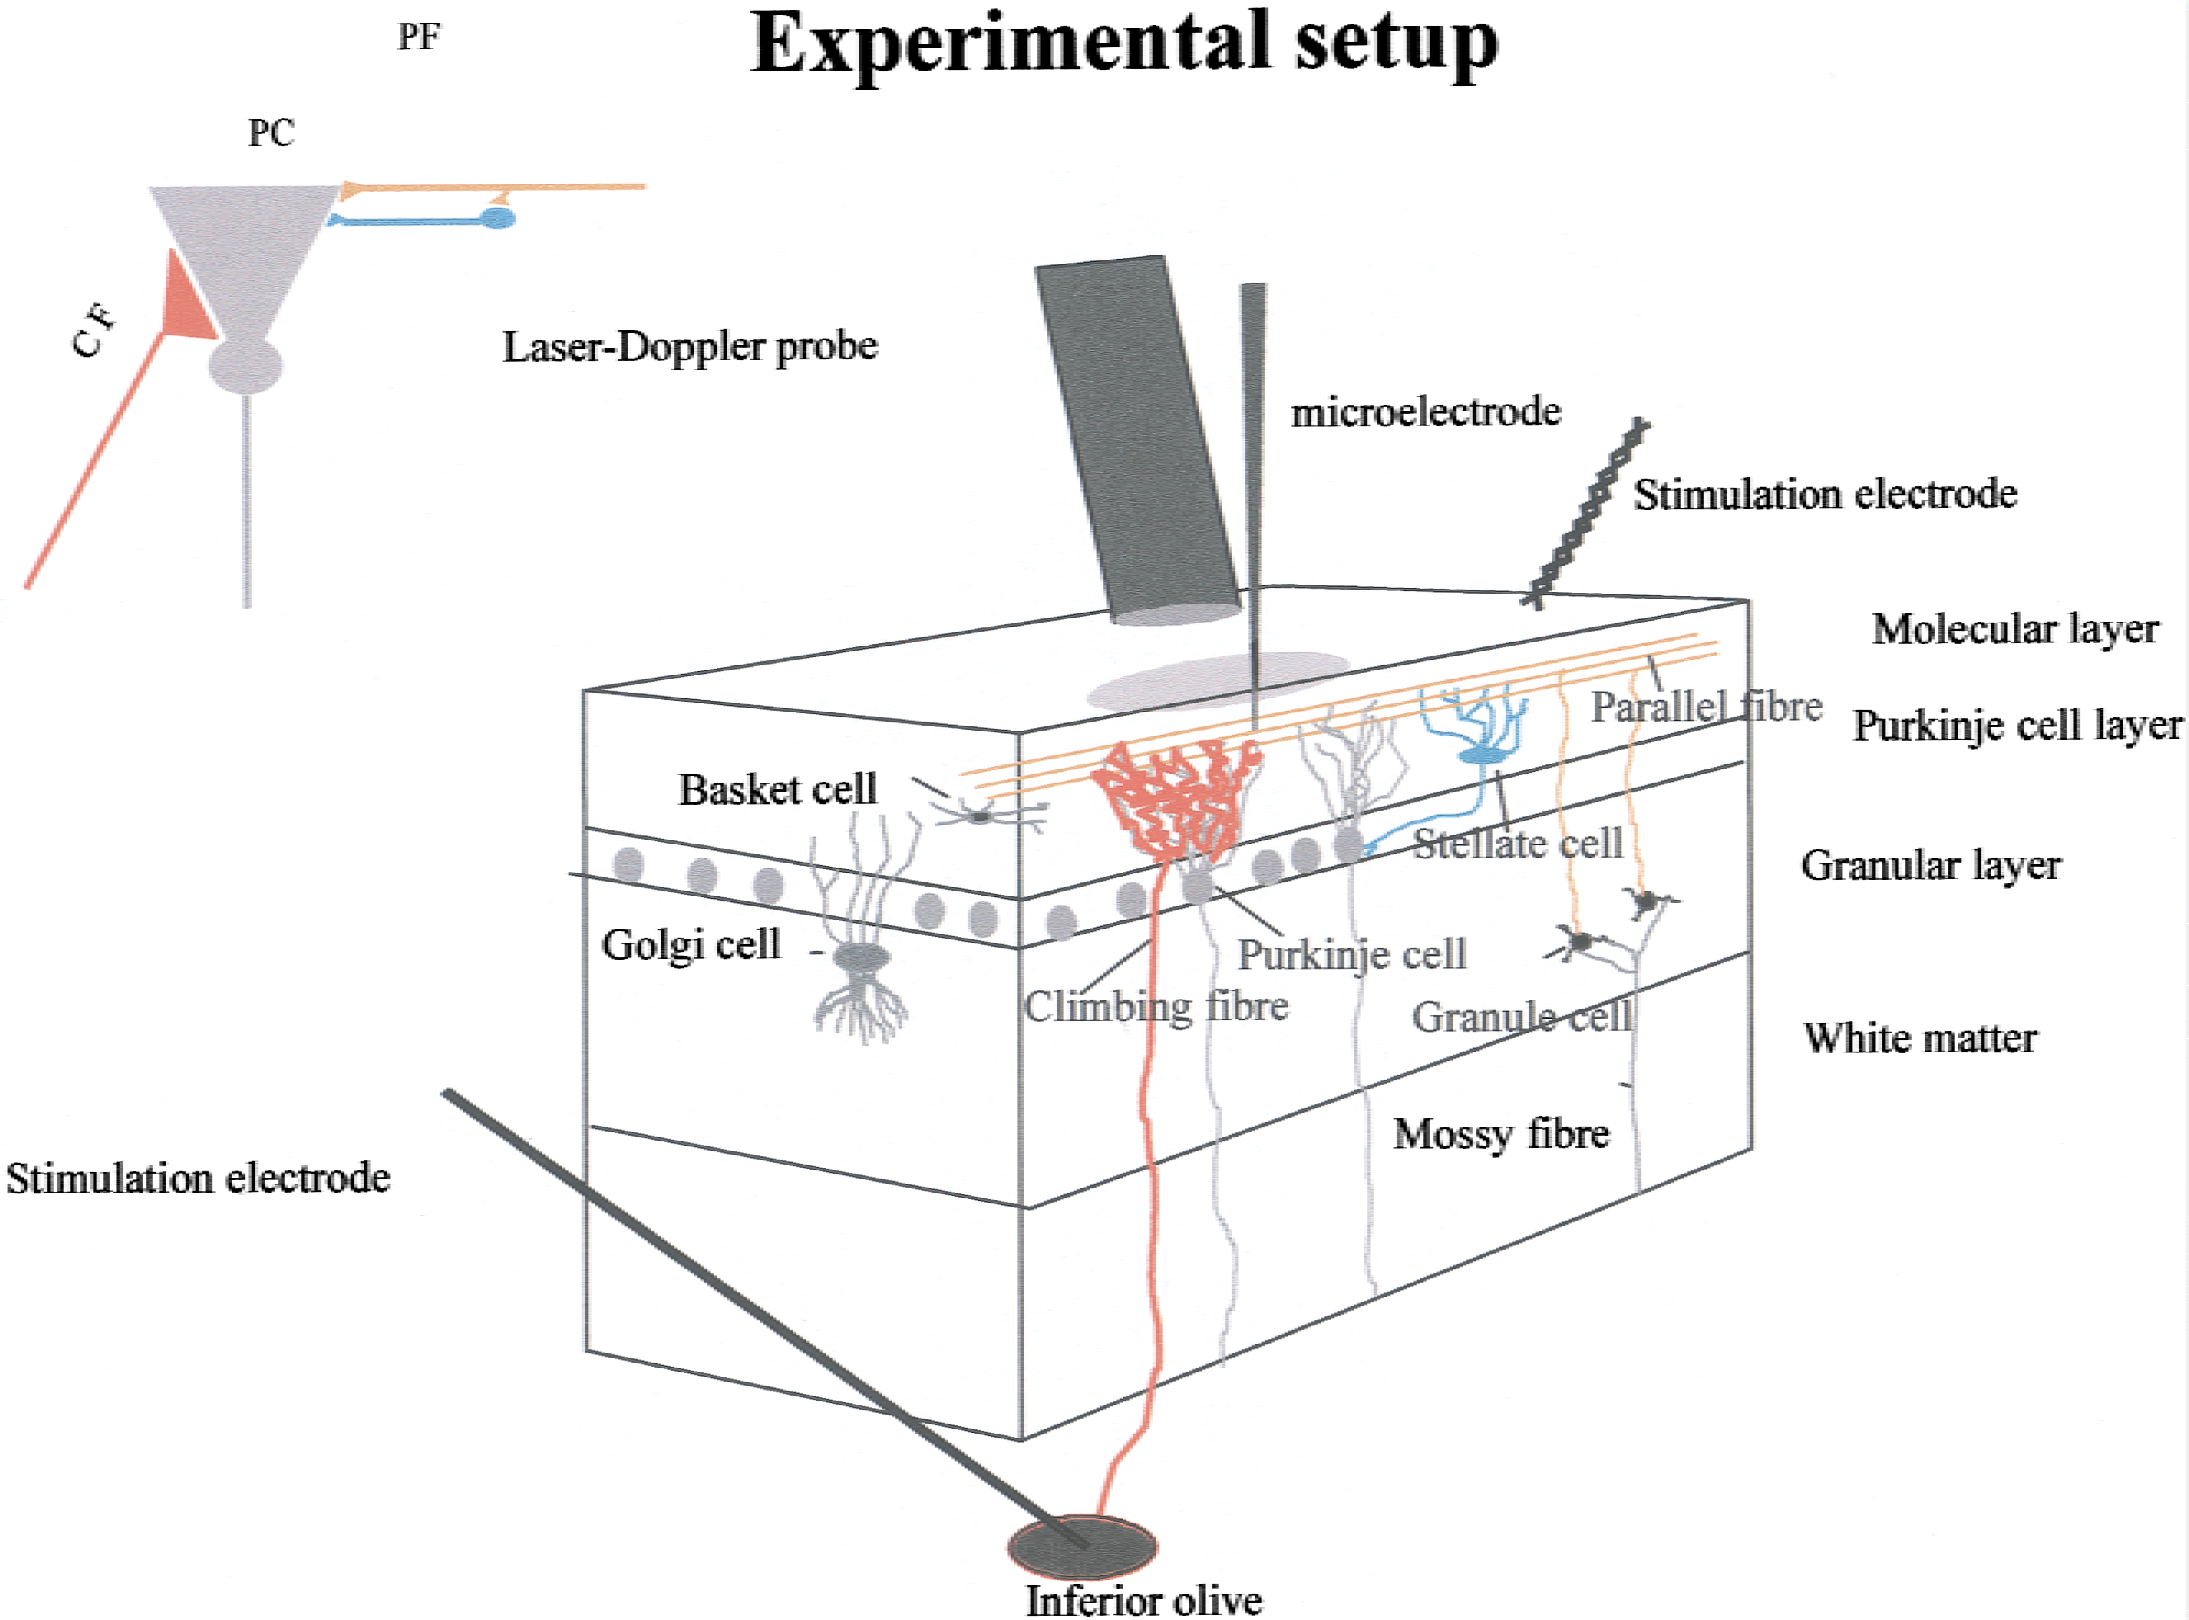
Schematic three-dimensional drawing of experimental setup, including neurons of interest and placement of laser-Doppler flowmetry probe and stimulating and recording electrodes. The three cerebellar layers are indicated: (1) molecular layer with a thickness of 400 μm, (2) Purkinje cell layer (thickness ≈ 100 μm), and granular cell layer (thickness 400–500 μm). A color coding has been used to depict circuits and cell types: granule cell axons (parallel fibers) are orange, Purkinje cell bodies and dendrites are gray, stellate cells are blue, and Golgi and basket cells are dark gray. Climbing fibers are red. Bipolar stimulation at the cerebellar surface activates the superficial parallel fibers that modulate Purkinje cell activity via interaction with Purkinje cells and stellate cells. A monopolar electrode placed stereotaxically in the caudal part of the inferior olive stimulated climbing fibers that give a monosynaptic excitatory input to Purkinje cells. Field potentials and single-unit spike activity were recorded by a glass microelectrode. Cerebral blood flow was recorded by laser-Doppler flowmetry using a probe located 0.3 to 0.5 mm above the pial surface. Details regarding laser-Doppler flowmetry are given in Appendix 1, whereas those regarding the cerebellar cortex are given in Appendix 2. The insert shows the functional connectivity of the stimulated circuits: the monosynaptic excitatory input from the climbing fibers to Purkinje cells, and the disynaptic input on Purkinje cells evoked by parallel fiber stimulation. The CBF changes evoked by climbing fiber stimulation are depicted in red, whereas those evoked by parallel fibers are depicted in orange.
THE SPIKE RATE IN THE PRINCIPAL TARGET CELLS IN CEREBELLAR CORTEX IS UNRELATED TO INCREASES IN LOCAL CEREBRAL BLOOD FLOW
Functional activation is traditionally perceived as an increase in spike activity in the principal target cells of the active brain region accompanied by an increase in metabolism and CBF (Malonek and Grinvald, 1996). The focus on the principal target cells of activated regions originates from human brain-mapping studies. Analysis of effective connectivity maps among cortical and subcortical regions, which is one of the main goals in cognitive neuroscience is based on the idea that the ‘hot spots’ in brain maps communicate (i.e., produce spikes, or action potentials) (Roland, 1993; Friston and Price, 2001). The interpretation of human brain-mapping studies may become constrained if the ‘hot spots’ represent synaptic integration more than the changes in spiking activity in efferent neurons. The output neurons have long-range connections that send action potentials out of the activated region (e.g., pyramidal cells in the neocortex and Purkinje cells in the cerebellar cortex). To evaluate the importance of spikes in the coupling between neuronal activity and blood flow, we used spike recordings from single Purkinje cells in the cerebellar cortex in response either to climbing fiber (CF) or to PF stimulation. There is no evidence that other techniques can substitute for classical single-unit recordings.
The first line in Fig. 2 shows recordings of simple spikes of Purkinje cells generated spontaneously and randomly under control conditions. The recordings that were taken during climbing fiber stimulation show complex spikes that are easy to recognize because of their high amplitude and characteristic polyphasic profile. The number of complex spikes increased as a function of the stimulation frequency, whereas the number of simple spikes decreased; therefore, the overall spike rate remained the same or decreased. This finding suggested that the actual number of spikes was unimportant for the activity-dependent increase in CBF. The complex spikes followed the stimulation frequency for frequencies up to 20 Hz. However, the CBF response peaked and plateaued at 10 Hz, despite further increases in the stimulation frequency. This finding suggested a lack of proportionality between the CBF increase and the number of complex spikes. The same change in spike rate and type was observed in response to inferior-olive stimulation by intraperitoneal injection of the pharmacologic agent harmaline (Fig. 3). This drug specifically synchronizes the firing rate of neurons in the inferior olive and induces oscillations that are transmitted to the cerebellar cortex via the CFs. Event-correlation analysis showed that the spike firing was random under control conditions and was rhythmic (9-Hz oscillations) after harmaline injection; however, the total number of spikes remained unchanged. The magnitude of the CBF increase was similar for 9-Hz oscillations and electrical stimulation of the inferior olive at 9 Hz. This finding is of interest because oscillations at various time scales contribute to the concerted action on neuronal populations in various parts of the brain (Gulyas, 2001). Our study showed that the CBF response depended on the activity that accompanies the oscillations and not the oscillations per se.
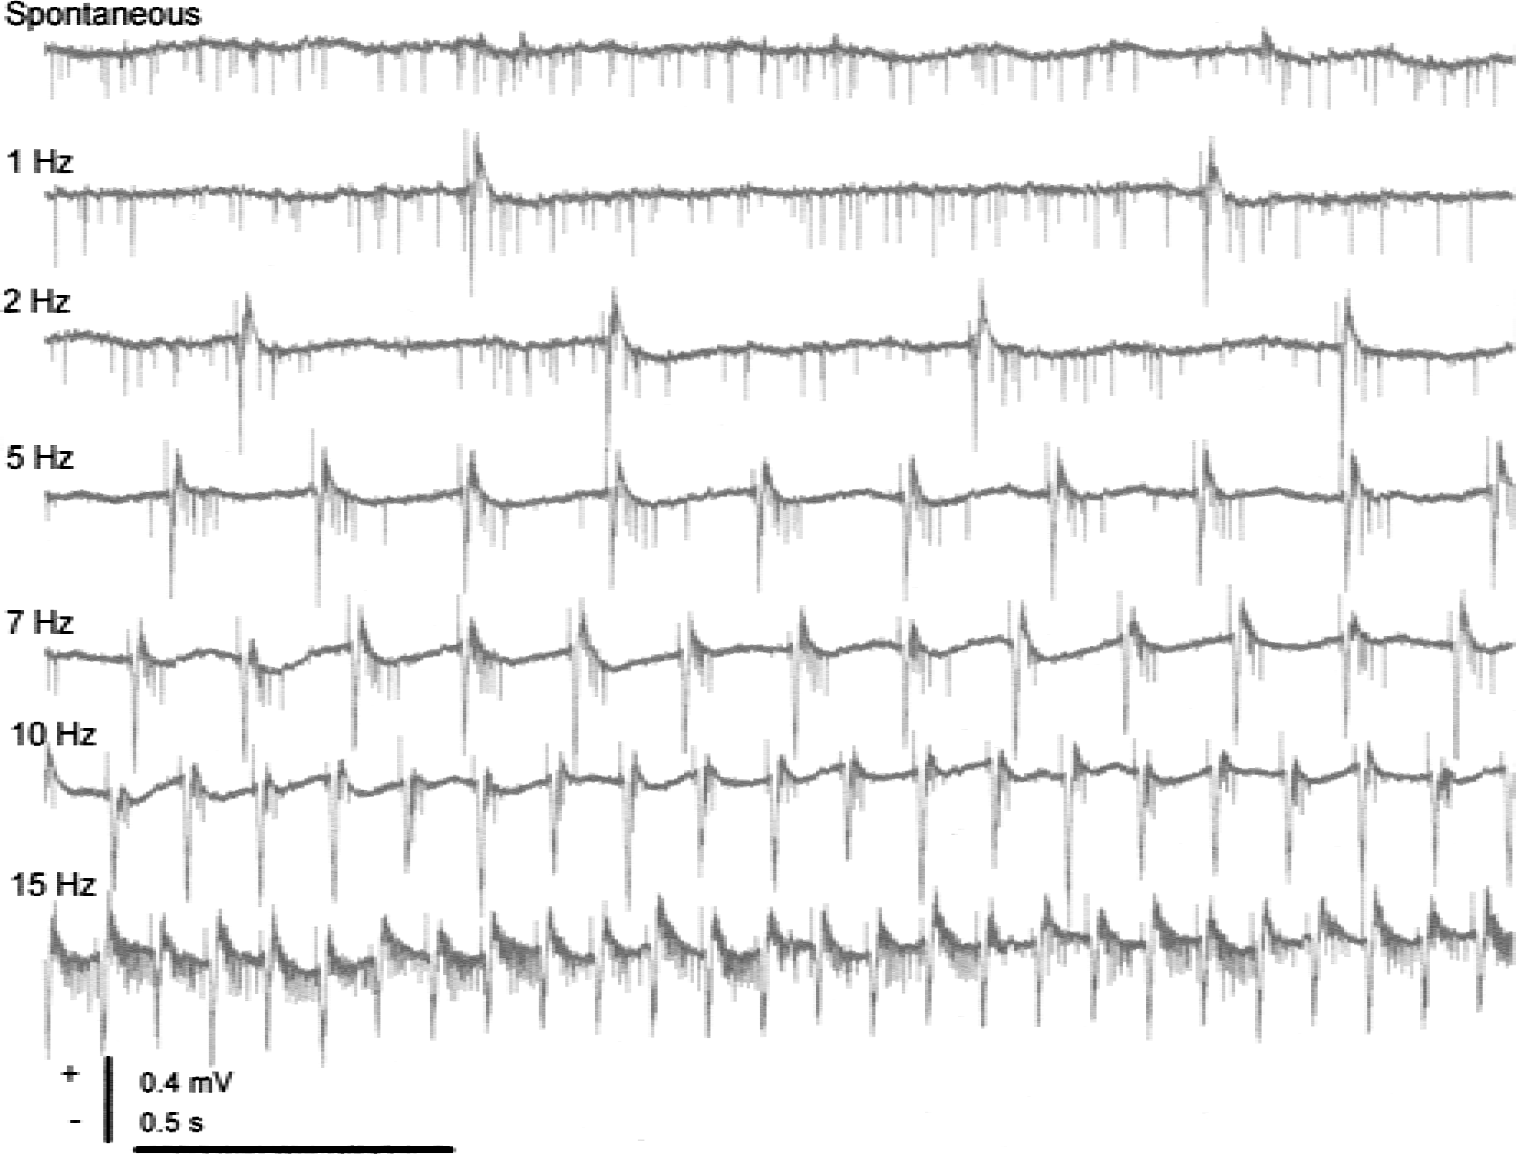
Purkinje-cell spiking activity evoked by climbing fiber stimulation. Traces show Purkinje-cell spike activity under control conditions (spontaneous activity) and in response to stimulation at 1, 2, 5, 7, 10, and 15 Hz. Under control conditions, Purkinje cells fired mainly simple spikes triggered by the mossy-fiber granule cell system. Climbing fiber stimulation suppressed simple spikes, probably because of increased activity of inhibitory interneurons activated by climbing fiber collaterals, triggered firing of complex spikes. Complex spikes are much longer lasting than simple spikes and their occurrence involves the activation of a several ion conductances and second messengers systems.
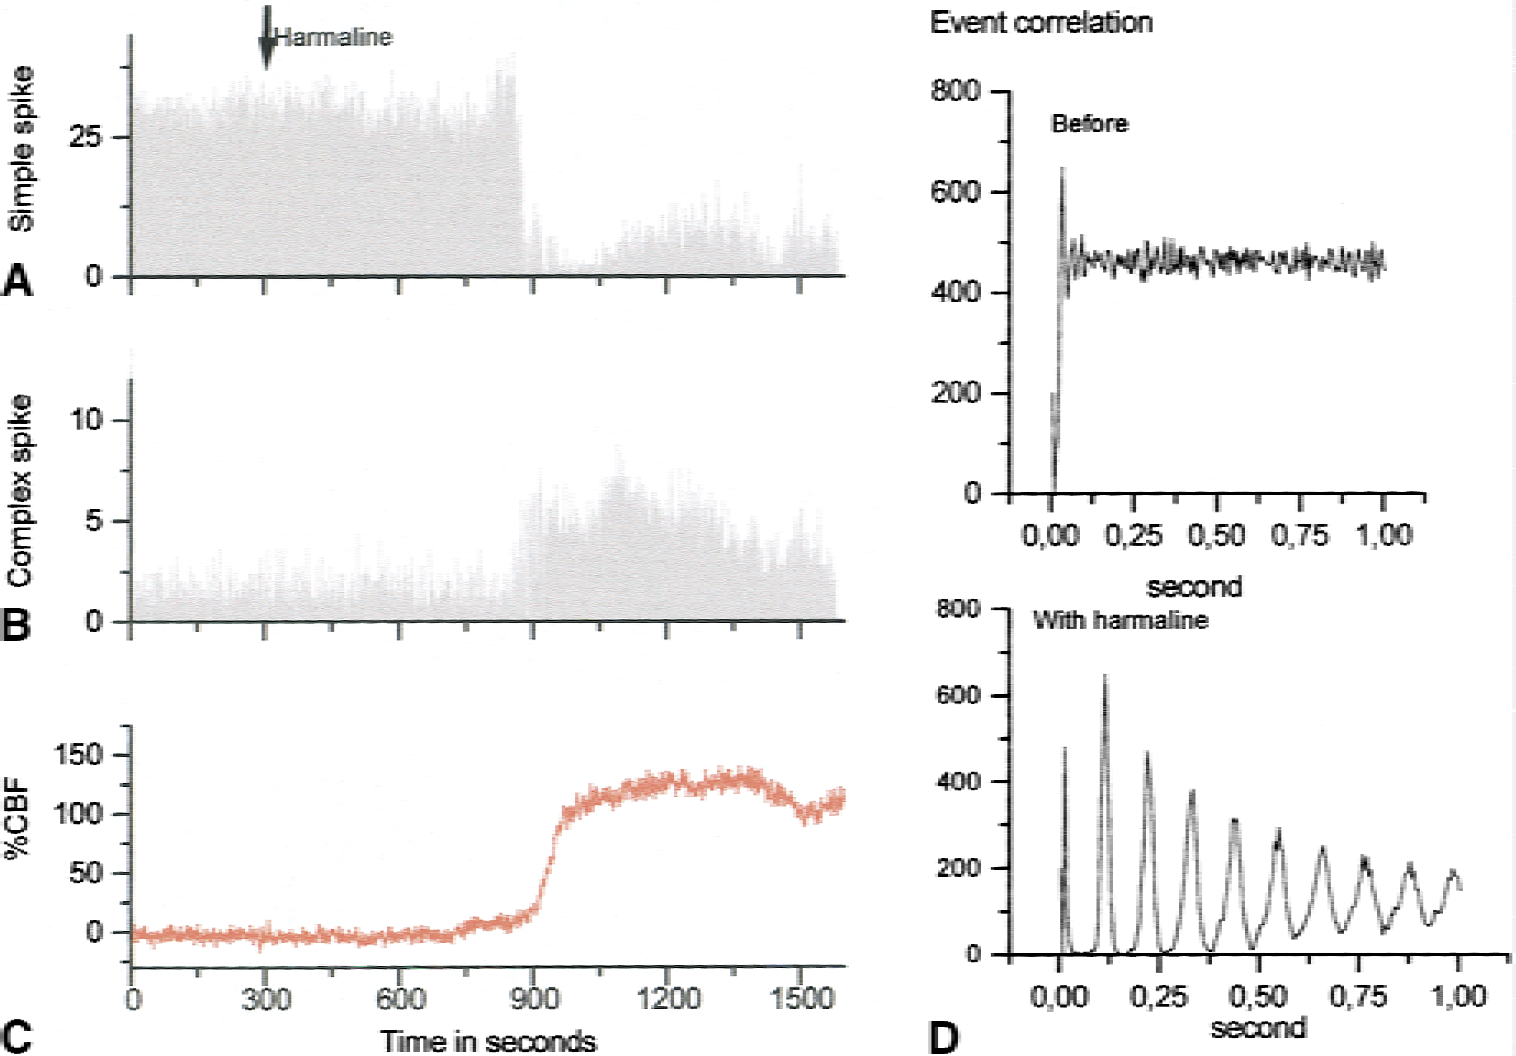
Purkinje-cell spike firing pattern and cerebral blood flow (CBF) in response to climbing fiber stimulation induced by injection of harmaline. This substance triggers oscillations in the inferior olive, which via climbing fiber projections to the Purkinje cells changes the spike firing pattern from random simple spikes to rhythmic complex spikes. The change in spike firing pattern correlated with an increase in CBF. Arrow indicates time of intraperitoneal injection of harmaline (40 mg/kg). Neuronal and vascular changes started approximately 10 minutes after injection. Ordinate indicates spikes per second
The net effect of electrical stimulation of parallel fibers is an inhibition of Purkinje cell simple-spike activity, as described previously (Eccles et al., 1967). However, the CBF increase was frequency dependent (Fig. 4), which confirmed our suspicion that the evoked CBF increases were independent of the spiking frequency of the principal neuron—the Purkinje cell. Synaptic activity in Purkinje cells or interneurons and activity in glial cells probably all contribute to the flow signal. The contribution to the CBF increase from Purkinje cells was examined in mice with a deficient function of these cells, and findings suggested that Purkinje cells were responsible for a sizable component of the flow response whereas other cellular elements—interneurons and glial cells—mediated the remaining part of the response (Yang et al., 1998). The contribution from interneurons was subsequently examined in transgenic mice with a profound reduction in the number of stellate neurons in the cerebellar molecular layer, and an attenuation of the activity-dependent increase in CBF was observed (Kumada et al., 2000). Thus, interneurons do contribute to the vascular response. These observations may have general interest, because other neuronal circuits resemble the parallel fiber (PF) circuit. For example, a somatosensory input from the thalamus to the cortex (or an input via callosal fibers) excites pyramidal cells directly and inhibitory interneurons that converge on the same pyramidal cell (Creutzfeldt, 1995). Therefore, interneurons in the cortex (whether excitatory or inhibitory) may contribute to changes in CBF.
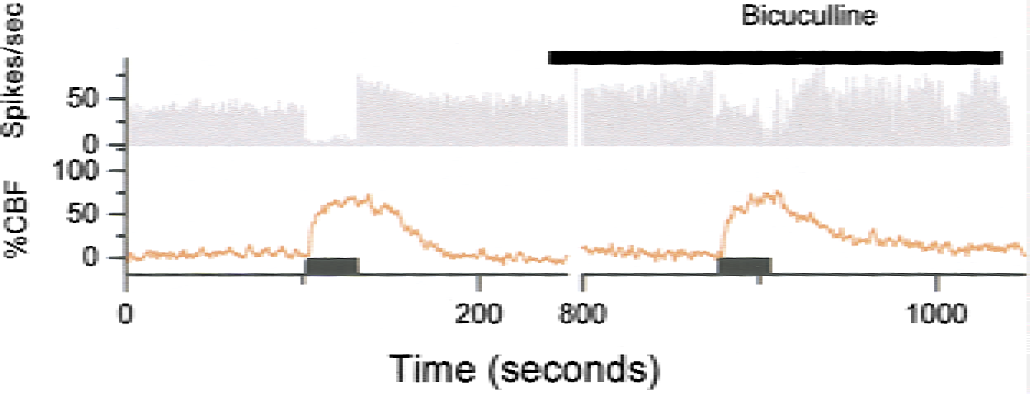
Cerebral blood flow (CBF) increases and spike activity evoked by parallel fiber stimulation at stimulus frequency of 30 Hz and stimulus duration of 30 seconds. Abscissa is time in seconds, and ordinate is spikes per second. Purkinje-cell spike firing activity almost disappeared 1 to 3 seconds after onset of stimulation, and the spontaneous firing did not return to normal until 19 to 25 seconds after end of stimulation. The CBF increased during stimulation, continued to increase for 5 to 10 seconds after end of stimulation, and reversed to baseline after 40 to 50 seconds. The GABAA antagonist bicuculline (0.5 mmol/L, topical application, horizontal bar) did not affect CBF but attenuated the inhibition of Purkinje-cell spike activity during stimulation. Adapted from Mathiesen et al. (1998).
Another consequence of these data in relation to the inverse problem is that it is impossible to judge whether the output level of activity of a region is increased on the basis of an increase in CBF. This determination will depend on the functional connectivity between cells and of the processes of synaptic integration that take place in that particular circuit, but spikes are not important.
SPIKES VERSUS GLUCOSE METABOLISM AND CEREBRAL BLOOD FLOW: NO EVIDENCE THAT CHANGES IN LOCAL SIGNALLING IS ACCOMPANIED BY CHANGES IN SPIKE RATE FROM THE SAME POPULATION OF NEURONS
What can we expect in terms of signaling in response to, for example, an afferent input to the sensory cortex? Activation of the cerebral cortex leads to desynchronization of the electroencephalogram that is not necessarily accompanied by increases in the overall discharge rate of cortical neurons (Creutzfeldt, 1975). Indeed, multiple-unit recordings show a tendency toward increased spiking, but some neurons decrease their firing rate. It is likely that activation leads to a redistribution of spiking that may be quantitatively as important for information transfer as increased spiking within a particular cortical region. Consequently, the overall spike response in a population may remain unchanged in response to a stimulus, despite large variations in single-cell activity because few nerve cells change activity as a function of stimulation (Scannell and Young, 1999). The basal firing rate of cell populations may be the most important variable for the population response to stimulation. Cells with a low spontaneous firing rate exhibit the largest responses to stimulation, whereas cells that are already active respond little, if at all. Therefore, it is unlikely that the small blood-flow changes that are measured during activation tasks indicate increased spiking in the population of targeted neurons (Scannell and Young, 1999). These ideas based on theoretical considerations do have support from experimental studies.
Tsubokawa et al. (1980) used platinum electrodes to record spikes and CBF (as indicated by hydrogen clearance) from thalamic nuclei and somatosensory cortex in awake and anaesthetized cats in response to sciatic nerve stimulation. The results indicated a proportional increase in thalamic spike rate and thalamic CBF in awake cats, but CBF and spike rate in the cerebral cortex were uncorrelated. The difference between the data from the thalamus and the cortex may reflect the difference between a relay station and a higher-order system, but this idea will have to be addressed experimentally in further studies.
Other recent work suggested a linear relation between an imaging signal and the number of spikes fired in the local population of neurons that are targeted (Tagamets and Horwitz, 1998; Malonek et al., 1994; Engel et al., 1997). However, these studies were based on previous work that showed increased spiking in a proportion of the neuron population without evidence of increased population spiking. Other papers have documented increased glucose consumption in proportion to the stimulus frequency of the afferent input system. The localized increase corresponded to synapse-rich regions (i.e., the neuropil that contains axonal terminals, dendritic processes and astrocytic processes that envelop the synapses) (Yarowsky et al., 1983; Kadekaro et al., 1985; Duncan et al., 1987). In contrast, glucose consumption remained constant in the dorsal root ganglia, which contains the cell bodies and the proximal part of the axons. This finding suggests that spike activity in the cell bodies was not a driving force for increased glucose consumption. In synapse-rich regions, glucose consumption is used for synaptic integration and spiking, and recovery processes after activation (e.g., activity of the sodium, potassium-ATPase in neurons and glial cells, and glutamate uptake) (Mata et al., 1980; Takahashi et al., 1995). Therefore, calculations of the amount of glucose consumed per incoming spike more likely reflects synaptic activity and the recovery processes evoked by the afferent volley rather than spikes in the targeted neurons (Sokoloff, 1999).
Other studies have correlated the blood oxygen level-dependent (BOLD) signal obtained in functional magnetic resonance imaging studies to spike recordings obtained under comparable experimental conditions in separate studies. Based on a number of reasonable assumptions, one study reported that the rate of change of the spike rate was nine spikes per second per neuron for each 1% change of the BOLD signal (Rees et al., 2000). Another study reported a value of 0.4 spikes per second per neuron per 1% change of the BOLD signal (Heeger et al., 2000). The conclusion of these two studies was that functional magnetic resonance imaging responses were proportional to neuronal firing rates. However, a difference in proportionality factor between the two studies by more than 20 does not support the notion that the inverse problem has been solved. These data and the aforementioned comments in the literature suggest that aspects of neuronal activity other than spikes should be correlated to changes in flow. A recent study of visual function in awake monkeys using both functional magnetic resonance imaging and electrophysiologic techniques suggested that synaptic field potentials and not spike activity correlated to the BOLD signal (Logothetis et al., 2001).
FIELD POTENTIAL ANALYSIS TO EVALUATE THE COUPLING BETWEEN NEURONAL ACTIVITY AND CEREBRAL BLOOD FLOW: A PUTATIVE SOLUTION TO A COMPLEX PROBLEM
We used field potentials to further analyze the coupling relation between neural activity and CBF. These potentials were recorded with the same glass microelectrode that was used for spike recordings, or with a second microelectrode under conditions where this was not feasible. A field potential may be defined as the bioelectric potential recorded from the extracellular space that is produced by synchronous excitation of an ensemble of neurons (Nicholson, 1973). Both action potentials and synaptic potentials are associated with transmembrane-ion fluxes that produce changes in the field potential. In an excitatory synapse, a net influx of positive ions is observed at the site of excitation (the current sink), which is accompanied by a net efflux of positive ions from other parts of the same cell, leading to extracellular current flow. Due to the resistive properties of the extracellular media, this flow causes a potential change that can be measured as the extracellular field potential (Nicholson, 1973). Thus, the extracellular field potential gives information about the synchronized neuronal activity in the stimulated region. An evoked potential, such as a somatosensory evoked potential (SEP), is a field potential that is recorded from the scalp or the brain surface. The SEP gives rough information about synaptic activity in the cortex. Under experimental conditions, field potentials may be recorded within the cortex. The closer the recording electrode to the cellular elements that generate the potential, the greater the chance of defining the neuronal events that follow stimulation of an afferent input. The cerebellar cortex is an excellent preparation for studies of synaptic transmission as indicated by field potentials because of the regular arrangement of cell types and connections, which conform to the properties of a Cartesian coordinate system.
Maximal CBF responses were compared to maximal field-potential amplitudes evoked by both PF and CF stimulation. To account for the accumulated effect of neuronal activity on the vasculature, the occasional dropouts of neuronal signals (especially at high stimulation frequencies), and the decreased amplitudes as a function of the stimulus frequency, we summated the field potential amplitudes for the entire stimulation period (ΣFP). Correlating ΣFP to the maximal CBF response evoked at 5, 10, and 20 Hz revealed a linear relation with respect to CF stimulation (Fig. 5), and a sigmoidal relation with respect to PF stimulation (Fig. 6) (Mathiesen et al., 1998). The strength of the linearity between neuronal activity and CBF in the CF system was remarkable, because the complex series of events at the neuronal level that succeed excitation are nonlinear. A linear relation between ΣFP and CBF was also observed for stimulation of the sciatic nerve and recordings of SEPs and flow from the rat somatosensory cortex (Ngai et al., 1999). Both the SEPs and microflow increased in cat cortex in response to forepaw stimulation with amplitudes that varied as a function of the stimulus intensity (Leniger-Follert and Hossmann, 1979). Because a correlation analysis was not performed, it is difficult to compare these data with the aforementioned results.
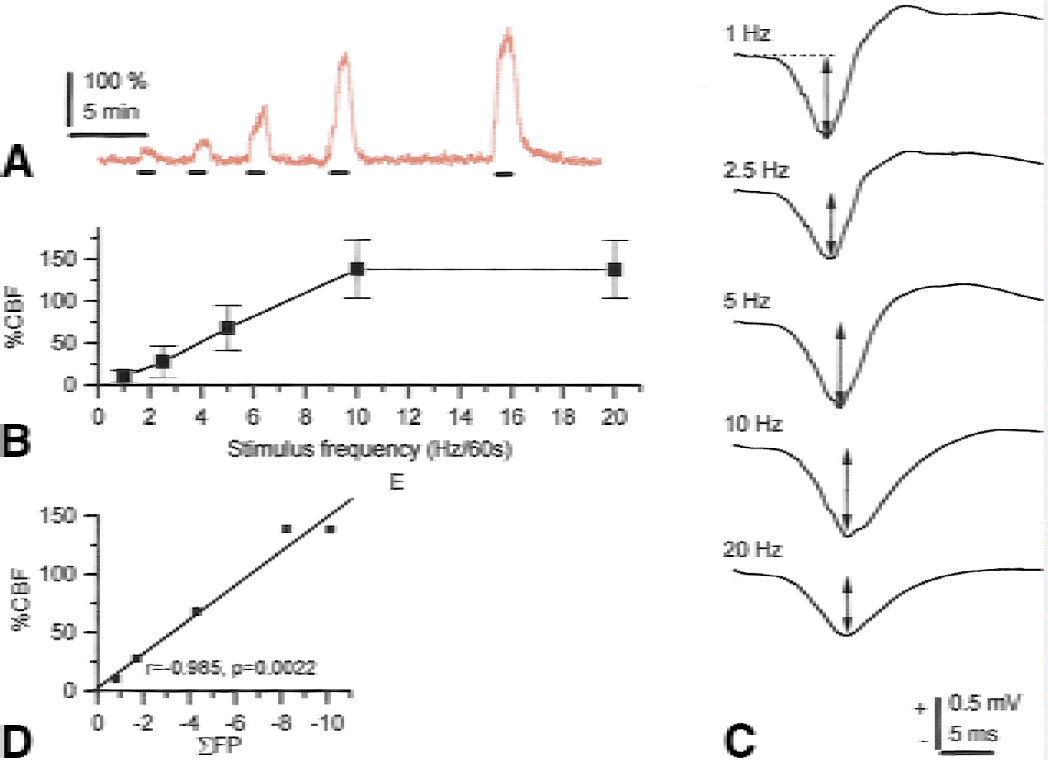
Cerebral blood flow (CBF) increases and synaptic field potentials evoked by climbing fiber stimulation. The evoked CBF increases were linearly correlated to the sum of active and passive postsynaptic activity as indicated by the summed field potentials (ΣFP). Typical example of CBF increases evoked by 1, 2.5, 5, 10, and 20 Hz for 60 seconds (bars indicate time of stimulation) (
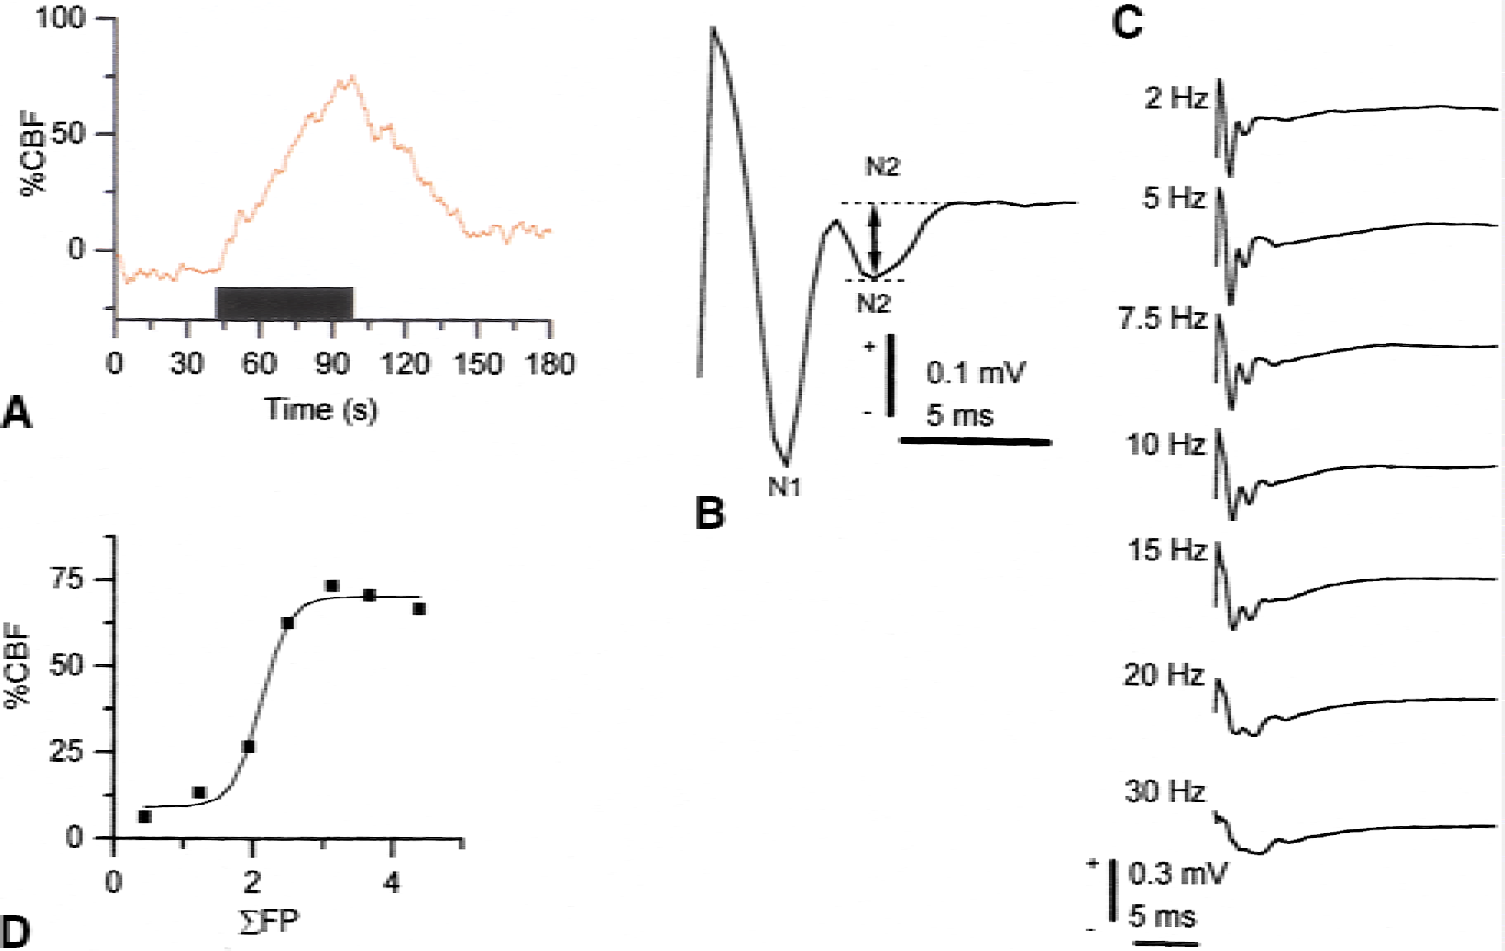
Frequency-dependent cerebral blood flow (CBF) increases in response to parallel fiber stimulation were correlated to the summed field potentials. Typical example of CBF increases evoked by stimulation at 10 Hz for 60 seconds (
Somewhat similar results were obtained in a human study that correlated averaged SEPs of different amplitudes (obtained using different stimulus intensities) to the BOLD signal (Arthurs et al., 2000). A linear correlation between SEP amplitudes and the amplitude of the BOLD signal was also observed also in the rat somatosensory cortex in response to forepaw stimulation (Brinker et al., 1999). The finding that summed field potential amplitudes correlated to CBF, and that the amplitude of averaged SEPs correlated to the BOLD signal, raise the possibility that the coupling relation between neuronal activity and the vascular signals may differ depending on imaging modality.
The sigmoid relation between ΣFP and CBF in the PF system indicated that low levels of neuronal activity were unaccompanied by detectable increases in CBF. Subsequently, a range of neuronal activities could be defined for which the CBF increase was linearly coupled to postsynaptic activity (Fig. 6). Finally, increases in neuronal activities were observed for which there was no further increases in blood flow. A similar sigmoid relation between neuronal activity and CBF has recently been demonstrated in the somatosensory cortex in rats in response to infraorbital nerve stimulation (Nielsen and Lauritzen, 2001), and for the BOLD signal in monkeys in response to visual stimulation (Logothetis et al., 2001). The findings might have implications for experiments in which subtraction of images are used to explore regions of activation. The nonlinear nature of the coupling relation questions the validity of this type of analysis.
SPATIAL SPECIFICITY OF CEREBRAL BLOOD FLOW INCREASES IN RELATION TO NEURONAL ACTIVITY: THE FLOW INCREASE IS NOT RESTRICTED TO THE AREA OF EXCITATION
How well does a local increase of CBF reflect the distribution of the underlying neuronal activity? This question was examined in the cerebellar cortex by taking advantage of the Cartesian properties of the preparation. Stimulation of a point of the surface of the cerebellar cortex activates PFs in a narrow beam that extends up to 1.5 mm bilaterally from the stimulation site, which is approximately the known PF length (Eccles et al., 1966). This fits nicely with PFs forming excitatory synaptic contacts with the dendrites of Purkinje cells via varicosities at increasing intervals along the length of the fibers. Parallel fibers also form excitatory synapses with stellate and basket cells, which in turn inhibit Purkinje cells. The summation of excitatory and inhibitory activity results in a zone of mixed excitation and inhibition along the PFs that is surrounded by a zone of pure synaptic inhibition (Eccles et al., 1966). The CBF increased not only corresponding to the zone of synaptic excitation, but up to 1000 μm normal to the activated beam in the area of surround inhibition. This finding suggested low spatial specificity of the vascular response with respect to the zone of excitation, but spatial specificity is improved if the definition of neural activity includes both zones of excitation and of inhibition. The CBF increase could be explained by a vascular mechanism if signals received by receptors on capillaries (or capillary dilatation;Duelli and Kuschinsky, 1993) were propagated along the vessels to upstream arteriolar smooth muscle that adjusted flow to the needs of the neuropil (Villringer et al., 1994; Iadecola et al., 1997). However, the CBF increase in the area of surround inhibition was smaller and the latency to the response longer than in the excited region (Akgoren et al., 1996). This is consistent with a contribution to the vascular signal from local veins, diffusion of vasodilator substances from the excited beam to the adjacent regions, or vasodilatation produced by local cellular elements such as basket cells or other cell types with long-range horizontal connections (Das and Gilbert, 1995). These observations and data obtained by other methods indicate that vascular signals usually are distributed over a wider region than delineated by electrophysiologic methods (Foit et al., 1980; Grinvald et al., 1994; Frey et al., 1994; Beisteiner et al., 1995; Das and Gilbert, 1995; Narayan et al., 1995; Grinvald et al., 2000; Disbrow et al., 2000). However, it cannot be excluded that synaptic inhibition adjacent to the excited regions contributed to the vascular signals, and that this was overlooked because of technical difficulties in sampling field potentials relevant for synaptic inhibition.
Climbing fiber stimulation influences Purkinje cell activity diffusely without a readily defined specificity in the x-y plane. Therefore, it is not possible to apply a similar analysis for the CF-Purkinje cell circuit.
ACTIVITY-DEPENDENT INCREASES IN CEREBRAL BLOOD FLOW ARE MAXIMAL AT THE DEPTH OF MAXIMAL SYNAPTIC ACTIVITY
The distribution of CBF increases along the z axis (perpendicular to the x-y plane) was examined by combining measurements of the distribution of CBF and field potentials in four different cortical layers (Akgoren et al., 1997). Field potentials evoked by CF stimulation had maximal amplitudes corresponding to the depth of 500 μm (Fig. 7). The CBF increase was maximal at the same cortical depth and clearly lower in adjacent layers along the z axis. This profile of CBF increases was constant for all tested frequencies. Similar findings have been obtained in the rat somatosensory cortex for whisker or infraorbital nerve stimulation (Gonzalez and Sharp, 1985; Moskalenko et al., 1998; Gerrits et al., 2000; Nielsen and Lauritzen 2001). For PF stimulation, maximal presynaptic and post-synaptic potentials were observed up to a depth of 200 μm matching the CBF increase in the upper 250 μm (Fig. 7). This observation was sometimes accompanied by decreased CBF in the underlying layer. Similar findings of a redistribution of flow within cortical layers have been observed to accompany neuronal activity in the somatosensory cortex (Cox et al., 1993). The results support the view that activity in synapse-rich regions drives functional activation. Redistribution of blood flow between cortical layers may be an integral part of the mircocirculatory response to activation. The heterogeneity of cortical microcirculation may be explained by differences in capillary density accompanying differences in synaptic function (Cox et al., 1993), or regulation of local capillary flow by strategically placed pericytes (Ehler et al., 1995).
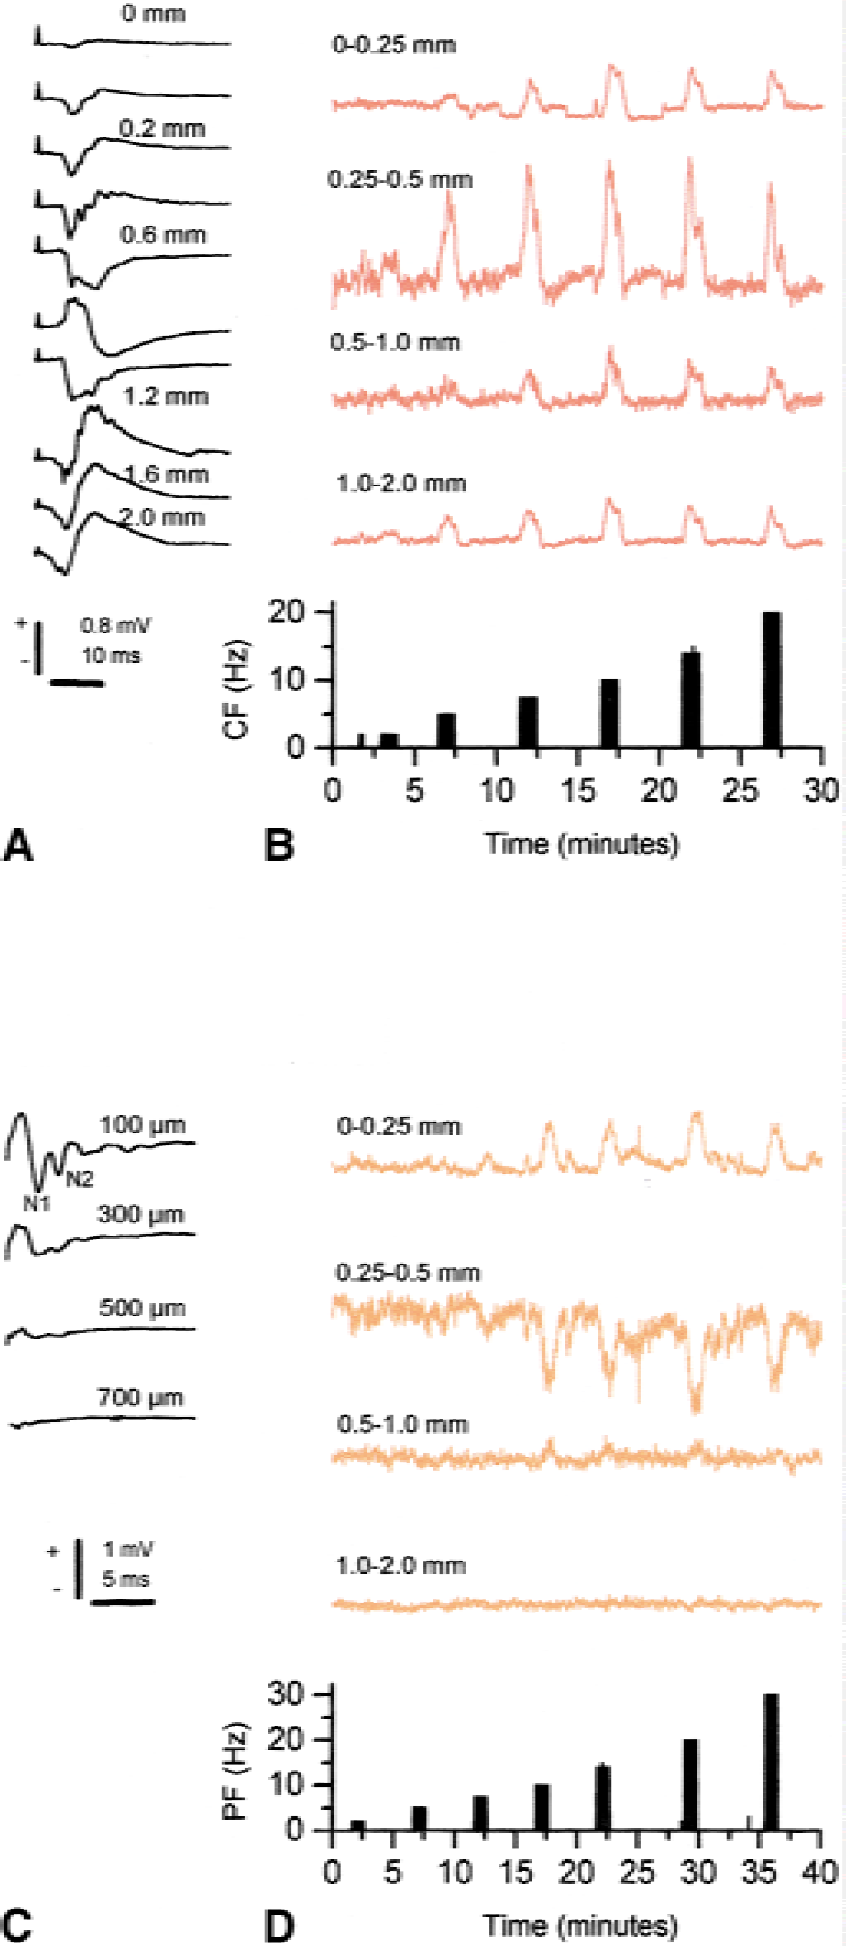
Laminar analysis of neuronal activity as indicated by field potentials and cerebral blood flow (CBF) evoked by climbing fiber stimulation at a stimulation frequency of 2 Hz. The CBF was recorded with laser-Doppler flowmetry at depths of 0 to 0.25, 0.25 to 0.5, 0.5 to 1.0, and 1 to 2 mm calculated according to the algorithm published previously (Fabricius et al., 1997). Panel
ACTIVITY-DEPENDENT INCREASES IN CEREBRAL BLOOD FLOW ARE EXPLAINED BY ACTIVITY IN POSTSYNAPTIC CELLULAR ELEMENTS: PRESYNAPTIC ELEMENTS CONTRIBUTE ONLY UNDER SPECIAL CONDITIONS
Antagonists of AMPA receptors, the dominating glutamate receptor in the cerebellar cortex, blocked 50% of the CBF response evoked by PF stimulation, and blocked postsynaptic potential by 100%. The remaining 50% of the CBF response was explained by presynaptic activity in PF (Akgoren et al., 1994; Li and Iadecola, 1994). These fibers contribute to the flow response because of their high density in the molecular layer of the cerebellar cortex and the intense stimulation-triggering action potentials in a large proportion of these fibers. The AMPA receptor antagonists attenuated CBF increases evoked by CF stimulation by up to 95% (Yang and Iadecola, 1998; Mathiesen et al., 1998). A proportional decrease of the amplitude of the synaptic potential was simultaneously observed. The reversible blockade of synaptic transmission by the AMPA receptor antagonist verified the strong and direct correlation between the amplitude of the evoked field potentials and CBF as shown in Fig. 8 (Mathiesen et al., 1998). This finding supported the idea that changes in local postsynaptic activity explain local activity-dependent increases in CBF. The effect was specific for AMPA receptors as field potentials, and CBF increases were unaffected by N-methyl- d -aspartate (NMDA) receptor antagonists. Presynaptic activity in CFs did not contribute significantly to the induced changes of the CBF or neuronal activity because of the slenderness and low density of these structures (Eccles et al., 1967). In the sensory neocortex, AMPA receptor antagonists attenuated the activity-dependent CBF increase and the field potential amplitude more strongly than NMDA receptor antagonists did in response to stimulation. Combined treatment with AMPA and NMDA receptor antagonists attenuated CBF and field potentials by approximately 90% (Nielsen and Lauritzen, 2001). Thus, CBF responses both in the cerebellum and the somatosensory cortex couple to activity in postsynaptic cellular elements.
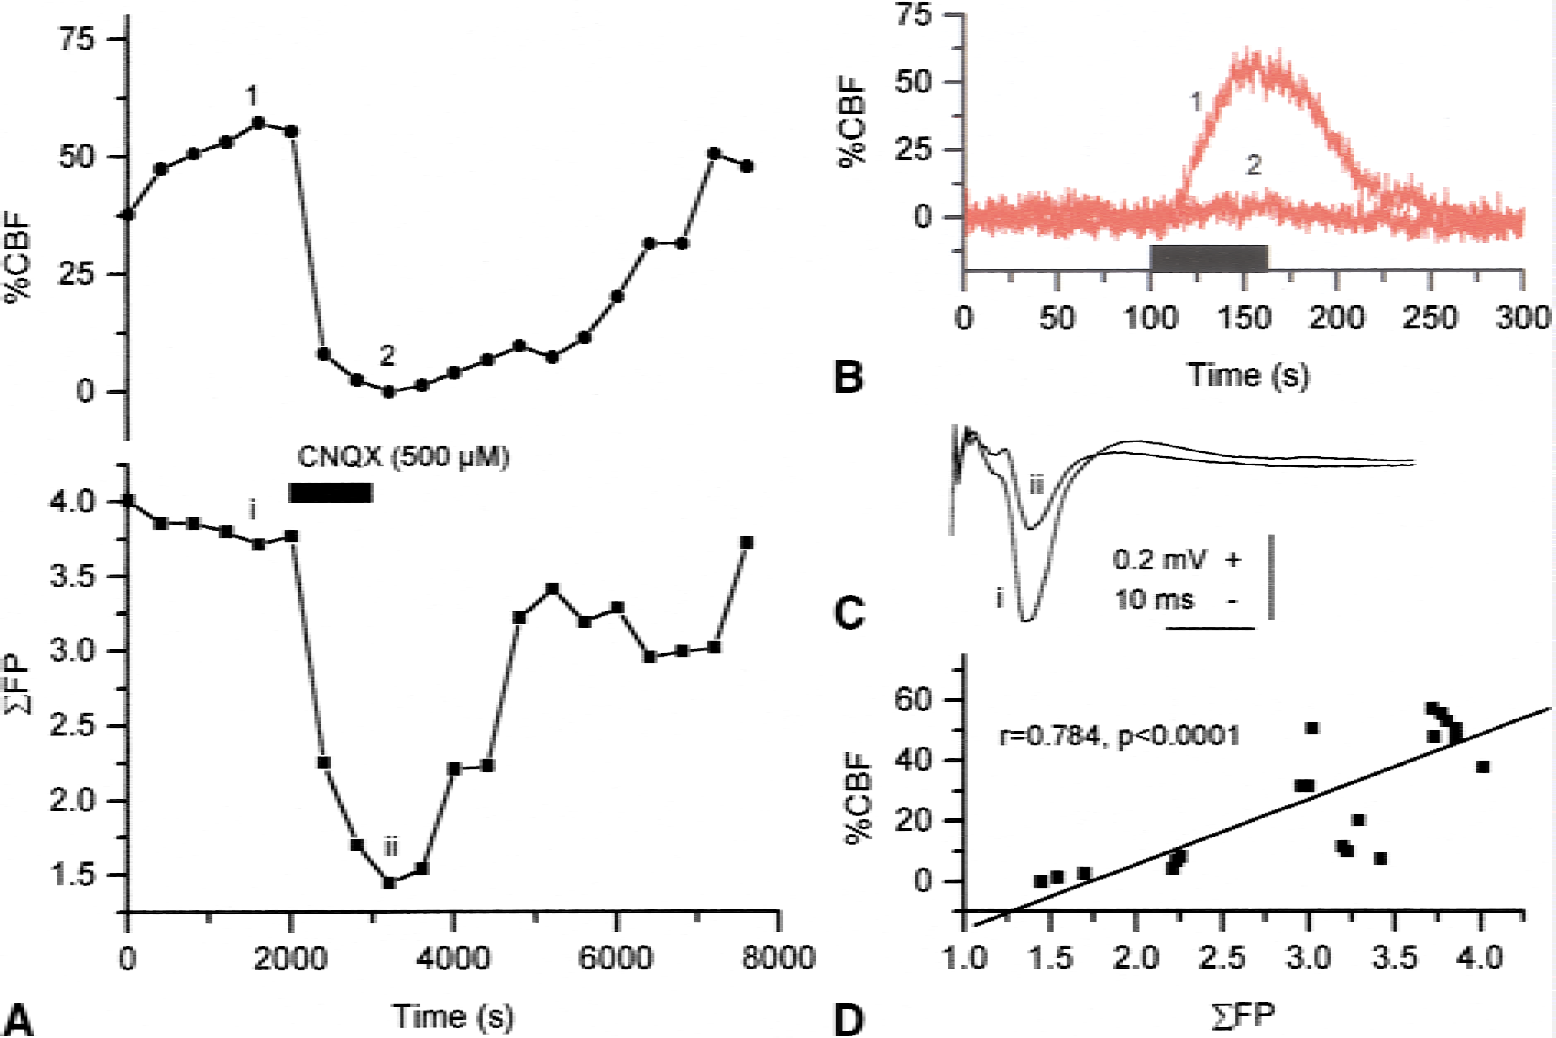
The AMPA-receptor blockade inhibited climbing fiber-evoked cerebral blood flow (CBF) increases and the major part of the evoked field potential in response to climbing fiber stimulation. Data points indicate amplitude of maximal CBF increase (upper part) or summed field potential (ΣFP) evoked during successive periods of climbing fiber stimulation (10 Hz for 60 seconds) before, during, and after topical application of CNQX (
ACTIVITY-DEPENDENT INCREASES IN CEREBRAL BLOOD FLOW REPRESENT AN INTEGRAL OF POSTSYNAPTIC NEURONAL ACTIVITY
Are neuronal activities and CBF temporally coupled? And if so, how can we demonstrate that such a coupling exists? In the sensory cortex, CBF starts to increase a few hundred milliseconds after onset of stimulation with a time-to-peak latency of approximately 1 second (Sandman et al., 1984; Woolsey et al., 1996; Moskalenko et al., 1996; Malonek et al., 1997; Mandeville et al., 1999; Nielsen and Lauritzen, 2001; Matsuura and Kanno, 2001). The CBF increase in the rat somatosensory cortex may be explained by a transform of the underlying neural activity that combine a large linear and a small nonlinear component for brief stimulation periods (Ances et al., 2000). In the cerebellar cortex, the evoked CBF responses develop one to two orders of magnitude slower than in the sensory cortex, suggesting different vascular mechanisms that are dependent on experimental design and regions. However, neuronal activity changes at the millisecond that stimulation starts in both examples. Thus, there is a time delay between the neuronal and the vascular response that must be taken into account in a model of temporal coupling.
The slow onset and long time course of cerebellar CBF responses suggested the involvement of mechanisms with a long time constant (Mathiesen et al., 2000). Therefore, we incorporated a time factor in our transformation of neural activity to CBF by using an algorithm that used running summation of field potentials as an indicator of neuronal activity over time (runFP). This algorithm smoothed out variations in field potential amplitudes and incorporated the accumulated effect of neuronal activity on CBF. For CF stimulation, the increase in CBF correlated linearly with postsynaptic activity for 20 to 30 seconds for stimulation frequencies between 2 and 20 Hz (i.e., the CBF response in this system was the result of the accumulated effect on the blood vessels of the preceding 20 to 30 seconds of neuronal activity). For PF stimulation, presynaptic activity coupled to CBF at most frequencies, but postsynaptic activity and CBF were coupled only at low stimulation frequencies. No difference was observed for PF or CF stimulation in the correlation analysis during and after the stop of stimulation, which indicated that the CBF increase was a functional hyperemia both during and after stop of stimulation. Long-lasting stimulation induced CBF changes that did not correlate to synaptic activity except for the first minute (Mathiesen et al., 2000). We suggest that brief periods of stimulation be used for examining the coupling between neuronal activity and changes of cortical hemodynamics.
NEUROTRANSMITTERS DO NOT CONTRIBUTE TO CEREBRAL BLOOD FLOW INCREASES IN THE CEREBELLAR CORTEX
In the neocortex, perivascular terminals that are positively labeled for the GABA-synthesizing enzyme glutamic acid decarboxylase (GAD) are located approximately 1 μm from the blood vessels, and lesion studies suggest that the terminals originate locally in the cortex. Thus, GABA terminals may interact directly with the microvascular bed (Imai et al., 1991; Vaucher et al., 2000). The possibility that inhibitory interneurons control CBF by direct interaction with the blood vessels was studied in hippocampal slices with functioning blood vessels (Fergus and Lee, 1997), and data showed dilatation of penetrating arterioles in response to GABA or the GABAA receptor agonist, muscimol, and constriction in response to the GABAB receptor agonist, baclofen. In the cerebellar cortex, neither bicuculline nor picrotoxin, both of which are powerful inhibitors of GABAA receptors, had an effect on basal CBF or activity-dependent CBF increases despite decreased synaptic inhibition (Li and Iadecola, 1994; Akgoren et al., 1996; Mathiesen et al., 1998). Furthermore, 10 mol/L GABA had no effect on basal CBF in the cerebellum (Caesar and Lauritzen, 2001; unpublished data). This questions a direct regulatory role for GABA on blood vessels and the validity of using slice preparations for the evaluation of vascular function. Vessels in slices are not pressurized and, therefore, are without vascular tone, which might be essential if in vitro data are extrapolated to in vivo conditions.
Two human studies using intracarotid or intravenous administration of a strong GABA agonist (THIP) showed decreased CBF (Roland and Friberg, 1988) or increased glucose consumption, respectively (Peyron et al., 1994). The interpretation of these data is difficult because brain regions influence one another. The data of Roland and Friberg are consistent with animal studies showing that GABA agonists reduce CBF and glucose consumption to the same degree (Kelly et al., 1989) (Kelly and McCulloch, 1983). The effect of the GABA agonists was most pronounced in cortical layer IV, the layer of major termination of input from the specific thalamic relay nuclei, rather than in the superficial cortical layers that contained the highest density of GABA receptors. This finding pointed to interaction of the GABA agonists with receptors in the diencephalon-modifying cortical CBF and glucose consumption indirectly (i.e., via deactivation). The patients in Roland and Friberg's study were able to increase CBF in response to various tasks at low or moderate doses of THIP. This finding indicated a preserved cortical excitability and vascular reactivity at low doses of THIP (i.e., the effects of the drug were partly or mainly due to lack of input from subcortical cellular elements rather than to a direct cortical effect of THIP). At higher doses, the excitability of the cortex was extinct because of massive inhibition at the cortical level.
Although glutamate receptors have been found on cerebral blood vessels, it is questionable whether these receptors are relevant for cerebrovascular function in healthy adult animals (Busija and Leffler, 1989; Huang et al., 1994; Faraci et al., 1994; Brian et al., 1996).
MULTIPLE MEDIATORS EVOKE CEREBRAL BLOOD FLOW RESPONSES TRIGGERED BY NEURONAL ACTIVITY
The link between neuronal activity and brain glucose consumption has been reviewed (Magistretti et al., 1999; Sokoloff, 1999; Fillenz et al., 1999). This topic is of interest in the present context because of the close coupling between glucose use and blood flow (Kuschinsky et al., 1983). Both CF and PF stimulation enhances cerebellar glucose consumption in a frequency-dependent manner (Iadecola et al., 1996; Batini et al., 1979). The glucose consumed is coupled to glutamate transport into astrocytes, triggering glycolysis and lactate release, and is followed by reuptake of lactate to neurons and oxidative phosphorylation (Sibson et al., 1998; Magistretti et al., 1999). Lactate release and the associated alterations of brain extracellular pH may explain the contribution of metabolism to activity-dependent increases in CBF, in addition to the carbon dioxide released from neurons produced by oxidation. Stimulation of the cerebellar cortex does evoke frequency-dependent decreases of extracellular pH preceded by a short phase of alkalization (Kraig et al., 1983). Most of the acid changes are blocked by ouabain, suggesting that these changes are due to the release of an acid metabolite that is produced when the sodium–potassium-ATPase is active. This finding is consistent with the idea that sodium is the electrochemical driving force for glutamate uptake to astrocytes and that increased intracellular sodium is the stimulus for the sodium–potassium-ATPase, and in turn glycolysis (Magistretti and Pellerin, 1999). In contrast to extracellular potassium, pH decreases almost linearly during the entire stimulation period and for several seconds after the stimulus train has ended, with a direct relation to the rate, intensity, and duration of the stimulus. However, the time base of the pH changes and CBF are somewhat discordant and the initial alkalization is expected to decrease CBF (Kuschinsky and Wahl, 1978), but increased CBF is observed. Nevertheless, this scheme remains attractive because it includes activity, metabolism, and mediators of the functional hyperemia coupled in series. Most studies suggest that the glucose metabolism-flow couple explains only part of the CBF increase, and that production of other vascular messenger molecules occurs in parallel.
Cerebral blood flow responses in the cerebellar cortex typically peak twice with intervals of 10 to 20 seconds in response to stimulation, which probably relates to different vasoactive compounds active during the stimulation period. The first CBF peak is delayed and reduced by nitric-oxide synthase inhibitors (Akgoren et al., 1996; Yang and Iadecola, 1997), whereas the second peak probably reflects accumulation of vasoactive metabolites (e.g., lactate or adenosine). It is interesting that extracellular lactate increases rapidly in response to acute neuronal activation, and that the time constants for the concentration changes of extracellular lactate and cerebellar CBF are similar (Hu and Wilson, 1997). Stimulation of the excitatory amino acid receptors in the cerebellar cortex results in calcium-dependent activation of nitric oxide (NO) synthase that triggers NO release and enhancement of cyclic guanine monophosphate (Garthwaite and Boulton, 1995). Nitric oxide synthase inhibitors blocked approximately 50% of the CBF increase in response to PF and CF stimulation without affecting neuronal activity (Akgoren et al., 1994; Li and Iadecola, 1994). Application of a NO donor reversed the reduced baseline CBF, but failed to reverse the attenuation of the evoked CBF response produced by NO synthase inhibition. This finding is consistent with the hypothesis that NO is a mediator, not a modulator, of the cerebellar CBF increase elicited by neuronal activity (Akgoren et al., 1996; Yang and Iadecola, 1997; Yang et al., 1999). Studies using AMPA receptor antagonists together with NO synthase inhibitors indicated that the physiologically active NO was produced in postsynaptic structures. In the somatosensory cortex, NO participates in the development of activity-dependent increases in blood flow as a modulator and not a mediator of the response (Dirnagl et al., 1993; Lindauer et al., 1999; Bonvento et al., 2000; Cholet et al., 2001), which suggests variability of vasodilator substances involved in neurovascular coupling in different brain regions.
The NO synthase-and pH-independent part of the CBF increase could be due to, for example, potassium or adenosine (Ko et al., 1990; Lassen, 1991; Iadecola, 1993). The adenosine hypothesis suggests a mismatch between energy or oxygen consumption and substrate delivery, either by a increase in neuronal activity or a by a decrease in tissue perfusion-substrate delivery. This is supposed to lead to dephosphorylation of the energy-rich adenosine nucleotides and rising levels of adenosine within the cells that is released into the extracellular space, resulting in adenosine-mediated vasodilatation (Berne et al., 1983; Phillis, 1989). Our findings suggested that the CBF increase evoked by CFs was dependent on NO and adenosine, whereas the increase evoked by PF stimulation was independent of adenosine release (Akgoren et al., 1997). This finding suggests that stimulation of different afferent inputs in the same brain region may use different mediators of vasodilatation dependent on neuronal circuitry.
Potassium is released whenever a nerve cell is active, and the hypothesis that this molecule could be one of the mechanisms that increase flow has experimental support (Leniger-Follert, 1984; Lassen, 1991). Based on theoretical calculations, it has been hypothesized that potassium siphoning as observed in the retina (Newman, 1984) produces high concentrations of potassium around blood vessels that are sufficient to explain CBF increases evoked by neuronal activity (Paulson and Newman, 1987). However, there is no evidence to support the theory of potassium siphoning in the brain. Therefore, our measurements of [K+]e and CBF, as described in the following studies, are discussed disregarding this hypothesis. In the cerebellar cortex, [K+]e increased in a frequency-dependent manner in response to stimulation within the range that is required for dilatation of pial vessels (Caesar et al., 1999). However, large-scale differences in the time courses of CBF and [K+]e were observed during stimulation. Moreover, the increase of CBF was larger in response to CF than PF stimulation, whereas the increase of [K+]e was much smaller for CF than for PF stimulation; when potassium chloride was injected into the cortex to reproduce the transient increases in [K+]e evoked by stimulation, the magnitude of the CBF increase was smaller than for corresponding [K+]e increases evoked by stimulation. These data indicate that increased [K+]e was only partially involved in CBF regulation in the cerebellar cortex, and the hypothesis that potassium is a major mediator of activity-dependent CBF increases is not supported. Similar results have been reported for CBF increases in the cerebral cortex evoked by stimulation of the fastigial nucleus (Iadecola and Kraig, 1991).
EFFECTIVE GABAERGIC SYNAPTIC INHIBITION AND DEACTIVATION VERSUS CEREBRAL BLOOD FLOW AND BRAIN GLUCOSE CONSUMPTION
Functional activation is traditionally concerned with increased excitatory synaptic activity that increases energy metabolism and CBF. If the transform of neural activity to CBF is linear, then we expect that a reduction in nerve-cell activity is associated with decreased glucose consumption or CBF. However, reduced activity may be due to decreased input (deactivation) or effective synaptic inhibition due to interaction of GABA with its receptors; in turn, GABA release is the result of the excitation of interneurons. This is supposed to increase energy demands and CBF at the same site at which inhibition takes place.
Ackermann et al. (1984) studied several categories of inhibition of cortical activity and the accompanying changes in glucose consumption. In a classical paper focusing on recurrent or lateral inhibition, glucose consumption increased in face of decreased activity of the principal target cell of the hippocampus, the pyramidal cell. The increased glucose consumption was interpreted in terms of the activation of inhibitory neurons. Along this line of thinking, hypermetabolic regions were defined as regions in which excitatory and inhibitory interneurons were active. Conversely, a hypometabolic region was defined as a region in which both excitatory and inhibitory neurons were unusually inactive. Thus, reduced energy demand is an unlikely outcome of active inhibition (Ackermann et al., 1984). The conclusion was consistent with reduced glucose consumption following epileptic seizures, which is associated with a generalized decrease of neuronal activity (Ackermann et al., 1986) that most likely is a result of deactivation rather than of active synaptic inhibition.
Glucose consumption increased in the central auditory system in a monosynaptic glycinergic inhibitory circuit in which the inhibitory afferents were isolated surgically and stimulated. The two-dimensional 2-deoxyglucose autoradiograms showed increased uptake in the target area, and provides the only direct evidence from in vivo experiments that monosynaptic inhibitory activity increases brain energy consumption (Nudo and Masterton, 1986). Stimulation of an afferent excitatory input increased glucose consumption to the same degree as inhibition, and careful inspection of the autoradiograms for both input types revealed that the increased consumption corresponded to the distribution of active synapses, not the distribution of discharging postsynaptic cellular elements. The investigators concluded that increased local glucose consumption indicated inhibitory or excitatory synaptic activity, independent of whether this was accompanied by changes of the postsynaptic cell discharges (Nudo and Masterton, 1986). However, we are still ignorant of the changes of blood flow or glucose consumption that accompany activity in a purely inhibitory GABAergic circuit.
Focal hypoxygenation occurs in the occipital cortex during saccadic eye movements (Wenzel et al., 2000). This finding is explained by deactivation early in visual processing, possibly at the level of the lateral geniculate nucleus (Burr et al., 1994). Waldvogel et al. (2000) used a go/no-go paradigm in humans and observed an increased BOLD signal under go conditions but no change of the BOLD signal under no-go conditions. The findings were suggested to indicate that only excitatory synaptic activity contributed to a BOLD signal while synaptic inhibition, whether monosynaptic or polysynaptic was supposed to be less metabolically demanding than excitation. However, it is more likely that the absence of a BOLD signal suggested the absence of significant levels of excitatory or inhibitory synaptic activity because both types of synaptic activity are energy demanding. Further studies focused on synaptic inhibition are needed to address this issue.
In summary, deactivation due to decreased input to a brain region is associated with decreased glucose consumption and CBF, whereas active synaptic inhibition is associated with increased CBF and glucose consumption.
CONCLUSION
The afferent function, that is, pre-and postsynaptic activity (including synaptic processing in the efferent cell) determines all properties of the hemodynamic signals accompanying functional activation. Spiking activity in relay neurons and interneurons may contribute as well, but there is no evidence that spiking activity in the efferent cells—efferent function—plays any role at all (Fig. 9). Therefore, the interpretation that “hot spots” in human brain maps represent functional units that communicate with one another is incorrect. It is as likely that these regions represent neuronal populations with decreased outgoing impulse traffic. Further work is needed to reach a better understanding of the mechanisms of the vascular signals, and the interaction between different types of neuronal circuits in producing them. A key to progress may be to stimulate circuits with defined input and output functions and to target the processes in those circuits with appropriate pharmacologic, genetic, and physiological tools. Examples of such circuits are given in Fig. 10.
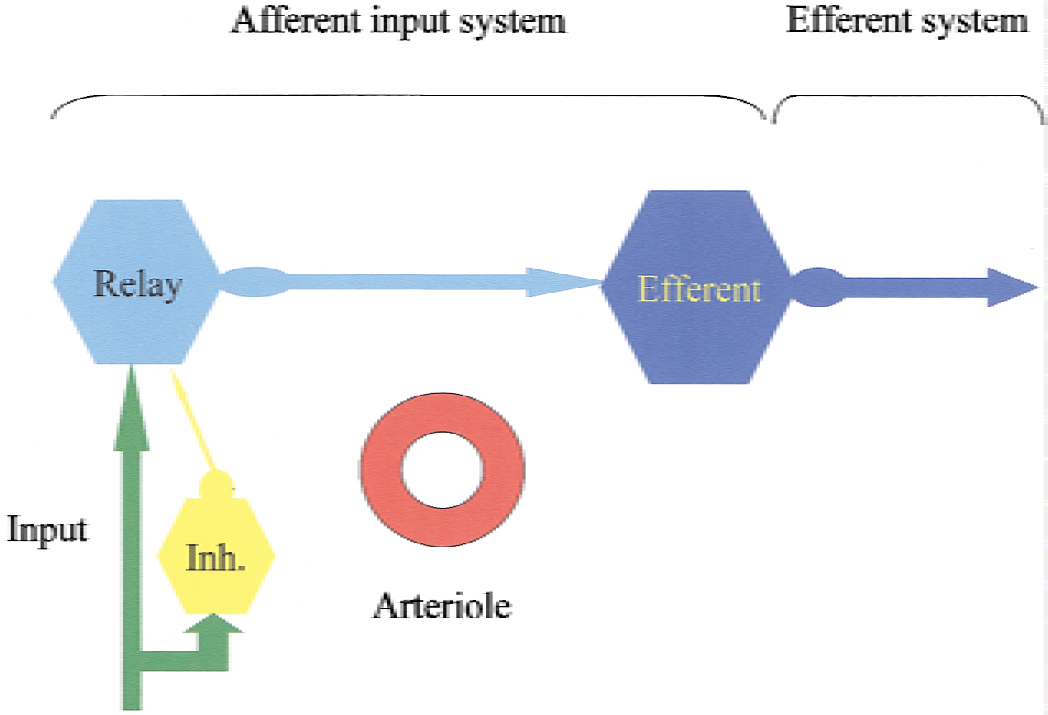
Diagram of neuronal circuits thought to be responsible for functional activation of cerebral blood flow. Activity-dependent increases in cerebral blood flow are related to activity in the afferent input system (i.e., local excitatory and inhibitory synaptic activity in relay neurons and the efferent cell, and possibly local spiking). Flow increases in the cortical microcirculation are unrelated to spiking activity in efferent neuron. Therefore, it is not possible, based on a local increase in cerebral blood flow, to decide whether the spiking activity out of a given region is increased or decreased.
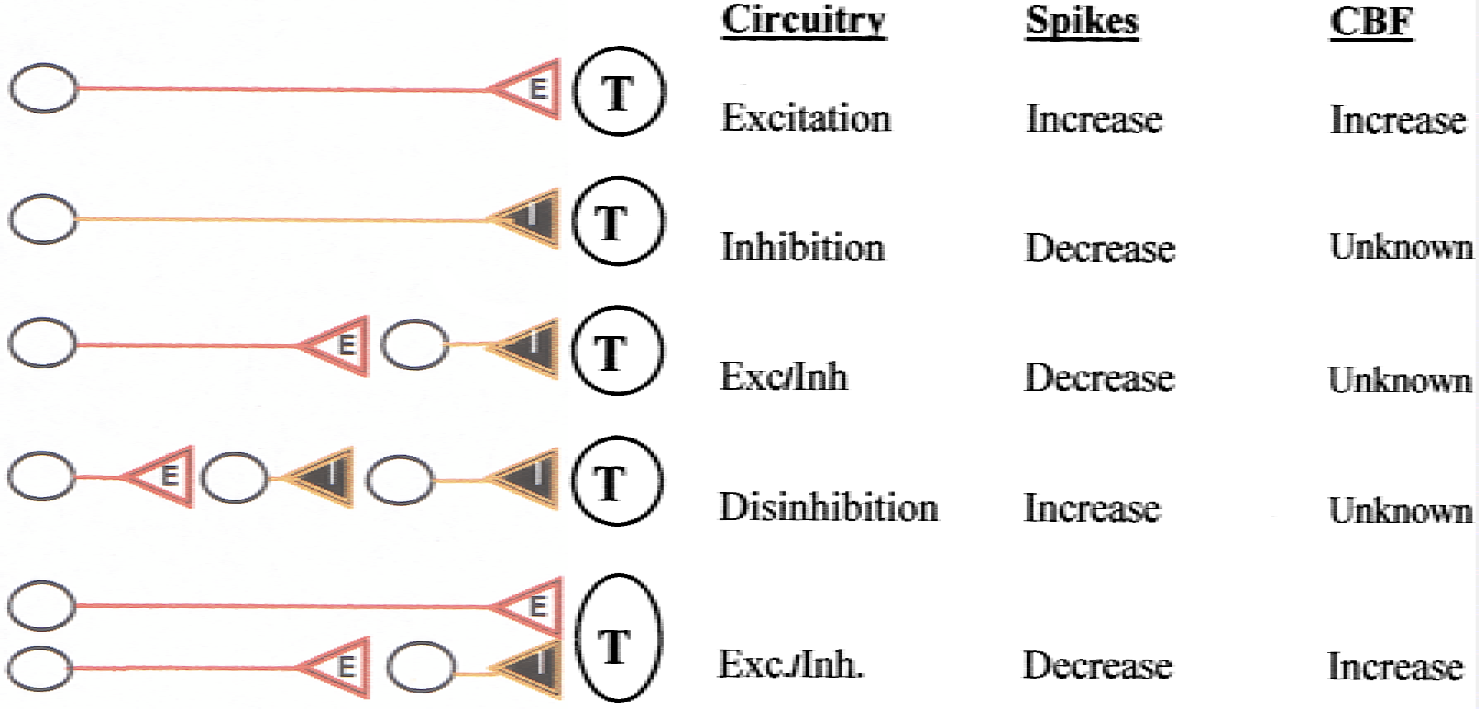
Examples of neuronal circuits of putative relevance for studies of coupling between neuronal activity and cerebral blood flow. We and others have demonstrated the hemodynamic changes produced by pure excitation (upper line) and the disynaptic input shown in the lowermost line (somatosensory afferents, cerebellar parallel fiber system). Future research will need to examine other examples, and examples of interaction between circuits to clarify the putative context-dependence of a vascular signal. E, excitatory; I, inhibitory; T, principal target cell.
Footnotes
APPENDIX 1
APPENDIX 2
Acknowledgments:
The author thanks Claus Mathiesen, PhD, for permission to publish figures that have only appeared in his doctoral thesis. In addition, he thanks Kirsten Caesar, MSc, for her helpful comments and assistance preparing the figures.