
Abstract
The severity of neurologic dysfunction after circulatory arrest depends on cerebral reperfusion during and after resuscitation. The objective of current study was to investigate the temporal and spatial patterns of the cerebral perfusion immediately after resuscitation. Precise control of circulatory arrest was achieved in rats by combination of asphyxia and transient blockage of cardiac-specific β-adrenergic receptors with esmolol, an ultra-short-acting β-blocker. Animals were randomized into 3 groups with resuscitation starting 0.5 (sham group, no asphyxia, n = 5), 4 (Group 2, n = 5), or 12 minutes (Group 3, n = 8) later by retrograde intraarterial infusion of donor blood along with a resuscitation mixture. Cerebral perfusion was measured by magnetic resonance imaging (MRI) using arterial spin labeling. The average perfusion before arrest was 163 ± 27 mL 100 g−1 min−1 under isoflurane anesthesia. Resuscitation led to transient perfusion increase, which started from thalamus and hypothalamus and later shifted to the cortex. Severe hypoperfusion to as low as 6% to 20% of the normal level developed in the first 10 to 20 minutes of reperfusion and lasted for at least 2 hours. On the fifth day after circulatory arrest, all animals showed a normal level of perfusion (159 ± 57 mL 100 g−1 min−1) and minimal neurologic deficit. Nevertheless, histologic examination revealed extensive changes in the CA1 region of the hippocampus consistent with global ischemia and reperfusion damage. The combination of an improved circulatory arrest model and noninvasive MRI cerebral perfusion measurements provides a powerful tool for investigations of circulatory arrest and resuscitation, allowing for evaluation of therapies aimed at modulating cerebral reperfusion.
Keywords
Neurologic outcome after circulatory arrest depends strongly on the recovery of cerebral circulation after resuscitation. Perfusion disturbances, notably the multifocal “no-reflow” phenomenon and protracted hypoperfusion, are the most common complications of recovery after global cerebral ischemia (Hossmann, 1993, 1997; Fischer and Hossmann, 1995; Gisvold et al., 1996; Böttiger et al., 1997). “No-reflow” is believed to result from a combination of increased blood viscosity and perivascular edema (Hossmann, 1993, 1997). Recent studies (Shaffner et al., 1998), however, indicate that the underlying causes may be more complicated and that an increased blood viscosity and reflex vasoconstriction are unlikely responsible for the “no-reflow” phenomenon. As for the development of the protracted hypoperfusion after resuscitation, the mechanism is largely unknown. Causal factors include possible down-regulation of endothelial nitric oxide synthase and disturbance of blood–vessel interactions caused by expression of adhesion molecules and generation of free radicals. Because of the complexity of the hemodynamic disturbances after circulatory arrest, a detailed characterization of the continuous time course of regional cerebral perfusion during and immediately after the resuscitation is clearly needed before any specific molecular interventions can be meaningfully considered for treating the underlying causes of ischemic neuronal injuries.
Compared with investigations of focal ischemia, the number of studies dealing with circulatory arrest is much less. The slower research advance in the latter is largely because of (1) the complexity of pathophysiologic changes after circulatory arrest and the difficulty in dealing with the multiple time points—from acute (minutes) to chronic (days); (b) the lack of a reproducible and controllable resuscitation model; and (c) the lack of experimental modalities for noninvasive follow up of long-term outcome. The authors recently developed an outcome model of cardiac arrest and resuscitation in rats (Liachenko et al., 1998). Here, the authors report the use of this model for continuous measurements of cerebral blood flow (CBF) before, during, and after circulatory arrest and resuscitation. Noninvasive magnetic resonance imaging (MRI) detection of cerebral perfusion with arterial spin labeling (Williams et al., 1992) was used. With sufficient spatial and temporal resolution, the authors were able for the first time to establish the regional reperfusion pattern in the critical period immediately after the return of spontaneous circulation (ROSC) and the time course for the region-dependent development of prolonged hypoperfusion.
MATERIALS AND METHODS
Circulatory arrest and resuscitation
The experimental protocol was approved by the authors' Institutional Animal Care and Use Committee. Eighteen male Sprague-Dawley rats (213 ± 27 g; Harlan Sprague-Dawley, Indianapolis, IN, U.S.A.) were randomized into 3 groups as listed in Table 1. In Group 1 (sham arrest, n = 5), rats were surgically prepared as described below and received all of the pharmacologic interventions but were not subjected to asphyxia. Resuscitation in this group started 30 seconds later. This group serves as a sham control to exclude any unforeseen complication caused by surgery or the use of pharmacologic agents. In Group 2 (n = 5) and Group 3 (n = 8), rats were subjected to 4 and 12 minutes of apnea, respectively.
Parameters of cardiac arrest and resuscitation
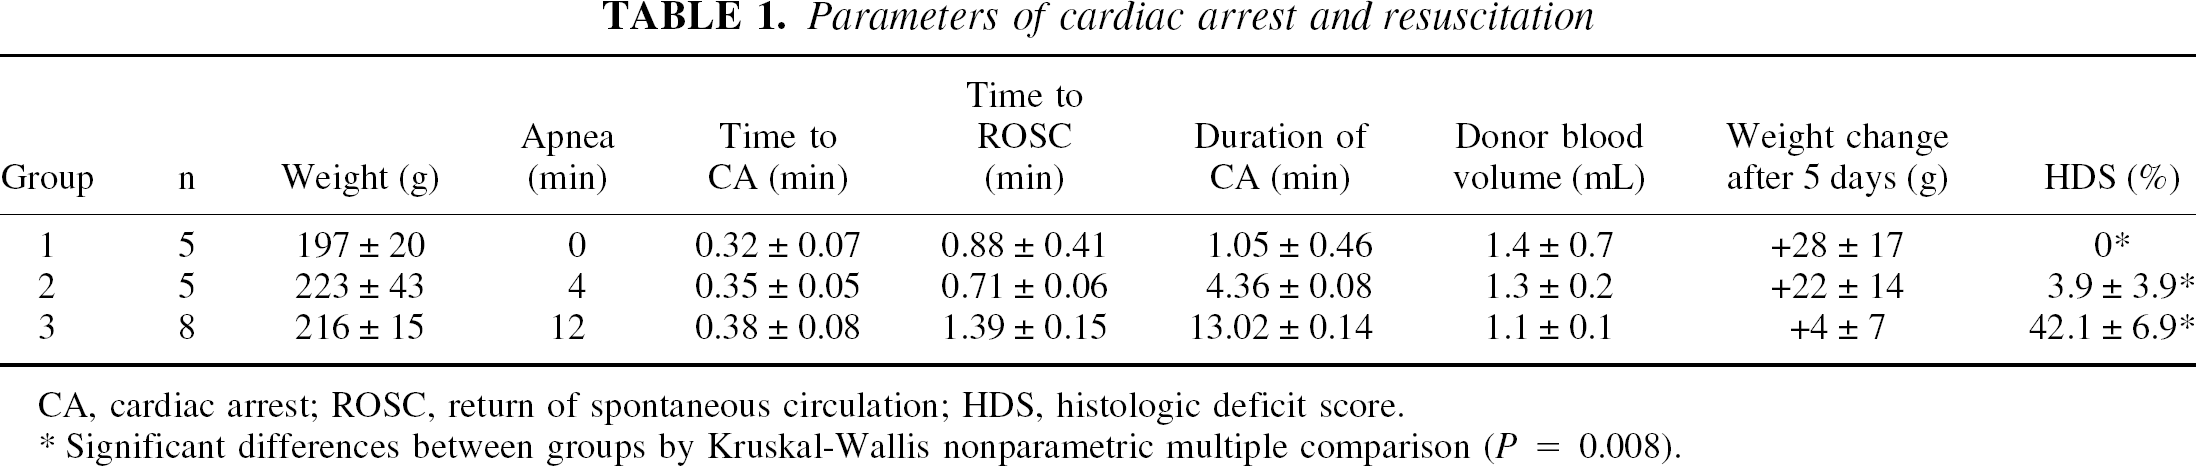
CA, cardiac arrest; ROSC, return of spontaneous circulation; HDS, histologic deficit score.
Significant differences between groups by Kruskal-Wallis nonparametric multiple comparison (P = 0.008).
The animal preparation procedure has been described previously (Liachenko et al., 1998). Rats were intubated orotracheally and mechanically ventilated with a tidal volume of 1 mL (100 g)−1 and 40 strokes per minute. Paralysis was achieved by pancuronium (2 mg kg−1 h−1). During surgery, anesthesia was maintained with 1.5% isoflurane in a 1:2 mixture of O2 and N2 O. Both femoral arteries and one of the femoral veins were cannulated with biocompatible tubing (Braintree Scientific, Braintree, MA, U.S.A.). Arterial blood pressure was monitored continuously using a computerized polygraph recorder built on LabVIEW program (National Instruments, Austin, TX, U.S.A.), and the arterial blood gases and pH were measured frequently using a Corning 278 pH/blood gas analyzer (Chiron Diagnostics, East Walpole, MA, U.S.A.). During MRI measurements, general anesthesia was maintained with 1.0% isoflurane in a 1:1 mixture of O2 and air. Mechanical ventilation parameters were carefully adjusted to achieve normal blood gas values before cardiac arrest for each animal. Rat body temperature, measured by a rectal temperature probe (YSI 402; Yellow Springs Instruments, Yellow Springs, OH, U.S.A.), was maintained at 36.7°C ± 0.3°C with a feedback-controlled air-heating blanket.
Five minutes before the induction of cardiac arrest, the short-acting muscle relaxant vecuronium (1 mg kg−1, intravenously) was given to ensure paralysis. Cardiac arrest was induced in all groups by a rapid intravenous injection of 6.25 mg esmolol (an ultra-short-acting β-blocker, in 0.25 mL saline) to achieve a rapid onset of circulatory arrest. The dose of esmolol was chosen to be comparable with the clinical concentration for reversible cardioplegic arrest or minimal myocardial contraction during cardiopulmonary bypass and coronary artery surgeries (Ede et al., 1997; Warters et al., 1998; Mehlhorn et al., 1999). For Groups 2 and 3, mechanical ventilation and heating were stopped during the time of cardiac arrest. Circulatory arrest was indicated by a sharp decrease in mean arterial blood pressure (MABP) to less than 10 mm Hg. Resuscitation began with restoration of the ventilation using the same setting as before cardiac arrest but without isoflurane, and with the infusion into the femoral artery of fresh donor arterial blood mixed with epinephrine (8 μg/mL), sodium bicarbonate (0.05 mEq/mL), and heparin (5 U/mL). Blood infusion was accomplished manually to elevate MABP greater than 20 mm Hg and was stopped at the first sign of mechanical cardiac activity, which was followed shortly by ROSC in all rats. Animals then were continually ventilated for ≥3 hours with a 1:1 mixture of O2 and air. Anesthesia was gradually reinstated with up to 1% isoflurane if signs of awakening were observed or if heart rate increased to ≥300 beats per minute.
At least 3 hours after resuscitation and under isoflurane general anesthesia, the arterial and venous catheters were surgically removed and the wounds were closed. Rats then were mechanically ventilated with room air and were extubated upon return of spontaneous breathing.
Outcome evaluation
Animals were observed closely for 5 days after resuscitation. Neurologic deficit scores (NDS) were evaluated by the same investigator using the criteria proposed by Neumar and coworkers (Neumar et al., 1995). This system is based on the empirical evaluation of the neurologic appearance of the animals in five categories, as listed in Table 2. A maximum score of 500 is considered neurologically normal, whereas a score of 0 is considered as brain dead. After final NDS evaluation on the fifth day, rat brains were perfused with buffered 10% formalin for conventional hematoxylin and eosin histologic staining (Liachenko et al., 1998). Histologic damage was evaluated by counting the total and ischemic neurons in the CA1 regions of the hippocampus and was performed independently by two investigators blind of animal groups. Histologic deficit score (HDS) was calculated as the percentage ratio of the ischemic to total neurons in the CA1 regions in both hemispheres.
Neurologic deficit scoring system for rats
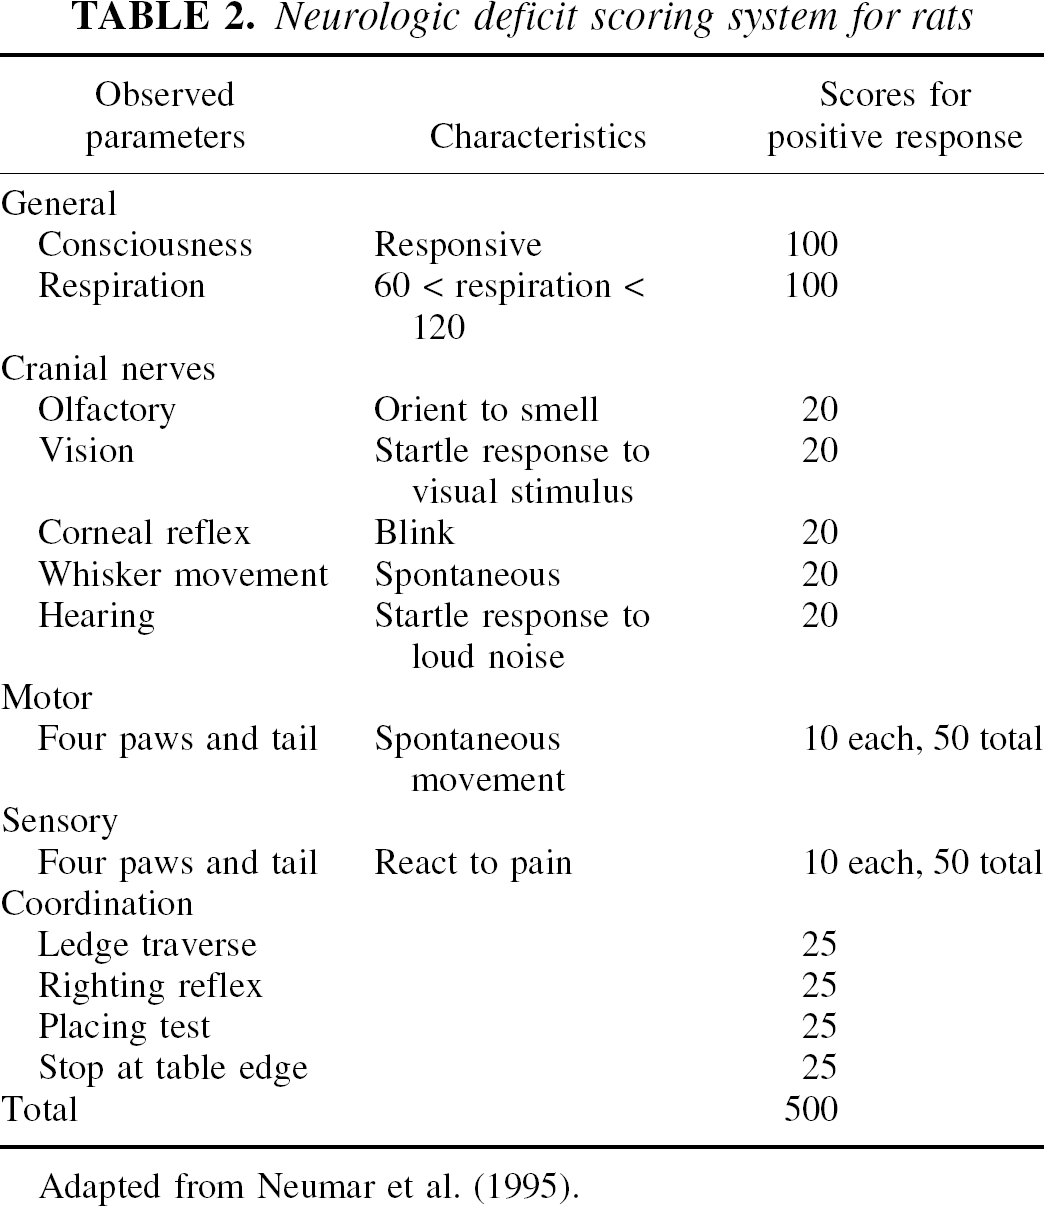
Adapted from Neumar et al. (1995).
Magnetic resonance imaging measurements
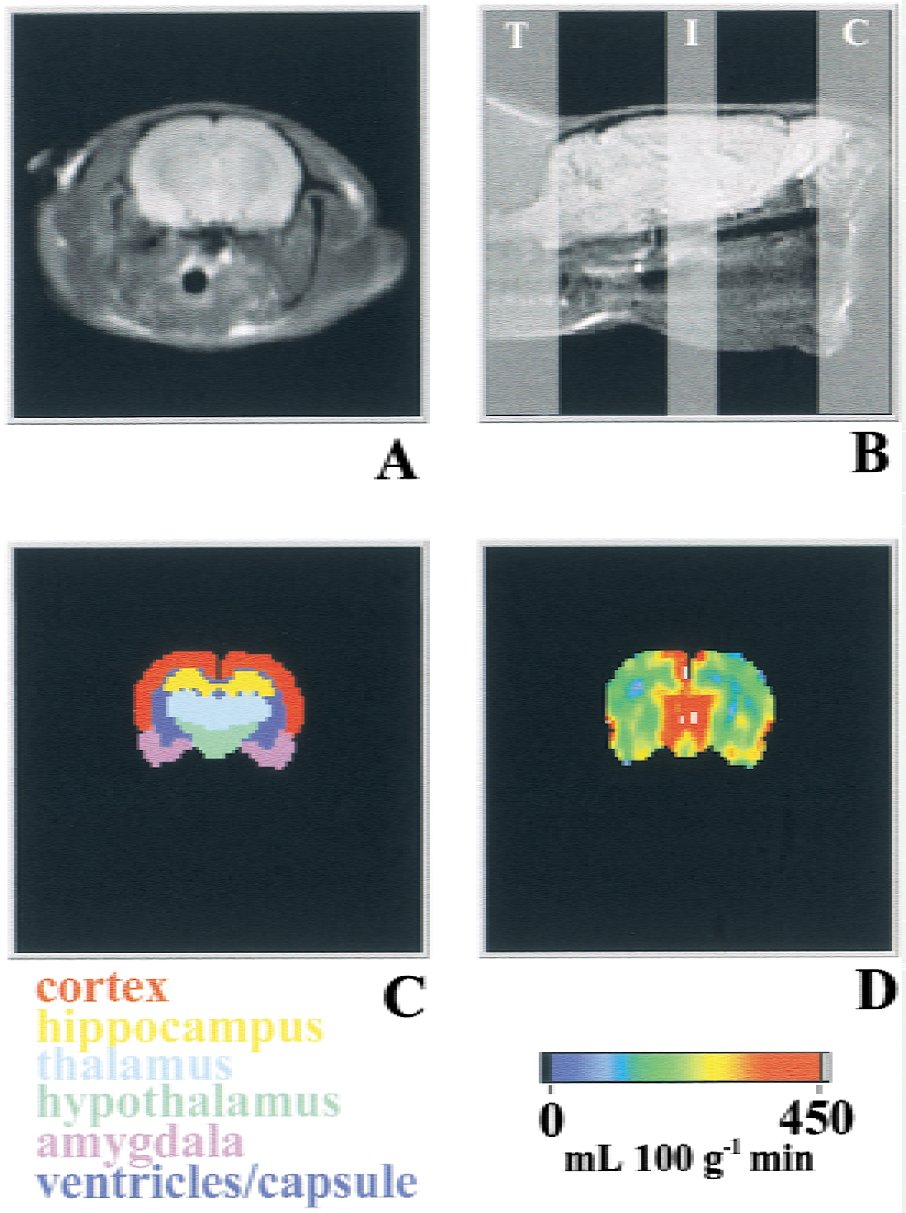
Animals were positioned inside a 9.4-T superconducting magnet of an Otsuka CMXW-400SLI imaging spectrometer for perfusion measurements, using the arterial spin labeling technique (Williams et al., 1992). Rats were snugly positioned (head up) in a specially designed cradle of a birdcage probe (Xu and Tang, 1997). Perfusion images were acquired at the dorsal hippocampus level (level 30–32 according to Swanson (1998), see Fig. 1) using an otherwise conventional spin-echo sequence except that an adiabatic arterial spin tagging pulse of 0.8 second was given during the relaxation delay (TR) period. The tagging pulse, with a B1 power of 8 to 12 μT in the presence of a 12-mT m−1 magnetic field gradient, was applied 1.4 cm away from the imaging plane at the neck level. Control images were acquired with tagging pulses given at a plane that is in mirror symmetry to the tagging plane with respect to the imaging plane. Other imaging parameters were: echo time = 14 milliseconds, TR = 1 second, NA = 2, ST = 3 mm, matrix size = 128 × 64, field of view = 44 × 44 mm2. Perfusion maps were calculated pixel-by-pixel using the following equation (Williams et al., 1992):
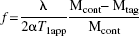
Reconstruction of perfusion imaging. For each rat,
where f is the CBF in mL g−1s−1, λ is the brain–blood partition coefficient for water (0.9 mL g−1 for the rat brain (Herscovitch and Raichle, 1985)), T1app is the apparent T1 relaxation time in seconds, α is the degree of inversion, and Mcont and Mtag are the pixel intensities of control and tagged images, respectively. The degree of arterial spin inversion α was measured in the carotid arteries near the imaging plane (0.8 cm away) with tagging pulse given in the normal tagging plane, as described by Zhang et al. (1993). Tagged and control images were acquired alternately in long trains and perfusion maps were constructed from each adjacent pair, resulting in a temporal resolution of 2.5 minutes per perfusion map. T1app and water apparent diffusion coefficient (ADC) maps were acquired in parallel experiments before and after cardiac arrest. T1app maps were acquired using the method of saturation recovery. Diffusion-weighted images were acquired in sets of five using spin-echo pulse sequence with additional 5-millisecond Stejskal-Tanner diffusion gradients, applied in the readout direction on both sides of the 180° refocusing pulse to produce diffusion-weighting b factors of 0, 20, 81, 182, and 324 seconds mm−2, respectively. Other acquisition parameters were the same as for the perfusion measurement. Apparent diffusion coefficient maps were derived using exponential fitting of diffusion-weighted images pixel by pixel using equation:

Where I(0) and I(b) are pixel intensities of images with additional diffusion-weighting factor of 0 and b, respectively. Temporal resolution was 12.5 minutes per ADC map.
Data analysis
For each individual rat, an anatomic mask was generated using images from stereotaxic rat brain atlas (Swanson, 1998). Masks were digitally scaled to fit a spin-echo image of each individual brain according to its position and size (Fig. 1). The average perfusion or ADC in several selected regions of the brain was calculated using the LabVIEW software. Statistical analysis was performed using the SPSS program (SPSS, Chicago, IL, U.S.A.). One-way analysis of variance (ANOVA) was used to compare between-group means of various parameters. If the assumption of normal distribution was violated (for example, for HDS), nonparametric Kruskal-Wallis H test was used instead of ANOVA. Repeated measures ANOVA was used to determine the within-group changes and between-groups differences in perfusion and blood pressure over time. Student-Neuman-Keuls and Bonferroni post hoc multiple-comparison tests were used to determine the overall differences between groups and differences at given time points. All data are reported as mean ± SD unless specified. Neurologic deficit scores and HDS were analyzed by the nonparametric methods and reported as mean ± SEM.
RESULTS
Important parameters for cardiac arrest and resuscitation are summarized in Table 1. As expected, the esmolol injection caused a rapid onset of cardiac arrest. Figure 2 shows the representative trace of arterial blood pressure before, during, and after circulatory arrest and resuscitation from a rat in Group 3 (12-minute asphyxia). The time from the onset of asphyxia and esmolol injection to the circulatory arrest was 0.38 ± 0.08 minute in this group. The detailed recording during this period is shown in the insert to Fig. 2. Traces for other groups are similar except for the duration of the circulatory arrest time. The infusion of donor blood and reventilation resulted in an increase in MABP, leading to ROSC. All rats were successfully resuscitated within highly reproducible time intervals. The no-flow time also was reproducible and was typically equal to the asphyxia time plus 0.5 to 1.0 minutes (Table 1). Table 3 lists the arterial blood pH, Pa co2, and Pa o2 before cardiac arrest and 2 hours after resuscitation. Because of strong dependence of CBF on Pa co2, special attention has been paid to control the ventilation to maintain the Pa co2 level before cardiac arrest within the normal range of 35 to 40 mm Hg. Two hours after resuscitation, the arterial blood pH, Pa co2, and Pa o2 in Groups 2 and 3 were not significantly different from the corresponding values in the sham-arrested rats (Group 1).
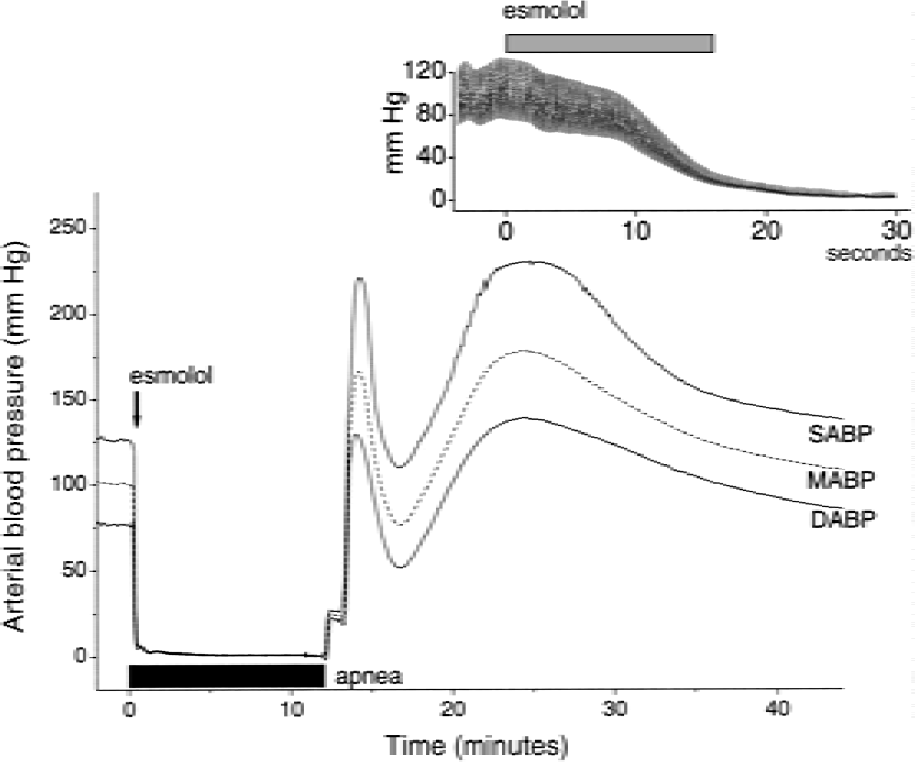
Representative traces of blood pressure before, during, and after circulatory arrest. Cardiac arrest was induced by injecting 6.25-mg esmolol (arrow) and 12-minute apnea (marked by the black horizontal bar). (Insert) Detailed recording of the real-time tracing of arterial blood pressure on injection of esmolol (gray horizontal bar). SABP, MABP, and DABP represent systolic, mean, and diastolic arterial blood pressure, respectively.
Arterial blood pH and blood gases before cardiac arrest and after resuscitation
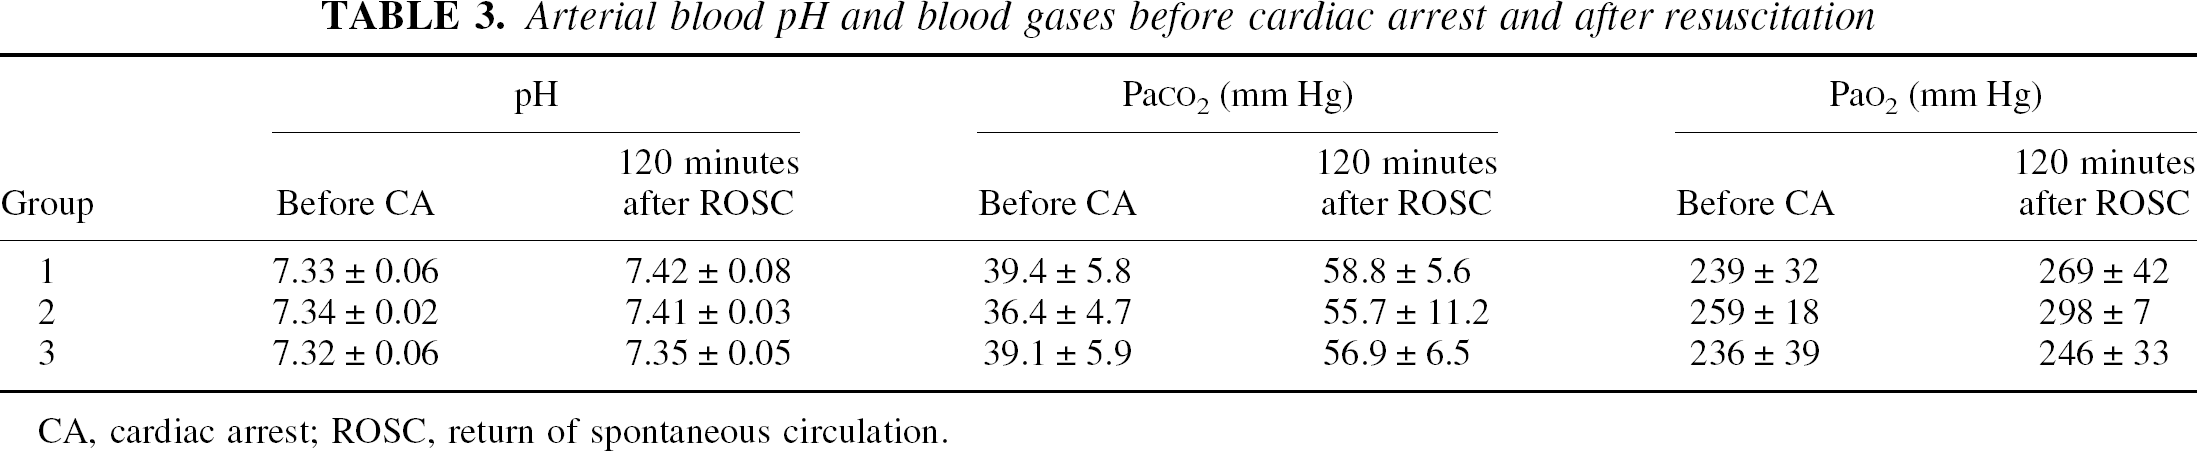
CA, cardiac arrest; ROSC, return of spontaneous circulation.
Body temperature of the rats did not change during the circulatory arrest in Groups 1 and 2 despite no heating during the arrest. Rectal temperatures at the time of resuscitation were 36.4°C ± 0.3°C and 36.7°C ± 0.3°C in Groups 1 and 2, respectively, and remained essentially unchanged thereafter (37.0°C ± 0.6°C, F = 2.814, P = 0.235 and 36.6°C ± 0.8°C, F = 0.123, P = 0.744, respectively). For animals with 12 minutes of cardiac arrest (Group 3), rectal temperature dropped at the time of resuscitation (35.7 ± 0.4°C, P = 0.009) and continued to decrease for at least 20 minutes after ROSC (34.5 ± 0.5°C, P = 0.004) despite reheating. One hour after resuscitation, body temperature of rats in Group 3 recovered to the prearrest level and reached 37.3°C ± 0.3°C at the end of observation.
The quality of nuclear magnetic resonance imaging remained constant throughout the circulatory arrest and resuscitation procedures. The authors' remote resuscitation method was by design to minimize any mechanical interference to the MRI acquisition. Relatively low tagging power was used purposely in the current studies because the authors' preliminary experiments (data not shown) revealed adverse effects of high-power tagging in resuscitating animals. Possible causes of complication with high tagging power include local overheating of tissue (especially the brain) when cerebral perfusion is stopped during the circulatory arrest. The power of tagging pulses was experimentally adjusted to the minimal level that did not interfere with resuscitability and yet was sufficient to satisfy the adiabatic tagging conditions for perfusion measurement. The degree of spin inversion near the imaging plane under such tagging conditions (the α value) was repeatedly measured and was 0.48 ± 0.01 before cardiac arrest, 0.42 ± 0.11 within 1 hour after resuscitation, and 0.46 ± 0.01 for the rest of observation period. One-way ANOVA found no significant differences among these values (F = 2.277, P = 0.153). At 9.4 T, the apparent longitudinal relaxation time constant, T1app, before cardiac arrest was nearly homogenous across the brain regions and was equal to 1.90 ± 0.03 seconds (n = 4). T1app increased to 2.06 ± 0.02 (n = 7) after resuscitation (t = 11.934, P < 0.001). Because of small regional variation in the measured T1app at 9.4 T, regional T1app values were averaged separately before cardiac arrest and after resuscitation using the brain region masks similar to that shown in Fig. 1C. These regional T1app values were used in the calculations of perfusion maps before cardiac arrest and after resuscitation (see below).
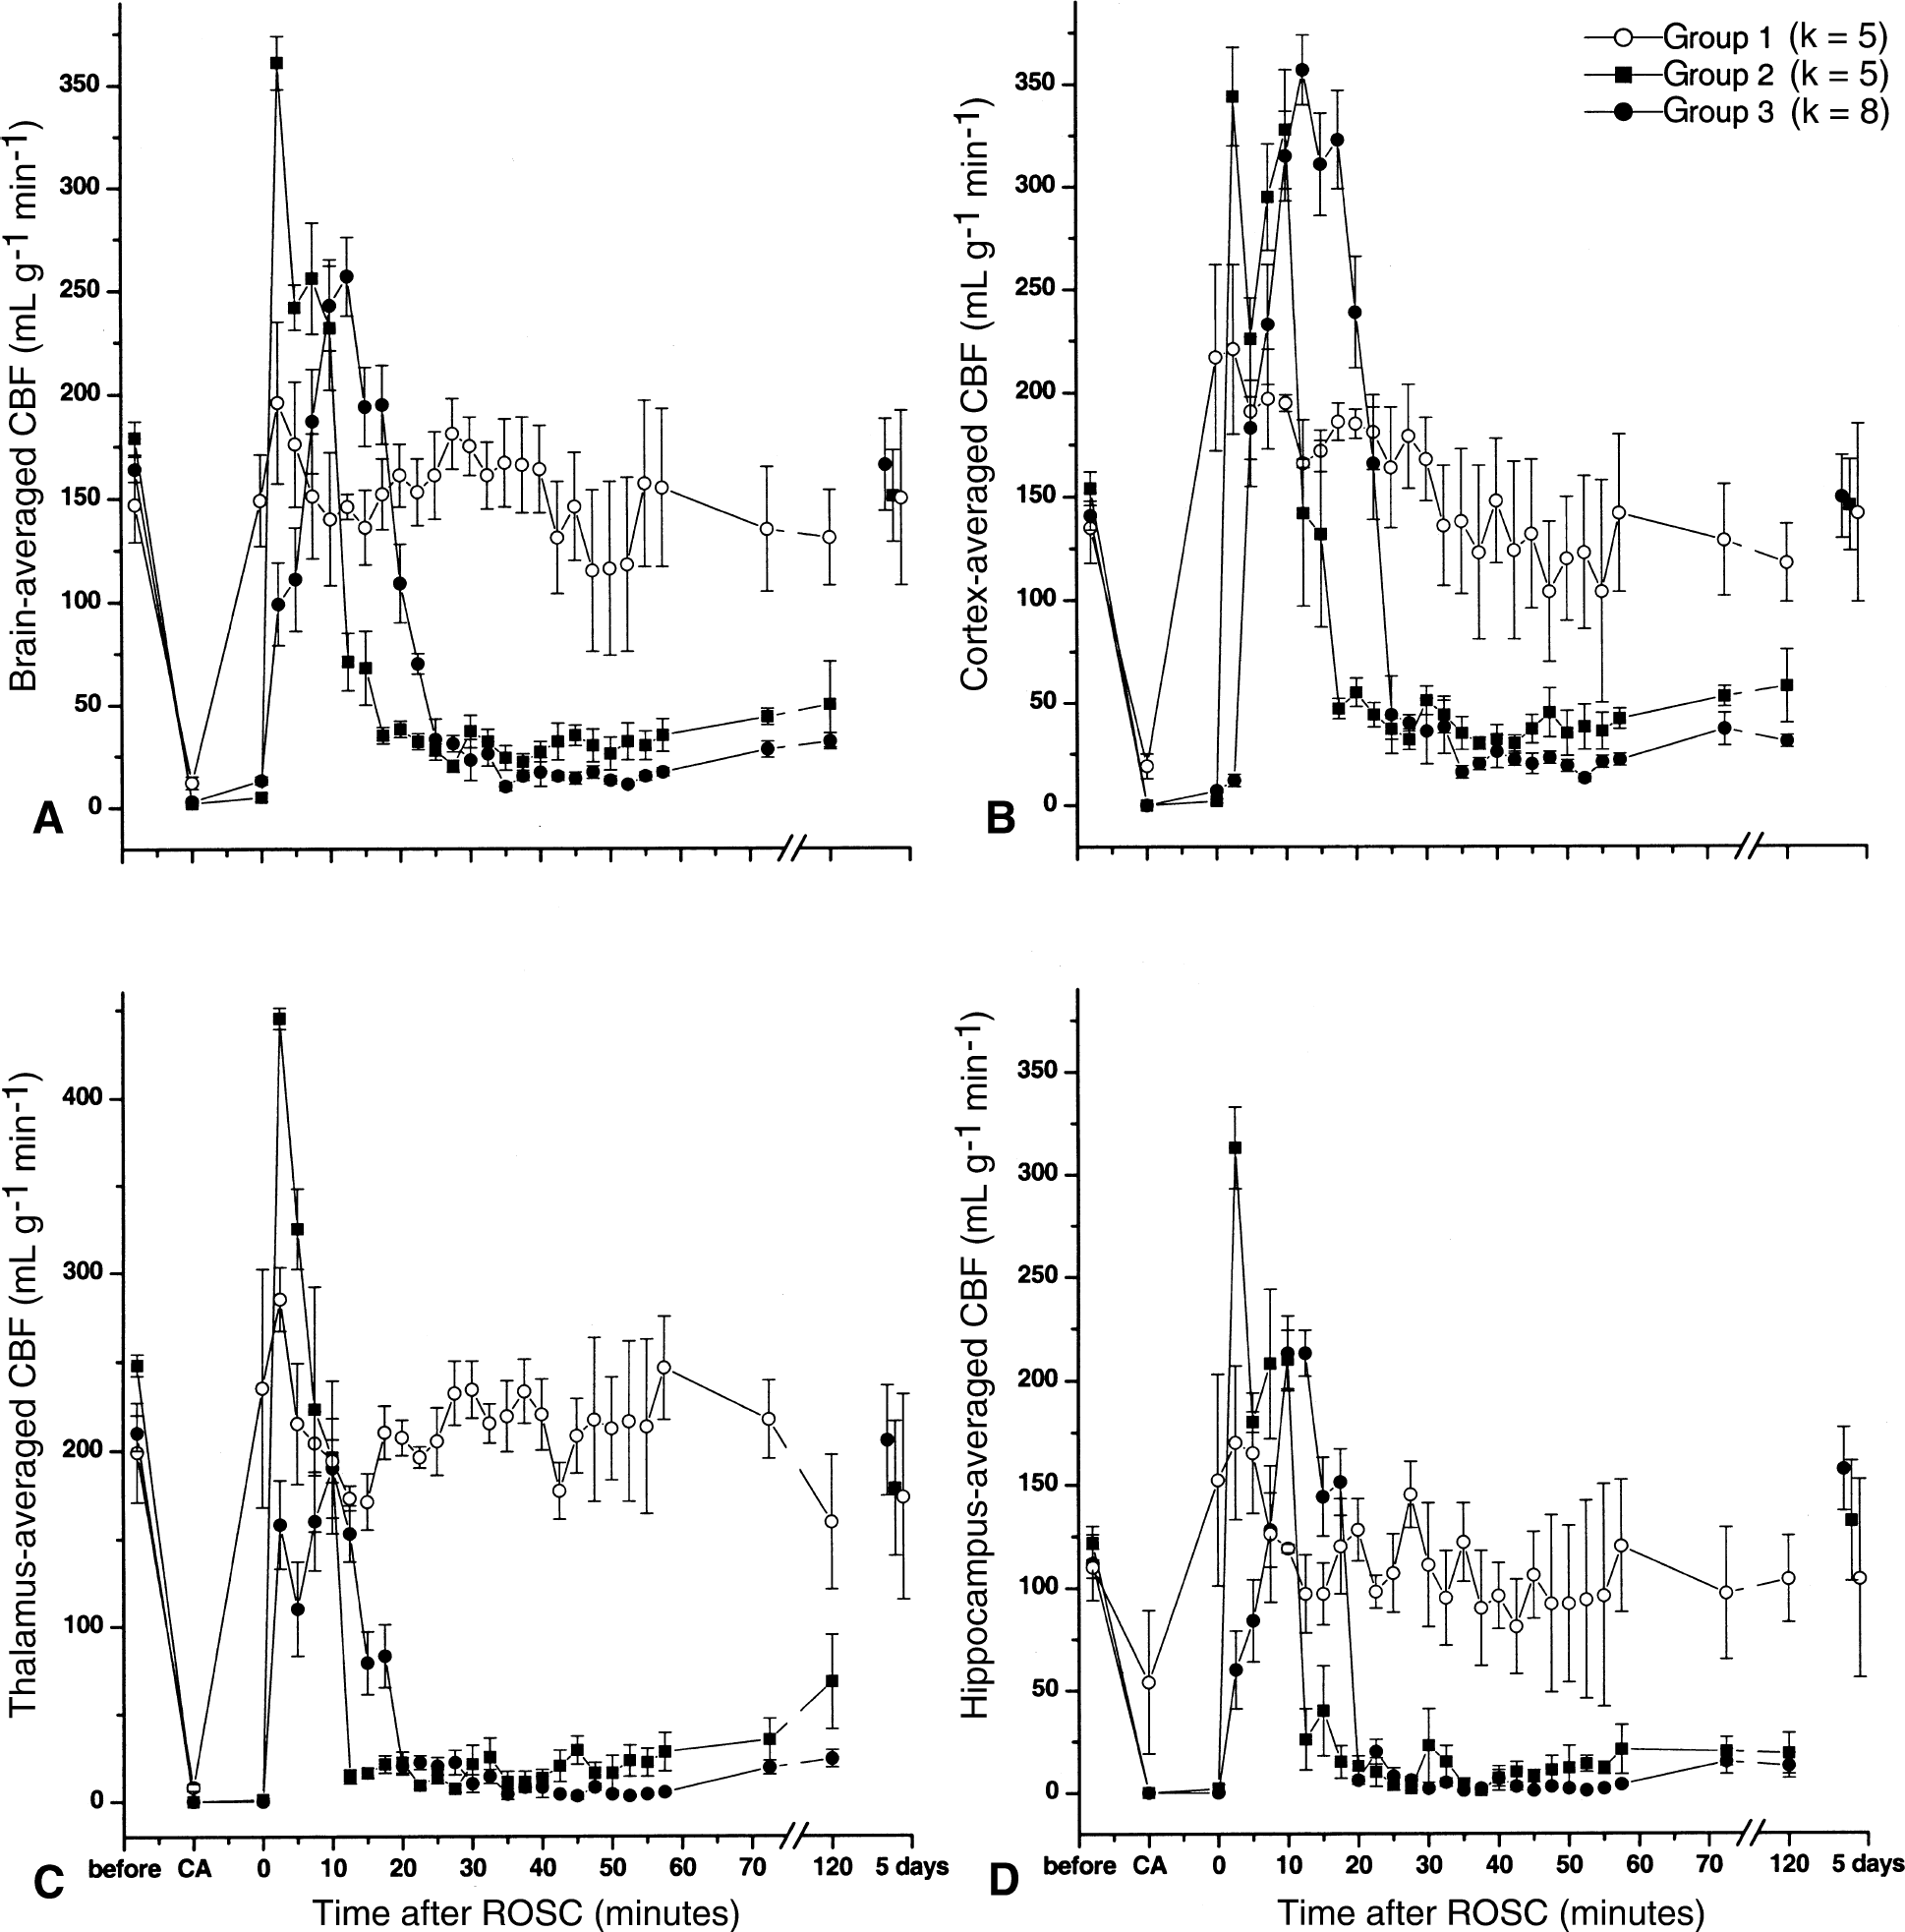
Before cardiac arrest, the normal cerebral perfusions in different regions of the brain under 1% isoflurane general anesthesia are summarized in Table 4 along with the MABP and heart rates. Table 5 lists the values of postresuscitation CBF and MABP at their peak values (observed at 2.5 minutes after ROSC for Groups 1 and 2 and at 12.5 minutes after ROSC for Group 3) and at 2 hours after recovery, along with the heart rate at the corresponding time points. One-way ANOVA revealed significant between-group differences in peak values of CBF (F = 10.727, P = 0.001), MABP (F = 18.178, P < 0.001), and heart rate (F = 21.213, P < 0.001). Two hours after resuscitation, CBF in Groups 2 and 3 differed significantly from that in Group 1 (F = 15.699, P < 0.001), but MABP and heart rate showed no significant difference among groups at this time point. Figure 3 depicts representative sets of cerebral perfusion maps from each group before and during circulatory arrest, and shortly and 5 days after resuscitation. Figure 4 shows the average cerebral perfusion in different regions of the rat brain as a function of time. As seen in Figs. 3 and 4, circulatory arrest leads to a rapid cessation of cerebral blood flow. The complete no-flow state in the sham-arrested animals (Group 1) could not be detected because the arrest duration is shorter than the temporal resolution of the perfusion measurements. The resuscitation procedure resulted in a moderate CBF increase in the sham group, followed by a rapid return of CBF to the normal level. In Groups 2 and 3, the reflow on resuscitation differed significantly from the CBF in the sham group (F = 34.452, P < 0.001). Reperfusion started in the thalamic and hypothalamic region and shifted to the cortex later. A transient overshoot in perfusion after ROSC was observed in the cortex (Groups 2 and 3) and thalamus (Group 2). By comparing the pattern of regional reperfusion in Groups 2 and 3, it is clear that the shorter duration of circulatory arrest is followed by an earlier and more intense hyperperfusion in the cortex and a more rapid development of protracted hypoperfusion. In Group 3, the restoration of CBF after ROSC was delayed and lasted longer than in Group 2. The severe hypoperfusion started also from the basal nucleus regions and rapidly spread to the entire brain. At the end of the initial MRI observation period (2 hours after ROSC), cerebral perfusion did not show significant recovery in most brain areas. Cerebral blood flow recovered to the normal level and showed no significant between-group differences 5 days after resuscitation (F = 0.121, P = 0.887).
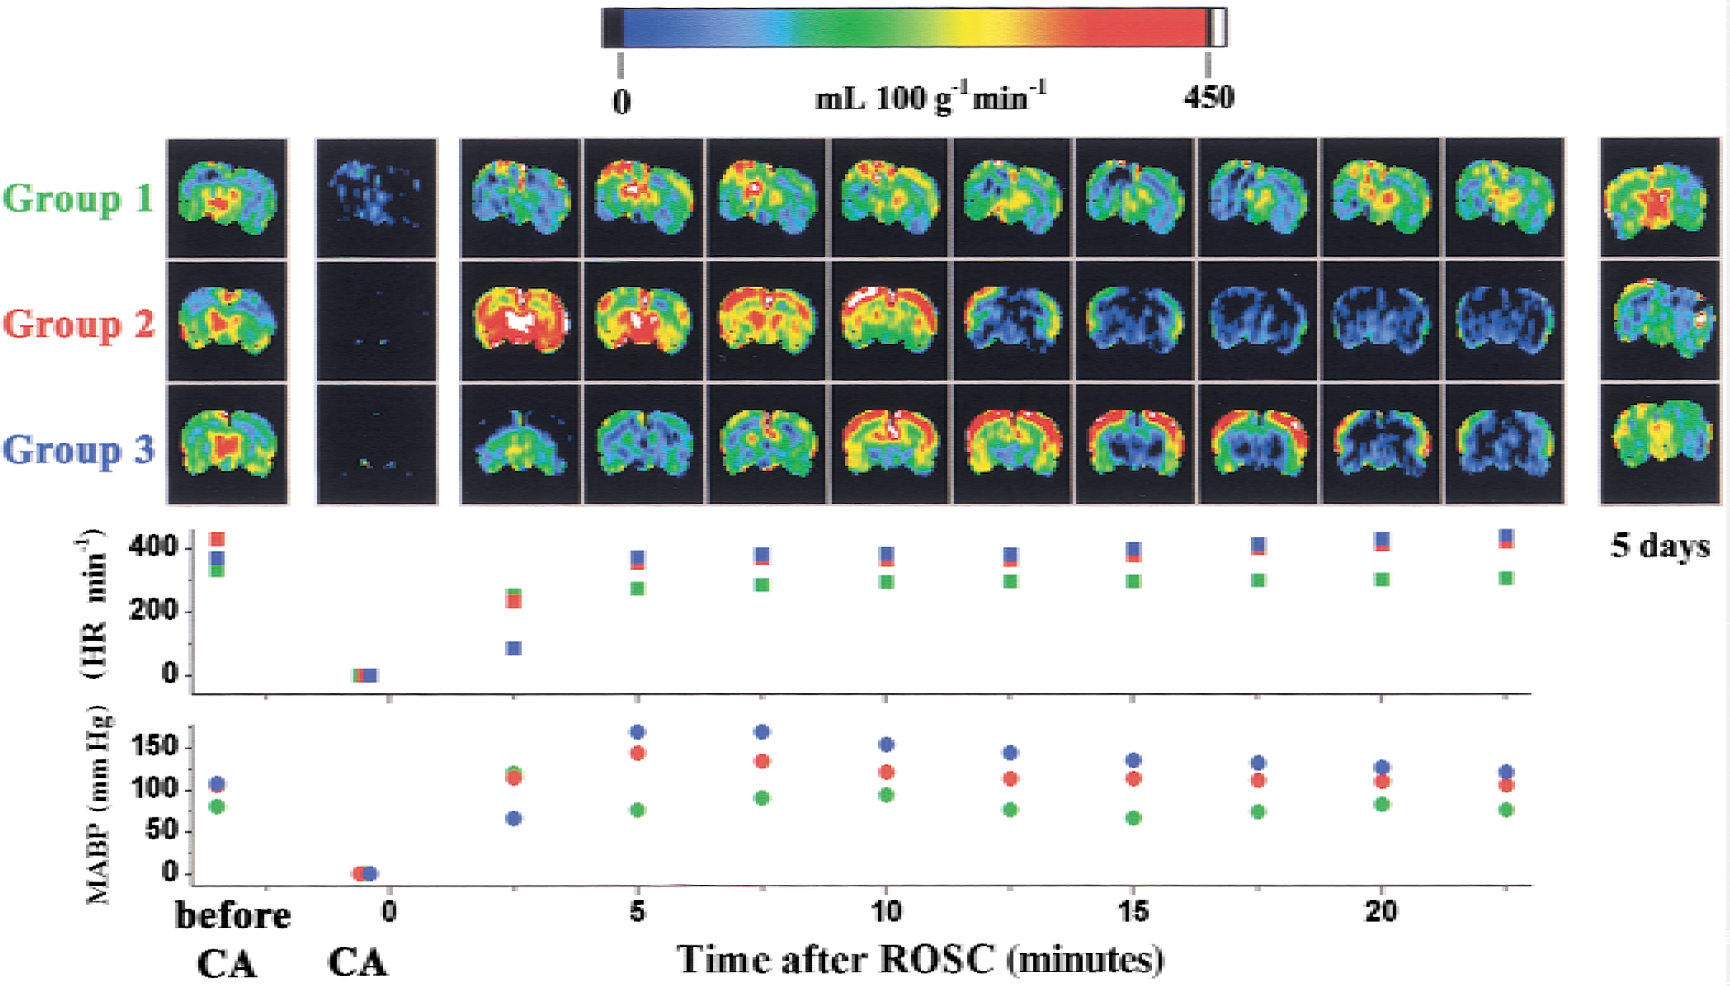
Representative perfusion images of rat brains before and during circulatory arrest (CA), immediately after return of spontaneous circulation (ROSC), and 5 days after CA. Colors in images represent cerebral perfusion (mL 100 g−1 min−1), according to the color scale above the images. CA was induced by esmolol and 0, 4, and 12 minutes of asphyxia (Groups 1, 2, and 3, respectively). The corresponding mean arterial blood pressure (circles) and heart rate (squares) also are shown, with the point of ROSC arbitrarily designated as time 0. Group 1: green; Group 2: red; Group 3: blue.
Cerebral blood flow (CBF) averaged within the brain
Regional CBF and hemodynamics in rats before cardiac arrest
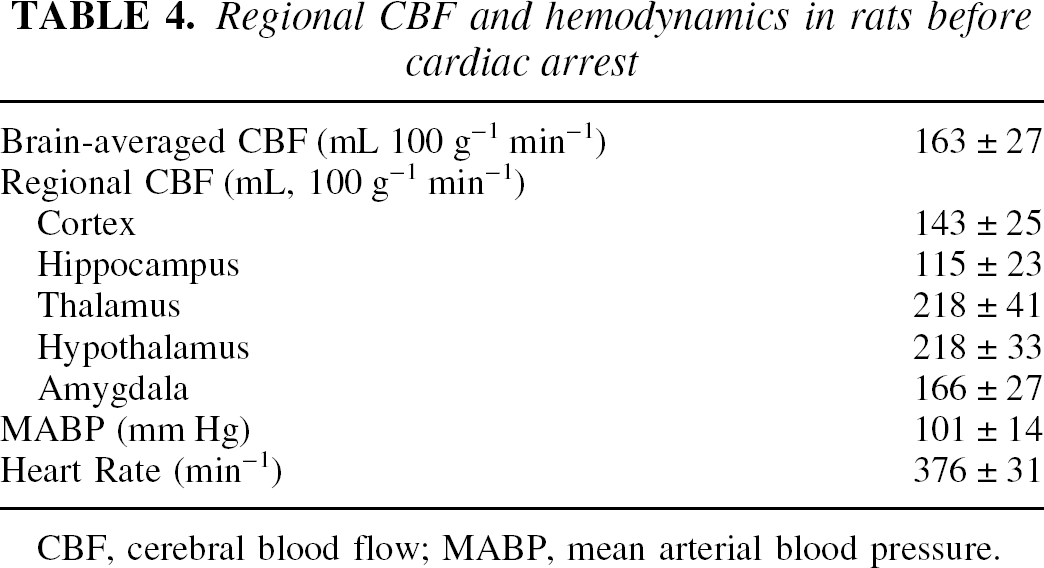
CBF, cerebral blood flow; MABP, mean arterial blood pressure.
Cerebral perfusion and hemodynamics in rats after resuscitation
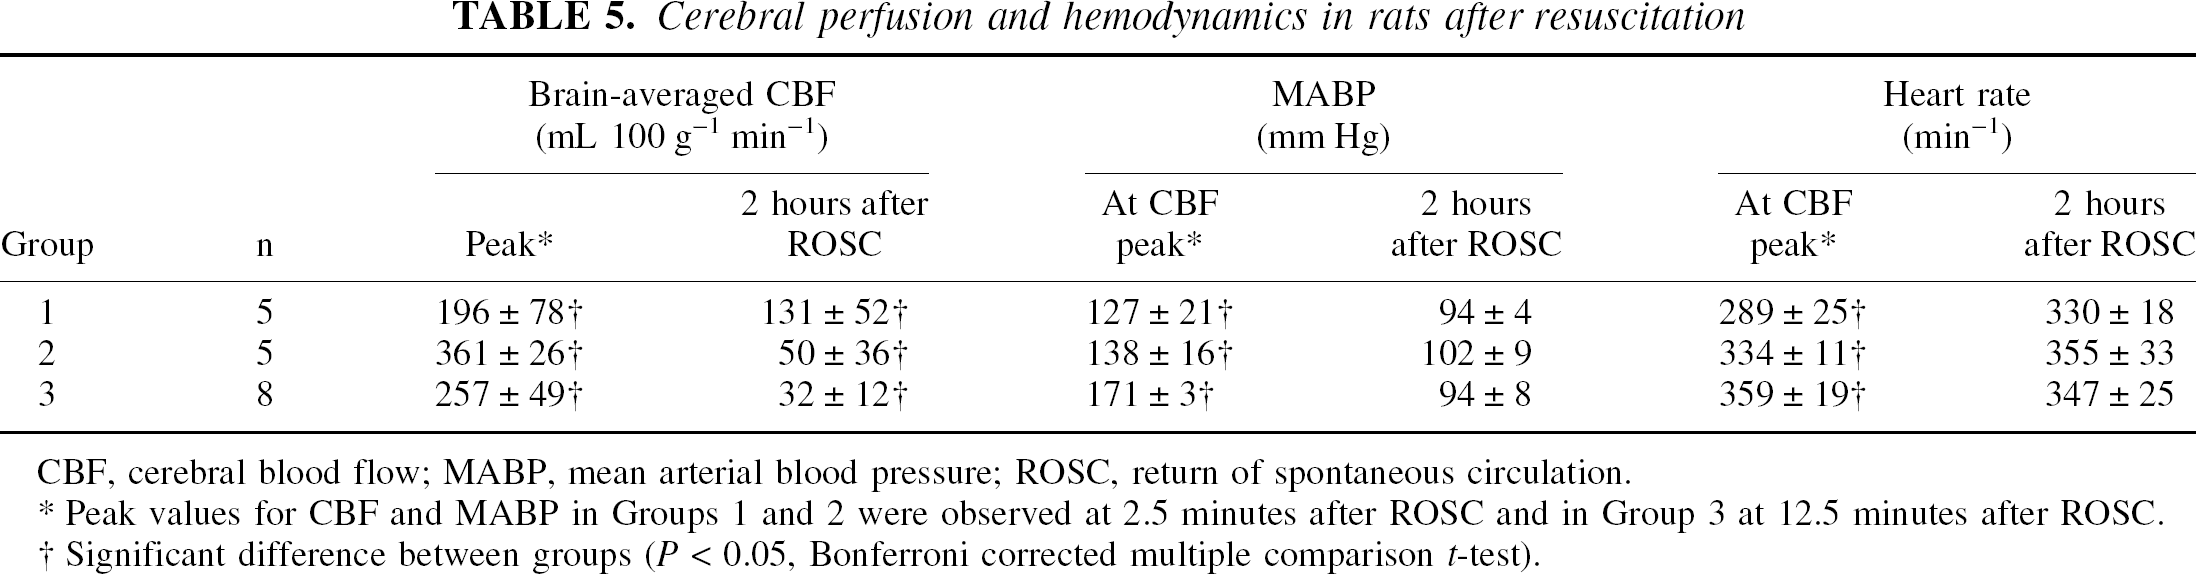
CBF, cerebral blood flow; MABP, mean arterial blood pressure; ROSC, return of spontaneous circulation.
Peak values for CBF and MABP in Groups 1 and 2 were observed at 2.5 minutes after ROSC and in Group 3 at 12.5 minutes after ROSC.
Significant difference between groups (P < 0.05, Bonferroni corrected multiple comparison t-test).
Figure 5 shows representative ADC maps and the brain-averaged water ADC before circulatory arrest (CA) and at different time points after ROSC. Despite the protracted hypoperfusion, the values of ADC did not change significantly during the late postresuscitation reperfusion period (F = 2.911, P = 0.078 for within groups and F = 0.329, P = 0.737 for between groups by repeated measures ANOVA).
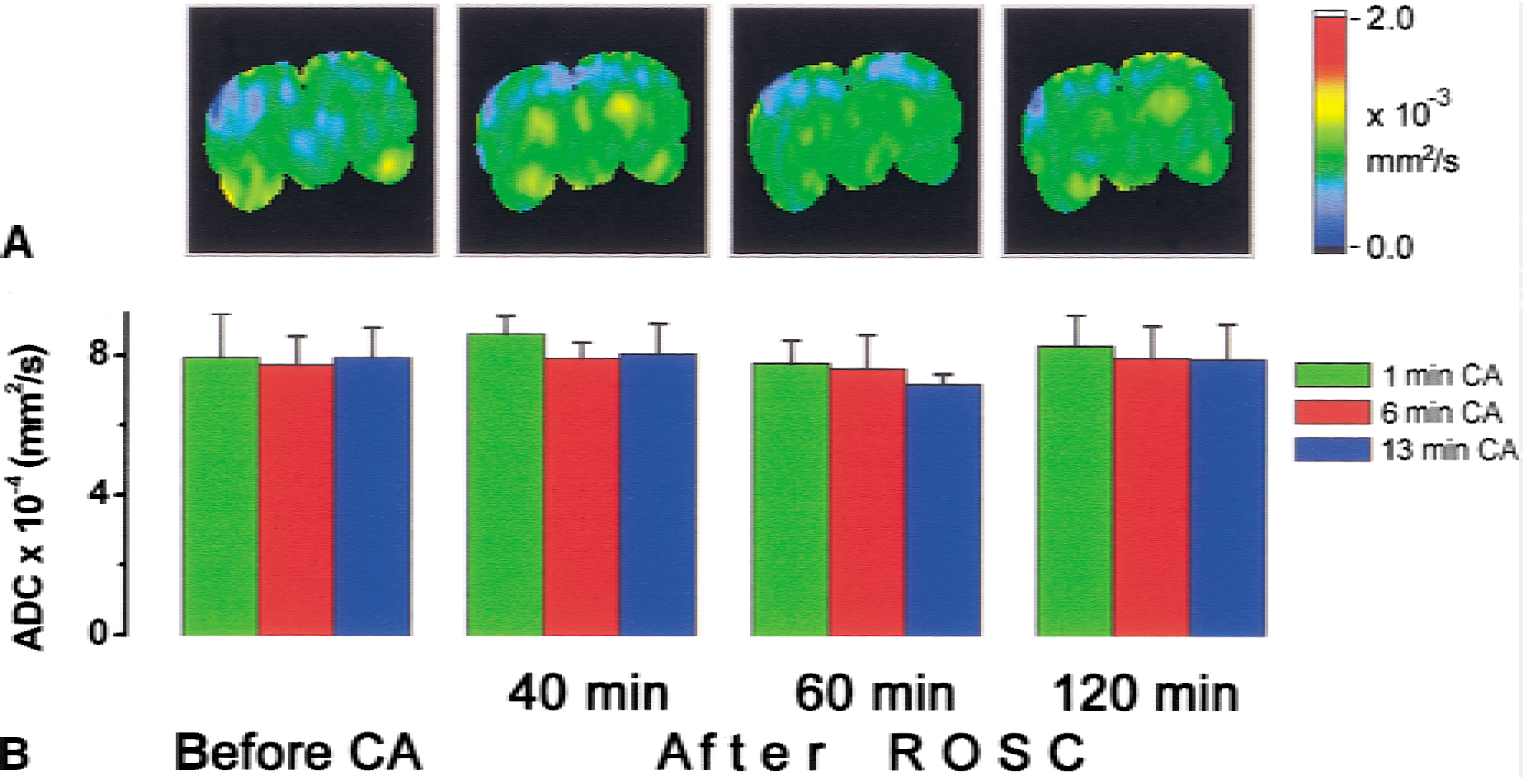
Representative apparent diffusion coefficient (ADC) maps
All animals were alive on the fifth day after the circulatory arrest and showed normal values (480 to 500) of NDS. Others also found normal NDS in rats 3 to 7 days after cardiac arrest and resuscitation (Schmitz et al., 1997; Krep et al., 2000). Rats in Group 3 showed no significant change in weight on the fifth day after resuscitation, whereas those in Groups 1 and 2 gained weight (Table 1).
Sham-arrested animals did not show any histologic abnormalities, indicating that the experimental procedures as such, particularly the separate use of esmolol and resuscitation mixture, do not cause neuronal damage. Typical histology damages in the other two groups were characterized by the cytoplasm eosinophilia, nuclear pyknosis, and in rare occasions karryorhexis in the CA1 region of the hippocampus (Fig. 6). Damage was found symmetrical on both sides of the brain, except for 1 rat in Group 2, for which approximately 15% of neurons in the CA1 region were damaged in 1 hemisphere but appeared healthy in the other. Notably, the observed CBF changes in this rat were symmetrical. The histologic damage, scored by the percentage of pyknotic neurons in the CA1 regions, are 0%, 3.9% ± 3.9%, and 42.1% ± 6.9% in Groups 1, 2, and 3, respectively. Kruskal-Wallis H test shows significant difference among the three groups (χ-square = 9.643, P = 0.008).
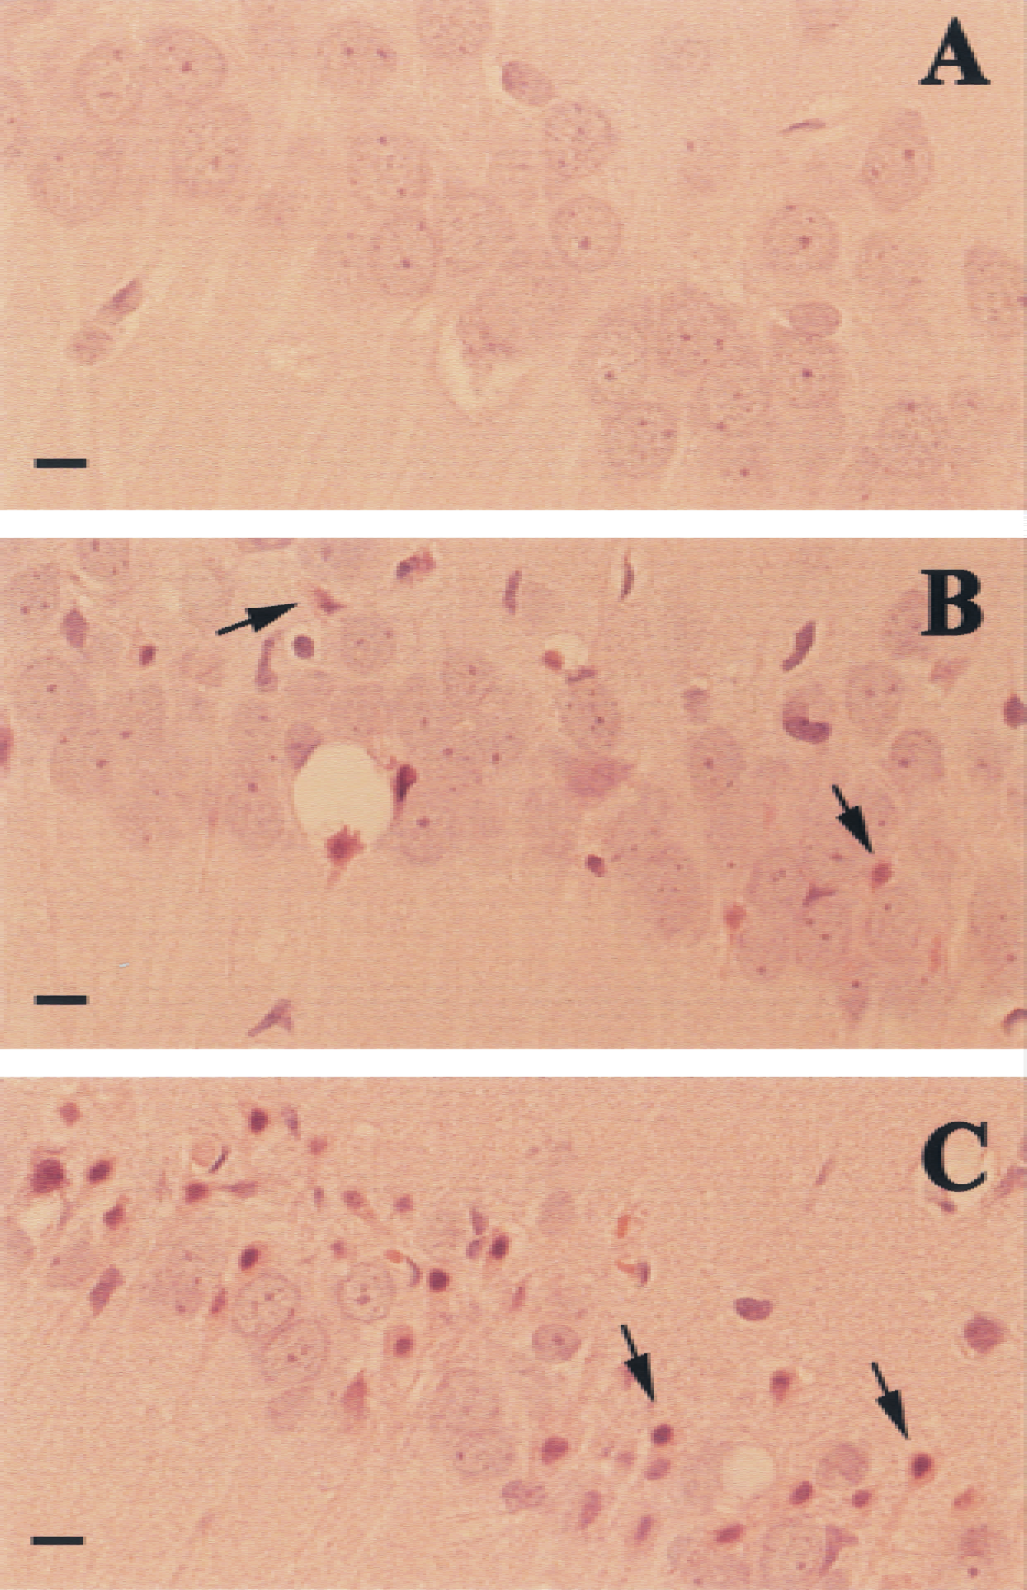
Sections of CA1 region of hippocampus from rats 5 days after nominal 1
DISCUSSION
Careful MRI studies of cardiac arrest and resuscitation have been performed previously. However, they either were limited to the investigation of cardiac arrest alone without resuscitation (van der Toorn et al., 1996; de Crespigny et al., 1999) or were performed separately for the cardiac arrest and resuscitation period (Schmitz et al., 1997, 1998). An earlier study in cats with in-magnet resuscitation (Schmitz et al., 1995) had long resuscitation duration (5 to 7 minutes) and large time deviation (2 minutes). By combining their remotely controlled resuscitation with the noninvasive MRI cerebral perfusion measurements, the authors were able to document for the first time the detailed changes in cerebral perfusion both during the critical phase of resuscitation and immediately after ROSC. The finding of regional time dependence of the development of hyper-and hypoperfusion after resuscitation is significant. Quantitatively, the brain-averaged perfusion (163 ± 27 mL 100 g−1 min−1) measured in this study before cardiac arrest is in excellent agreement with the literature values measured by other techniques, including tissue sampling with14 C-antipyrine,14 C-ethanol,3 H-water, and xenon (Eklof et al., 1974),133 Xe sampling of cerebral venous blood from the retroglenoid vein (Nilsson and Siesjo, 1976), and sagittal sinus2 H clearance (Singh et al., 1992). Notably, comparison of experimental CBF values should consider the use of different anesthetics. It is known that CBF is considerably greater under isoflurane general anesthesia than under, for example, fentanyl or pentobarbital anesthesia (Moore et al., 1994; Todd and Weeks, 1996); observation up to 300% difference in thalamus perfusion has been reported (Hendrich et al., 2001). The current measurements of regional perfusion before cardiac arrest also showed greater CBF in thalamus and hypothalamus under isoflurane anesthesia (Table 4). Nevertheless, it is still meaningful to compare regional perfusion and its time dependence under the same anesthesia within and between groups or before and after cardiac arrest and resuscitation. Such comparison is of clinical relevance because isoflurane is one of the most commonly used clinical anesthetics.
The postresuscitation cerebral hyperemia (Fig. 3) is region dependent and most profound in the thalamus and hypothalamus initially and in the cortex later. The degree of postresuscitation hyperemia seems to depend on the duration of the cardiac arrest time. The sham-arrested rats (Group 1) showed a transient hyperperfusion, probably because of the effects of epinephrine in the resuscitation cocktail, followed by a quick return to the prearrest level within 10 minutes. In contrast, in rats subjected to 4-minute asphyxia (4.3-minute circulatory arrest), hyperemia was more profound and lasted for 10 minutes, followed by an abrupt drop in cerebral perfusion (hypoperfusion) despite adequate MABP (Fig. 3). A further increase of asphyxia time to 12 minutes (13-minute circulatory arrest) resulted in the delay in the onset of hyperperfusion and hypoperfusion phases. The lesser degree of the initial hyperperfusion with longer arrest time is probably caused by hemodynamic factors such as blood vessels constriction, extravascular edema, increased blood viscosity, and disseminated intravascular coagulation (Fischer and Hossmann, 1995; Shaffner et al., 1998). The mild decrease in core temperature after 12 minutes of cardiac arrest also may contribute to the delayed onset of hyper-and hypoperfusion. The time dependence of the development of the hyper-and hypoperfusion on the ischemia duration also was noted in an earlier study with incomplete global ischemia (Todd et al., 1986).
The severity of protracted cerebral hypoperfusion after cardiac arrest and resuscitation is greater than previously appreciated. Although the MABP during the hypoperfusion period is not significantly different from the prearrest value, the cerebral perfusions in the cortex, thalamus, and hippocampus are only 6% to 20% of the prearrest level. To confirm that the severity of hypoperfusion was not exaggerated by tagging artifact, spin tagging efficiency (as measured by the degree of tagging inversion, α, in the carotid arteries at the level 0.8 cm from the imaging plane) was repeatedly measured at different times after ROSC. No significant difference was measurable between α values before cardiac arrest and during the hypoperfusion period, confirming that the adequate MABP during hypoperfusion maintained the same blood flow velocity in the carotid arteries. Spin relaxation during the transit time from the plane for α measurement to the imaging plane had minimal effect in the current experimental setting because of a short transit distance (0.8 cm) and a long T1 of blood water at 9.4 T.
The mechanism of protracted hypoperfusion under normal MABP is not fully understood. The current finding that more profound hyperemia leads to an earlier and more abrupt onset of hypoperfusion (comparing Groups 2 to Group 3) seems to suggest that the development of protracted hypoperfusion is associated with the initial hyperperfusion. An increased delivery of oxygen to the ischemic tissue during hyperperfusion may exacerbate the oxidative damage of the vessel lining (Siesjo et al., 1995; Gulyaeva et al., 1996; Katz et al., 1998), which may lead to the secondary increase in resistivity of the blood vessels and decrease in regional blood flow (Hall and Smith, 1991; Maruki et al., 1995; Soehle et al., 1998). Because of the long duration of the hypoperfusion, secondary ischemic and hypoxic neuronal damages are likely to occur. With the high spatial and temporal resolution as shown in this study for noninvasive measurements of cerebral perfusion, the current outcome model offers a unique way to evaluate therapies aimed at alleviating protracted hypoperfusion and the corresponding effects on long-term neurologic outcome.
The most profound manifestation of long-term neuronal injury in the current study is the ischemic damage of neurons in the selectively vulnerable CA1 region of the hippocampus. This type of well-confined histopathologic changes is typical of global ischemia and is usually explained by the combined effects of glutamate overexcitation and free radical toxicity (White et al., 1996). Although hyperemia during the early phase of reperfusion is region-specific and is most pronounced in the thalamic and cortical regions, the protracted hypoperfusion development is uniform throughout the brain. Therefore, the current data do not suggest a causal relation between the postresuscitative hemodynamics disturbances and the delayed selective neuronal death in the CA1 region. Moreover, the spatial resolution in the current MRI CBF measurements is not sufficient to distinguish perfusion changes at the microscopic level of the hippocampus. It is unclear why one rat in Group 2 showed asymmetrical histologic damage while exhibiting symmetrical reperfusion after ROSC. Given that the damage in the impaired hemisphere is mild (15% ischemic neurons in CA1), this single occurrence of histologic asymmetry should be considered as the result of biovariability and should be treated as an exception.
The authors did not observe significant changes in ADC at 40, 60, and 120 minutes after ROSC. The brain-averaged ADC values were not significantly different from the values before CA, despite the development of hypoperfusion during this period. This finding agrees with an early report (Fischer et al., 1995) showing full recovery of ADC 30 minutes after resuscitation from 15 minutes of CA in cats. In the current experiments, the time resolution of ADC mapping was longer than the CA event itself and the rapid varying hemodynamics during the hyperemia period. Therefore, no measurements of ADC maps during CA and in the initial phase of reperfusion were attempted.
The animal model used in this study is modified slightly from a previous one (Liachenko et al., 1998) in that a quick onset of circulatory arrest is assisted by esmolol, a cardioselective, ultra-short-acting, β-adrenergic blockage agent. This modification offers distinct advantages for experimental control of the no-flow time. The optimal esmolol dose used in this study was determined in pilot experiments with varying bolus doses ranging from 1.5 to 7.0 mg (100 g)−1. Lower doses of esmolol led to the development of spontaneous cardiac activity in the middle of the arrest, whereas greater doses increased the resuscitation time unnecessarily. Calculated peak blood concentration of esmolol in this study was approximately 1.7 mmol L−1, which is in excellent agreement with the concentration required for reversible cardioplegic arrest in cardiopulmonary bypass and coronary artery surgeries (Ede et al., 1997; Warters et al., 1998; Mehlhorn et al., 1999). Although other β-blockers have been shown to have certain adverse central nervous system effects (Gleiter and Deckert, 1996), esmolol seems to be devoid of these effects because of its restricted access to the brain (Sum et al., 1983) and its high degradation rate in the blood. The current sham-arrested group also confirmed that the experimental procedure as such, including the use of esmolol, did not cause neuronal damage. Retrograde intraarterial infusion of the donor blood itself had minimal effects on long-term neurologic outcome. In the experiments with sham-arrested rats (Group 1), the no-flow time (<1.0 minutes) was significantly shorter than the 5-minute threshold for the brain to tolerate global ischemia (Gisvold et al., 1996; Safar and Paradis, 1996). Therefore, the sham arrest did not cause significant abnormality in CBF after resuscitation, except for the transient CBF overshoot immediately after ROSC, which can be accounted for by the increase in blood volume caused by blood infusion and the use of epinephrine. Long-term NDS and HDS were normal in the sham rats. However, the authors did notice some potential complication when epinephrine (or possibly sodium bicarbonate) is used immediately after esmolol. Three sham-operated rats (excluded from the current study) showed signs of pulmonary edema shortly after ROSC. Hence, further improvement of resuscitation cocktail, such as adding mannitol or dextran to prevent pulmonary edema, seems warranted.
In conclusion, the authors have demonstrated the use of their outcome model of remotely controlled circulatory arrest for the evaluation of cerebral perfusion with high temporal and spatial resolution during the critical phases of reperfusion. The authors have measured the development and succession of transient regional hyperemia and protracted hypoperfusion after resuscitation in the same rat by a continuous and noninvasive method. The combined use of their highly reproducible circulatory arrest and resuscitation model and the quantitative perfusion/diffusion MR imaging will permit future studies to relate the molecular and cellular events of neuronal injury to functional brain damage, and to indicate the most effective, multifaceted, therapeutic mechanisms and regimens for the improvement of long-term outcome.
Footnotes
Acknowledgments:
The authors thank Martha Zegarra for technical assistance and Kristy S. Hendrich for helpful discussion.