
Abstract
The deoxyglucose method for calculation of regional cerebral glucose metabolism by PET using 18F-2-fluoro-2-deoxy-d-glucose (FDG) requires knowledge of the lumped constant, which corrects for differences in the blood–brain barrier (BBB) transport and phosphorylation of FDG and glucose. The BBB transport rates of FDG and glucose have not previously been determined in humans. In the present study these transport rates were measured with the intravenous double-indicator method in 24 healthy subjects during normoglycemia (5.2 ± 0.7 mM). Nine subjects were restudied during moderate hypoglycemia (3.4 ± 0.4 mM) and five subjects were studied once during hyperglycemia (15.0 ± 0.7 mM). The global ratio between the unidirectional clearances of FDG and glucose (K1*/K1) was similar in normoglycemia (1.48 ± 0.22), moderate hypoglycemia (1.41 ± 0.23), and hyperglycemia (1.44 ± 0.20). This ratio is comparable to what has been obtained in rats. We argue that the global ratio is constant throughout the brain and may be applied for the regional determination of LC. We also determined the transport parameters of the two hexoses from brain back to blood and, assuming symmetrical transport across the BBB, we found evidence of a larger initial distribution volume of FDG in brain (0.329 ± 0.236) as compared with that of glucose (0.162 ± 0.098, p < 0.005). The difference can be explained by the very short experimental time, in which FDG may distribute both intra- and extracellularly, whereas glucose remains in a volume comparable to the interstitial fluid of the brain.
Keywords
The deoxyglucose method for estimation of regional glucose metabolism in animal experiments was introduced by Sokoloff in 1977 (Sokoloff et al., 1977). The method was extended for use in humans by positron emission tomography (PET) with 18F-2-fluoro-2-deoxy-D-glucose (FDG) as tracer (Phelps et al., 1979; Reivich et al., 1979). This method determines the net clearance of FDG from blood to brain (K*) and the net clearance of glucose (K) is then calculated by dividing K* by a correction factor, the lumped constant. The lumped constant consists of two correction terms: a correction for the differences in the steady-state distribution volumes of FDG and glucose, and a correction for the differences in affinity to the hexokinase enzyme, which is the first step in glycolysis. The steady-state distribution volumes are determined by the differences in both blood–brain barrier (BBB) transport rates and phosphorylation of the two hexoses. Determination of the differences in FDG and glucose BBB transport thus provides further insight into the determination of the lumped constant. Glucose BBB transfer follows Michaelis–Menten kinetics for facilitated transport (Crone, 1965) and 2-deoxy-D-glucose (deoxyglucose) is transported across the BBB by the same carrier (Oldendorf, 1971). The kinetic parameters for BBB transport have been obtained from experimental models for glucose and deoxyglucose (Cunningham and Cremer, 1981; Gjedde, 1982; Crane et al., 1983; Spence et al., 1990), and simultaneous measurements of BBB transport of glucose and FDG have also been performed in rats (Crane et al., 1983; Fuglsang et al., 1986). These results suggest that the unidirectional BBB transfer from blood to brain for FDG is higher than for deoxyglucose, and that both glucose analogs are transported at a higher rate than glucose itself. However, the relative transport ratios vary from study to study, and a recent study found no difference between the FDG and glucose BBB transfer (Lear and Ackerman, 1992). It is also unclear to what extent the experimental data can be used in humans because the lack of a suitable method has prevented direct comparisons of different hexoses' transport across the BBB in humans. With the introduction of the intravenous double-indicator method (Knudsen et al., 1994), it is now possible to perform such studies in humans. The main purpose of the present study was to evaluate the relationship between the unidirectional clearance from blood to brain of FDG (K1*) and glucose (K1) in humans using the intravenous double-indicator method. To establish whether the ratio K1*/K1 depends on plasma glucose concentration, measurements were performed during normo-, hyper-, and hypoglycemia. We also measured the permeability-surface area (PS) ratios for the two hexoses across the BBB, because we wanted to test the general assumption of symmetrical BBB hexose transport, that is, the PS ratio for transport from blood into the brain (PS1*/PS1) should equal the PS ratio from the brain back to the blood (PS2*/PS2).
METHODS
Twenty-nine healthy volunteers (13 women and 16 men) of normal weight were studied. Mean age was 23 ± 4 years (range 20–34 years). Twenty-four subjects were studied under identical normoglycemic conditions. Nine of these subjects were restudied after moderate hypoglycemia induced by starvation. Five subjects were studied once during acute hyperglycemia. All subjects also had dynamic PET scans performed, and this part of the studies will be or has been published separately (Hasselbalch et al., 1994). Informed consent was obtained after written information, and the study was conducted according to the Helsinki Declaration II. The study was approved by a Danish ethical committee.
A small polyethylene catheter was inserted into the radial artery and into two antecubital veins during local analgesia. Using the Seldinger technique, a catheter was placed in the internal jugular vein percutaneously low on the neck as previously described (Hasselbalch et al., 1994). Hypoglycemia was induced by 3.5 days of total starvation. Each subject was allowed to drink only water, coffee, or tea, and was given 750 mg of potassium and a vitamin tablet each day. In the subjects studied during hyperglycemia, a hyperglycemic, normoinsulinemic clamp was induced by a constant infusion of somatostatin (0.6 mg kg−1 h−1) and insulin (0.15 mIU kg−1 min−1) and a variable glucose infusion of 20%. A plasma glucose level of 15 mM was reached within 1–1.5 h and plasma glucose was clamped at this level. BBB permeability studies were performed ∼15 min later. In all subjects, BBB permeability studies of 1 min duration were performed twice with ∼20-min interval and results were averaged. During the second BBB study, background activity was monitored and subtracted.
CBF measurement
In the 24 subjects studied twice, CBF was determined by an intravenous bolus injection of 500–600 MBq 133Xe followed by recording of the clearance curves by 10 stationary detectors (Cerebrograph 10A, NOVO, Hadsund, Denmark). CBF was determined by the Initial Slope Index method (Obrist et al., 1975; Risberg et al., 1975). In the five hyperglycemic subjects, CBF was measured by the Kety-Schmidt technique at desaturation after 30 min of saturation by a constant infusion of 500–600 MBq 133Xe as described by Madsen et al. (1993).
Assuming a constant rate of cerebral oxygen use during the study, arteriovenous differences for oxygen were measured before the CBF and BBB permeability studies. CBF at the time of the BBB experiment, CBFBBB, was calculated according to: CBFBBB = CBFref * (ΔO2(ref)/ΔO2(BBB)), with CBFref the measured value of CBF, ΔO2(ref) the arteriovenous oxygen difference at time of CBF measurement, and ΔO2(BBB) the arteriovenous oxygen difference at the time of the BBB study.
BBB permeability measurements
The double-indicator method adapted for studies in humans (Lassen et al., 1971) requires injection of a test and a BBB-impermeable tracer substance into the carotid artery. After a single passage through the brain vasculature, the activity of both tracers is measured in the jugular vein, and the extraction fraction of the test substance, which passes the BBB, is calculated as the relative difference between the time–activity curves of the test and reference substance. Introducing a three-compartment model has allowed for determination of transfer constants in the brain with correction for tracer backflux and capillary heterogeneity (Knudsen et al., 1990). We used a recently developed modification of the method (Knudsen et al., 1994) in which the test and reference substances are injected into a peripheral vein instead of into the carotid artery.
To correct for differences in the brain input of test and reference substances, a five-parameter Dirac impulse response for passage through the cerebrovascular bed is computed from the input and output curves of the reference substance (Knudsen et al., 1994). This response is then combined with a capillary model of the brain, the single membrane (well-mixed) model (Knudsen et al., 1990) and convolved with the arterial input curve of the test substance to yield a theoretical test output curve that is iteratively compared with the actual test output curve. When the CBF is known, the values of the model variables and the standard errors of the estimates giving the best fit to the test curve can be obtained by minimizing the sum of squares of the differences between the theoretical and the measured outflow test curve by means of the simplex method. The unidirectional clearance (K1) was calculated from the average unidirectional extraction fraction E of the test substance, and the CBF according to the formula: K1 = E × CBF. Transport from brain back to blood was estimated by the parameter PS2/Ve, which is directly estimated in the double-indicator experiment, where PS2 is the permeability-surface area for transport from brain back to blood and Ve is the initial distribution volume of the tracer in brain.
A 5–10-ml bolus, containing two test compounds and several BBB-impermeable reference compounds, was injected intravenously through the antecubital catheter, and immediately afterwards the catheter was flushed with ∼10 ml of saline. Starting 2–3 s before injection, continuous samples of 1 ml of blood were collected for 50 s from the radial artery and jugular vein by means of a sampling machine (Ole Dich Instrumentmakers, Hvidovre, Denmark) at a fixed interval of 1.3 s.
Isotopes
The bolus for the double-indicator measurements contained the following reference substances: 7 MBq 24Na+, 40 MBq 99mTc-diethylenetriamine pentaacetic acid (99mTc-DTPA), 0.4 MBq 36Cl−, and two test substances: 7 MBq 3H-glucose, and FDG labeled either with 1.8 MBq 14C or 180–190 MBq 18F. 18F-FDG was obtained from Forschungszentrum Jülich, Germany, with a specific activity of 20 GBq/mg FDG and a radiochemical purity of >96%. 24Na+ was obtained from Risø, Denmark, 99mTc-DTPA, 14C-FDG, 36Cl− from Amersham (Amersham Corp., Arlington Heights, IL, U.S.A.), and 3H-glucose from Dupont (Stevenage, U.K.).
Blood samples were centrifuged immediately at 4°C and 300-μl plasma samples were pipetted and counted in a gamma counter (COBRA 5003, Packard Instrument, Downers Grove, IL, U.S.A.) with subsequent corrections for background, spillover, and decay. After at least 3 weeks, 3 ml of scintillation fluid (Picofluor 40, Packard) were added and β emission was counted (Packard PA 800-CA, Packard) with corrections for quenching and spillover by the method of external standardization.
STATISTICS
Mean group values were compared with Mann–Whitney U test. Intraindividual differences between two conditions were examined with the Wilcoxon matched-pairs test. A p value of <0.05 was considered statistically significant.
RESULTS
Patient data and plasma glucose are given in Table 1. BBB permeability parameters for FDG and glucose are shown in Table 2. K1 was 0.098 ± 0.021 ml g−1 min−1 (mean ± SD) in normoglycemia. During hypoglycemia, K1 increased to 0.135 ± 0.022 ml g−1 min−1 (p < 0.001) and decreased to 0.047 ± 0.008 during hyperglycemia. The same pattern was seen for FDG, where K1* was 0.141 ± 0.028 in normoglycemia, increased during hypoglycemia to 0.188 ± 0.033 ml g−1 min−1 (p < 0.01) and decreased during hyperglycemia to 0.067 ± 0.005 ml g−1 min−1. An example of an input-corrected intravenous double-indicator time-activity curve is shown in Fig. 1, to demonstrate the higher brain extraction of FDG as compared with glucose.
Patient data and plasma glucose levels
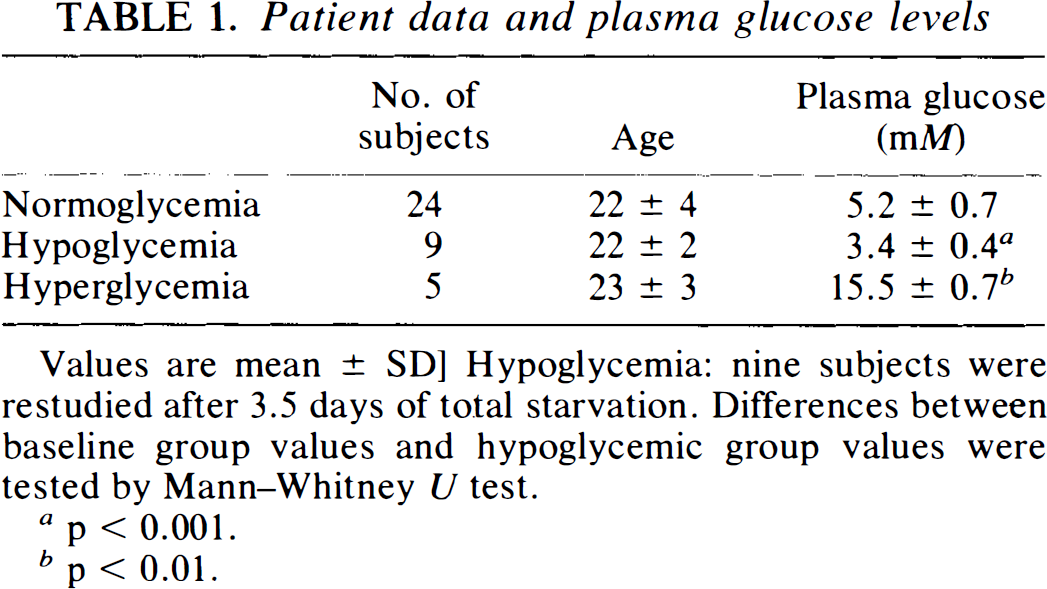
Values are mean ± SD] Hypoglycemia: nine subjects were restudied after 3.5 days of total starvation. Differences between baseline group values and hypoglycemic group values were tested by Mann–Whitney U test.
p < 0.001.
p < 0.01.
Parameters of blood–brain barrier transport of glucose and 18F-2-fluoro-2-deoxy-D-glucose (FDG) measured by the double-indicator method
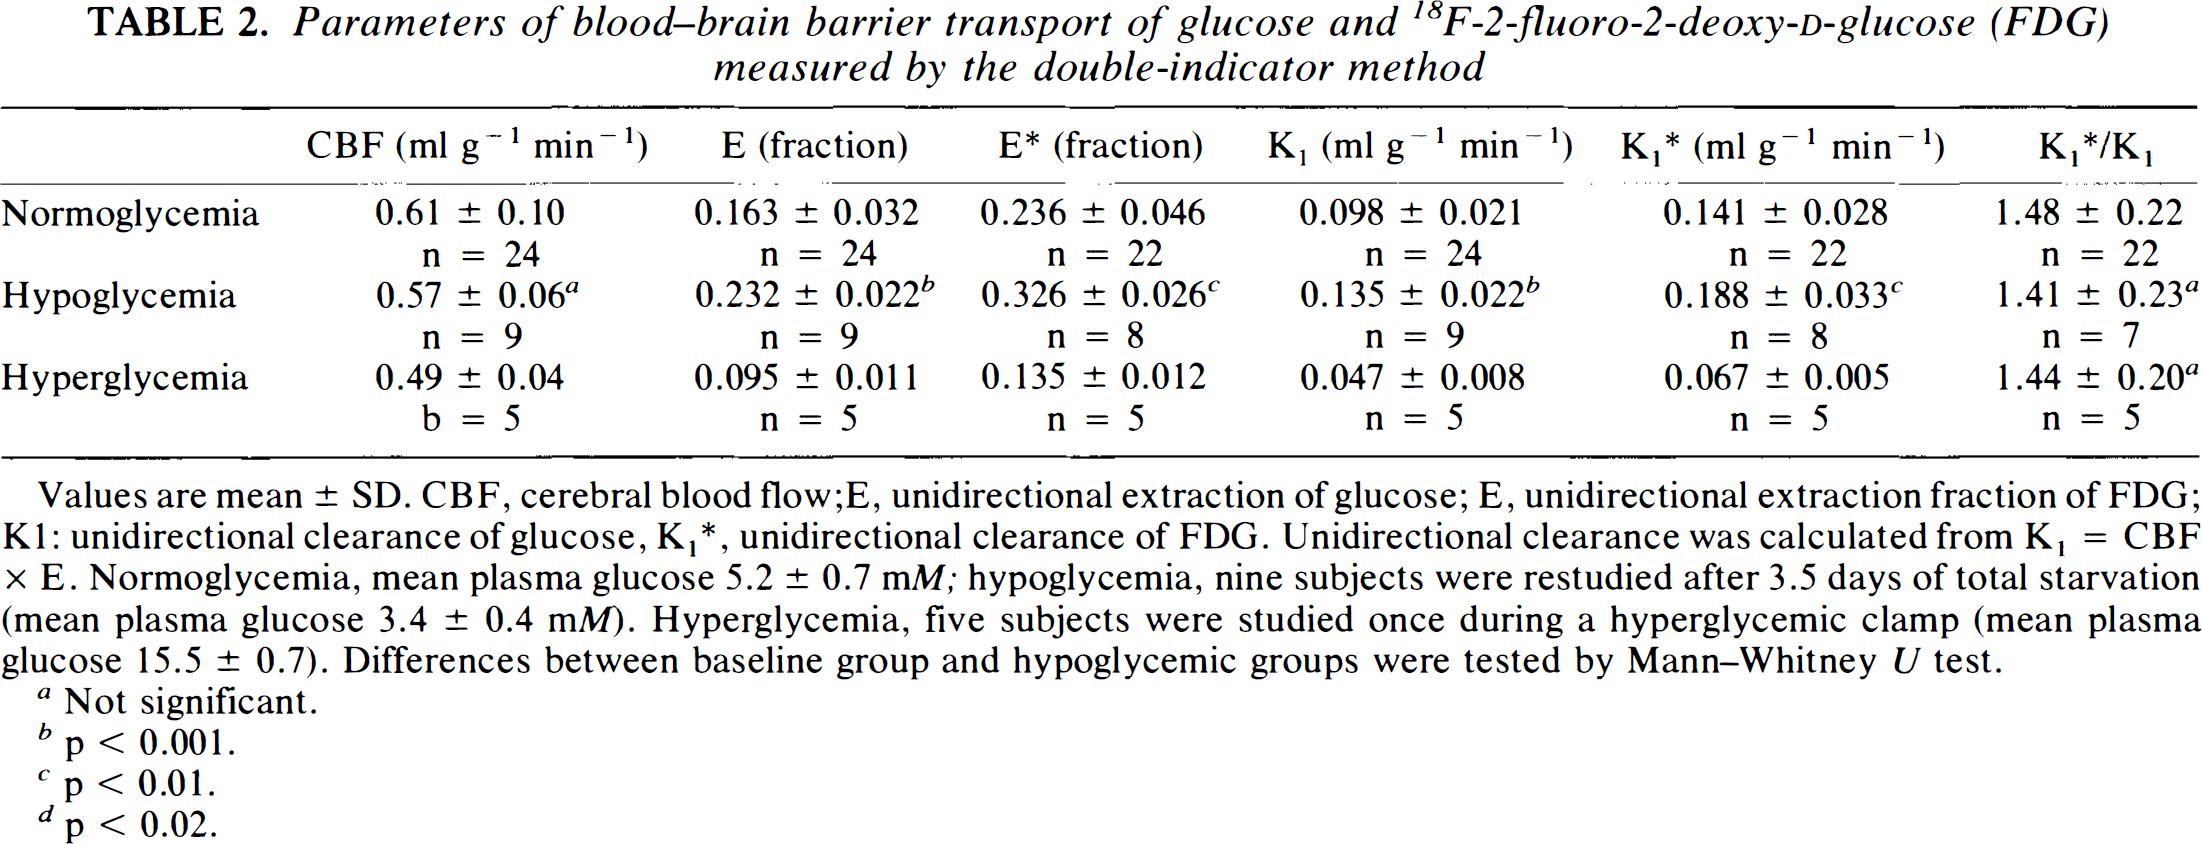
Values are mean ± SD. CBF, cerebral blood flow;E, unidirectional extraction of glucose; E, unidirectional extraction fraction of FDG; Kl: unidirectional clearance of glucose, K1*, unidirectional clearance of FDG. Unidirectional clearance was calculated from K1 = CBF × E. Normoglycemia, mean plasma glucose 5.2 ± 0.7 mM; hypoglycemia, nine subjects were restudied after 3.5 days of total starvation (mean plasma glucose 3.4 ± 0.4 mM). Hyperglycemia, five subjects were studied once during a hyperglycemic clamp (mean plasma glucose 15.5 ± 0.7). Differences between baseline group and hypoglycemic groups were tested by Mann–Whitney U test.
Not significant.
p < 0.001.
p < 0.01.
p < 0.02.
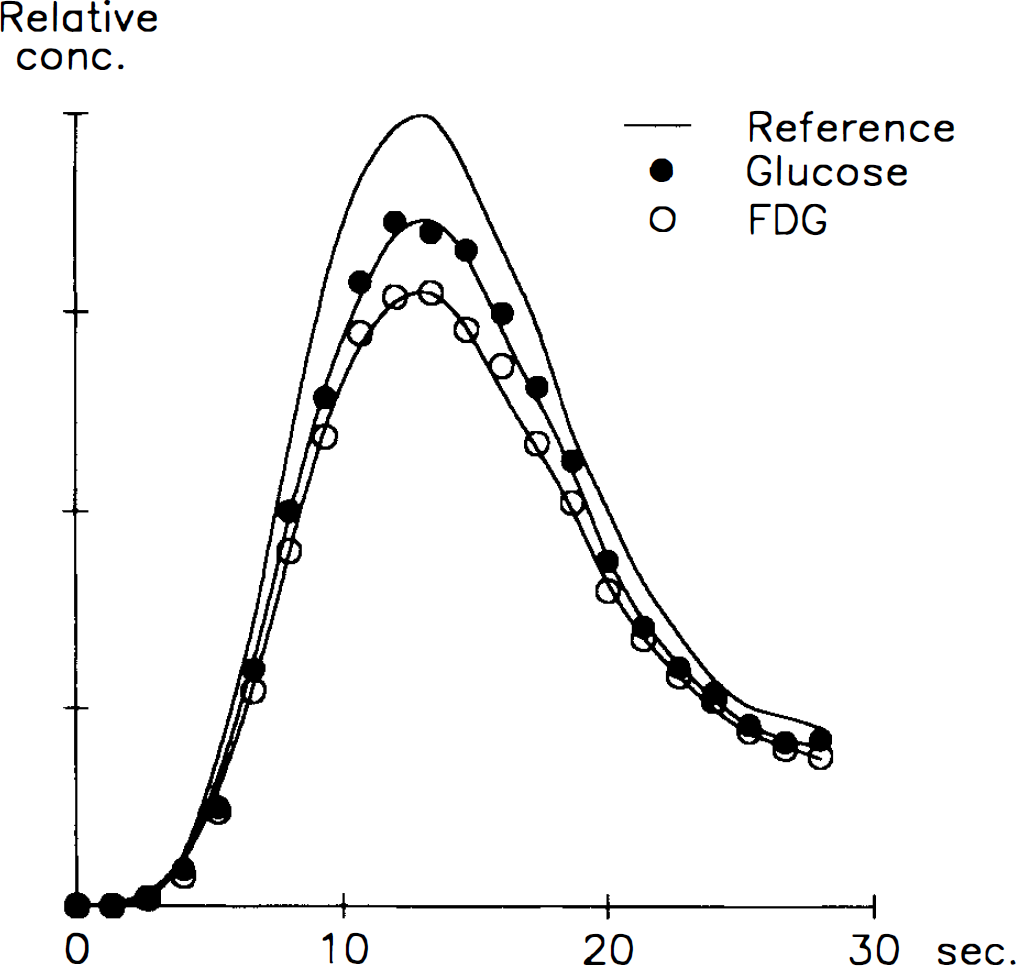
Venous outflow curves for glucose and 18F-2-fluoro-2-deoxy-d-glucose (FDG) (test curves) relative to the calculated reference curve after an intravenous bolus injection of the tracers. The “reference” curve is the convolution of the test substance arterial curve and the Dirac impulse response (Knudsen et al., 1994). Note the higher extraction of FDG, shown by the larger difference between the reference curve and the FDG curve as compared with the difference between the reference curve and the glucose curve.
In two normoglycemic subjects, BBB permeability for FDG could not be evaluated. In the remaining 22 subjects, the mean of the individually determined K1*/K1 ratios was 1.48 ± 0.22. This ratio did not change significantly with plasma glucose concentration (1.41 ± 0.23 in hypoglycemia and 1.44 ± 0.20 during hyperglycemia).
In Table 3, PS products across the BBB are shown. PS, values for glucose and FDG were similar to the K, values (Table 2) as expected when extraction is low. The PS2/Ve parameter was non-significantly lower for FDG, but the ratio between the transport in and out of the brain [(PS2/Ve)/PS1] was significantly lower for FDG (4.57 ± 2.86 compared with 8.52 ± 4.70 for glucose, p < 0.005). Assuming symmetrical transport across the BBB (PS1 = PS2), the initial distribution volume (Ve) can be estimated, and Ve for FDG was found to be twice that for glucose (0.329 ± 0.236 and 0.162 ± 0.098, respectively, p > 0.005).
Comparison of glucose and 18F-2-fluoro-2-deoxy-D-glucose (FDG) PS products of the two sides of the blood–brain barrier
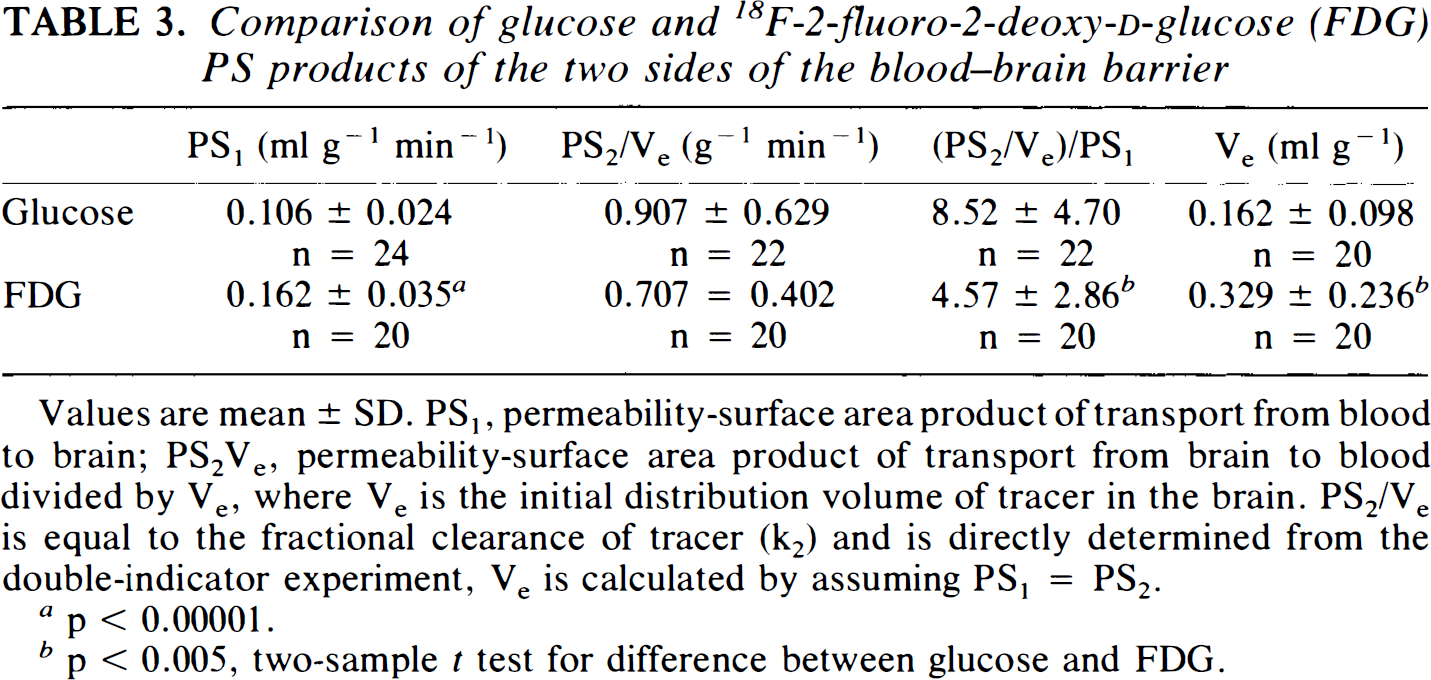
Values are mean ± SD. PS1, permeability-surface area product of transport from blood to brain; PS2Ve, permeability-surface area product of transport from brain to blood divided by Ve, where Ve is the initial distribution volume of tracer in the brain. PS2/Ve is equal to the fractional clearance of tracer (k2) and is directly determined from the double-indicator experiment, Ve is calculated by assuming PS1 = PS2.
p < 0.00001.
p < 0.005, two-sample t test for difference between glucose and FDG.
DISCUSSION
Absolute values of unidirectional clearances of FDG and glucose
Direct measurements of simultaneous FDG and glucose transport across the BBB in humans have not been obtained previously. In the present study, the absolute value for the unidirectional glucose extraction fraction (E) across the BBB was 16.3% in normoglycemia (Table 2), which is similar to values obtained both with the intracarotid double-indicator method (Knudsen et al., 1990) and with 11C-glucose PET studies as tracer in humans (Blomqvist et al., 1990). We determined the unidirectional clearances of glucose (K1) and FDG (K1*) from E × CBF and E* × CBF. Our global mean K1 of 0.098 was higher than the values between 0.061 and 0.083 reported by Blomqvist et al. (Blomqvist et al., 1990, 1991) and our global mean K1* is also higher than values obtained in different PET centers from dynamic PET-FDG studies (Evans et al., 1986). These differences are probably due to methodological differences, especially the CBF measurements in the present study, which overestimate true global blood flow (Olesen et al., 1971). Even when K1* values measured with the double-indicator method and dynamic PET are obtained in the same subjects with comparable methods, values obtained with the double-indicator method are higher (Knudsen et al., 1995). The discrepancy could be explained by difference in the time of the experiment; BBB transport parameters are estimated within 50 s with the double-indicator method, whereas dynamic PET BBB parameters are estimated from the first several minutes of the time–activity curves. Numerous technical factors, such as scan schedule and blood sampling, may affect the PET parameters, but also model limitations, especially the assumption of tissue homogeneity, may lead to underestimation of “true” BBB parameter estimation with dynamic PET (Schmidt et al., 1992).
K1*/K1
As already stated, absolute values for K1* and K1 should be considered with caution, because values depend on the method employed. However, the relative ratio between K1* and K1, which is the scope of this study, is not affected by factors that affect the hexoses identically. For instance, the use of different CBF methods does not affect the K1*/K1 ratio because CBF is cancelled out in the ratio. Similarly, other methodological errors would afflict the two hexoses identically. The tracers are injected in the same bolus and their activity is counted in the same blood samples, which minimizes any errors in timing and sample volume between the two tracers, the ratio therefore being well determined with a coefficient of variation ranging from 14 to 16%.
The ratio between the unidirectional clearances of FDG and glucose (K1*/K1) was 1.48 in normoglycemia. With the use of the brain uptake index method (Oldendorf, 1971), Crane et al. (1983) measured the BBB parameters for FDG and glucose in normoglycemic rats. The K1*/K1 ratio was 1.67, primarily because FDG had a higher affinity for the glucose carrier than glucose itself [Kt (half-saturation constant) for FDG was 6.9 versus 11.0 mM for glucose, whereas Tmax (maximal transport rate) was not significantly different (1.70 versus 1.42 μmol g−1 min−1)]. Fuglsang et al. (1986) reported a similar K1*/K1 ratio of 1.65 in normoglycemic rats using a rapid time-integral method. The value of 1.48 reported in the present study is comparable to the values obtained in rats, indicating no species difference with regard to this ratio.
The absolute values for K1* and Kt changed with changes in glucose concentration, reflecting that the transport of hexoses follows Michaelis–Menten kinetics for facilitated diffusion. Statistical evaluation of these changes were only partly possible due to differences in the methodological setup between groups, but as stressed already, the K1*/K1 ratios determined at different glucose levels were comparable, and because the relative changes in K1* and K, were of the same magnitude, the K1*/K1 ratio remained constant in the hypo-, normo-, and hyperglycemic conditions (plasma glucose 3.5, 5.4, and 15.5 mM, respectively). Theoretically, a constant ratio is expected from the Michaelis–Menten parameters describing K1* and K1, from which it can be seen that plasma glucose concentration cancels out in the ratio (K1*/K1 = {Tmax*/(Kt*[1 + (Cp/Kt)]}/[Tmax/(Kt + Cp)]), where Cp is plasma glucose concentration). Experimental verification of this linear correlation between the BBB transport of the two hexoses is illustrated in Fig. 2. It is concluded that the K1*/K1 ratio remains constant within moderate plasma glucose changes. This is crucial for the PET-FDG model, because the tracer must behave in a fixed relation to the native glucose molecule also in case of physiological and pathophysiological changes.
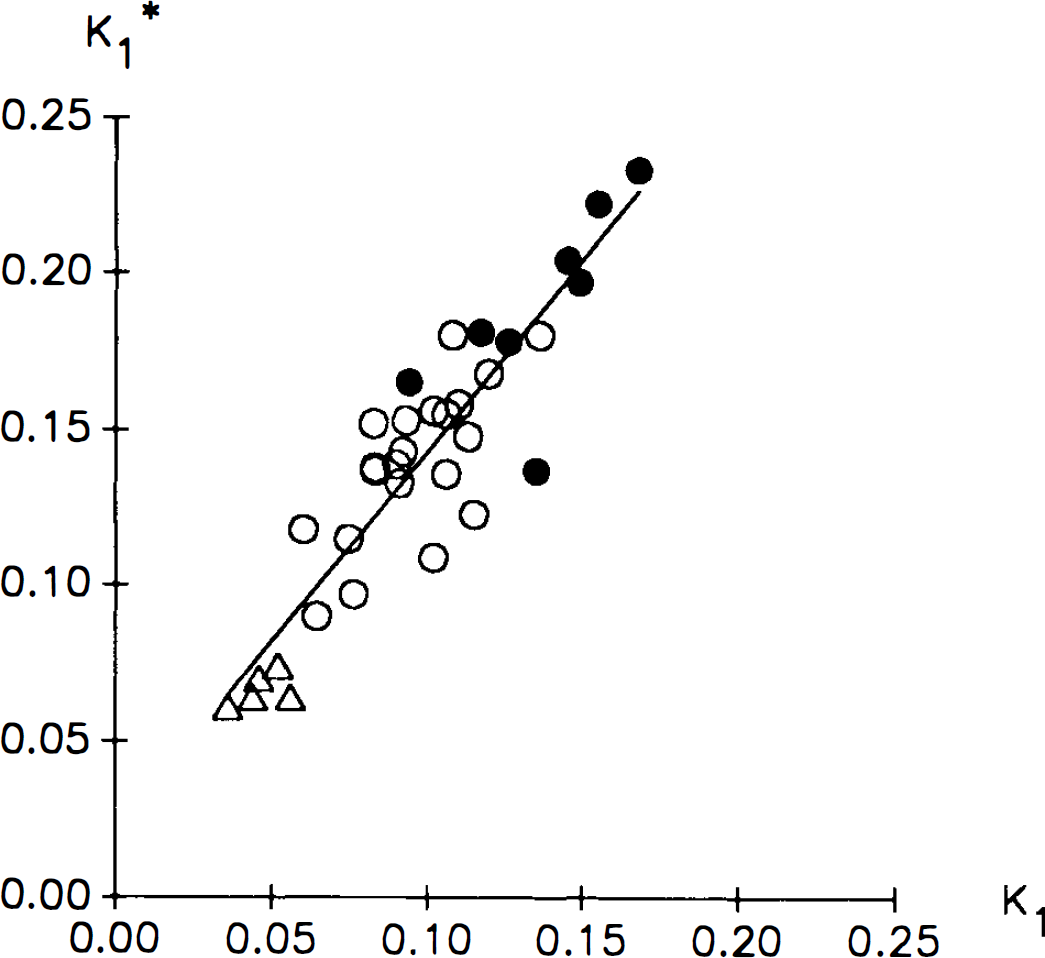
Correlation between unidirectional clearances for 18F-2-fluoro-2-deoxy-d-glucose (FDG) (K1*) and glucose (K1). Values are ml g−1 min−1. Each point represents values obtained in a single subject as the mean value of two double-indicator experiments, open circles are subjects studied during normoglycemia, filled circles are subjects studied during hypoglycemia, and triangles are subjects studied during hyperglycemia. The straight line is a linear regression line.
The question to be addressed is whether the ratio of 1.48, as determined globally in this study, can be applied regionally. The ratio of deoxyglucose and glucose influx has been found to be similar in cortical and central gray matter in the rat brain, as measured by the brain uptake index method (Pardridge et al., 1982). With the use of high-resolution autoradiograms, Lear and Ackerman (1992) recently found that, apart from some neuronal layers in the hippocampus, the K1*/K1 ratio was constant throughout the normal rat brain. These experimental studies are in accordance with previous PET studies in humans, in which the ratio between the distribution volumes of methylglucose and FDG showed almost no regional variation (Gjedde et al., 1985). Thus it can be assumed that under normal physiological conditions, the K1*/K1 ratio remains constant regionally, and that the global ratio obtained in the present study equals the ratio in any single tissue in the normal brain.
Initial distribution volumes for FDG and glucose
PS products for transport across the BBB were also measured in the present study, and values for transport from blood to brain interstitial fluid (PS1) as well as values from brain interstitial fluid back to blood (PS2/Ve) are shown in Table 3. The ratio between these transport parameters [(PS2/Ve)/PS1] is different for glucose and FDG because PS2/Ve is higher for glucose than for FDG. The model yields a PS2/Ve ratio, and provided that BBB glucose transport is symmetrical, the difference in the PS2/Ve ratios for FDG and glucose must be explained by differences in the initial distribution volumes of the two hexoses. With the very short experimental time of the double-indicator method, glucose distributes in a volume that equals the interstitial volume in the brain (Knudsen et al., 1990), but FDG seems to distribute in a larger volume including both extra-and intracellular volumes, which may be caused by a faster FDG transport into neurons and glia cells. The present study has demonstrated that the BBB transporter has a 50% faster transport rate for FDG than for glucose, and if the same was true for the glia and neuronal glucose transporters, FDG would indeed distribute in a larger brain volume than glucose does. Although the neuronal glucose transporter differs from the BBB transporter (GLUT3 and GLUTI subtypes, respectively), in vitro studies of cell cultures have revealed that deoxyglucose has a higher affinity than glucose to the GLUT3 transporter (Asano et al., 1992), with a half-saturation constant (Kt) of 0.8–0.9 mM compared with 3.4–3.6 mM for 3-O-methylglucose. Thus, the same relationship may exist in vivo for GLUT3 in humans, and in Table 3 we have illustrated the possible difference in initial distribution volumes for the two tracers (Ve and Ve*). It can be seen that glucose distributes in a volume of 0.16, which is comparable to the brain interstitial volume (Fenstermacher and Patlak, 1975), whereas FDG distributes in a much larger volume of 0.33. However, this volume is still smaller than the brain's aqueous phase of ∼0.80, which is the final distribution volume of glucose and FDG. It is therefore possible that FDG, during an experimental time of 40–50 s, is taken up by a fraction of the cells of the brain, whereas the entry of glucose into these cells is slower. With the use of the well-mixed model transfer of tracer from interstitial fluid into intracellular space is determined as a separate parameter, k3 (Knudsen et al., 1990). In the present study, however, a great variation in this parameter did not allow any statistical evaluation of this parameter, and the aforementioned hypothesis thus could not be experimentally confirmed. However, the difference in distribution volumes of the two hexoses, which, from a physiological point of view, is plausible, can explain all of the difference in the PS2/Ve parameters, and the data in the present study do not contradict the assumption of symmetrical BBB transport. Moreover, it is generally assumed that transport of glucose (and FDG) is symmetrical (Pardridge and Oldendorf, 1975; Gjedde and Christensen, 1984), and no studies have so far rejected this assumption.
Determination of the lumped constant
To what extent the information obtained in the present study on the BBB transport of FDG and glucose can be applied in the regional determination of the lumped constant remains to be determined. The original model proposed by Sokoloff et al. (1977) requires that the lumped constant is either measured or is estimated from knowledge of the differences in BBB transport rates and phosphorylation of deoxyglucose (or FDG) and glucose. By assuming a constant and symmetrical transport of tracer and glucose across the BBB, the steady-state distribution volumes are determined by the ratios K1*/K1 and k3*/k3 (the ratio of the phosphorylation rates of the two hexoses). Consequently, if these two ratios are known, the lumped constant can be calculated from kinetic parameters determined in a dynamic PET-FDG study [lumped constant = k3*/k3 + (K1*/K1 – k3*/k3) × (k3*/(k2* + k3*), Kuwabara et al., 1990; Holden et al., 1991]. This approach is tempting, because it allows for a pixel-by-pixel calculation of the lumped constant. However, even if the K1*/K1 obtained in the present study represent “true” BBB transport and potentially could be implemented in the determination of the lumped constant as argued herein, the k3*/k3 value has not been determined in humans. Moreover, most methodological problems that afflict the dynamic PET model will also affect the calculation of the lumped constant. Further studies are needed to evaluate to what extent regional calculation of the lumped constant with inclusion of the present ratio will yield reliable values for regional or global glucose metabolism.
In conclusion, under normal physiological conditions in humans, 1.48 is a reliable estimate for the ratio between FDG and glucose unidirectional brain clearances. The ratio is constant with changes in plasma glucose from 3.5 to 15 mM. Estimation of PS products across the BBB revealed a lower PS2/Ve ratio for FDG as compared with glucose, but the difference may be explained by differences in the initial distribution volume for the two tracers. It is argued that the global ratio can be applied regionally, and this stability of the ratio allows the potential for a direct determination of the lumped constant from dynamic PET kinetic parameters. However, this kinetic approach for determination of the lumped constant should be further validated, and especially the phosphorylation coefficient should be determined in human brain tissue.
Footnotes
Acknowledgment:
This work was carried out at the PET Laboratory of the Neurobiology Research Group, Rigshospitalet. The technical staff at the laboratory, especially Karin Stahr and Gerda Thomsen, is thanked for valuable assistance. The study was supported by the Foundation of 17-12-81, the Danish Diabetes Foundation, the S. F. Hartmann Foundation, the Lundbeck Foundation, and the Danish Health Research Council.