
Abstract
Adenosine transport into brain is regulated by the activity of the adenosine transporter located at the brain capillary endothelial wall, which forms the blood–brain barrier (BBB) in vivo. To facilitate cloning of BBB adenosine transporters, poly A+ RNA was purified from isolated rat brain capillaries for production of a rat BBB cDNA library in the pSPORT vector. The cloned RNA (cRNA) generated from in vitro transcription of this library was injected into frog oocytes followed by measurement of [3H]-adenosine uptake. After dilutional cloning, a full-length, 2905-nucleotide adenosine transporter cDNA, designated clone A-11, was isolated. The A-11 clone yielded [3H]-adenosine flux ratios of 400 to 500 after injection of cRNA in oocytes. The adenosine uptake was sodium-dependent and insensitive to inhibition by S-(4-nitrobenzyl)-6-thioinosine (NBTI). The Km and Vmax of adenosine transport in the cRNA-injected oocytes were 23.1 ± 3.7 μmol/L and 10.8 ± 0.9 pmol/oocyte · min. The K0.5 for sodium was 2.4 ± 0.1 mmol/L, with a Hill coefficient (n) of 1.06 ± 0.07. DNA sequence analysis indicated the rat BBB A-11 adenosine cDNA was identical to rat concentrative nucleoside transporter type 2 (CNT2). The adenosine transporter activity of the rat BBB A-11 CNT2 clone is 50-fold more active than previously reported rat CNT2 clones. In summary, these studies describe the expression cloning of CNT2 from a rat BBB library and show that the pattern of sodium dependency and NBTI insensitivity of the cloned CNT2 are identical to patterns of adenosine transport across the BBB in vivo. These results suggest that BBB adenosine transport in vivo is mediated by CNT2, which would make CNT2 one of the few known sodium-dependent cotransporters that mediate substrate transport across the BBB in the blood to brain direction.
Adenosine is a neurotransmitter (Haas and Selbach, 2000), and adenosine-derived drugs are potential neuropharmaceuticals, should these molecules be made transportable across the brain capillary endothelial wall, which forms the blood–brain barrier (BBB) in vivo. Purine nucleosides such as adenosine or guanosine are transported from blood to brain through carrier-mediated transport across the BBB, and the BBB adenosine transporter is a potential portal of entry into brain of adenosine-derived drugs. To date, there is no molecular information on the type of adenosine transporter that is expressed at the BBB.
Adenosine transport at the BBB is characterized by a preferential affinity for purine nucleosides, relative to pyrimidine nucleosides (Cornford and Oldendorf, 1975), and by sodium dependency and insensitivity to S-(4-nitrobenzyl)-6-thioinosine (NBTI) (Pardridge et al., 1994). Adenosine transporters may be either sodium-dependent concentrative nucleoside transporters (CNT) or equilibrative nucleoside transporters (ENT), and may be either insensitive or sensitive to inhibition by NBTI (Cass et al., 1998). The ENT2 isoform is expressed at the choroid plexus epithelium in brain (Anderson et al., 1999), and ENT1 and ENT2 are expressed in mouse brain (Kiss et al., 2000). However, it is not known which ENT or CNT isoform mediates BBB transport of adenosine in vivo at the brain capillary endothelium.
Molecular studies of BBB carrier-mediated transport systems is enabled by expression cloning of transporters using RNA derived from isolated brain capillaries. This approach was used to clone the large neutral amino acid transporter type 1 (LAT1) from isolated bovine brain capillaries (Boado et al., 1999). These studies demonstrated that LAT1 was the major BBB carrier-mediated transport system for large neutral amino acids. The frog oocyte expression system and cloned RNA generated from a rat brain capillary cDNA library are used in the current studies to clone the rat BBB adenosine transporter cDNA.
MATERIALS AND METHODS
Materials
The mMessage mMachine in vitro transcription kit was obtained from Ambion (Austin, TX, U.S.A.). [2,8-3H]-adenosine (38.6 Ci/mmol), [14C]-sucrose (0.6 Ci/mmol), [α32P]-dCTP (800 Ci/mmol), and GeneScreen Plus Membrane were purchased from NEN Life Science (Boston, MA, U.S.A.). S-(4-nitrobenzyl)-6-thioinosine (NBTI) and other molecular biology grade reagents were obtained from Sigma Chemicals (St. Louis, MO, U.S.A.). Restriction endonucleases were obtained from Promega Life Science (Madison, WI, U.S.A.). Oligodeoxynucleotides were custom synthesized at Biosource International (Camarillo, CA, U.S.A.). The full-length, rat 4F2hc cDNA (accession #AB015433) subcloned in pBluescript II SK was kindly provided by Dr. Y. Kanai (Kyorin University, Japan). Horseradish peroxidase (HRP) anti-digoxigenin conjugate, biotinyl-tyramide, HRP anti-biotin conjugate, alkaline phosphatase (AP) anti-biotin conjugate, and pepsin were obtained from DAKO (Carpinteria, CA, U.S.A.) as part of the GenPoint Catalyzed Signal Amplification System for In Situ Hybridization provided by DAKO. Fast Red TR/Naphthol and all other reagents were obtained from Sigma Chemical (St. Louis, MO, U.S.A.).
Rat brain capillary library
The rat BBB-cDNA expression library was prepared in the vector pSPORT using the SuperScript cloning system (Gibco Life Technologies, Gaithersburg, MD, U.S.A.) and rat BBB poly A+ RNA as previously described in this laboratory for the construction of bovine brain capillary-cDNA libraries (Boado et al., 1999). Poly A+ RNA was isolated from rat brain microvessels obtained from a pool of 21 rat brains using a single step method previously described (Boado and Pardridge, 1991). The yield was 3.4 μg poly A+ RNA and the OD260/280 was 1.74. Two micrograms poly A+ RNA was used for oligo-dT-NotI priming, and the reaction was monitored with32P-dCTP. The synthesis of the second strand of cDNA was performed with a mixture of E. coli DNA polymerase I, DNA ligase, and RNase H. SalI adapters were ligated at the 5′-end of synthesized cDNA, and the final product was size fractionated (>1.6 kb) with a Sephacryl S-500 HR column to yield 120 ng cDNA; 10 ng of cDNA was subcloned in the NotI/SalI cohesive ends of the vector pSPORT to construct a cDNA expression library in E. coli DH5α. The rat BBB-cDNA library was composed of 120,000 independent recombinants and was amplified once.
Expression cloning experiments
For the expression cloning, 9 μg plasmid DNA was isolated from the rat BBB pSPORT library and 1.5 μg was linearized with NotI for the production of 33 μg 5′-capped cloned RNA (cRNA) using the mMessage mMachine kit and T7 RNA polymerase. Ethidium bromide staining of the transcribed RNA showed a size variance of 0.4 to 5.0 kb. Capped cRNA was injected into frog oocytes to investigate the uptake of [2,8-3H]-adenosine as described below. Injection of the unfractionated cRNA yielded a flux ratio of 16, where the flux ratio is the 60-minute uptake of [3H]-adenosine after injection of the cloned RNA, divided by the uptake of [3H]-adenosine after injection of water. The library then was divided into 6 pools of 1000 colonies each. Positive pools were subsequently divided into 6 to 12 subpools until a single positive clone was isolated. The flux ratio increased from 16 to more than 400 with each successive round of cloning. In the first round, 1 of 6 pools demonstrated adenosine transporter activity, and this pool was named pool 6. Pool 6 was divided into 6 subpools of 200 colonies each, and 2 of these pools yielded adenosine transporter activity; these were named pool 6–1 and pool 6–4. Pool 6–4 was divided into 8 subpools composed of 12 colonies each, and pools 6–4-A and 6–4-H yielded adenosine transport activity. A single clone encoding adenosine transport activity was identified from pool 6–4-A; this clone was designated A-11.
Frog oocytes were isolated as described previously (Boado et al., 1999). Oocytes were injected with 50 nL water or cRNA solution (20 ng/oocyte) using a nanoliter injector (World Precision Instruments, Sarasota, FL, U.S.A.), and kept in Barth's/gentamycin solution for 2 days at 18°C to allow for expression of the mRNA within the oocyte. For the transport assay, 7 to 8 healthy oocytes were washed with choline buffer (0.1 mol/L choline chloride/2 mmol/L KCl/1 mmol/L MgCl2 /1 mmol/L CaCl2 /10 mmol/L Hepes). The pH of the buffer was adjusted to 7.4 with Tris base. Oocytes were incubated in 100 μL sodium buffer (0.1 mol/L NaCl/2 mmol/L KCl/1 mmol/L MgCl2 /1 mmol/L CaCl2 /10 mmol/L Hepes, pH 7.5) or choline buffer containing 2 μCi [3H]-adenosine and 0.08 μCi [14C]sucrose at 22°C for 2 to 60 minutes. The reaction was stopped with 3 mL of ice-cold choline buffer, followed by 3 additional washes with the same buffer. Oocytes were individually dissolved in 0.5 mL of 1 mol/L NaOH for 30 minutes at 60°C. Radioactivity was measured in a liquid scintillation counter. Adenosine volume of distribution (μL/oocyte) was calculated as follows:

The volume of distribution for [14C]-sucrose was subtracted from the total volume of distribution for [3H]-adenosine. For the NBTI inhibition experiments, oocytes were incubated in sodium buffer containing 100 nmol/L NBTI for 1 hour before the assay. For the sodium dependency assay, the transport buffer contained 20 μmol/L of unlabeled adenosine in addition to 2 μCi [3H]adenosine. For measurement of the half-saturation constant for sodium, K0.5, and the Hill coefficient, n, the transport buffer contained 10 μmol/L unlabeled adenosine and 2 μCi [3H]adenosine. The Km and Vmax of adenosine uptake were determined by fitting the saturation data to the Michaelis–Menten equation, and the K0.5 and n were computed by fitting the sodium saturation data to the Hill equation. In both cases, data fits were determined by nonlinear regression analysis using program P3R from the BMDP Statistical Software developed by the University of California Los Angeles BMDP Computing Facility. The Hill equation is v/Vmax = Nan / (Kn+ Nan), where v is the transport flux, Vmax is the flux at maximal sodium, K is the sodium K0.5, Na is the sodium concentration, and n is the Hill coefficient, which is the number of sodium ions that is cotransported with each adenosine molecule.
DNA sequencing
DNA sequencing of the isolated clone (A-11) was performed in both directions as previously described (Boado et al., 1999). Sequencing reactions were performed at the Biotech Core sequencing facility (Mountain View, CA, U.S.A.) using both M13 (forward and reverse) and customized primers. Seventeen to 20 mers was designed with the program OLIGOS 4.0 so that the primers had a Tm > 60°C in the absence of either stable stem loops or secondary structures. Similarity with other transporters in GenBank was investigated with the BLAST program (NCBI).
Northern blot analysis
Poly(A)+ RNA was isolated from C6 rat glioma cells, rat brain capillaries, and rat organs (brain, heart, lung, liver, and kidney) using a single step method previously described (Boado and Pardridge, 1991). Two to 4 μg poly (A)+ RNA was resolved in a 1.5% agarose/2.2 mol/L formaldehyde gel and blotted onto a GeneScreen Plus Membrane (DuPont Life Sciences, Boston, MA, U.S.A.). Northern blots were probed with32P-labeled clone A-11 or rat 4F2hc as described previously (Boado et al., 1999). A-11 and 4F2hc cDNA inserts were released from plasmids with NotI/SalI and SalI, respectively. Autoradiograms were performed with Kodak X-Omat Blue XB-1 film and intensifying screens at −70°C. X-ray films were scanned with a Umax PowerLook III scanner and transferred to Adobe Photoshop 5.5 on a G4 Power Macintosh.
In situ hybridization
For in vitro transcription, a 1.5-kb BBB CNT2 cDNA fragment was prepared by double digestion of the pSPORT clone A-11 with NotI and StuI. The ∼1.4-kb insert corresponding to the 3′-end of the CNT2 cDNA was discarded, and the ends of the NotI-StuI digested pSPORT clone A-11 containing the ∼1.5 kb of the 5′-end of the CNT2 were filled with Klenow and dNTPs and ligated with T4 DNA ligase. The new CNT2 expression plasmid was linearized with AflII, which digests the 1.5-kb CNT2 fragment at nucleotide ∼750. Both antisense and sense RNA probes (that is, 750 bp each) were generated using AflII-digested plasmid DNA and SP6 and T7 polymerases, respectively, and digoxigenin-11-uridine triphosphate (DIG-11-UTP), as part of the DIG RNA Labeling kit (Roche Molecular Biochemicals, Indianapolis, IN, U.S.A.). As a positive control for in situ hybridization (ISH), parallel studies also were performed on the GLUT1 glucose transporter mRNA, which is a brain endothelial specific mRNA (Boado and Pardridge, 1990). A 0.4-kb cDNA fragment of the rat GLUT1 was released from a pBluescript M13+ containing the full-length rat GLUT1 by digestion with BamHI. The 0.4-kb GLUT1 fragment was subcloned into the pBluescript M13+ vector at the same restriction endonuclease site. Both 0.4 kb antisense and sense RNA probes were generated using EcoR I and XbaI linearized plasmid, and T7 and T3 polymerases, respectively. Freshly isolated rat brain capillaries were cytocentrifuged to glass slides and fixed with 10% formalin before storage at −70°C as described previously (Li et al., 2001). In situ hybridization was performed as described by St. Croix et al. (2000). After permeabilization of the cells with pepsin, the slides were hybridized with DIG-labeled sense or antisense probes (100 ng/mL) overnight at 55°C. After washing, the slides were incubated with HRP anti-DIG conjugate, biotinyl-tyramide, HRP anti-biotin conjugate, biotinyl-tyramide, and alkaline phosphatase anti-biotin conjugate (DAKO, Carpinteria, CA, U.S.A.), to amplify the signal per the manufacturer's instructions for the GenPoint ISH technique (DAKO). The final color was developed with Fast Red TR/Napthol (Sigma) at room temperature in the dark, and the capillaries were lightly counterstained with hematoxylin.
RESULTS
The cRNA obtained from the rat BBB library was analyzed with the frog oocyte expression system and a single clone, designated A-11, was identified based on [3H]-adenosine uptake assays (Methods). The A-11 clone yielded a flux ratio of adenosine uptake in the oocytes of 400–500 (Fig. 1A). The adenosine uptake in the oocytes injected with the cloned RNA from the rat BBB library was insensitive to inhibition by NBTI (Fig. 1A), but was sensitive to replacement of sodium cations with choline (Fig. 1B).
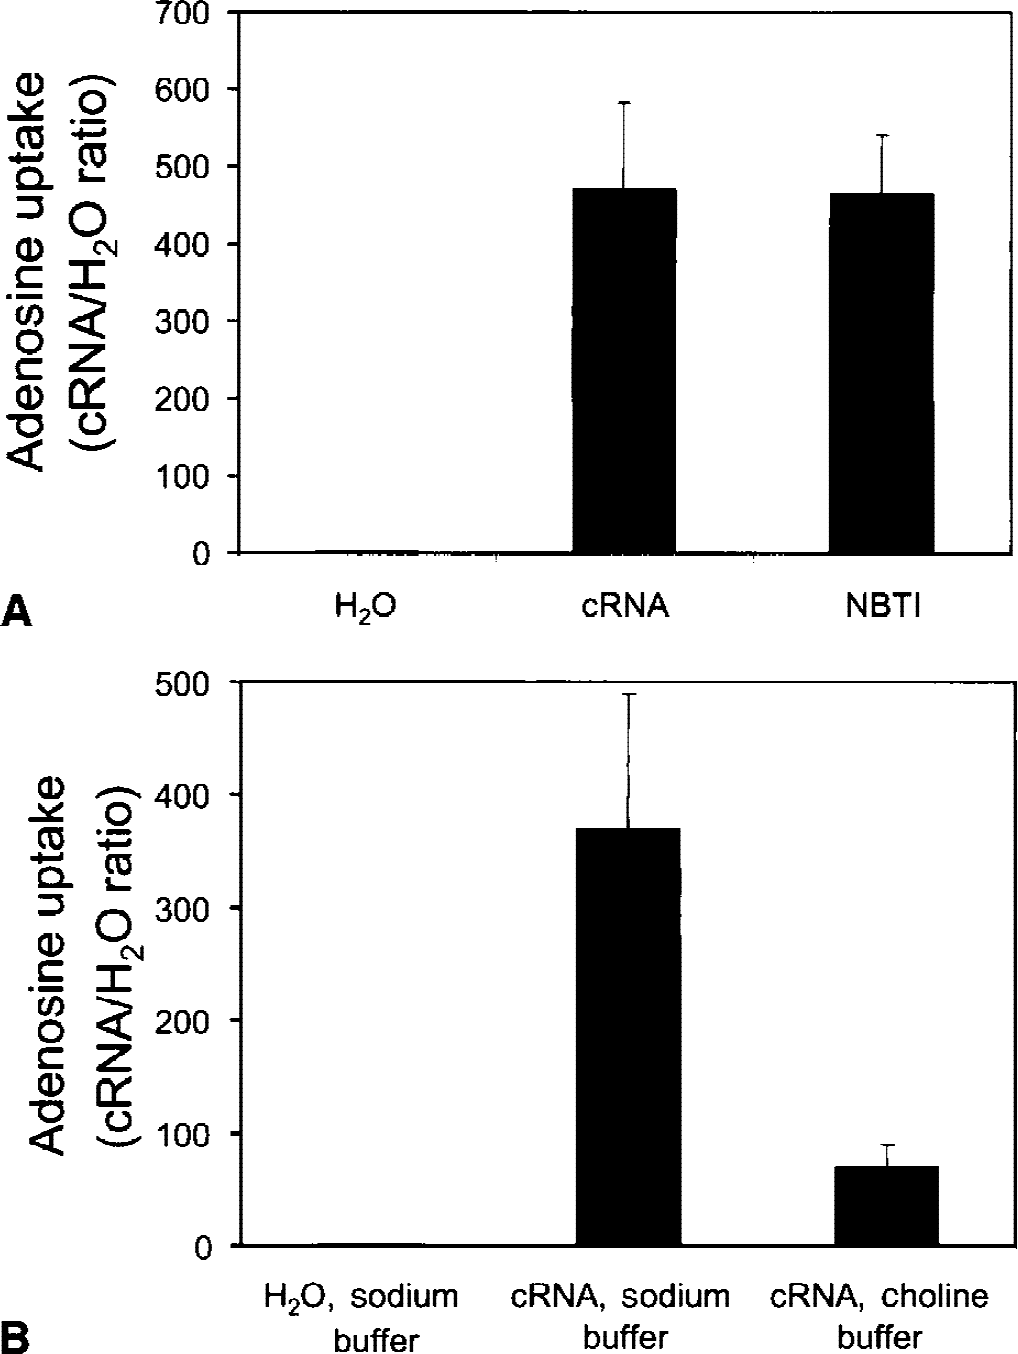
Adenosine uptake in frog oocytes was measured after the injection of either the cloned A-11 CNT2 RNA (cRNA) or comparable volumes of water. [3 H] adenosine transport was measured over 2-minute uptake periods. Oocytes were injected with 20 ng/oocyte of cRNA. The adenosine flux ratio in the cRNA-injected oocytes relative to water-injected oocytes was 400 to 500; this was not sensitive to inhibition by S-(4-nitrobenzyl)-6-thioinosine (NBTI;
DNA sequence analysis indicated the A-11 cDNA was 2905 nucleotides in length, with a 252 nucleotide 5′-untranslated region (UTR), a 1977 nucleotide coding region, a stop codon, and a 629 nucleotide 3′-UTR followed by a 44-mer poly A tail. The sequence of the coding region predicts a 659 amino acid protein. Comparison of the DNA sequence of clone A-11 with the 2907 nucleotide rat liver SPNT1 (accession number U25055;Che et al., 1995) or the 2665 nucleotide rat jejunum CNT2 (accession number U66723;Yao et al., 1996) indicates these 3 adenosine transporters are identical with minor exceptions. Clone A-11 and rat SPNT1 have a 3 nucleotide insertion (“CAG”) at nucleotide 229 of the 5′-UTR, which does not change the open reading frame. G1806 in rat CNT2 is substituted by “A” in either clone A-11 and in rat SPNT1, and this single nucleotide change produces a conservative substitution of Val602 in CNT2 compared with Ile in A-11 or SPNT1. CG located at nucleotides 1527–1528 of SPNT1 are inverted in clone A-11 or rat CNT2, and this produces a substitution of Ala419 in SPNT1 for Gly419 in either CNT2 or clone A-11. The length of the 5′-UTR differs among the 3 clones, as A-11 and CNT2 begin at nucleotide 20 and 27 of the SPNT1 sequence, respectively. The length of the 3′-UTR of rat CNT2 is truncated at nucleotide 2665, and does not include the most distal 3′-UTR or a poly A tail (Yao et al., 1996). The 3′-UTR of SPNT1 reported in Genbank stops at the beginning of the poly A tail, although the length of rat liver SPNT1 (2907 nucleotides) allows for a poly A tail as long as 26 nucleotides (Che et al., 1995). The 3′-UTR of clone A-11 is complete and includes a 44-mer poly A tail.
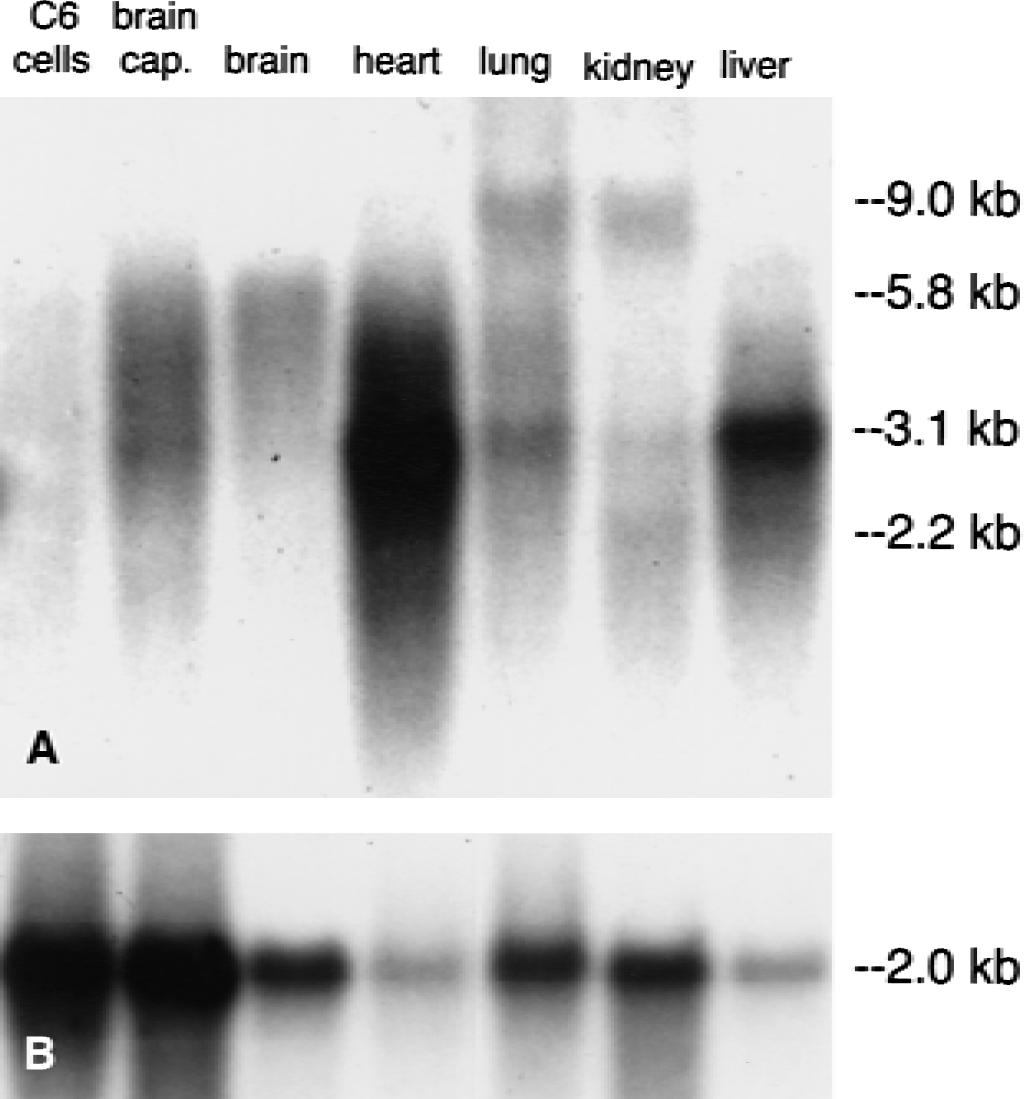
The A-11 rat BBB adenosine transporter cDNA was used in Northern blot analysis. As shown in Fig. 2, the abundance of the CNT2 transcript in isolated rat brain capillaries was compared with total rat brain, rat heart, rat lung, rat kidney, rat liver, and cultured C6 rat glioma cells. The primary CNT2 transcript in rat brain capillaries had a size of 3.1 kb, although a larger size (5.8 kb) transcript also was present in brain microvessels (Fig. 2A). The 3.1-kb CNT2 transcript was prominent in rat heart and liver, and was barely detectable in total rat brain or rat kidney. The 5.8-kb mRNA were observed for whole brain RNA samples (Fig. 2). There was no detectable CNT2 transcript in RNA isolated from C6 rat glioma cells (Fig. 2A). The quality of the RNA used for the Northern blotting study shown in Fig. 2A was assessed by Northern hybridization of the same filter with the cDNA encoding for rat 4F2hc, a common housekeeping gene. The 4F2hc glycoprotein forms the heavy chain of a heterodimer for amino acid transporters (Kanai et al., 1998). The level of the 4F2hc mRNA was comparable in all peripheral rat tissues and was approximately 2-fold greater in purified rat brain capillaries or C6 rat glioma cells (Fig. 2B).
The A-11 rat CNT2 clone was injected into oocytes and saturation of [3 H]-adenosine uptake was measured (Fig. 3). Nonlinear regression analysis of the saturation curve yielded a Km of 23.1 ± 3.7 μmol/L and a Vmax of 10.8 ± 0.9 pmol/oocyte · min. These kinetic parameters were determined with oocytes injected with 20 ng of cloned A-11 RNA/oocyte. Comparable results were also obtained with oocytes injected with 10 ng of cloned A-11 RNA/oocyte. The [3 H]-adenosine volume of distribution after injection of 10 or 20 ng A-11 cRNA was 0.91 ± 0.20 or 1.16 ± 0.14 μL/oocyte, respectively (mean ± SD, n = 3).
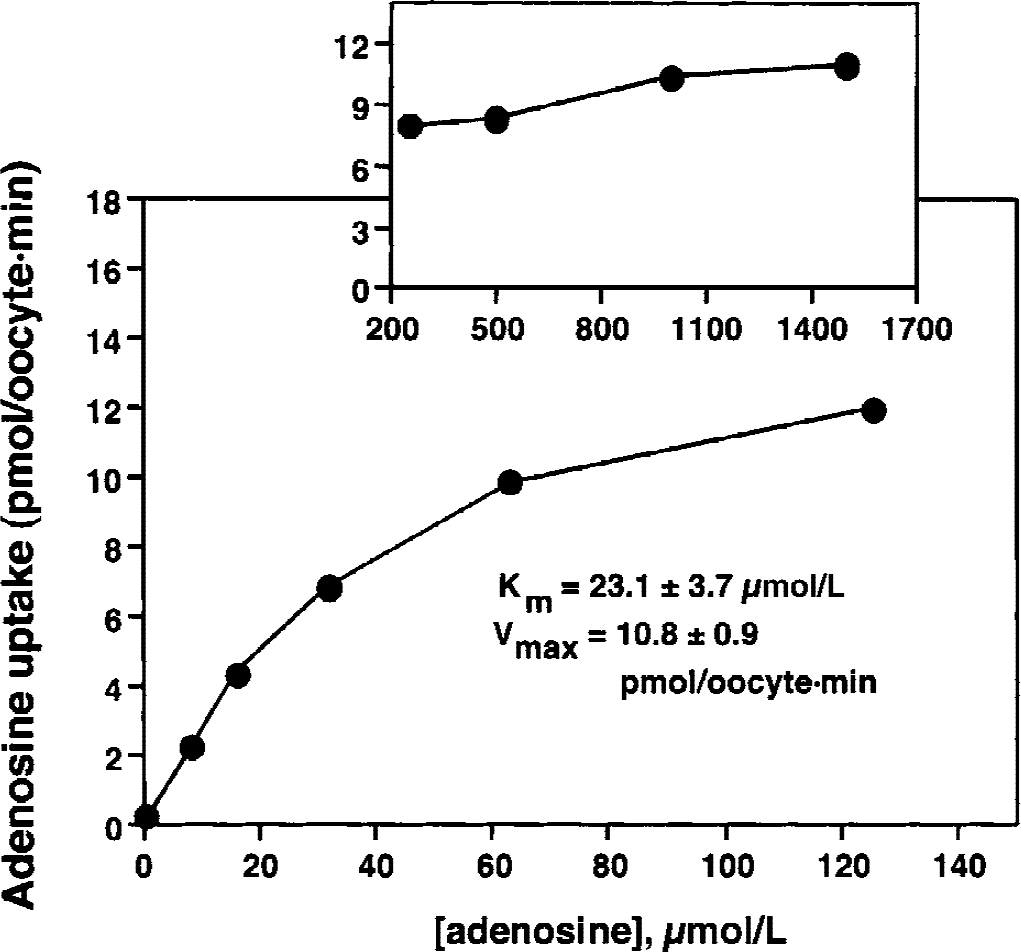
Adenosine transport was measured for 2 minutes in oocytes injected with 20 ng of the A-11 cloned rat CNT2 cRNA. Km and Vmax values of adenosine transport were determined by fitting the adenosine saturation curve to the Michaelis–Menten equation using a nonlinear regression analysis.
The substrate profile for the cloned rat BBB CNT2 is shown in Fig. 4. There is preferential affinity for purine nucleosides, relative to pyrimidine nucleosides, although the transporter is competed by uridine. The di-deoxy pyrimidine nucleoside, dideoxycytidine, azidothymidine, the purine bases such as adenine, and the phosphorylated adenosine nucleotides were not transported (Fig. 4).
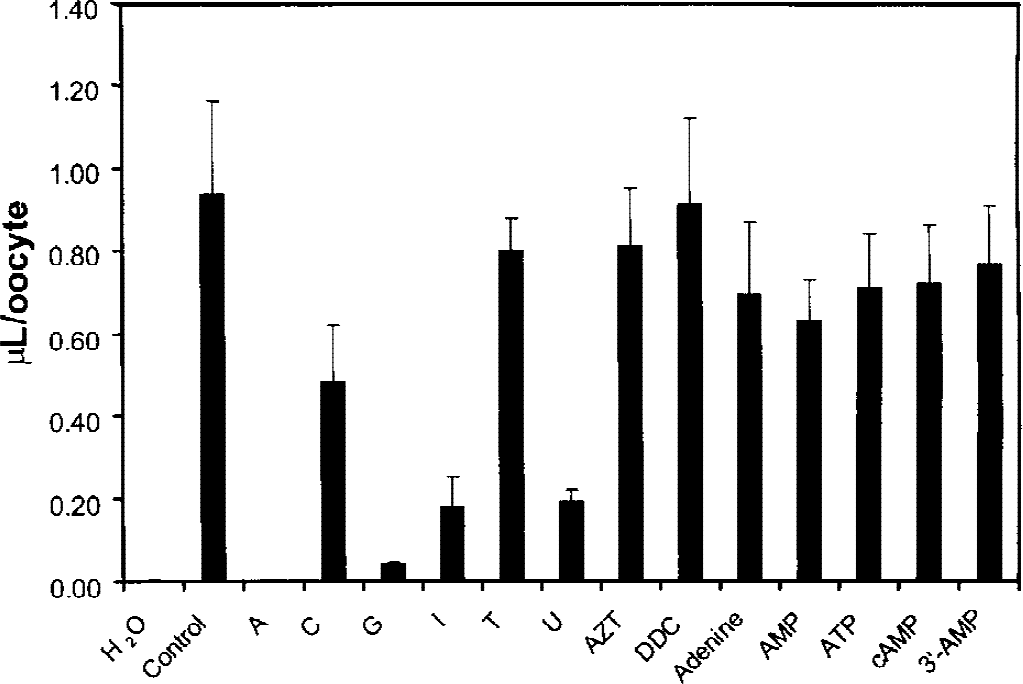
Volume of distribution (μL/oocyte) of [3 H] adenosine in the presence of either 0 additive (control) or 2 mmol/L unlabeled competing substrate was measured after a 2-minute incubation period in oocytes injected with 20 ng cRNA derived from the A-11 clone. A, adenosine; C, cytidine; G, guanosine; I, inosine; T, thymidine; U, uridine; AZT, azidothymidine; DDC, dideoxycytidine; AMP, adenosine monophosphate; ATP, adenosine triphosphate; cAMP, cyclic AMP; 3′-AMP, 3′-adenosine monophosphate. Data are mean ± SE (n = 3).
The sensitivity of the cloned rat BBB A-11 CNT2 clone to sodium was determined in oocytes injected with 20 ng/oocyte of the A-11 cloned RNA. In these experiments, the concentration of adenosine was fixed at 10 μmol/L and the concentration of sodium was varied from 0 to 100 mmol/L (Fig. 5). Approximately 75% of the total adenosine uptake was sodium-sensitive and the sodium half-saturation constant (K0.5) was 2.4 ± 0.1 mmol/L. The Hill coefficient (n) was 1.06 ± 0.07 (Fig. 5), indicating adenosine and sodium were transported in a 1:1 stoichiometric relationship.
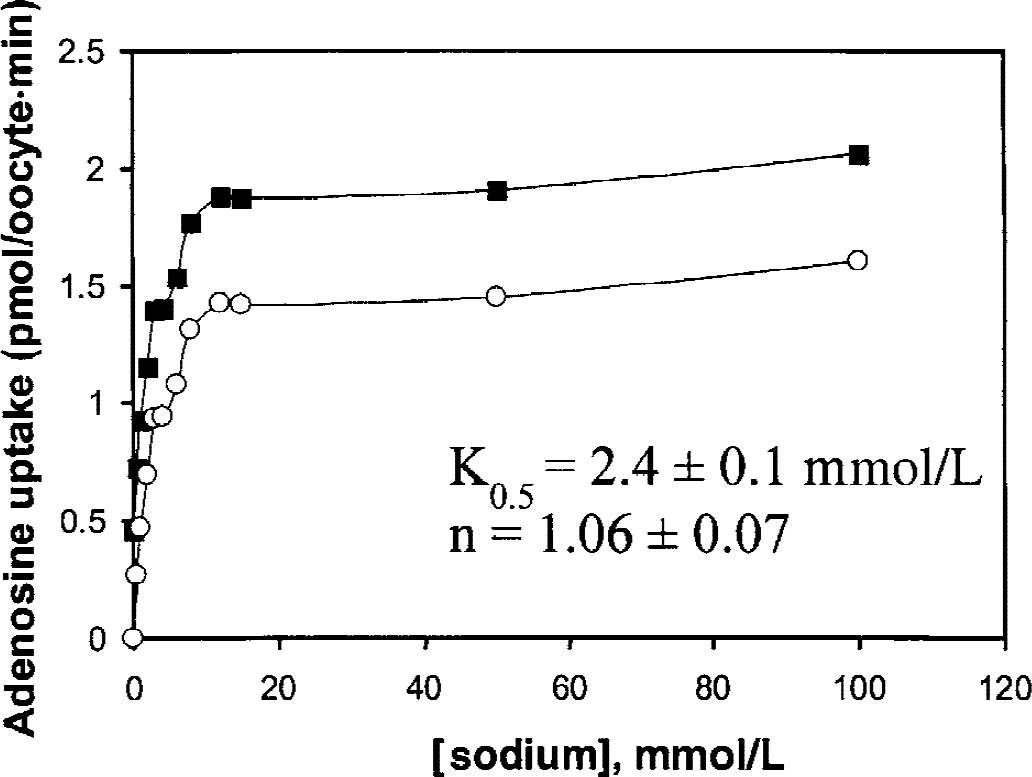
Adenosine uptake over 2 minutes is plotted versus sodium concentration in oocytes injected with 20 ng of the cloned A-11 rat CNT2 cRNA. The total uptake is shown in the closed squares, the uptake that is sensitive to sodium replacement by choline is shown in the open circles, and the difference between the two curves represents the basal adenosine influx when the sodium concentration is zero. Fitting of the saturation curve to the Hill equation yielded a K0.5 for sodium of 2.4 ± 0.1 mmol/L, and a Hill coefficient (n) of 1.06 ± 0.07. The adenosine concentration was fixed at 10 μmol/L.
The expression of the rat CNT2 mRNA within the endothelium of rat brain microvessels was confirmed with ISH of cytocentrifuged isolated rat brain capillaries, as shown in Fig. 6A to 6C. The GLUT1 glucose transporter is a known endothelial-specific transcript (Boado and Pardridge, 1990), and parallel GLUT1 ISH was performed as a positive control as shown in Fig. 6D to 6F. Only background immune staining is observed with either the CNT2 (Fig. 6A) or GLUT1 (Fig. 6D) sense probes. However, there is discontinuous immune staining over the capillaries labeled with either CNT2 (Fig. 6B and 6C) or GLUT1 (Fig. 6E and 6F) antisense probes.
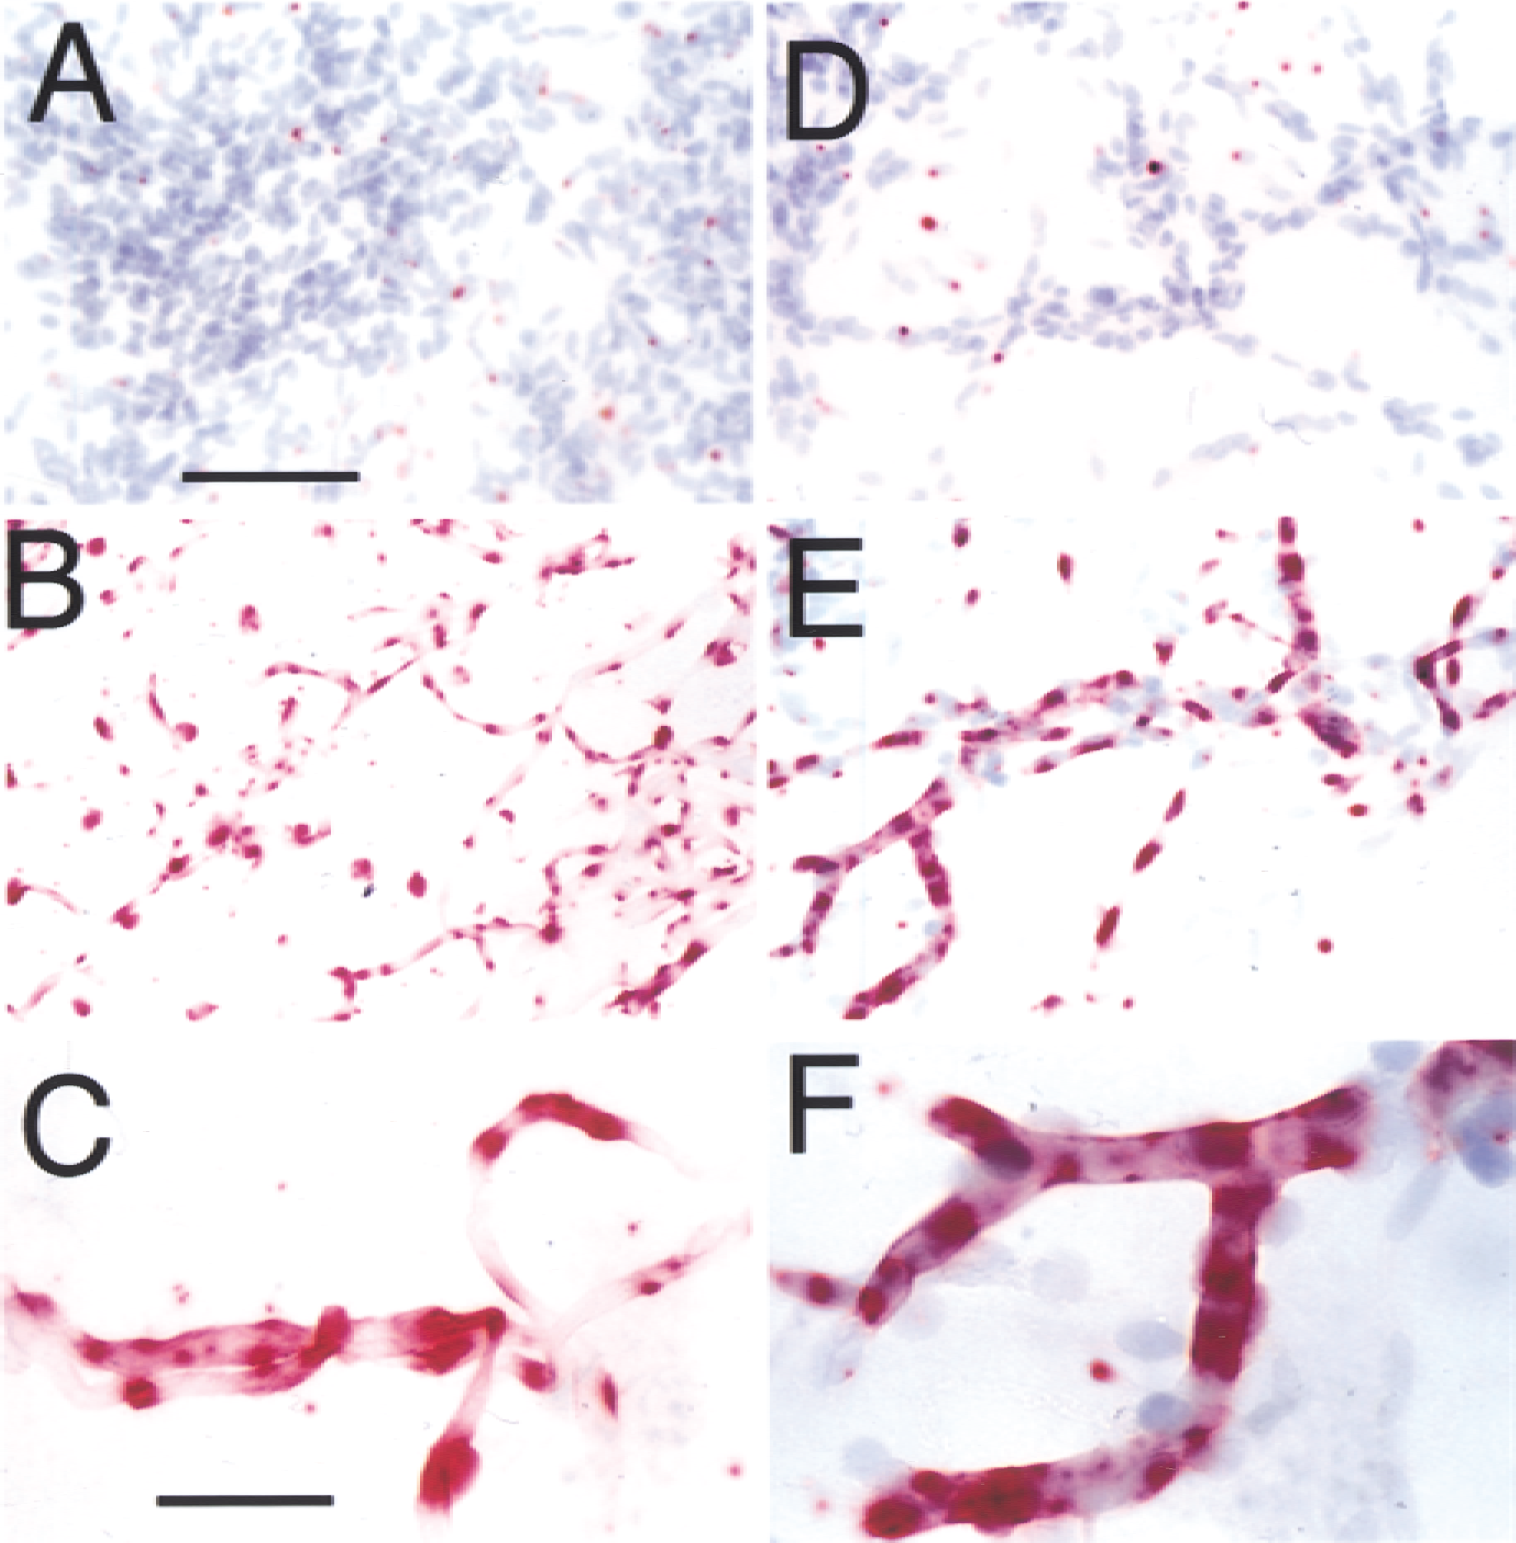
In situ hybridization for rat CNT2
DISCUSSION
The results of these studies are consistent with the following conclusions. First, the rat BBB adenosine transporter in vivo has characteristics that are identical to properties of the concentrative nucleoside transporter type 2 (CNT2) that is cloned from a rat BBB cDNA library. Second, the Vmax of adenosine transport into frog oocytes injected with the A-11 cDNA cloned from the rat brain capillary is approximately 50-fold greater than the Vmax of previously reported rat CNT2 or SPNT1 clones (Che et al., 1995; Yao et al., 1996). Third, the rat BBB CNT2 has a high affinity for sodium with a K0.5 of 2.4 ± 0.1 mmol/L and a Hill coefficient of 1.06 ± 0.07 (Fig. 5). Fourth, the concentration of the CNT2 mRNA at the rat BBB is relatively high and is comparable to CNT2 mRNA level in rat liver (Fig. 2A).
The kinetic properties of the cloned rat CNT2 are nearly identical to the transport characteristics of adenosine transport across the BBB in vivo in the following respects. First, both BBB adenosine transport in vivo (Pardridge et al., 1994) and adenosine transport through the cloned BBB CNT2 (Fig. 5) are sodium-dependent with the same pattern of partial sodium dependency. Second, adenosine transport at the BBB in vivo in the blood to brain direction is NBTI-insensitive (Pardridge et al., 1994), as is the CNT2 cloned from a rat BBB cDNA library (Fig. 1). Third, there are identical patterns of substrate competition by other nucleoside analogues of adenosine transport either across the BBB in vivo (Cornford and Oldendorf, 1975) or through the CNT2 cloned from a rat BBB cDNA library (Fig. 4). Fourth, adenosine transport across the BBB in vivo is characterized by a Km of 25 ± 3 μmol/L (Pardridge, 1983), as determined with the brain uptake index method (Cornford and Oldendorf, 1975), and this Km is not significantly different from the Km of adenosine transport through the CNT2 cloned from a rat BBB cDNA library (Fig. 3), although both Km values are greater than the Km determined with the internal carotid artery perfusion technique (Pardridge et al., 1994). Fifth, the CNT2 mRNA is localized to the endothelium in isolated rat brain capillaries, as shown by the ISH in Fig. 6. The pattern of immune labeling the microvessel CNT2 mRNA is identical to that of the GLUT1 glucose transporter mRNA, which is a known endothelial specific transcript (Boado and Pardridge, 1990).
CNT2 is one of the first sodium-dependent cotransporters described that mediates BBB transport of substrate in the blood to brain direction. Sodium transport at the luminal endothelial membrane in brain has been described in vivo (Ennis et al., 1996). In contrast to the adenosine transporter, BBB nutrient transporters, such as the Glut1 glucose transporter (Boado and Pardridge, 1990) or the LAT1 large neutral amino acid transporter (Boado et al., 1999), are sodium-independent transporters that mediate the bidirectional transport of glucose or large neutral amino acids, respectively, between the blood and brain compartments. The sodium-dependent cotransporters described at the BBB thus far are primarily efflux systems (O'Kane et al., 1999) that mediate substrate transport in the brain to blood direction.
The sodium-dependent, concentrative mechanism of BBB adenosine transport may be related to the enzymatic barrier to circulating adenosine. The peripheral administration of glucose or neutral amino acids results in a parallel increase in the brain concentration of these nutrients, owing to substrate transport through BBB Glut1 or LAT1. However, there are no pharmacologic effects in brain after peripheral adenosine administration, including intracarotid arterial infusion of adenosine (Berne et al., 1983), despite the presence of the BBB adenosine transporter. The absence of central nervous system pharmacologic effects of peripheral adenosine is because of an ‘enzymatic’ BBB to circulating adenosine. Adenosine is immediately phosphorylated within the brain microvascular compartment after uptake through the BBB adenosine carrier (Pardridge et al., 1994). Therefore, the sodium dependency and concentrative uptake of adenosine through the BBB CNT2 may be related to the need for rapid inactivation in brain of blood-borne adenosine. Adenosine is a neurotransmitter within the central nervous system (Haas and Selbach, 2000), and compartmentalization must exist between the blood and brain pools of adenosine.
The Km for adenosine transport through the cloned rat BBB CNT2, 23 ± 4 μmol/L (Fig. 3), is comparable to the Km of adenosine transport obtained with either rat liver SPNT1 (Che et al., 1995) or human small intestine CNT2 (Ritzel et al., 1998). However, the Vmax of adenosine transport obtained with cRNA derived from the A-11 clone, 10.8 ± 0.9 pmol/oocyte · min (Fig. 3), is approximately 50-fold greater than the adenosine Vmax for either rat liver SPNT1 (Che et al., 1995) or human small intestine CNT2 (Ritzel et al., 1998). The Vmax of adenosine transport is 0.46 to 0.49 pmol/oocyte · min after the injection in oocytes of 10 ng of either cloned rat liver SPNT1 RNA (Che et al., 1995) or human small intestine CNT2 (Ritzel et al., 1998). The Km and Vmax values for rat liver SPNT1 predict adenosine influx rates that agree with experimentally observed values using the CNT2 clone derived from rat jejunum (Yao et al., 1996). The high Vmax of the A-11 CNT2 clone obtained from the rat BBB is unique among the rat or human CNT2 clones obtained to date, although the adenosine Vmax of the A-11 rat CNT2 clone is comparable with the Vmax of uridine transport through human kidney CNT1, 26 ± 1 pmol/oocyte · min (Ritzel et al., 1997). The high Vmax of the rat BBB A-11 clone also is reflected in the large flux ratio of adenosine transport into oocytes, which exceeds 400 (Fig. 1). In contrast, the adenosine flux ratio with rat liver SPNT1 is 30 (Che et al., 1995), and the adenosine flux ratio for rabbit intestine CNT2 is 4 to 16 for uridine or inosine (Gerstin et al., 2000). These differences in the adenosine flux ratio for various CNT2 clones may be related to methodologic variations in measuring substrate transport in oocytes. Alternatively, there may be a molecular basis for the high expression of adenosine transporter activity with the rat BBB A-11 CNT2 clone. DNA sequence analysis of the A-11 clone showed no significant differences in either the 5′-UTR or in the 3′-UTR of the rat BBB A-11 clone relative to other rat CNT2 clones (Results). The only significant difference in rat CNT2/SPNT1 sequences is the length of the poly A tail, which is long, 44 nucleotides, for the rat BBB A-11 CNT2 clone (Results). A long poly A tail enhances expression of cloned mRNA in frog oocytes (Takemori et al., 1997), as this region facilitates interaction of the mRNA with poly A binding proteins to increase the translational efficiency and/or mRNA stability of the mRNA (Bilger et al., 1994).
The high activity of adenosine transport in oocytes injected with the A-11 clone allows for determination of the kinetics of sodium binding to the rat BBB CNT2. The affinity of the rat BBB CNT2 clone for sodium is high with a K0.5 of 2.4 ± 0.1 mmol/L and a Hill coefficient (n) of 1.06 ± 0.07, at an adenosine concentration of 10 μmol/L (Fig. 5). The Hill coefficient is not significantly different from 1.0, indicating there is a 1:1 molar ratio of sodium and adenosine molecules transported by CNT2. The K0.5 for sodium for other rat CNT2 clones has not been reported previously. The sodium affinity of the rat BBB CNT2 is comparable to the high sodium affinity of the sodium glucose transporter type 2 (SGLT2), which has a K0.5 of 5 mmol/L for sodium at a sugar substrate concentration of 10 μmol/L (Mackenzie et al., 1996). More detailed kinetic investigations of the affinity of the rat BBB CNT2 for either substrate or sodium may be determined in future studies, and this will be facilitated by the high level of expression of the A-11 rat CNT2 clone in oocytes (Fig. 1).
The rat SPNT1 clone was initially isolated from liver, and Northern blotting studies demonstrated a 2.9-kb transcript that was abundant in jejunum, but negative in brain (Che et al., 1995). These Northern blots were performed with 25 μg total RNA per lane. Higher sensitivity is obtained with poly A+ RNA, which was used for the Northern blotting studies reported in Fig. 2. The size of the primary rat CNT2 mRNA is 3.1 kb and has a distribution of heart >> liver > rat BBB, rat lung > rat kidney. There also is a 9.0-kb CNT2 transcript in rat lung and kidney, and an intermediate size transcript of 5.8 kb that is present in rat brain and rat brain capillaries. There is no detectable CNT2 transcript in cultured C6 rat glial cells (Fig. 2). The principal adenosine transporter in C6 glial cells is ENT2 (Sinclair et al., 2000). Northern blotting studies with human CNT2 demonstrate a 4.4-kb transcript in heart, liver, and kidney, and to a lesser extent in brain (Wang et al., 1997). The low CNT2 mRNA signal in Northern blots of whole brain do not reflect the abundance of the transcript at the BBB, because the volume of the brain capillary endothelial cell is only 10−3 parts of whole brain. When Northern blotting is performed with RNA isolated from purified rat brain capillaries, the level of CNT2 mRNA at the BBB can be assessed directly. This shows that brain capillaries produce a concentration of CNT2 mRNA comparable to other peripheral tissues that have high levels of adenosine transport activity (Fig. 2).
In summary, these studies describe the expression cloning of the rat BBB adenosine transporter and demonstrate this transporter is identical to rat CNT2. The Vmax of adenosine transport in oocytes injected with cRNA derived from the rat BBB A-11 CNT2 clone, 10.8 pmol/oocyte · min (Fig. 3), and the adenosine flux ratio, 400 to 500 (Fig. 1), is 50-fold greater than that reported previously for rat, human, or rabbit SPNT1 or CNT2 clones (Che et al., 1995; Yao et al., 1996; Ritzel et al., 1998; Gerstin et al., 2000). The high activity of the rat BBB A-11 CNT2 clone may allow for future kinetic studies on the affinity of the rat CNT2 transporter for endogenous nutrients, sodium, or nucleoside-derived pharmaceuticals. Adenosine analogs could be developed into drugs that either increase brain blood flow (Berne et al., 1983) or inhibit seizure activity (Brockhaus and Ballanyi, 2000). The blood to brain transport of adenosine drugs will be enabled by both resistance of the drug to the brain microvascular enzymatic barrier to adenosine (Pardridge et al., 1994) and by transport of the drug through the BBB CNT2 adenosine carrier.
Footnotes
Acknowledgments:
The authors thank Daniel Jeong for skillfully preparing the manuscript. The authors also are indebted to Dr. Ernest M. Wright for valuable discussions.