
Abstract
Vasogenic edema after oxidative injury has been accompanied by intracellular accumulation of serum proteins and nuclear damage. This study sought to determine whether serum protein accumulation, along with other markers of brain injury, was present after exposure to intracerebral hemolysate, an oxidant model of intracerebral hemorrhage (ICH). Saline (n = 24) or hemolysate (n = 30) was injected into the caudate-putamen of adult Sprague-Dawley rats. Compared with saline, hemolysate deposition was associated with intracellular accumulation of serum proteins as evidenced by Evans blue uptake in neurons and microglia at 4 and 24 hours. Intracellular Evans blue colocalized with DNA fragmentation detected by nick end-labeling and whose presence was confirmed by gel electrophoresis. Immunoblots of cytosolic fractions confirmed cytochrome c release. Immunostaining established colocalization of cytosolic cytochrome c and intracellular Evans blue at 4 hours. At 24 hours, cytosolic cytochrome c was evident in astrocytes surrounding Evans blue-positive cells. Immunoblot analysis and immunostaining revealed HSP70 induction at 24 hours in regions adjacent to intracellular serum accumulation. Neuronal accumulation of extravasated serum proteins in this model of ICH was associated with cytochrome c release, DNA fragmentation, and cell death. Stress protein induction in adjacent regions suggested that vasogenic edema might have exacerbated cellular dysfunction and cell death after ICH.
Intracerebral hemorrhage (ICH) is a common sequela of traumatic brain injury. Intracerebral hemorrhage alters brain physiology by introducing a space-occupying mass composed of potentially toxic blood products. Some studies have described ischemia and neuronal damage in perihematomal regions (Mendelow, 1993; Nath et al., 1986; Yang et al., 1994). In contrast, other studies have not observed perihematomal ischemia despite disruption of the blood–brain barrier (BBB) and elevation of intracranial pressure (Qureshi et al., 1999). Intracerebral hemorrhage by injection of whole blood or lysed blood has shown hemolysate to be far more toxic (Matz et al., 1997). These results suggest that factors others than pure mechanical injury and secondary ischemia account for cell dysfunction and death after ICH.
Among blood products, lysed erythrocytes and thrombin have been associated with the development of perihematomal edema (Xi et al., 1998). Injection of hemolysate into the subarachnoid space of rats was associated with hemoglobin uptake into neurons and microglia along with stress protein induction in the cerebrum and cerebellum in areas of greatest blood concentration (Turner et al., 1998, 1999). These effects were ameliorated by the 21-aminosteroid antioxidants U101033E and U743896 (Upjohn, Kalamazoo, MI, U.S.A.), suggesting that hemolysate is a potent prooxidant (Turner et al., 1999). Investigation of the oxidant effects of subarachnoid hemolysate on neocortex in mutant mice that either overexpressed or underexpressed cytosolic CuZn-superoxide dismutase or that underexpressed mitochondrial Mn-superoxide dismutase demonstrated that cell necrosis was inversely related to superoxide expression and that diminished expression of Mn-superoxide dismutase was associated with increased apoptosis and cytochrome c translocation into cytosol (Matz et al., 2000, 2001). These combined results suggest that intracranial hemolysate has strong oxidative properties.
Recent studies have shown altered metabolism, including increased levels of lactate, glutamate, glycogen, and glucose, in perihematomal regions (Bullock et al., 1998; Wagner et al., 1998). Perihematomal regions also have been associated with NFκB activation and apoptosis (Hickenbottom et al., 1999; Matsushita et al., 2000). Recently, oxidative stress in the brain has been associated with vasogenic edema and cellular uptake of extravasated intravascular proteins (Murakami et al., 1998). In many of these cells, nuclear morphology was altered as evidenced by abnormal staining using Hoechst dye (Murakami et al., 1998). Because hemolysate has oxidant properties and is associated with generation of edema, the authors sought to investigate uptake of extravasated serum proteins in regions around a blood clot composed of hemolysate. The authors hypothesized that uptake of extravasated proteins would occur in neurons and would be associated with cytochrome c release and cell death by DNA fragmentation. The authors also investigated the relation of heat shock protein 70 (HSP70) expression to regions that sequestered extravasated intravascular proteins to determine if cellular uptake of serum proteins also occurred in cells that survived the insult.
MATERIALS AND METHODS
Experimental model of intracerebral hemorrhage
All procedures were in accordance with the National Institutes of Health Guide for the Care and Use of Laboratory Animals and were approved by Stanford University's Administrative Panel on Laboratory Animal Care. Intracerebral hemorrhage was performed in adult, male Sprague-Dawley rats (250 to 350 g, n = 54) using a method described previously (Matz et al., 1997). Experimental animals were anesthetized with a mixture of 68% nitrous oxide, 30% oxygen, and 2% isoflurane by mask ventilation. Rectal temperature was controlled at 37°C ± 0.5°C with a homeothermic blanket. After cannulation, 100 μL blood was withdrawn from the femoral artery and placed into a sterile container. Blood was lysed by freezing and thawing in dry ice. An equivalent volume of normal saline then was replaced intraperitoneally.
Animals were placed into a stereotactic frame (Kopf Instruments, Tujunga, CA, U.S.A.). After scalp incision, a small bur hole was made 3 mm to the right and 1 mm anterior to the bregma. The hemolysate was placed in a sterile 1-mL syringe with a 30-gauge needle. The needle was introduced through the bur hole to a depth of 4.5 mm. Hemolysate (n = 30) or sterile saline for controls (n = 24) then was slowly injected over 1 minute. The needle was removed, the bur hole was filled with sterile bone wax, and the incision was closed. Animals then were injected intravenously with a sterile 2% solution of Evans blue dye (250 μL/100 g; Sigma, St. Louis, MO, U.S.A.). After intravenous injection, Evans blue has been shown to bind rapidly to albumin, thus permitting its use as a protein tracer (Wolman et al., 1981).
In situ labeling of DNA fragmentation
At 4 or 24 hours after hemolysate or saline injection, subjects (n = 6 each group) were anesthetized and killed by transcardiac perfusion with 3.7% formalin. Vibratome sections (25 μm) were mounted on slides and reacted with Proteinase K (20 mg/L; Boehringer Mannheim, Indianapolis, IN, U.S.A.) in 0.01 mol/L Tris-HCl (pH 8.0) and equilibrated with 1 × terminal deoxynucleotidyl transferase (TdT) buffer (Life Technologies, Gaithersburg, MD, U.S.A.) for 15 minutes. Sections then were reacted with TdT enzyme (375 U/mL buffer; Life Technologies) and biotinylated 16-dUTP (60 nmol/mL buffer; Boehringer Mannheim) in 1 × TdT buffer at 37°C for 60 minutes. Slides were washed with 2 × SSC (150 mol/L sodium chloride, 15 mol/L sodium citrate, pH 7.4) followed by 2% bovine serum albumin. Sections then were reacted with fluorescein-conjugated avidin D (1:200; Vector Laboratories, Burlingame, CA, U.S.A.) and coverslipped using Vectashield (Vector Laboratories). Specimens were viewed using fluoromicroscopy at excitation 495 nm (emission >515 nm) for fluorescein and 510–550 nm (emission > 580 nm) for Evans blue.
Alternate sections were stained for DNA fragmentation and nuclear condensation using Hoechst dye. Vibratome sections were incubated with 0.25 μg/mL Hoechst 33258 (Molecular Probes, Eugene, OR, U.S.A.) in 0.01 mol/L phosphate-buffered saline. Sections were rinsed in ddH2 O and mounted on slides with Vectashield. Specimens were viewed using fluoromicroscopy at excitation 355 nm (emission > 415 nm) for Hoechst 33258 and excitation 510 to 550 nm (emission > 580 nm) for Evans blue.
Quantification of intracellular Evans blue accumulation was performed by counting the regions of observed cellular Evans blue uptake using a 1 mm × 1 mm grid. Counts were performed for saline-and hemolysate-injected animals at 4 and 24 hours (n = 6 each group). Results were compared using an unpaired Student's t-test. Significance was defined as P < 0.05.
Gel electrophoresis
At 4 or 24 hours after hemolysate or saline injection, subjects (n = 6 each group) were anesthetized and killed by decapitation. Approximately 40 to 50 mg of caudate–putamen was dissected from the perihematomal region. DNA extraction and gel electrophoresis were performed as described previously (Matz et al., 2000). Briefly, samples were incubated in lysis buffer containing Proteinase K (Boehringer Mannheim) at 55°C for 20 hours. DNA was extracted with equal volumes of phenol and phenol-chloroform-isoamyl alcohol (25:24:1; Sigma) and precipitated in 0.2 mol/L sodium chloride in 100% ethanol at −80°C for 24 hours. DNA was resuspended in DNase-free H2 O (Sigma) and concentration was measured using To-Pro-1 dye (Molecular Probes).
Before electrophoresis, 1 μg DNA was incubated with 50 mg/L Dnase-free RNase (Boehringer Mannheim) and then was reacted with Klenow enzyme and dNTP in 1 × Klenow buffer (Trevigen, Gaithersburg, MD, U.S.A.). Samples were mixed with loading buffer and subjected to electrophoresis on a 1.5% agarose gel. DNA was transferred to a nylon membrane overnight in 10 × SSC and reacted with Strept-horseradish peroxidase conjugate (Trevigen) for 30 minutes. Bands were visualized by the chemiluminescence method using PeroxyGlow (Trevigen) followed by exposure to chemiluminescence film.
Cytochrome c and HSP70 immunocytochemistry
At 4 or 24 hours after hemolysate or saline injection, subjects (n = 6 for each group) were anesthetized and killed by transcardiac perfusion with heparinized 0.01 mol/L phosphate-buffered saline followed by 3.7% formaldehyde. After blocking endogenous peroxidase and nonspecific binding, vibratome sections (25 μm) were reacted with either a mouse monoclonal anti-cytochrome c antibody (1:500; Pharmingen, San Diego, CA, U.S.A.) or a mouse monoclonal anti-HSP70 antibody (1:4000; StressGen, Victoria, BC, Canada) for 48 hours at 4°C. The mouse monoclonal anti-cytochrome c antibody has been shown to detect cytosolic but not mitochondrial cytochrome c. This antibody is not able to penetrate consistently through the mitochondrial membrane; consequently, minimal immunostaining is observed in normal animals, and appearance of mitochondrial staining is distinctly different from cytosolic staining (Hortelano et al., 1999; Sugawara et al., 1999). Sections were reacted with biotin-conjugated horse anti-mouse IgG antibody (1:200; Vector Laboratories) and visualized using fluorescein-conjugated avidin D (1:200; Vector Laboratories). Specimens were viewed using fluoromicroscopy at excitation 495 nm (emission > 515 nm) for fluorescein and 510 to 550 nm (emission > 580 nm) for Evans blue.
Western blot analysis of cytochrome c and HSP70
Protein extraction of the mitochondrial and cytosolic fractions was performed as described previously (Sugawara et al., 1999). Animals were killed at 4 or 24 hours after hemolysate or saline injection (n = 6 for each group). Approximately 50 mg of caudate–putamen was removed from the perihematomal region. Tissue was homogenized in seven volumes of cold suspension buffer with protease inhibitors. Homogenates were centrifuged at 750 g at 4°C to remove debris.
For cytochrome c, subcellular fractions were obtained. Supernatants were centrifuged at 10,000 g at 4°C for 20 minutes. The 10,000 g pellets were resuspended and used as the mitochondrial fraction. Supernatants were further centrifuged at 100,000 g at 4°C for 1 hour to remove endoplasmic reticulum. The final cytosolic supernatants were then removed. Protein concentrations were determined for whole cell (HSP70) and subcellular fractions (cytochrome c) using the Bradford method (Bio-Rad, Hercules, CA, U.S.A.).
Proteins (10 μg of cytosolic fraction or 6 μg of mitochondrial fraction or 50 μg of whole cell fraction) were separated by sodium dodecyl sulfate-polyacrylamide gel electrophoresis on a 10% to 20% (cytochrome c) or 12% (HSP70) Tris-glycine gel (Novex, San Diego, CA, U.S.A.) and transferred to a polyvinylidene difluoride membrane (Novex). Western blots were performed using a mouse monoclonal antibody against cytochrome c (1:1000; Pharmingen) or a mouse monoclonal antibody against HSP70 (1:2000; StressGen). As a control for cytosolic or mitochondrial total protein, Western blot analysis of β-actin (1:1000; Amersham, Buckinghamshire, England, U.K.) or cytochrome oxidase (1:1000; Molecular Probes) was performed using mouse monoclonal antibodies with horseradish peroxidase-conjugated anti-mouse IgG reagents (Amersham).
Immunofluorescent double-labeling of neurons, microglia, and astrocytes
At 4 or 24 hours after injection of hemolysate and infusion of Evans blue (n = 6 each group), 25-μm vibratome sections were prepared after transcardiac perfusion-fixation. Sections were incubated with either a rabbit polyclonal anti-neurofilament antibody (1:500; Serotec, Oxfordshire, U.K.), a mouse monoclonal anti-OX42 antibody for microglia (1:4000; Serotec), or a goat polyclonal anti–glial fibrillary acidic protein (GFAP) antibody (1:500; Santa Cruz Biotechnology, Santa Cruz, CA) at 4°C for 24 hours. Sections were washed and incubated with biotinylated anti-rabbit (1:200; Vector), anti-mouse (1:200; Vector), or anti-goat antibodies (1:200; Santa Cruz Biotechnology), respectively. Sections then were incubated with either fluorescein-conjugated or 7-amino-4-methylcoumarin-3-acetic acid (AMCA)-conjugated avidin D (1:200; Vector). Specimens were viewed using fluoromicroscopy at excitation 355 nm (emission > 415 nm) for AMCA, 495 nm (emission > 515 nm) for fluorescein, and 510 to 550 nm (emission > 580 nm) for Evans blue.
In a separate group of animals, at 24 (n = 3) or 72 hours (n = 3) after injection of hemolysate, 25-μm vibratome sections were prepared after transcardiac perfusion-fixation. Sections were stained using either anti-OX42 antibody or anti-GFAP antibody. Sections were subsequently stained for DNA fragmentation using the nick end-labeling technique described above.
RESULTS
Evans blue extravasation
At 4 and 24 hours after saline injection, a small amount of interstitial Evans blue extravasation was evident immediately adjacent to the needle tract (Fig. 1A), and uptake occurred in scattered cells in this region (Fig. 1A). At 4 and 24 hours after hemolysate injection, interstitial Evans blue extravasation was pronounced in the perihematomal region throughout the ipsilateral hemisphere (Fig. 1B). Significant cellular uptake of Evans blue was evident in perihematomal cells at 4 hours and was more prominent at 24 hours (Fig. 1C and 1F). Cellular accumulation of Evans blue extended a great distance from the hematoma and encompassed the caudate-putamen and the overlying neocortex (Fig. 1B). Immunofluorescent double labeling revealed colocalization of neurofilament protein with Evans blue (Fig. 1C to 1E). Colocalization between OX42, a marker for activated microglia, and Evans blue also was evident (Fig.1F to 1H). Quantification of Evans blue accumulation revealed a significant (P < 0.01) increase in the total area (mm2) between saline-and hemolysate-injected animals at 4 (0.46 vs. 1.99) and 24 hours (0.48 vs. 3.51;Fig. 1I).
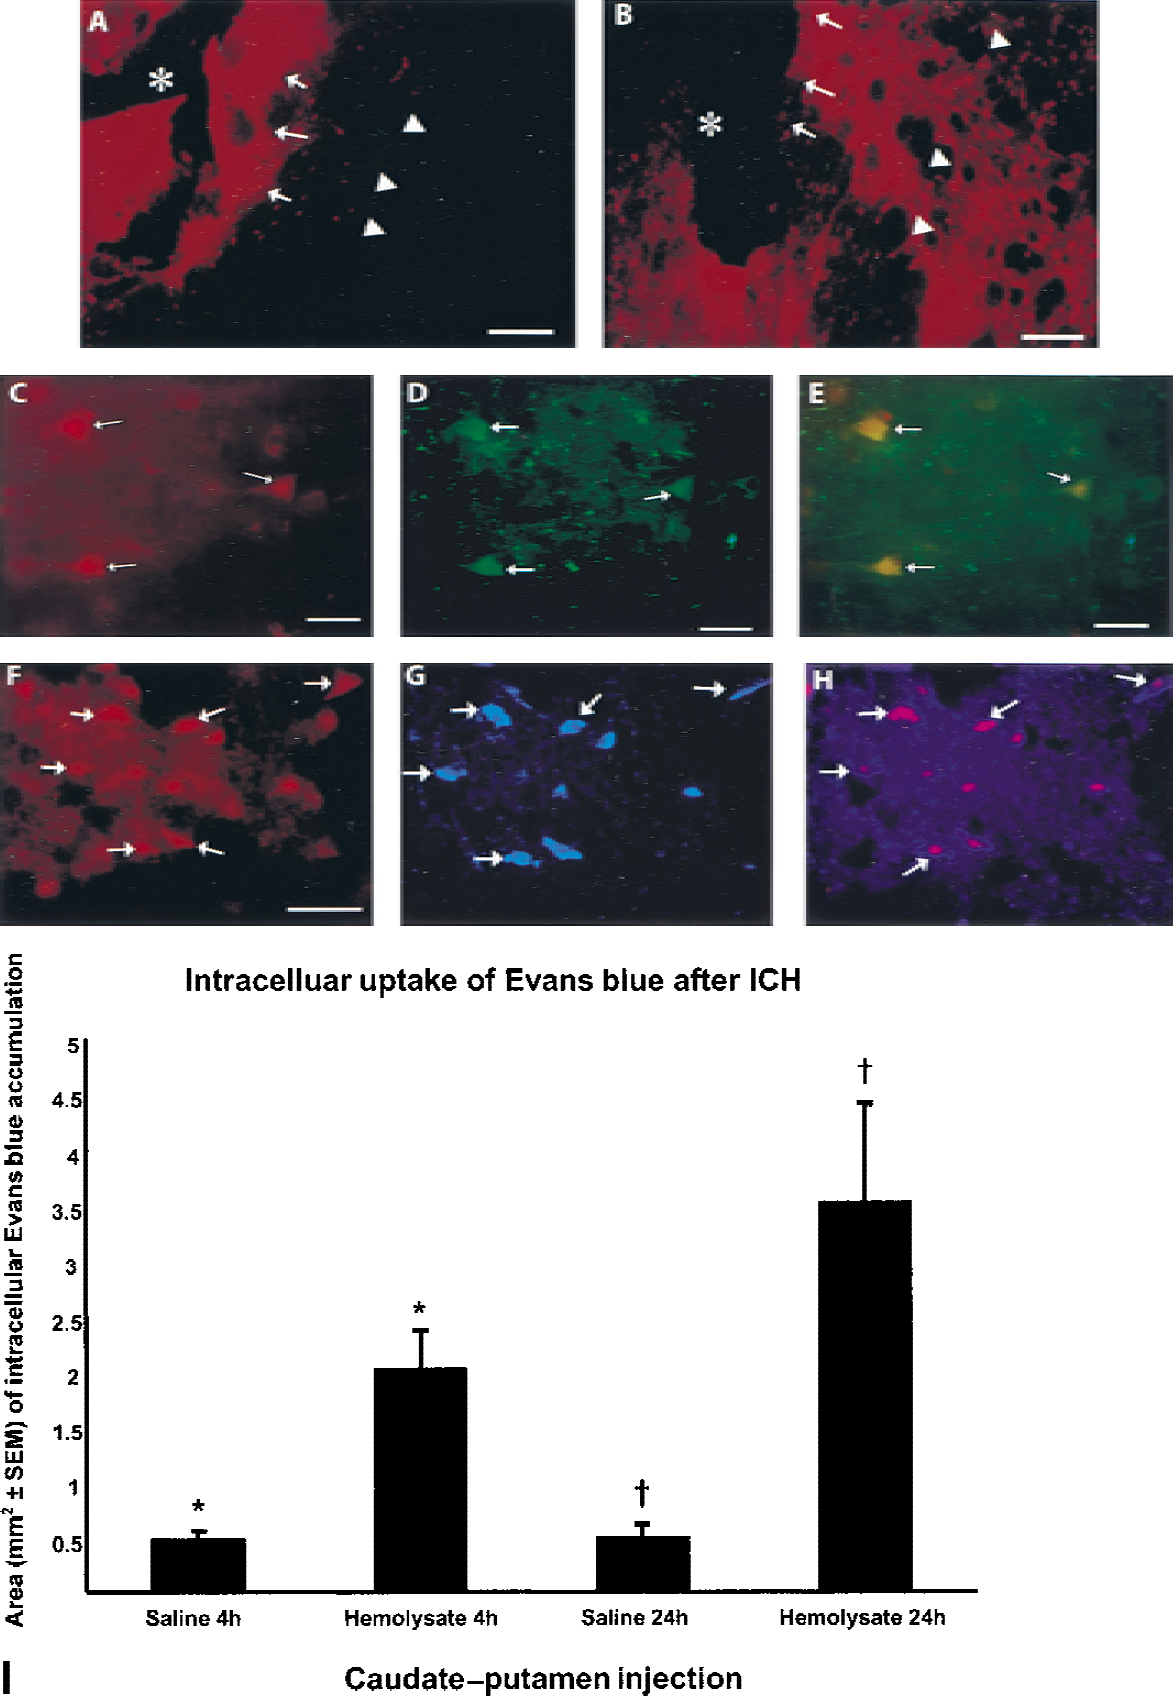
Fluorescent photomicrographs using fluorescein (green), Evans blue (red), or 7-amino-4-methylcoumarin-3-acetic acid (AMCA; blue) 24 hours after injection of saline
DNA fragmentation and nuclear damage in cells that sequester Evans blue
After saline injection at 4 and 24 hours, scattered cellular uptake of Evans blue was evident (Fig. 2A) and was occasionally TUNEL-positive (Fig. 2B and 2C). Nuclear morphology was essentially normal on Hoechst staining (Fig. 2H). Cellular accumulation of Evans blue after saline injection did not colocalize with nuclear condensation (Fig. 2G to 2I). At 4 hours after hemolysate injection, TUNEL labeling was evident in cells that sequestered Evans blue (Fig. 2D to 2F). Colocalization of DNA fragmentation and intracellular Evans blue was increased at 24 hours (not shown). At 4 (Fig. 2K) and 24 hours (not shown) after hemolysate injection, nuclear condensation, as evidenced by Hoechst staining, was evident in cells that sequestered Evans blue (Figs. 2J to 2L). Immunofluorescent labeling of microglia revealed that these cells, in contrast with neurons, did not undergo DNA fragmentation even at 72 hours (not shown). Morphologically, the microglia appeared to be viable through 72 hours. Extraction and gel electrophoresis of DNA from perihematomal regions did not demonstrate laddering after injection of saline (Fig. 3). At 4 hours after injection of hemolysate, DNA laddering was evident and became more intense at 24 hours (Fig. 3).
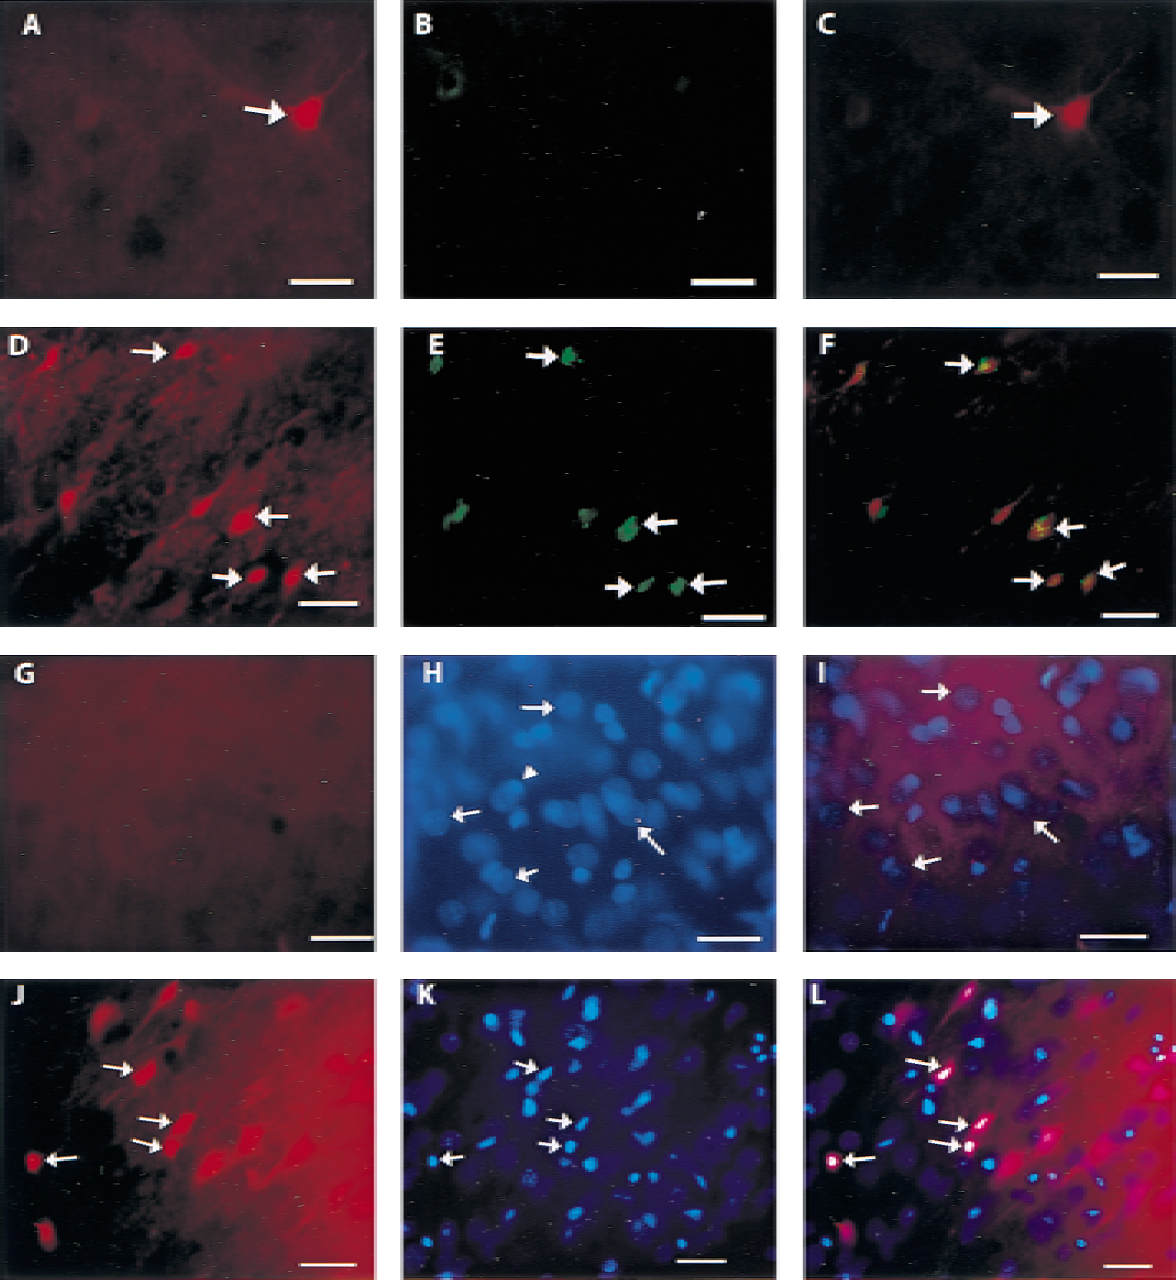
Fluorescent photomicrographs using fluorescein (green), Evans blue (red), or Hoechst dye (blue) 4 hours after injection of saline
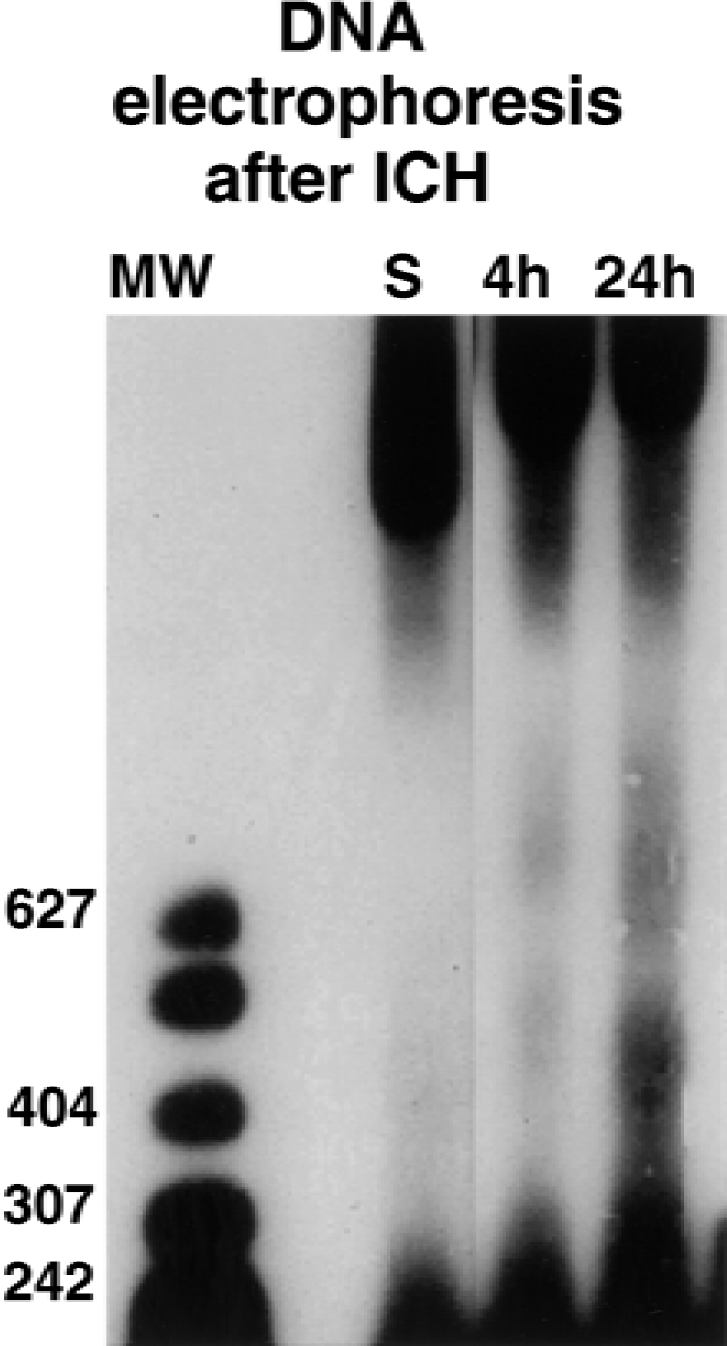
Gel electrophoresis 24 hours after injection of saline (lane S) or 4 (lane 4h) or 24 hours (lane 24h) after injection of hemolysate. After injection of saline, no DNA laddering was observed. DNA laddering was observed at 4 hours after injection of hemolysate and the overall intensity increased at 24 hours. ICH, intracerebral hemorrhage.
Cytochrome c release in neurons and astrocytes
After injection of saline at 4 (Fig. 4A to 4C) or 24 hours (not shown), no cytochrome c immunostaining was observed in perihematomal cells. This result is consistent with previous studies, which indicates that mitochondrial cytochrome c is not significantly immunoreactive (Hortelano et al., 1999; Sugawara et al., 1999). At 4 hours after hemolysate injection, increased cytochrome c immunoreactivity was evident in the cytosol (Fig. 4E). Some of these cytochrome c immunoreactive cells colocalized to cells that sequestered Evans blue (Fig. 4D to 4F). Other cytochrome c immunoreactive cells (not shown) did not show any Evans blue uptake. At 24 hours, cytochrome c immunoreactivity was evident only in glial cells surrounding areas of intracellular Evans blue (Fig. 4G to 4I). Immunofluorescent double labeling at 24 hours indicated that cytosolic cytochrome c immunoreactivity colocalized with GFAP indicating that these cells were astrocytes (Fig. 4J and 4K). Immunofluorescent labeling of astrocytes demonstrated that these cells did not undergo DNA fragmentation even at 72 hours. At 24 hours, reactive astrocytes were observed in the perihematomal region. At 72 hours, however, necrotic astrocytes were observed (Fig. 4L and 4M) in the perihematomal region.
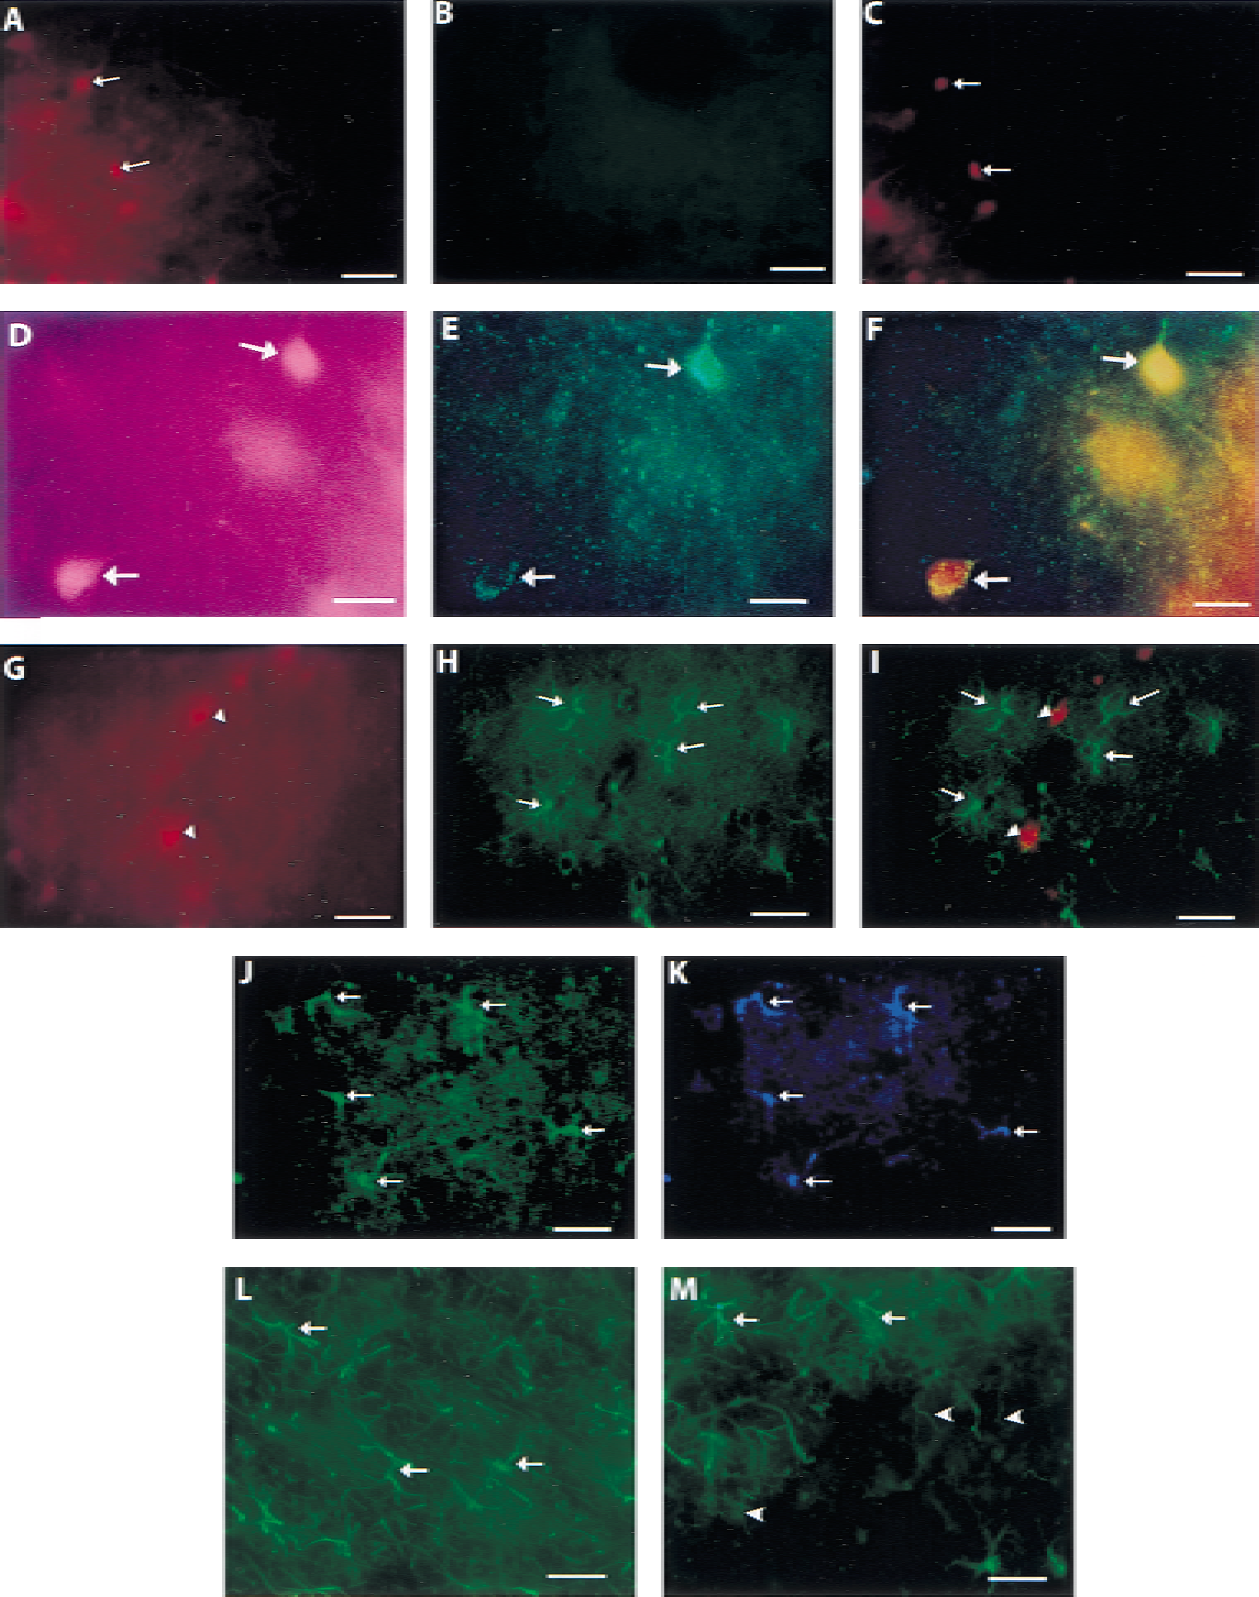
Fluorescent photomicrographs using fluorescein (green), Evans blue (red), or 7-amino-4-methylcoumarin-3-acetic acid (AMCA; blue) at 4
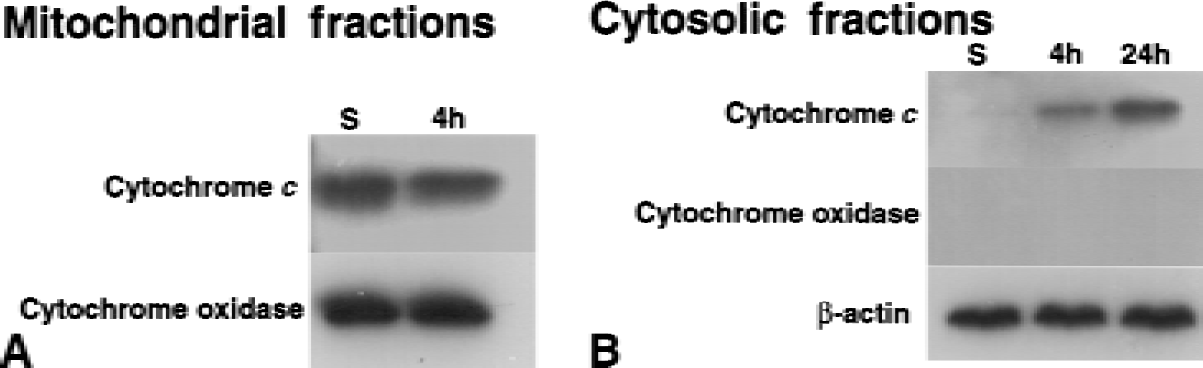
Western blots of mitochondrial fractions
Immunoblotting of perihematomal mitochondrial fractions at 4 and 24 hours indicated cytochrome oxidase and cytochrome c (15 kDa) bands whose densities were unchanged with injection of saline or hemolysate (Fig. 5A). Cytochrome oxidase was not evident in the cytosol on immunoblots at 4 and 24 hours after injection of saline or hemolysate (Fig. 5B). At 4 and 24 hours after injection of hemolysate, a 15 kDa cytochrome c band was present in the cytosol (Fig. 5B). No change in β-actin immunoblotting was evident between saline-and hemolysate-injected subjects (Fig. 5B).
HSP70 induction in perihematomal regions
No HSP70 was evident at 4 hours after injection of saline or hemolysate (not shown). At 24 hours after injection of saline, scant HSP70 induction was evident (Fig. 6A to 6C). At 24 hours after hemolysate injection, significant HSP70 immunoreactivity was present (Fig. 6E and 6F) in regions adjacent to areas of Evans blue uptake (Fig. 6D). HSP70 induction did not colocalize with cellular uptake of Evans blue (Fig. 6F) but was rather juxtaposed to these regions in areas more remote from the hematoma. Western blots of perihematomal regions confirmed the presence of HSP70 expression 24 hours after hemolysate injection as compared with the minimal expression after saline injection (Fig. 6G).
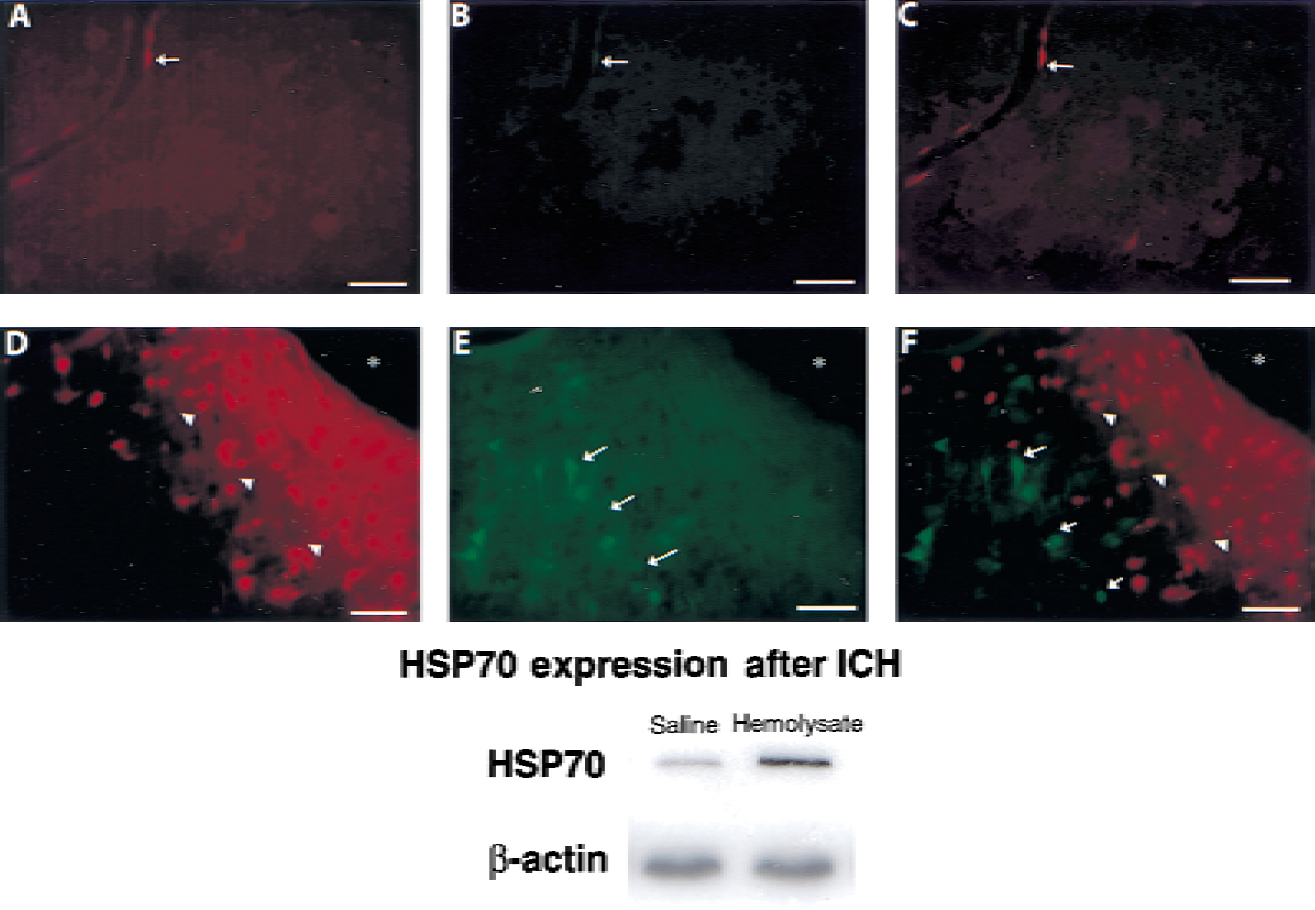
Fluorescent photomicrographs using fluorescein (green) or Evans blue (red) 24 hours after injection of saline
DISCUSSION
Intracerebral hemorrhage and accumulation of serum proteins
Vasogenic edema after a cerebral insult is a consequence of increased BBB permeability, which results in extravasation of serum components. In this setting, macromolecules have been described as accumulating in the cytoplasm of neurons (Loberg and Torvik, 1991). Accumulation of serum proteins has been described after lesions that generate oxidative stress and vasogenic edema (Loberg and Torvik, 1991; Murakami et al., 1998). Intracerebral hemolysate exposure has been linked to rapid development of vasogenic edema and oxidative stress (Matz et al., 1997; Xi et al., 1998). When hemoglobin or hemolysate was injected in the subarachnoid space of rats, hemoglobin uptake was observed in neurons and microglia, which metabolized this macromolecule (Turner et al., 1998). Intracerebral hemorrhage has itself been associated with recruitment and activation of microglia (Gong et al., 2000; Koeppen et al., 1995). In this study, perihematomal uptake of serum proteins into neurons could have been a consequence of edema, oxidative stress, and/or hemoglobin sequestration. The exact mechanism will be the basis for further studies.
Accumulation of serum proteins and DNA fragmentation
Previous studies have linked subarachnoid hemolysate to DNA fragmentation in neurons that accumulate intracellular iron (Matz et al., 2001). In this study, DNA fragmentation occurred as early as 4 hours and was observed in perihematomal areas of neuronal, but not microglial, accumulation of Evans blue. DNA fragmentation 4 hours after insult has been described in the brain after cold injury (Morita-Fujimura et al., 1999). Cold injury to the brain also has been associated with rapid accumulation of serum proteins (Loberg and Torvik, 1991). Thus, lesions that produce accumulation of serum proteins also are capable of producing DNA fragmentation. The findings in this study suggest that neuronal accumulation of extravasated serum proteins is a phenomenon associated with early cell death by DNA fragmentation. The exact mechanism by which sequestration of serum proteins is linked to DNA fragmentation will be investigated in future studies. However, in this study, it was associated with cytochrome c release.
Cytochrome c release and accumulation of serum proteins
Cytochrome c has been shown to play a key role in apoptosis. Injection of this protein into a cell-free system has initiated apoptosis (Liu et al., 1996). Once in the cytosol, cytochrome c activates caspase-9 whose cleavage is followed by activation of the downstream caspases and apoptosis (Slee et al., 1999). Oxidative stress in vivo has been shown to trigger cytochrome c release, which is often followed by DNA fragmentation and cell death (Matz et al., 2001; Morita-Fujimura et al., 1999; Sugawara et al., 1999). Release of cytochrome c into the cytosol after subarachnoid hemolysate exposure is exacerbated by increased mitochondrial oxidative stress (Matz et al., 2001). In the current study, cytochrome c release was observed in neurons at 4 hours, some of which had accumulated extravasated serum proteins. This result suggests that intracellular accumulation of serum proteins after intracerebral hemolysate exposure is an early sign of oxidative stress, possible mitochondrial, which is often followed by cytochrome c release and DNA fragmentation.
At 24 hours, cytochrome c release was present in astrocytes within regions of neuronal Evans blue accumulation. However, the astrocytes themselves did not accumulate Evans blue and did not demonstrate DNA fragmentation at 24 hours. Recently, significant expression of the CD95 (Fas/Apo-1) receptor has been described in vitro on the surface of mature astrocytes (Saas et al., 1999). These same astrocytes were shown to have the capability to undergo apoptosis. Direct intracellular induction of the caspase cascade has been linked to release of cytochrome c from the mitochondria (Kuwana et al., 1998). It is possible that hemolysate exposure may be predisposed to CD95-mediated activation of the caspase cascade in astrocytes. Activation of the caspase cascade would then promote cytochrome c release. Cytochrome c release at 24 hours in astrocytes has been associated with DNA fragmentation at 5 days after global ischemia (Sugawara et al., 1999). In this study, cytochrome c release in astrocytes at 24 hours was not followed by DNA fragmentation at 72 hours. However, necrosis of astrocytes was observed at this time point.
HSP70 induction in regions adjacent to serum protein accumulation
Induction of the stress protein HSP70 has been described after intracerebral injection of either whole blood or hemolysate. However, hemolysate was associated with a more significant induction of this protein (Matz et al., 1997). When compared with whole blood, hemolysate also was associated with a greater and more rapid generation of brain edema (Xi et al., 1998). Progressive breakdown of the BBB has been linked to increased HSP70 expression after fluid percussion brain injury (Tanno et al., 1993). In contrast with DNA fragmentation, expression of the HSP70 stress protein has been thought to indicate sublethal injury (States et al., 1996). In this study, HSP70 induction did not colocalize with intracellular Evans blue. Areas of HSP70 induction were adjacent to regions of intracellular serum protein accumulation. In this setting, HSP70 induction may have been a result of BBB breakdown, oxidative stress, or a combination thereof. This regional distribution of HSP70 induction suggested the formation of a “penumbra” of injured, but viable, cells in areas more remote from the hematoma than the nonviable cells that accumulated Evans blue.
Conclusion
Intracerebral hemolysate exposure in rats is associated with intracellular accumulation of extravasated serum proteins at 4 hours that extends through 24 hours. Cellular accumulation of extravasated serum proteins is linked to cytochrome c release and DNA fragmentation in neurons but not in astrocytes or microglia. HSP70 induction occurs in areas adjacent to these nonviable cells suggesting the formation of a “penumbra” of injured, but viable, cells.