
Abstract
To evaluate a new simplified bolus method for measurement of cerebral perfusion and metabolism, the parametric images with that method were compared with those obtained from the conventional steady-state method with 15O-gas. The new method also provided images of arterial blood volume (V0), which is a different parameter from cerebral blood volume (CBV) obtained using a C15O technique. Seven healthy volunteers and 10 patients with occlusive cerebrovascular diseases underwent positron emission tomography (PET) scans with both methods. Three-weighted integration was applied to calculate regional cerebral blood flow (rCBF) and regional cerebral metabolic rate of oxygen (rCMRO2) in the bolus method. Global and regional CBF and CMRO2 in volunteers were compared between the two methods and used as control data. Regional values in patients also were evaluated to observe differences between the bilateral hemispheres. Both rCBF and rCMRO2 were linearly well correlated between the two methods, although global difference in CMRO2 was significant. The difference in each parametric image except for V0 was significant between the bilateral hemispheres in patients. The bolus method can simplify oxygen metabolism studies and yield parametric images comparable with those with the steady-state method, and can allow for evaluation of V0 simultaneously. Increase in CBV without a change in V0 suggested the increase might mainly be caused by venous dilatation in the ischemic regions.
Keywords
Measurements of cerebral perfusion, oxygen metabolism, and blood volume provide important hemodynamic information for diagnoses of cerebrovascular diseases, especially in cases of misery perfusion (Baron et al., 1981; Gibbs et al., 1984). Cerebral blood flow (CBF) is reduced in the ischemic part of the brain and cerebral blood volume (CBV) increased to compensate for reduced cerebral perfusion pressure (Gibbs et al., 1984; Powers et al., 1984; Powers and Raichle, 1985). Positron emission tomography (PET) studies with 15O-gas have been performed for those patients to assess indications for neurosurgical treatment. The steady-state method in PET, a common method for the measurement of cerebral hemodynamics, needs a long scanning time; therefore, it is difficult to perform repeat measurements for one subject during a single examination because the method needs three scans to calculate parametric images—that is, 15O-labeled molecular oxygen (15O2), carbon dioxide (C15O2), and carbon monoxide (C15O) (Frackowiak et al., 1980; Lammertsma and Jones, 1983). Mintun et al. (1984) developed a simplified method with bolus inhalation of 15O2 to measure cerebral metabolic rate of oxygen (CMRO2) that enabled a shorter scan time and repeated measurement of cerebral oxygen consumption. However, the method still needed three scans to calculate oxygen metabolism. A new approach (the “one-step method”) to the quantitative measurement of CMRO2 was reported by Ohta et al. (1992) applying a two-compartment model and the three-weighted integration (3-WI) for calculation. The advantage of this method was that CMRO2 was calculated from a single scan after bolus inhalation of 15O2, which simplified many steps and enabled repeated measurement of CMRO2 even in PET activation studies (Vafaee et al., 1999). Combining the two bolus methods with H215O and 15O2, called a new bolus method in the current study, was expected to provide comparable hemodynamic parameters to the conventional methods, with a simplified method and a shorter scan time. Furthermore, the method simultaneously provided arterial blood volume (V0) images, which were expected to be a new parameter to evaluate hemodynamics in the brain. V0 values obtained from the two compartment analysis in the bolus 15O-water method are considered to represent arterial to capillary blood volume in the brain (Iida et al., 2000; Okazawa and Vafaee, 2001). Although V0 images are calculated from both bolus methods for CBF and CMRO2, the authors defined the V0 from H215O studies as the arterial blood volume because V0 from 15O2 scans is considered to include venous part of blood volume (Ohta et al., 1996). The purpose of the current study was to quantitatively evaluate parametric images (CBF and CMRO2) in the bolus method of Ohta et al. (1992, 1996) in comparison with the values measured by the conventional steady-state method, and to compare regional V0 values with CBV obtained from the C15O inhalation method.
Another purpose of this study was to evaluate V0 values in patients with cerebrovascular diseases. In patients with ischemic strokes and steno-occlusive changes in the major arteries, regional CBV values in the ischemic hemisphere are considered to increase by vasodilatation to compensate for the reduction in cerebral perfusion pressure (Gibbs et al., 1984; Powers et al., 1984). However, an increase in CBV observed in PET studies that is considered to represent dilatation of peripheral arteries and capillaries for regulation of perfusion pressure has not been proved. Because the new bolus method is able to calculate V0 along with the calculation of regional CBF (rCBF) (Ohta et al., 1996), it would enable evaluation of changes in arterial blood volume between the bilateral hemispheres in patients. V0 from the bolus 15O2-PET was not used for evaluation in the current study because the CBV measured with C15O represents whole blood volume in the brain.
MATERIALS AND METHODS
Subjects
Seven healthy normal volunteers (4 males and 3 females), aged 37 to 55 years (mean = 46.4 ± 6.6), were recruited for the PET study as normal controls. Ten patients aged 51 to 74 (mean = 64.2 ± 8.7) with unilateral occlusive cerebrovascular diseases also were studied to examine cerebral perfusion and oxygen consumption. The clinical information for the studied patients is summarized in Table 1. This study was approved by the Ethical Committee of the Shiga Medical Center. Written informed consent was obtained from each subject before the study.
Clinical information for patients with occlusive cerebrovascular diseases
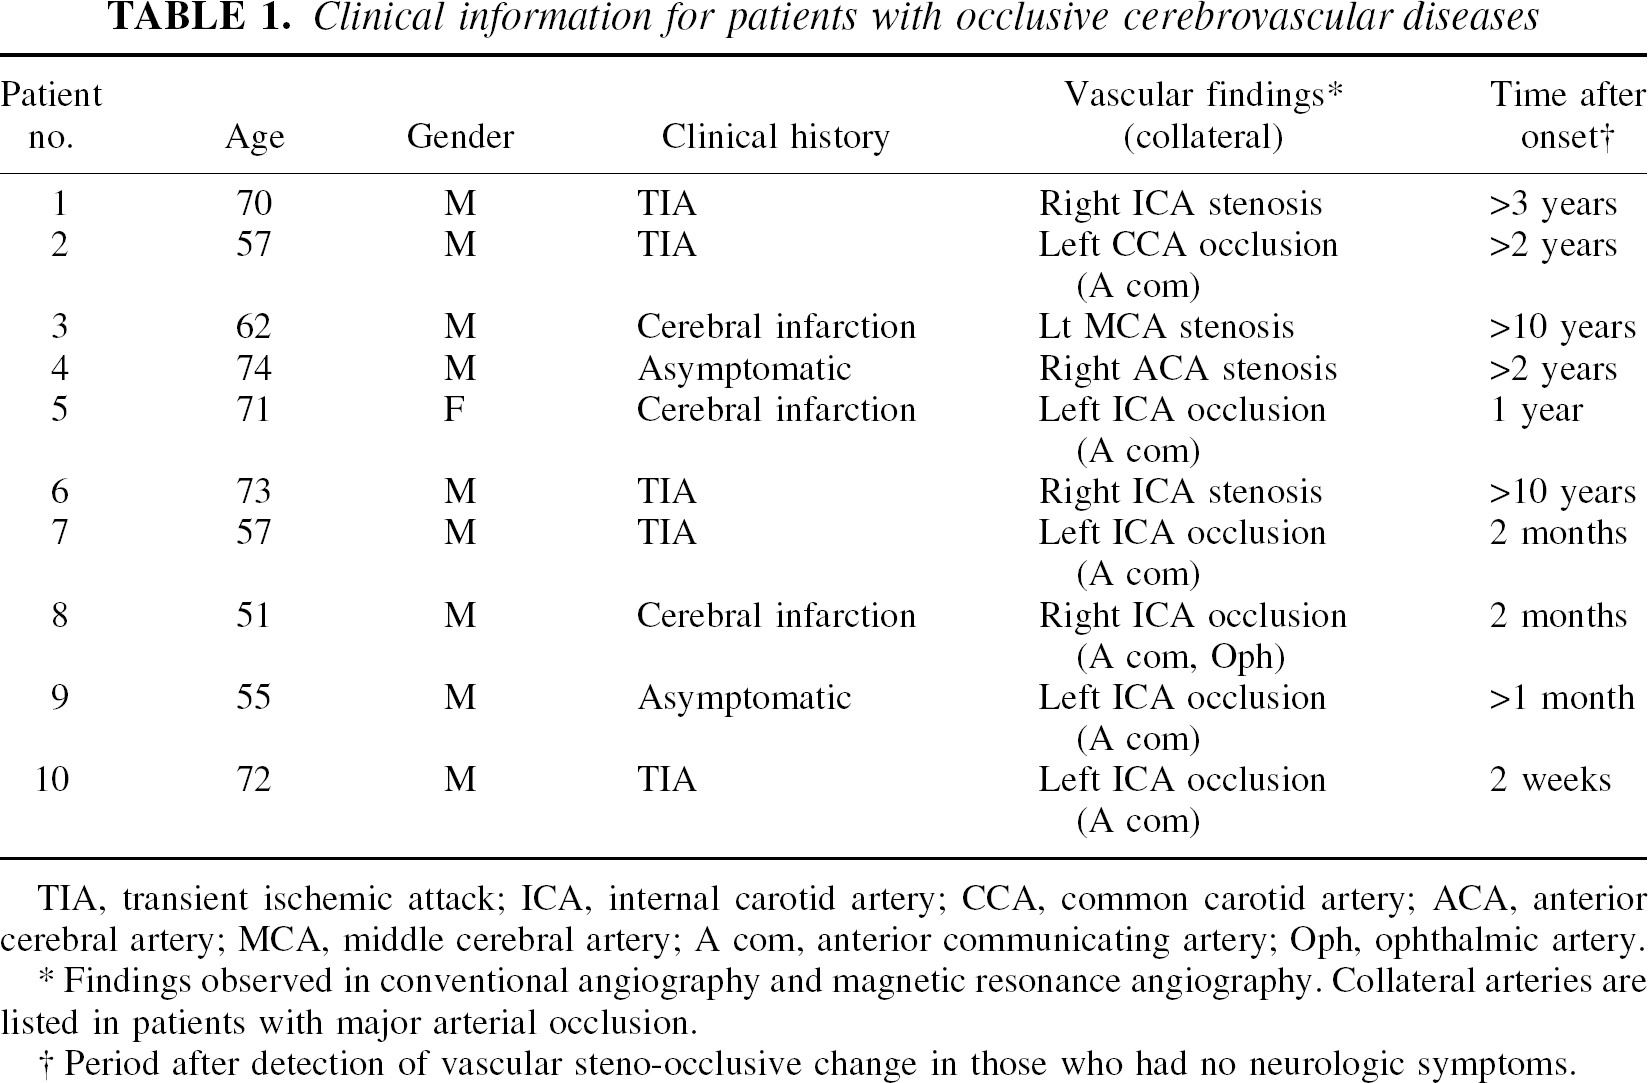
TIA, transient ischemic attack; ICA, internal carotid artery; CCA, common carotid artery; ACA, anterior cerebral artery; MCA, middle cerebral artery; A com, anterior communicating artery; Oph, ophthalmic artery.
Findings observed in conventional angiography and magnetic resonance angiography. Collateral arteries are listed in patients with major arterial occlusion.
Period after detection of vascular steno-occlusive change in those who had no neurologic symptoms.
Positron emission tomography procedures
All the subjects underwent PET scans with a whole-body tomography scanner (ADVANCE; General Electric Medical System, Milwaukee, WI, U.S.A.), which permits simultaneous acquisition of 35 image slices in a two-or three-dimensional acquisition mode with interslice spacing of 4.25 mm (DeGrado et al., 1994). Performance tests showed the intrinsic resolution of the scanner to be 4.6 to 5.7 mm in the transaxial direction and 4.0 to 5.3 mm in the axial direction. A transmission scan was performed using 68Ga /68Ga for attenuation correction in each subject before the tracer administration. In reconstruction of PET data, images were blurred to 6.0 mm full width at half maximum in the transaxial direction using a Hanning filter.
Subjects were positioned on the scanner bed with their heads immobilized using a head holder. A small cannula was placed in the left brachial artery for blood sampling. Positron emission tomography scans for bolus and steady-state methods were performed along the time course described in Fig. 1. After intravenous bolus injection of 555 MBq of H215O into the right antecubital vein, a 3-minute dynamic PET scan was started at the time of the tracer administration with frame durations of 5 seconds × 12, 10 seconds × 6, and 20 seconds × 3 using the three-dimensional mode. In the oxygen bolus inhalation method, the same procedure of dynamic PET acquisition was started at the time of bolus inhalation of 15O2, at an amount up to 1800 MBq. Arterial blood was drawn manually every 5 seconds for the first minute and then at progressively increasing intervals during the dynamic PET scans, with a total of 20 blood samples. Decay of radioactivity from PET and blood data was corrected to the starting point of each scan.
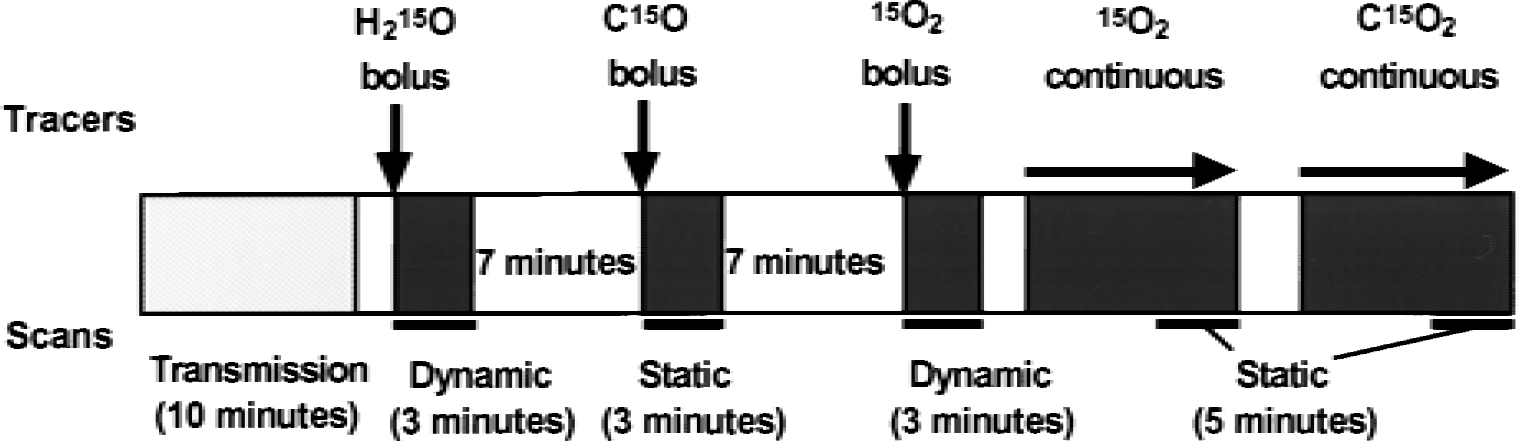
Protocol used in the current study. Each bolus scan takes 10 minutes including the scan interval, whereas the steady-state method requires more than 15 minutes to achieve and maintain equilibrium during the 5-minute scanning.
In the steady-state method (Frackowiak et al., 1980; Lammertsma et al., 1983), C15O2 and 15O2 were inhaled continuously. After exposure of subjects to radioactive gas for approximately 10 minutes, static scans were started and continued for 5 minutes using the two-dimensional mode. Each subject also inhaled C15O as a single dose of 1200 MBq to obtain the CBV image before the steady-state procedure (Fig. 1). The scan was started after at least 30 seconds from the arrival of the peak count of C15O in the brain and continued for 3 minutes. Arterial blood was sampled two or three times during each procedure of the 15O-gas study. The radioactivity in the blood samples thus obtained was immediately measured with a scintillation counter to determine arterial blood activity. During continuous inhalation of 15O2 in the steady-state method, the sampled blood was divided into two aliquots to count the radioactivity of whole blood and plasma.
Calculation of regional cerebral blood flow and metabolic images
In the bolus method, CBF and CMRO2 (mL min−1 100 g−1) images were calculated from the dynamic PET data and arterial blood curves by means of the 3-WI method based on a two-compartment model expressed by the following equation:

where K1 (mL min−1 g−1) and k2 (per minute) are rate constants for tracers, M (Bq/g) is radioactivity in the brain tissue, and Ca (Bq/mL) is an arterial input function. The calculation procedure for the 3-WI method has been described in detail elsewhere (Ohta et al., 1992, 1996; Okazawa and Vafaee, 2001). A time constant, τ = 4 seconds, was used for internal dispersion correction (Ohta et al., 1996; Meyer, 1989; Iida et al., 1986), and the time delay of arterial input was corrected automatically in the program using a slope method, in which the arterial input function with dispersion correction and the time-radioactivity curve obtained from dynamic PET data were fitted to estimate an appropriate delay time for each slice level (Meyer, 1989).
In the steady-state method, CBF, oxygen extraction fraction (OEF) and CMRO2 were calculated according to the method established by Frackowiac et al. (1980; Lammertsma and Jones, 1983; Lammertsma et al., 1983). A partition coefficient of 0.9 was used in the steady-state method to calculate rCBF (Herscovitch and Raichle, 1985). A cerebral-to-large vessel hematocrit ratio of 0.85 was used in the calculation of rCBV (Phelps et al., 1979; Okazwa et al., 1996). The individual CBV image was used to correct the OEF image before generating the CMRO2 image (Lammertsma and Jones, 1983; Lammertsma et al., 1983). O2 content in the arterial blood was measured in each 15O2 scanning to convert the influx rate constant (K1 = CBF × OEF) into CMRO2. Global values for each parametric image in controls were determined using a template generated from the averaged MRI in Talairach space, and voxel values thus obtained after image transformation were averaged among all voxels inside of the template (Okazawa and Diksic, 1998). In the template, large vessels were excluded.
Coregistration of positron emission tomography and magnetic resonance imaging
Controls underwent a high-resolution MRI scan (124 slices, 1.3-mm-thick) obtained with a Signa Holizon LX scanner (1.5T; General Electric Medical System). Coregistration of individual PET and MRI images was performed using an automatic procedure (Woods et al., 1993) that uses the CBF image generated by the steady-state method. Magnetic resonance images of each subject were transformed into Talairach space automatically (Collins et al., 1994; Talairach and Tournoux, 1988). Positron emission tomography images coregistered to MRI then were transformed into Talairach space using the individual spatial transformation parameter that combined two parameters from coregistration of PET to MRI and transformation of MRI to the Talairach space (Okazawa and Diksic, 1998). The parametric images for each subject were located in a same position because of a head holder; however, if subject moved during intervals of PET scans, PET images were shifted into the same location to the CBF image that was used for the PET-MRI coregistration. The CBV in the 15O-gas study and V0 images obtained from the 3-WI method also were transformed into Talairach space in accordance with the same individual parameter.
Statistical data analysis
Global values from each parametric image in controls were compared between the bolus and steady-state methods. A two-tailed t-test was used for comparison of the global values between the two methods. To compare the regional values in the images from controls, small circles (5 mm in diameter) for regions of interest (n = 495) were drawn on the major cortices and basal ganglia after transformation into the Talairach space. The same regions of interest were applied to all parametric images of controls (Okazawa and Diksic, 1998). Values were obtained in units of mL min−1 100 g−1 for rCBF and regional CMRO2 (rCMRO2) images, and in units of mL 100 g−1 for regional CBV (rCBV) and V0 images. The regional values thus obtained from the two methods were compared and the correlation between them was examined using linear regression. Two images of rCMRO2 generated from the different methods were analyzed with SPM 96 (Friston et al., 1990, 1991). Details for the SPM comparison of the two images are described elsewhere (Okazawa and Vafaee, 2001). In the SPM analysis, each rCMRO2 image was smoothed using a Gaussian filter (14 mm full width at half maximum) and the global mean was normalized to 3.0 mL min−1 100 g−1, which was expected for the mean value of controls. Analysis of covariance was applied for the normalization (Friston et al., 1990). To identify the regions showing significant differences, the height threshold (u) was set at P = 0.001, and the extent threshold (k) was set at P = 0.05.
In the patients' results, rCMRO2 values from the bolus method were corrected with the equation of linear regression obtained from controls, because the global values of CMRO2 were significantly different between the two methods (see Results). Regions of interest were drawn on the bilateral hemispheres at the level of the centrum semiovale in several slices, including large areas of the cerebral cortex and subcortex, by referring CBF images (Okazawa et al., 1996). The same regions of interest were applied to all parametric images in each subject. Regional values in each parametric image from patient data were evaluated to observe differences in the bilateral hemispheres. V0 images obtained from 15O-water studies were used for comparison of the arterial blood volume. Differences between the bilateral hemispheres were compared statistically in each parametric image using a paired t-test. P < 0.05 was considered to indicate a statistically significant difference. In comparing hemisphere values between patients and normal controls, analysis of variance was used with a post hoc test.
RESULTS
Figure 2 shows parametric images obtained from seven controls using the two methods, and corresponding slice levels of MRI in which PET and MRI images were transformed into the Talairach space and averaged among the seven subjects. Contrast of rCBF and rCMRO2 was expressed better in the steady-state method than in the bolus method. In the rCMRO2 image, the sagittal sinus was expressed as high values in the bolus method as compared with the steady-state method. Global values of each parametric image in controls are presented in Table 2. Global CBF and OEF did not show significant difference between the two methods, whereas the global CMRO2 was significantly greater in the bolus method than in the steady-state method. Global V0 values obtained from the two bolus procedures (H215O and 15O2) showed no significant difference, although the images obtained from the bolus 15O2 method showed greater values in sinuses compared with images in the H215O method.
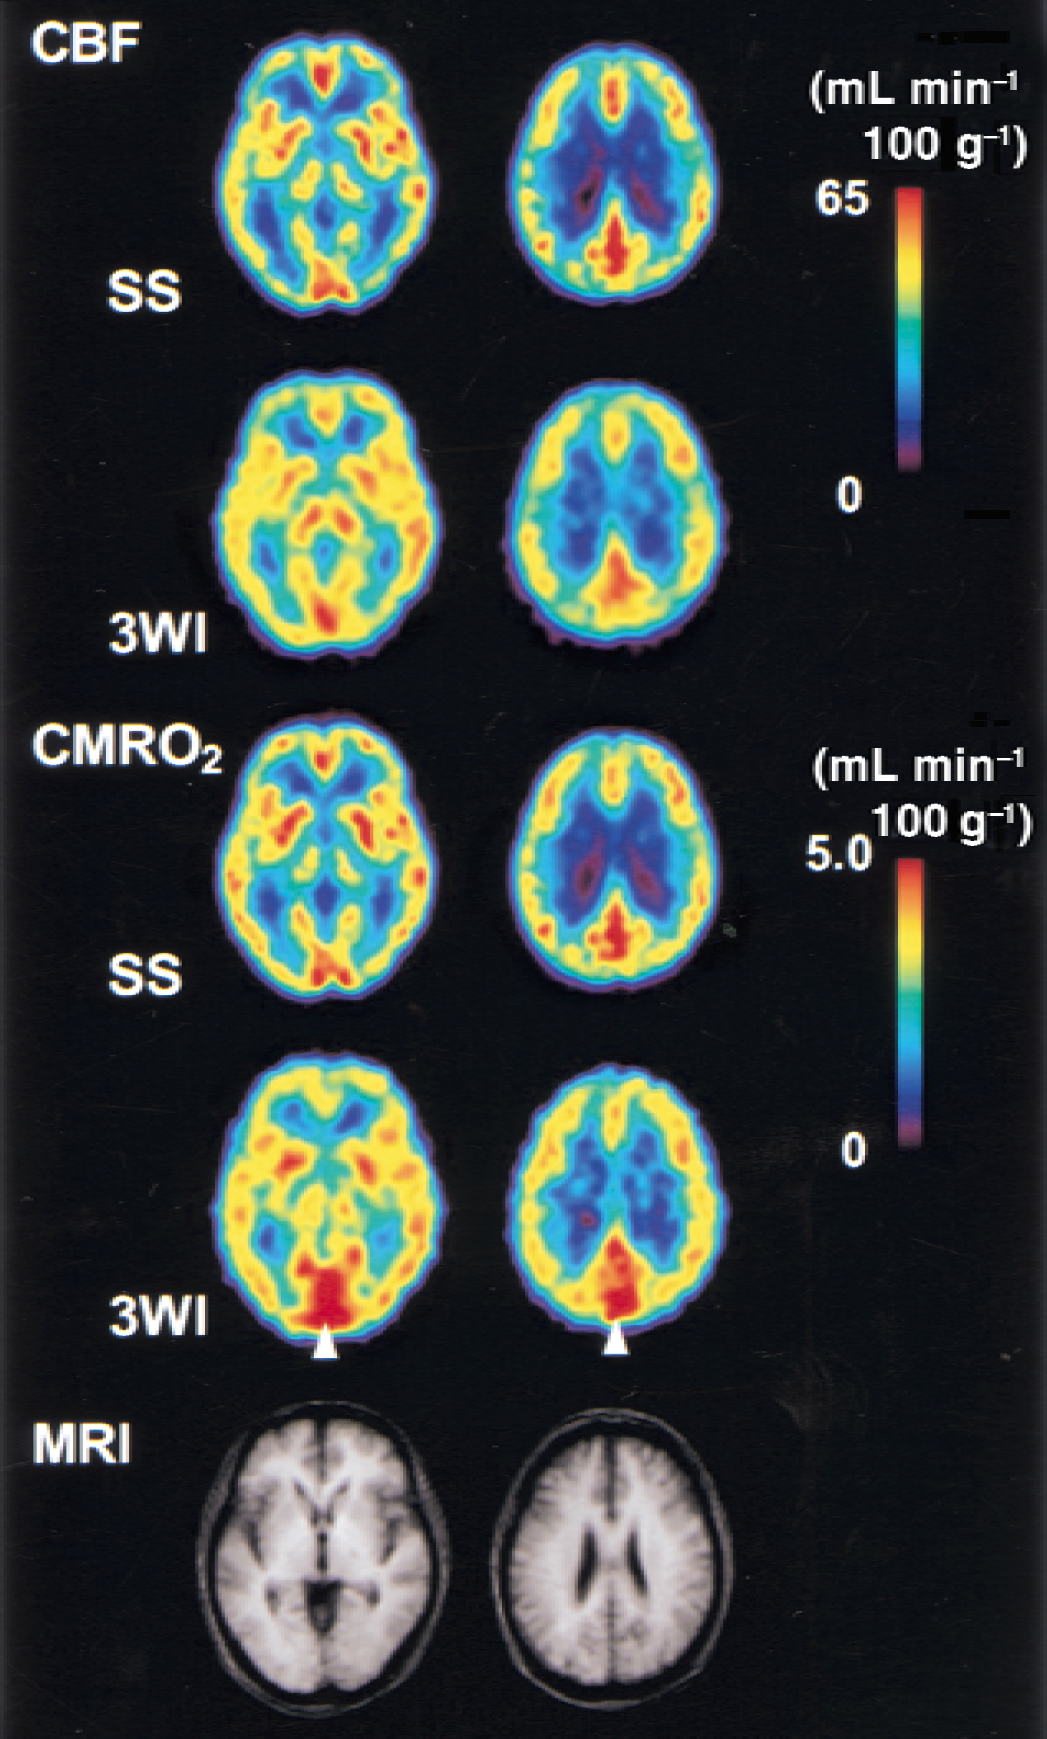
Average images obtained from seven controls. The first two rows and the following two rows are cerebral blood flow (CBF) and cerebral metabolic rate of oxygen (CMRO2) images obtained from the steady-state (SS) and bolus (3WI) methods, respectively. The same slice level of each image is in the same column. Note the sagittal sinus was expressed to be high values in the 3-WI method as compared with the SS method (arrowhead). The bottom row shows the corresponding magnetic resonance imaging (MRI) averaged from the same controls. Images were transformed into the Talairach space and averaged. 3-WI, 3-weighted integration in the bolus method.
Global values in seven normal volunteers measured by steady-state (Gas_SS) and bolus (3-WI) methods
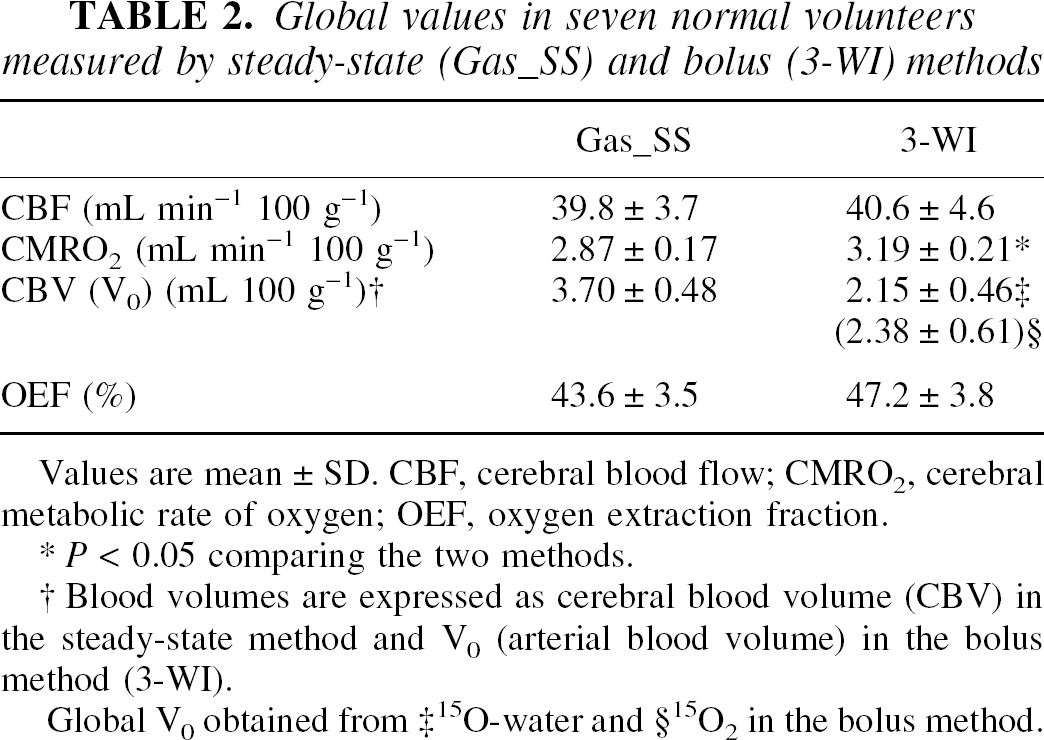
Values are mean ± SD. CBF, cerebral blood flow; CMRO2, cerebral metabolic rate of oxygen; OEF, oxygen extraction fraction.
P < 0.05 comparing the two methods.
Blood volumes are expressed as cerebral blood volume (CBV) in the steady-state method and V0 (arterial blood volume) in the bolus method (3-WI).
Global V0 obtained from ‡ 15O-water and §15O2 in the bolus method.
Figure 3 shows the correlation of regional values of rCBF and rCMRO2 compared between the two methods. In both images, regional values were linearly well correlated, although rCMRO2 in the bolus method showed overestimation compared with the steady-state method. SPM analysis with CMRO2 images showed regional differences between the two methods (Fig. 4). Major veins and sinuses were expressed to be significantly greater in the bolus 15O2 method than in the steady-state method, whereas the opposite comparison showed no significant differences.
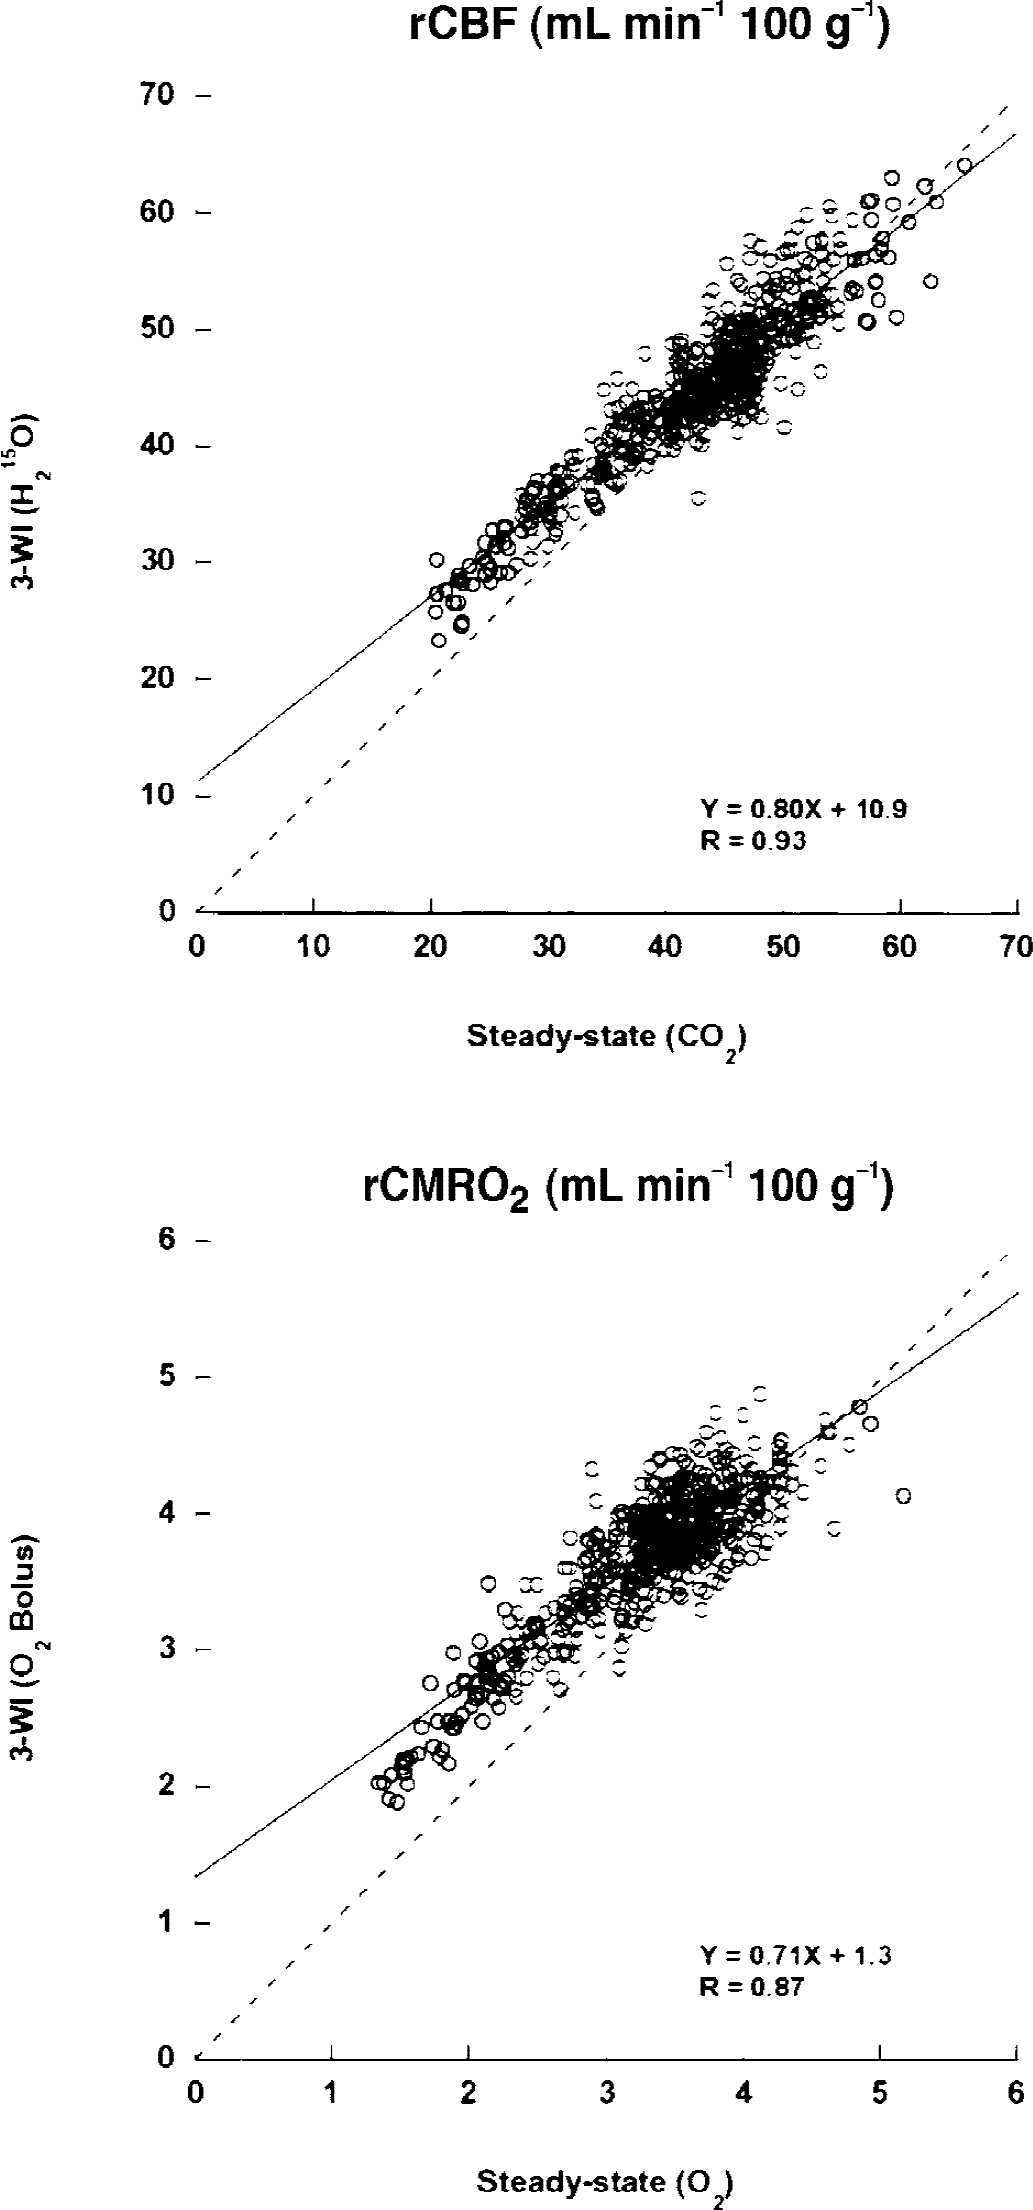
Correlation between the two methods (steady-state and bolus (3-WI) methods) in regional cerebral blood flow (rCBF) and regional cerebral metabolic rate of oxygen (rCMRO2) obtained from seven controls. Regional values were linearly well correlated between the two methods (n = 495). Each image was transformed into the Talairach space using magnetic resonance imaging for each subject and averaged before drawing regions of interest in the Talairach space. Dashed line is a line of identity.
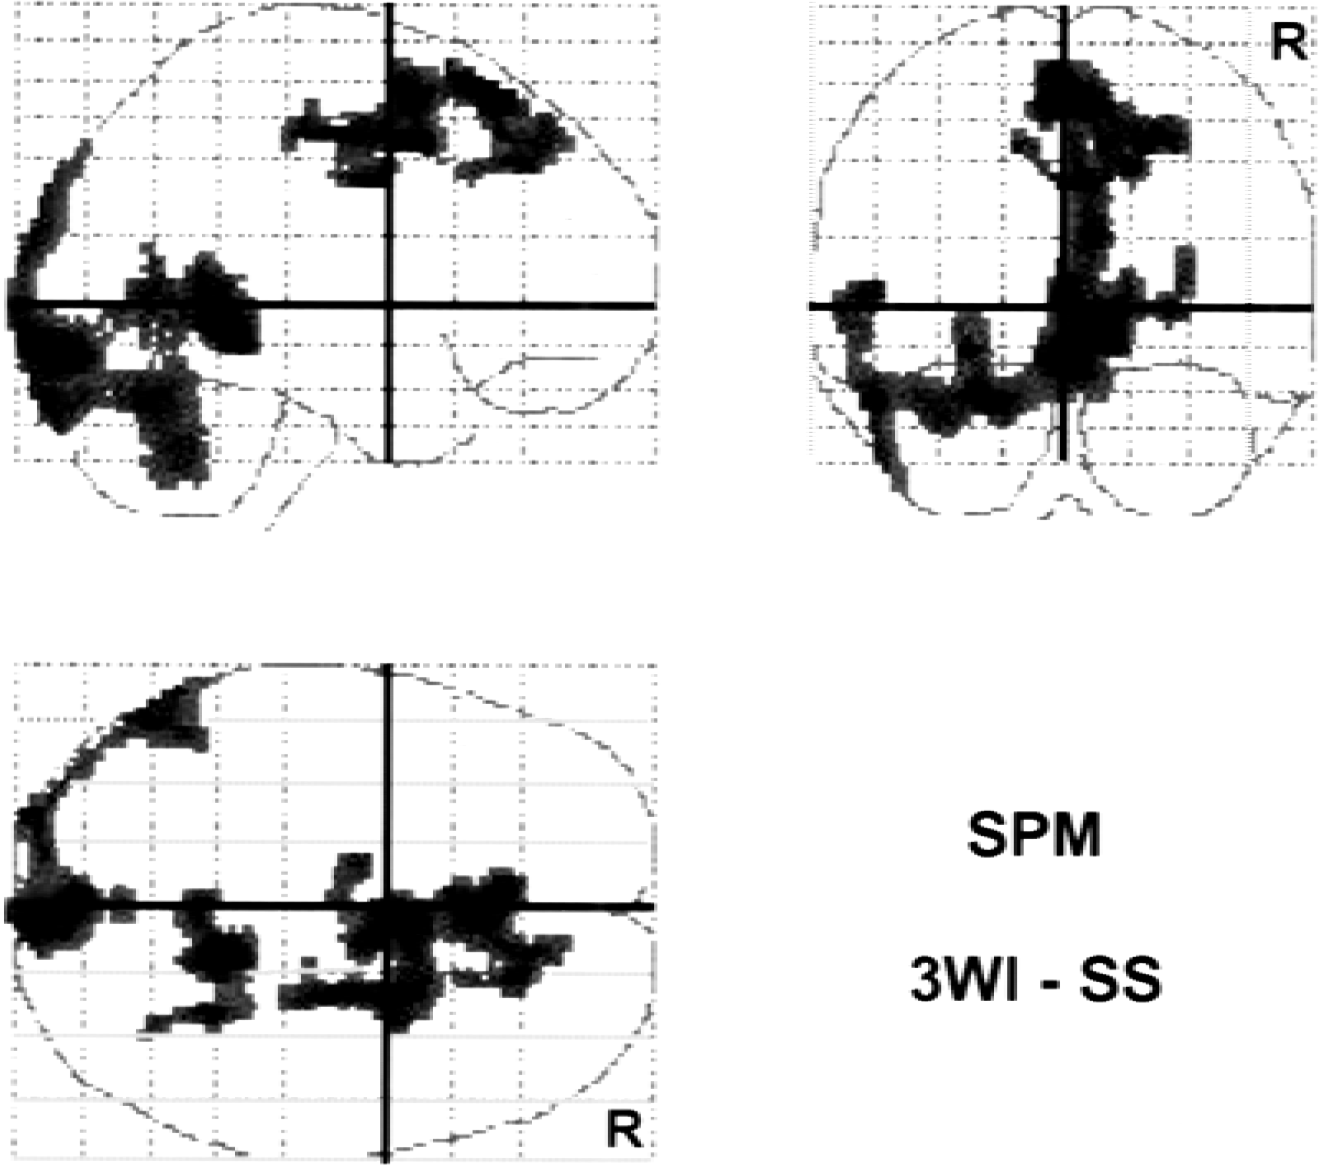
SPM results comparing regional cerebral metabolic rate of oxygen (rCMRO2) obtained by bolus inhalation of 15O2 with the 3-WI method and from the steady-state method in seven controls. The major veins and sinuses were expressed as significantly different areas between the two methods. The comparison expresses areas where the CMRO2 value of the bolus method is greater than that of the steady-state method. However, no significant difference was observed with the opposite subtraction. R indicates the right side of the brain.
Average images of CBV from C15O scans and V0 from H215O scans in seven controls are presented in Fig. 5A and 5B. Both arteries and veins were expressed in the CBV image, whereas only arteries were expressed in the V0 image. In subtraction of CBV minus V0 images, major veins and sinuses were described as the difference between the images from the two methods (Fig. 5C).
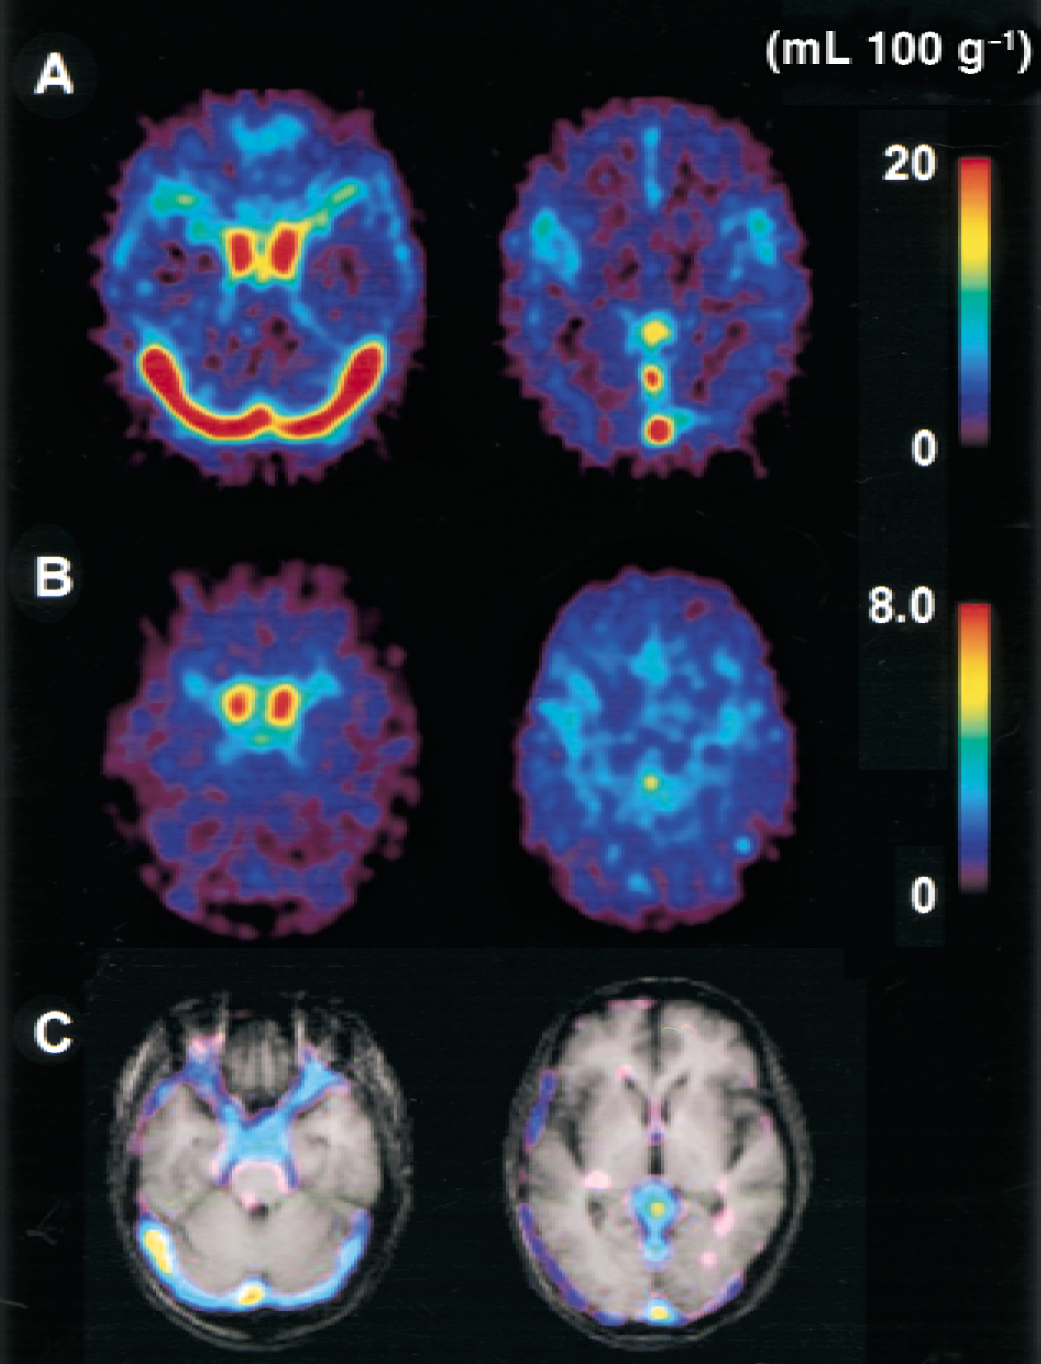
Average images of cerebral blood volume (CBV)
Figure 6 shows hemispheric differences in patients with occlusive cerebrovascular diseases. Images obtained by the steady-state method showed reductions in rCBF and rCMRO2 and increases in OEF and CBV in the ischemic territory distal to the steno-occlusive change in the major arteries. The bolus method also provided similar results for CBF, CMRO2, and OEF; however, V0 did not show a significant difference between hemispheres. Mean values of rCBV and V0 in patients were 3.96 ± 0.87 and 2.44 ± 0.52 in the ischemic territory, and 3.64 ± 0.65 and 2.58 ± 0.54 in the contralateral hemisphere; none of these values (rCBV and V0) was significantly different from the values in healthy controls. Regional CBF in both the hemisphere and rCMRO2 in the ipsilateral hemisphere were significantly less than those of healthy controls (P < 0.01, analysis of variance with a post hoc Scheffé's F-test).
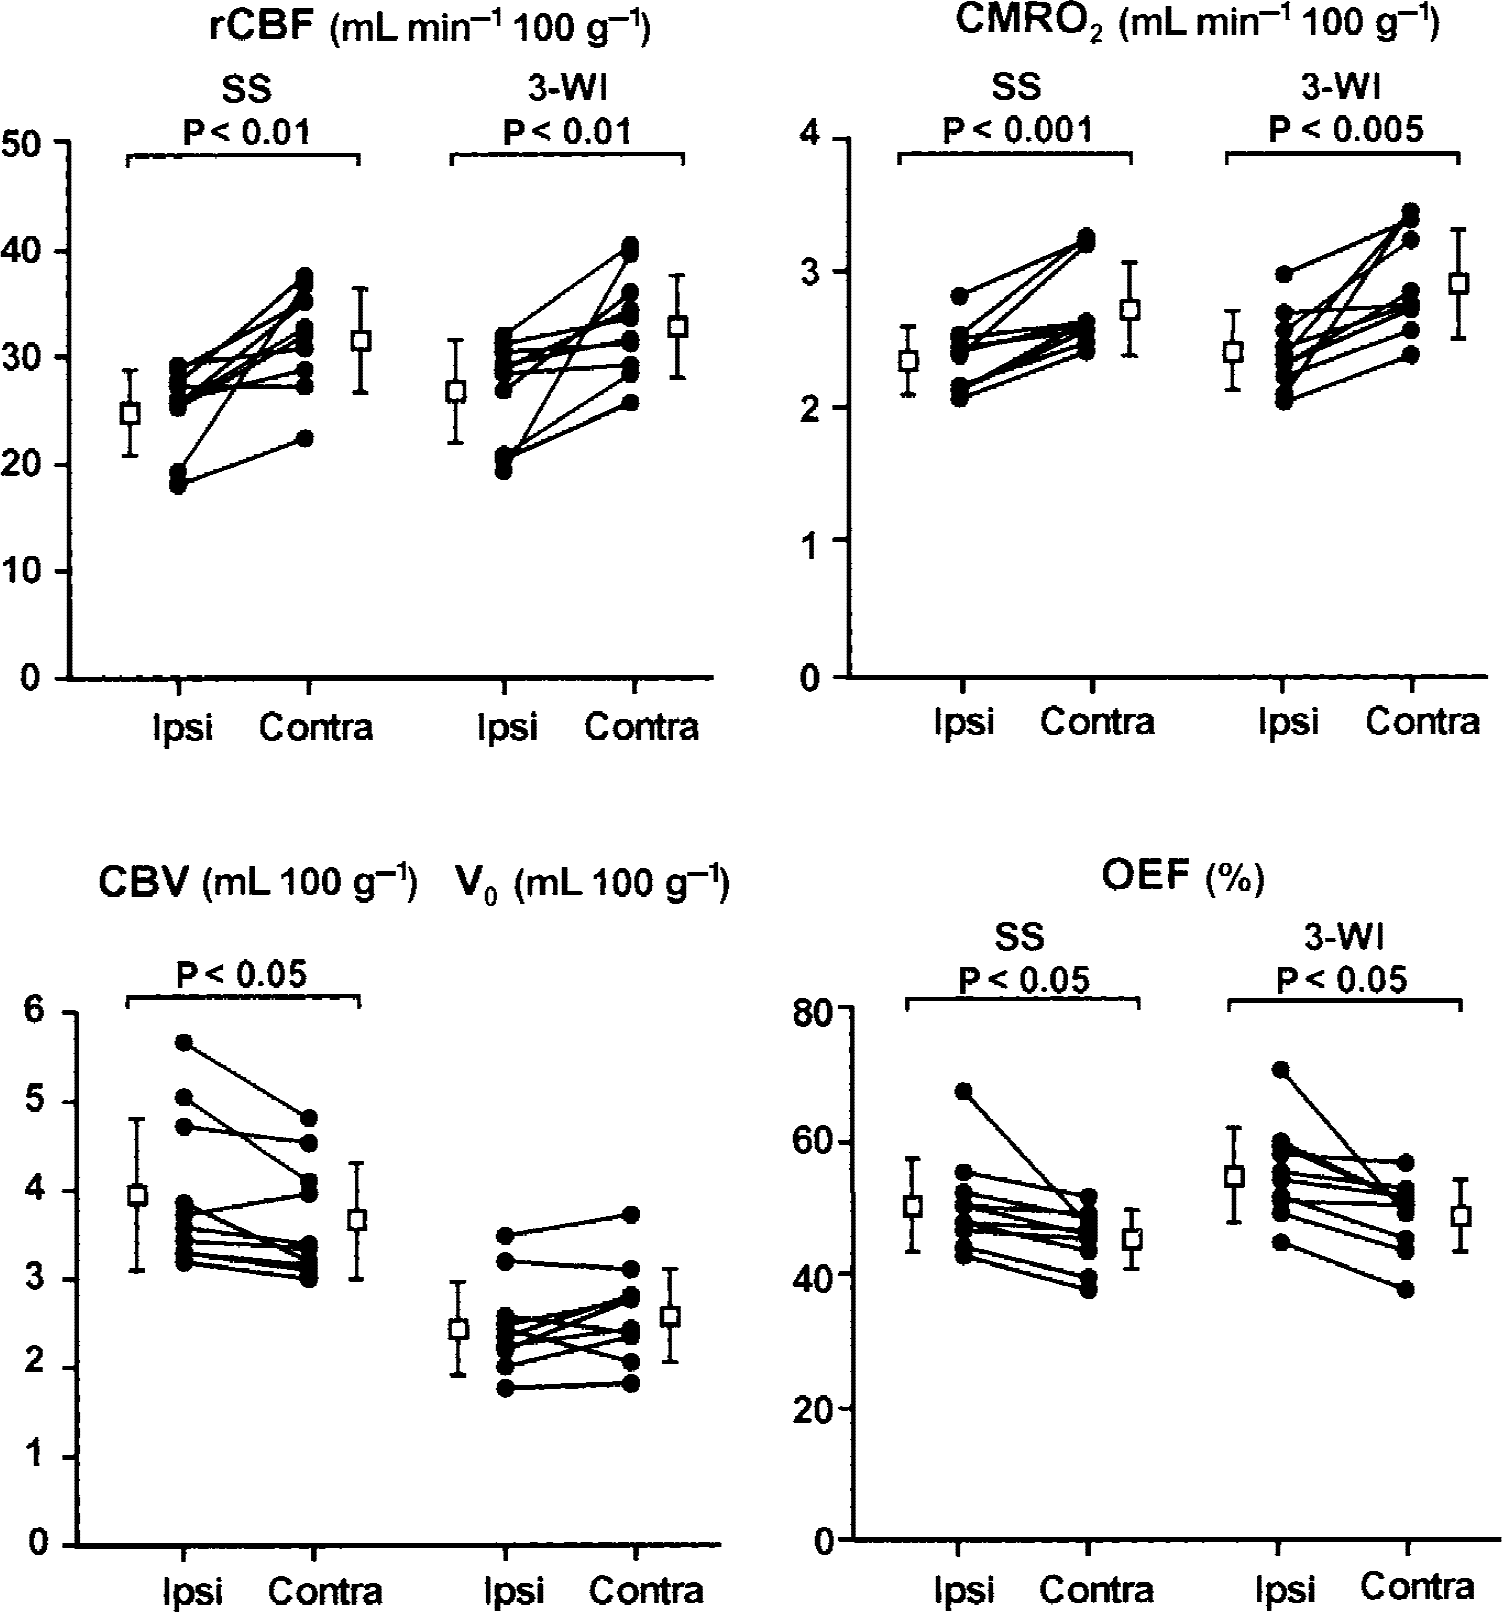
Comparison of hemispheric differences in patients with cerebrovascular diseases. There were reduced regional values of cerebral blood flow (rCBF) and cerebral metabolic rate of oxygen (CMRO2), and increased values of cerebral blood volume (CBV) and oxygen extraction fraction (OEF) in the ischemic hemisphere (Ipsi) in both methods compared with the contralateral hemisphere (Contra). Significant differences were observed between the hemispheres (paired t-test) except for arterial blood volume (V0). SS, steady-state method; 3-WI, three weighted integral method (bolus method).
DISCUSSION
Methodologic issues
The bolus method used in the current study, which had been established by Ohta et al. (1992, 1996), was expected to be a promising method for assessing cerebral perfusion and oxygen metabolism. The conventional and common method for measurement of oxygen consumption in the brain has been the steady-state method established by Frackowiak et al. (1980; Lammertsma et al., 1983). Mintun et al. (1984) developed a bolus inhalation method with 15O2 to measure oxygen metabolism to simplify the procedure, although it took three steps to obtain absolute values for oxygen metabolism. In the method of Ohta et al. (1992), CMRO2 could be calculated with a single bolus inhalation of 15O2 instead of coupling CBF images obtained from 15O-water injection. The method is called the “one-step method” compared with the “three-step method” of Mintun et al. In the new bolus method by Ohta et al., however, it was assumed that metabolized 15O and recirculation of 15O-water would not appear in the blood during the 3-minute scan time. In fact, the influence of metabolized 15O seemed negligible compared with unextracted 15O2 in the venous blood (Ohta et al., 1992, 1996). The first purpose of the current study was to evaluate various parametric quantities determined using the new bolus method as compared with the conventional steady-state method, because the new method may be useful for measuring dynamic changes in cerebral perfusion and metabolism. Because the bolus method of Ohta et al. was evaluated for the capability of quantitative measurement in comparison with the three-step method for CMRO2 and the two-weighted integral method (Huang et al., 1982, Alpert et al., 1984) for CBF in the previous studies (Ohta et al., 1992, 1996), the current study is the first quantitative comparison with the steady-state method.
Global values and regional correlation between the steady-state and bolus methods showed comparable results and a good correlation in the control study. Fluctuations in global CBF and CMRO2 usually occurred during multiple scans in one subject, as shown in activation studies (Fox and Raichle, 1984; Vafaee et al., 1999). However, the difference seen between the two methods in the global CMRO2 was significant, suggesting that the bolus method for CMRO2 overestimated oxygen consumption in the brain. Regional values in the major veins and sinuses showed greater values in the bolus method than in the steady-state method (Figs. 2 and 4), and relatively greater values were observed at lower CMRO2 regions (Fig 3). One possible explanation for this is that the assumption for the 3-WI method that there would be no recirculation of 15O-water appearing in the blood during the 3-minute scan time in the bolus method might be insufficient to account for the effect of intravascular radioactivity. Ohta et al. (1992) reported in their simulation that the “one-step method” overestimates values in the low CMRO2 regions by ignoring the effect of recirculating water. The overestimation of CMRO2 values in the regions of low metabolism in the current study might be explained by their simulation. However, the effect of recirculating 15O-water seemed negligible in the normal cortex compared with the influence of unextracted 15O2 in the venous vessels (Ohta et al., 1992). In the bolus method for CMRO2, although arterial blood volume was estimated and extracted as a separate parameter of V0, the venous radioactivity was not excluded sufficiently. Relatively small extraction for O2, estimated as ≤0.5, provided a large amount of radioactivity due to unextracted 15O2 in the venous blood, which might partially remain in CMRO2 images and affect values even after excluding vascular counts into V0. On the contrary, in the calculation of CBF with the 3-WI method, the venous radioactivity was not sufficiently great enough to disturb the rCBF values (Okazawa and Vafaee, 2001), because extraction of H215O in the brain tissue is considered sufficiently high to negate the effect of the extraction fraction in the calculation. The possible influence of unextracted 15O2 is discussed in the limitations for the 3-WI method section below. A further correction method for the venous volume and its intravascular radioactivity because of unextracted 15O2 would be needed to obtain precise values, especially in the regions adjacent to the major veins to avoid overestimation of rCMRO2 in the new bolus method.
Another possibility for the difference in CMRO2 values between the two methods is that the CBV correction in the steady-state method might have yielded underestimation of OEF and CMRO2 rather than overestimation in the bolus method. The correction for blood volume in the steady-state method provides reductions of OEF and rCMRO2 values by several percent (Lammertsma and Jones, 1983; Lammertsma et al., 1983). Lammertsma and Jones (1983) assumed that the rCBV used for the volume correction in the steady-state method lies entirely within the venous side of the circulation, whereas CBV obtained from C15O inhalation method includes both arterial and venous part of blood volume. This assumption may cause some errors or biases in OEF and CMRO2 values. However, in the current study, CMRO2 values without CBV correction in the steady-state method overestimated the global values to be 3.25 ± 0.23 mL min−1 100 g−1, which was not significantly different from global CMRO2 in the bolus method (3.19 ± 0.21 mL min−1 100 g−1), indicating the bolus method overestimated oxygen consumption. There might still be a possibility that the steady-state method underestimated OEF and CMRO2; however, it seems more probable that greater values in the bolus method were overestimated.
The method for measurement of CBV in the current study might be criticized for its shorter waiting time before scan start, as compared with the results by Martin et al. (1987). They reported that equilibrium of radioactivity in the blood was achieved 95 ± 39 seconds after C15O inhalation. The current authors also measured the arterial-to-venous activity ratio after tracer inhalation with 6 subjects, who were not included in the current study, and obtained a result that the ratio reached to a plateau approximately at 100% after 40 to 50 seconds from inhalation of 15O2. The time was approximately 30 seconds after arrival of peak count in the brain (data not shown). The dynamic PET data after bolus C15O inhalation were carefully examined and found that CBV values obtained from the current method showed no difference from those obtained from later time frames after 90 to 100 seconds or more. Furthermore, CBV values obtained from C15O method were consistent with the previous report in which cerebral blood volume was measured separately from the red blood cell volume and plasma volume (Okazawa et al., 1996). The method for CBV measurement used in the current study is considered to be appropriate.
Although global CMRO2 obtained from the bolus method showed significantly greater values compared with the steady-state method, corrected values using linear regression from the control data produced similar values with those from the steady-state method in patients' data. Because the results of the two methods were linearly well correlated, regional values of CMRO2 obtained by the bolus method would be similar to the values obtained by the steady-state method after the linear correction. To compare absolute values of oxygen consumption between the different methods, a correction would be needed to assess the data directly. However, the excellent correlation between the two methods indicates that it should be possible to compare or use them comparably in subsequent methods. The mean value of OEF in the bolus method tended to be greater than that obtained from the steady-state method as a result of greater CMRO2, although the difference was not significant. Slightly higher CBF in the bolus method would have reduced the difference in OEF values. Advantages in the bolus method of Ohta et al. (1992, 1996) can be summarized to be a shorter scan time and possibility of repeat measurement with comparable parametric values to the steady-state method for perfusion and oxygen metabolism, which is expected to provide a great benefit in clinical studies. Image quality and contrast in parametric images were better in the steady-state method than in the bolus method because of a longer scan time. The two methods should be selected according to the purpose of the study.
In the two methods, PET data were acquired in different modes, that is, the two-dimensional acquisition mode was used for the steady-state method and the three-dimensional mode for the bolus method. In the steady-state method, high radioactivity is expected around the airway of subjects, causing an increase in coincidental random counts that might markedly affect tissue counts in the brain if the three-dimensional mode acquisition is used. However, to obtain sufficient counts in the bolus method, the three-dimensional mode was considered to have the advantage of greater sensitivity with a low dosage of radioactivity. Because Dhawan et al. (1998) reported that the two acquisition modes showed no significant difference in quantitative values in their [18F]fluorodeoxyglucose (FDG) and [18F]fluorodopa studies, the two scan modes used in the current study were expected to show no difference in quantity, because the same PET scanner was used. Global and regional values of CBF were comparable in the two methods, as expected, and showed no significant differences. The results of the current study supported the conclusion that the difference between the two acquisition modes was negligible in the H215O studies. However, in the bolus inhalation method with 15O2, remarkable radioactivity in the nasopharynx and paranasal cavities are supposed in the initial phase of PET scanning, and its effects on the quantitative values of CMRO2 are expected to be considerable. The possible influence of randoms and scatter on the CMRO2 values in the brain tissue is discussed in the following subsection.
Limitations for the 3-WI method
V0 is defined as the arterial to capillary blood volume (Ohta et al., 1996; Iida et al., 2000; Okazawa and Vafaee, 2001); however, the value would be affected by the permeability of the tracer. The authors defined V0 obtained from H215O studies as the arterial blood volume, and used the values for comparison between V0 and CBV in control subjects and also between the bilateral hemispheres in patients. Ohta et al. (1996) compared the two V0 images obtained from H215O and 15O2 using the same 3-WI method, and demonstrated differences in the sinuses. As they discussed in the report, the greater values in V0 with the bolus 15O2 method is considered because of a smaller extraction of the tracer than H215O. The difference also was observed in the current study. Slightly greater global values in the cerebral tissue were found in V0 with the bolus 15O2 method (Table 2), indicating that the venous counts because of unextracted tracer were included in the V0 images from 15O2 studies. However, the extraction of water is considered approximately 0.85 (Herscovitch et al., 1987), and venous part in the V0 values in H215O studies would be negligible or very small. The V0 values in H215O studies are considered to represent mainly arterial to capillary volume, especially in the functional vessels, and measurement of V0 would be important to evaluate hemodynamics in the brain.
Another limitation for the bolus method by Ohta et al. (1992, 1996) is that the image calculation was performed using the time delay fitted between the arterial input and the time-radioactivity curves for the brain tissue. Although the delay was determined by the curves obtained from each slice, the slope of a curve is usually determined by the arterial-to-tissue radioactivity and further delay is usually observed in the sinuses. Indeed, V0 images obtained from the bolus 15O2 method include venous radioactivity; however, CMRO2 images still include unextracted radioactivity of 15O2 in sinuses as shown in Figs. 2 and 4. A possible explanation for this is that the discrepancy of the time delay in curves for arteries and veins, even in a same slice level, may yield the overestimation of CMRO2 for the venous part. This discrepancy of the delay would be one of the reasons for the incomplete elimination of radioactivity in the sinuses in CMRO2 images. Furthermore, inhaled 15O2 provides strong radioactivity and increases randoms and scatter in the slice levels of nasopharynx and paranasal cavities during the initial 2 or 3 frames. The influence of randoms in other slice levels was not considered to be significant because the frames affected by randoms were before the arrival of arterial input and elimination of those frames did not show any differences in CMRO2 and V0 images. However, the radioactivity in the nasopharynx could have affected the parametric images especially on V0 values in the corresponding slice levels. The current authors evaluated the two V0 values from H215O and 15O2 scans using the slices located from the levels of basal ganglia to the parietal regions where the influence of inhaled 15O2 is considered minimum. To compare or to evaluate arterial blood volume as a parameter of hemodynamics in the brain, V0 from H215O is considered to be appropriate to avoid influence of high radioactivity in the nasopharynx and venous unextracted tracer.
V0 in the ischemic region
The second major purpose of the current study was to evaluate V0 values in patients with occlusive cerebrovascular diseases. Cerebral blood volume values generated in the 15O-gas study usually represent total vascular volume in the brain including both arteries and veins after the correction of cerebral-to-large-vascular hematocrit ratio (Phelps et al., 1979; Okazawa et al., 1996). However, V0 values calculated by the 3-WI in the bolus H215O method are considered to represent arterial to capillary blood volume in the brain (Iida et al., 2000; Okazawa and Vafaee, 2001). In patients with major cerebral arterial diseases, rCBV values in the ischemic hemisphere are considered to increase to compensate for reduced cerebral perfusion pressure (Gibbs et al., 1984; Powers et al., 1984). However, which part of the vessels would be enlarged in that condition has not been clear. Although precapillary vasodilatation is considered the most likely explanation for the increase in CBV (Grubb et al., 1973; Kontos, 1981), postcapillary or venous dilatation may also contribute to the increase (Russel and Page, 1983). The relative contribution of arterial, capillary, and venous blood volume to the increase in CBV shown by using PET has not been demonstrated. Because the new bolus water method with 3-WI could enable calculation of V0 separately from the whole blood volume, a change in arterial-to-precapillary blood volume was expected to be evaluated in the ischemic part in comparison with the contralateral hemisphere in patients with cerebrovascular diseases.
Contrary to expectations, an increase in V0 was not observed in the hemisphere with steno-occlusive change in major arteries. The increase in CBV in the hemisphere with the arterial occlusive change suggests compensatory vasodilatation in response to reduced perfusion pressure. Thus, in the patients studied, the dilatation of the vein may have mainly contributed to the observed increase in CBV and the dilatation of artery and capillary may have made little contribution. It is unlikely that the veins directly contribute to the compensatory mechanism for reduced perfusion pressure. Thus, one possible explanation of the result is that the increase in the value of arterial blood volume caused by autoregulatory vasodilatation of precapillary resistance vessels is too small to be detected by PET measurement. The authors could detect autoregulatory vasodilatation only as the passive increase in venous blood volume, although many PET studies have shown an increase in CBV as the result of autoregulatory vasodilatation in patients with major cerebral arterial occlusion. In addition, the patients studied had cerebral infarcts, or a decrease in CMRO2 in the hemisphere with arterial occlusion, or both. Thus, vasoconstriction caused by decreased metabolism may have counterbalanced autoregulatory vasodilatation in large regions of interest. Furthermore, the current patients with major cerebral arterial occlusion, especially with collateral circulation through the anterior communicating artery, may show hemodynamic disturbance in the bilateral hemispheres, which may have led to bilateral changes in V0. There was a tendency for V0 to increase in the bilateral hemispheres of these patients compared with the controls, and this tendency was marked in the hemisphere without arterial occlusion that showed preserved metabolism, although the large standard deviations and limited number of subjects in both groups might have accounted for the lack of a significant difference. These factors might have made the detection of increased V0 more difficult.
Regional hematocrit values were reported to be reduced in the ischemic hemisphere in patients with stroke, indicating a reduction in the ratio of cerebral-to-large vascular hematocrit in the damaged hemisphere compared with the contralateral hemisphere (Okazawa et al., 1996; Yamauchi et al., 1999). The reduction of the ratio would cause underestimation of rCBV measured with labeled red blood cells when using a constant ratio for the hematocrit correction. However, the V0 image in the bolus method was not expected to be affected by the hematocrit ratio because of using fully diffusible 15O-water as a tracer. The changes in V0 would thus be able to indicate more reliably the function of arterial regulation in response to reduced perfusion pressure. Thus, further investigations are required to determine whether an increase in V0 in association with an increase in CBV can be detected in the hemisphere with a major cerebral arterial occlusion in patients with only minor ischemic changes and preserved metabolism. In any case, dilatation of veins may mainly contribute to the increase in CBV, which has been shown using PET in patients with major cerebral arterial occlusive diseases.
Conclusion
The bolus method with the 3-WI method can simplify oxygen metabolism studies and enable evaluation of arterial blood volume simultaneously. The method provides comparable regional values of rCBF and oxygen consumption to those obtained with the conventional method. To obtain precise rCMRO2 values with the bolus method, correction for the intravenous nonextracted 15O2 is considered necessary. The finding that in the ischemic region of the brain rCBV increased significantly compared with rCBV in the contralateral hemisphere, whereas V0 showed no difference, suggests that venous dilatation may be a major cause of the increase in blood volume measured by PET in patients with chronic occlusive cerebrovascular diseases. Measurement of V0 may provide new information about the arterial function in response to reduced perfusion pressure in cerebrovascular diseases.
Footnotes
Acknowledgments:
The authors thank the staff of PET Unit in the Research Institute, Shiga Medical Center, and Mr. Matsugi for technical assistance. The authors also appreciate Drs. H. Nabatame, M. Matsuda, S. Matsuzaki, Y. Akiyama, and N. Hayashi in the Departments of Neurology and Neurosurgery, Shiga Medical Center, for clinical assistance.