
Abstract
The aim of the current study was to assess the reproducibility of functional magnetic resonance imaging (fMRI) brain activation signals in a sensorimotor task in healthy subjects. Because random or systematic changes are likely to happen when movements are repeated over time, the authors searched for time-dependent changes in the fMRI signal intensity and the extent of activation within and between sessions. Reproducibility was studied on a sensorimotor task called “the active task” that includes a motor output and a sensory feedback, and also on a sensory stimulation called “the passive task” that assessed the sensory input alone. The active task consisted of flexion and extension of the right hand. The subjects had performed it several times before fMRI scanning so that it was well learned. The passive task consisted of a calibrated passive flexion and extension of the right wrist. Tasks were 1 Hz-paced. The control state was rest. Subjects naïve to the MRI environment and non–MRI-naïve subjects were studied. Twelve MRI-naïve subjects underwent 3 fMRI sessions separated by 5 hours and 49 days, respectively. During MRI scanning, they performed the active task. Six MRI-naïve subjects underwent 2 fMRI sessions with the passive task 1 month apart. Three non–MRI-naïve subjects performed twice an active 2-Hz self-paced task. The data were analyzed with SPM96 software. For within-session comparison, for active or passive tasks, good reproducibility of fMRI signal activation was found within a session (intra-and interrun reproducibility) whether it was the first, second, or third session. Therefore, no within-session habituation was found with a passive or a well-learned active task. For between-session comparison, for MRI-naïve or non–MRI-naïve subjects, and with the active or the passive task, activation was increased in the contralateral premotor cortex and in ispsilateral anterior cerebellar cortex but was decreased in the primary sensorimotor cortex, parietal cortex, and posterior supplementary motor area at the second session. The lower cortical signal was characterized by reduced activated areas with no change in maximum peak intensity in most cases. Changes were partially reversed at the third session. Part of the test–retest effect may come from habituation of the MRI experiment context. Less attention and stress at the second and third sessions may be components of the inhibition of cortical activity. Because the changes became reversed, the authors suggest that, beyond the habituation process, a learning process occurred that had nothing to do with procedural learning, because the tasks were well learned or passive. A long-term memory representation of the sensorimotor task, not only with its characteristics (for example, amplitude, frequency) but also with its context (fMRI), can become integrated into the motor system along the sessions. Furthermore, the pattern observed in the fMRI signal changes might evoke a consolidation process.
Keywords
The stability of cerebral activation associated with a particular behavior over time is an important notion in functional imaging. Time-dependent changes may arise from either random or systematic processes. Random processes may be nonphysiologic (changes in the position of the subject in the B0 field and in the radiofrequency head coil, field inhomogeneities, shimming differences, instability of the scanner functional magnetic resonance imaging [fMRI] signal, image noise, data processing and analysis, statistical [type I or II] errors) or neurophysiologic (random cognitive processes, level of arousal, and motion artifacts) (McGonigle et al., 2000; Veltman et al., 2000). The latter may arise from small changes in performance, differences in strategies, or functional organization constantly reshaped by behavioral demands for learning of new motor skills. All these factors can change from one session to another and from one subject to another at random. Systematic processes are related to the repeated performance of a specified task such as attention, habituation, and learning. It is well known that responses in the sensory systems show habituation over time, leading to a reduction in functional activation (Mauguiére and Fischer, 1990;Näätänen, 1994) or conversely to an enlargement of activation when learning occurs (Karni et al., 1995).
Unless time effects are assessed, time-dependent changes in brain activity may be erroneously attributed to task-dependent effects. Counterbalancing task position within subjects or task position between subjects has been found to be a solution to take into account putative time effects without actually showing their occurrence (Rajah et al., 1998). However, these time-dependent changes do need to be determined because some paradigms, such as learning paradigms or longitudinal studies in patients, do not allow counterbalanced examinations. Modern neuroimaging techniques have shown profound intracerebral reorganization occurring during the recovery period and give hope for better understanding and maybe even improvement of reorganization (Chollet et al., 1991, 1994). Thus, methodologic aspects such as reproducibility and time-dependent changes appear to be a major issue.
Controversial results have appeared in the literature. Some claim an excellent reproducibility of functional positron emission tomography (PET) activation signals (Carey et al., 2000; VanMeter et al., 1995), of transcranial magnetic stimulation (TMS) signals (Pascual-Leone et al., 1995), and of fMRI activation signals within one session (Noll et al., 1997; Rombouts et al., 1998; Yetkin et al., 1996) or between sessions (DeYoe et al., 1994; Gozal et al., 1994; Mattay et al., 1996; Noll et al., 1997; Ramsey et al., 1996; Robinson et al., 1995; Rombouts et al., 1998; Wexler et al., 1997). Others showed time-dependent changes during a single fMRI experiment (Condon et al., 1997; Karni et al., 1995; Silva et al., 1999), during a single functional PET experiment (Dejardin et al., 1998; Friston et al., 1993; Paus et al., 1997; Rajah et al., 1998), or between two examinations although the very same task was performed by the subjects (Miki et al., 2000; Seitz and Roland, 1992; Shadmehr and Holcomb, 1997; Skolnick et al., 1993).
Therefore, the authors tried to answer this particular issue of reproducibility using fMRI. Within-and between-session reproducibility was studied on both the signal intensity and the extent of the activated areas. A simple motor task was chosen to limit the number of cognitive processes involved. The first task consisted of flexion and extension of the right hand at a fixed rate of 1 Hz. It was practiced several times before the experiment and was thus well learned. This task was a voluntary active task. To remove kinematic parameters that could vary during the experiment (for example, adjustments, force, amplitude) and that would be difficult to monitor in the MRI scanner with an active motor task, a passive motor task was also used. It consisted of passive flexion and extension of the right wrist at a fixed rate (1 Hz) and at a calibrated amplitude (60°). These two movements were very close, and the authors did not expect to find any difference in their cerebral representation, at least in the primary sensorimotor cortex, with the current resolution of the MRI scanner used.
The authors checked that the subjects were naïve with respect to MRI, as patients included in longitudinal studies would be. Moreover, three other subjects who were non–MRI-naïve were studied to assess whether being MRI-naïve plays a role in fMRI reproducibility. Only individual results are given for this group.
MATERIALS AND METHODS
Subjects
The study was performed with the approval of the authors' Institutional Human Studies Committees, and all subjects gave written informed consent.
The authors studied 21 healthy, right-handed volunteers (12 women, 9 men; mean age 41 years, range 26 to 62) with no history of neurologic or psychiatric disease. Eighteen subjects were chosen for being naïve to MRI. They were divided into two groups (group 1, n = 12; group 2, n = 6). Three subjects were chosen for having undergone at least one fMRI examination before (group 3). In each session, the same procedure was repeated.
Protocol
Figure 1 describes the protocols. For group 1 (MRI-naïve subjects, active protocol), the three sessions were separated by 5 hours and 49 days on average (E1 and E2, n = 12; E3, n = 11). For group 2 (MRI-naïve subjects, passive protocol), 30 days separated the two identical fMRI examinations at 8 am (E′1 and E′2, n = 6). For group 3 (non–MRI-naïve subjects, active protocol), 60 days separated the two sessions (E“1 and E”2, n = 3).
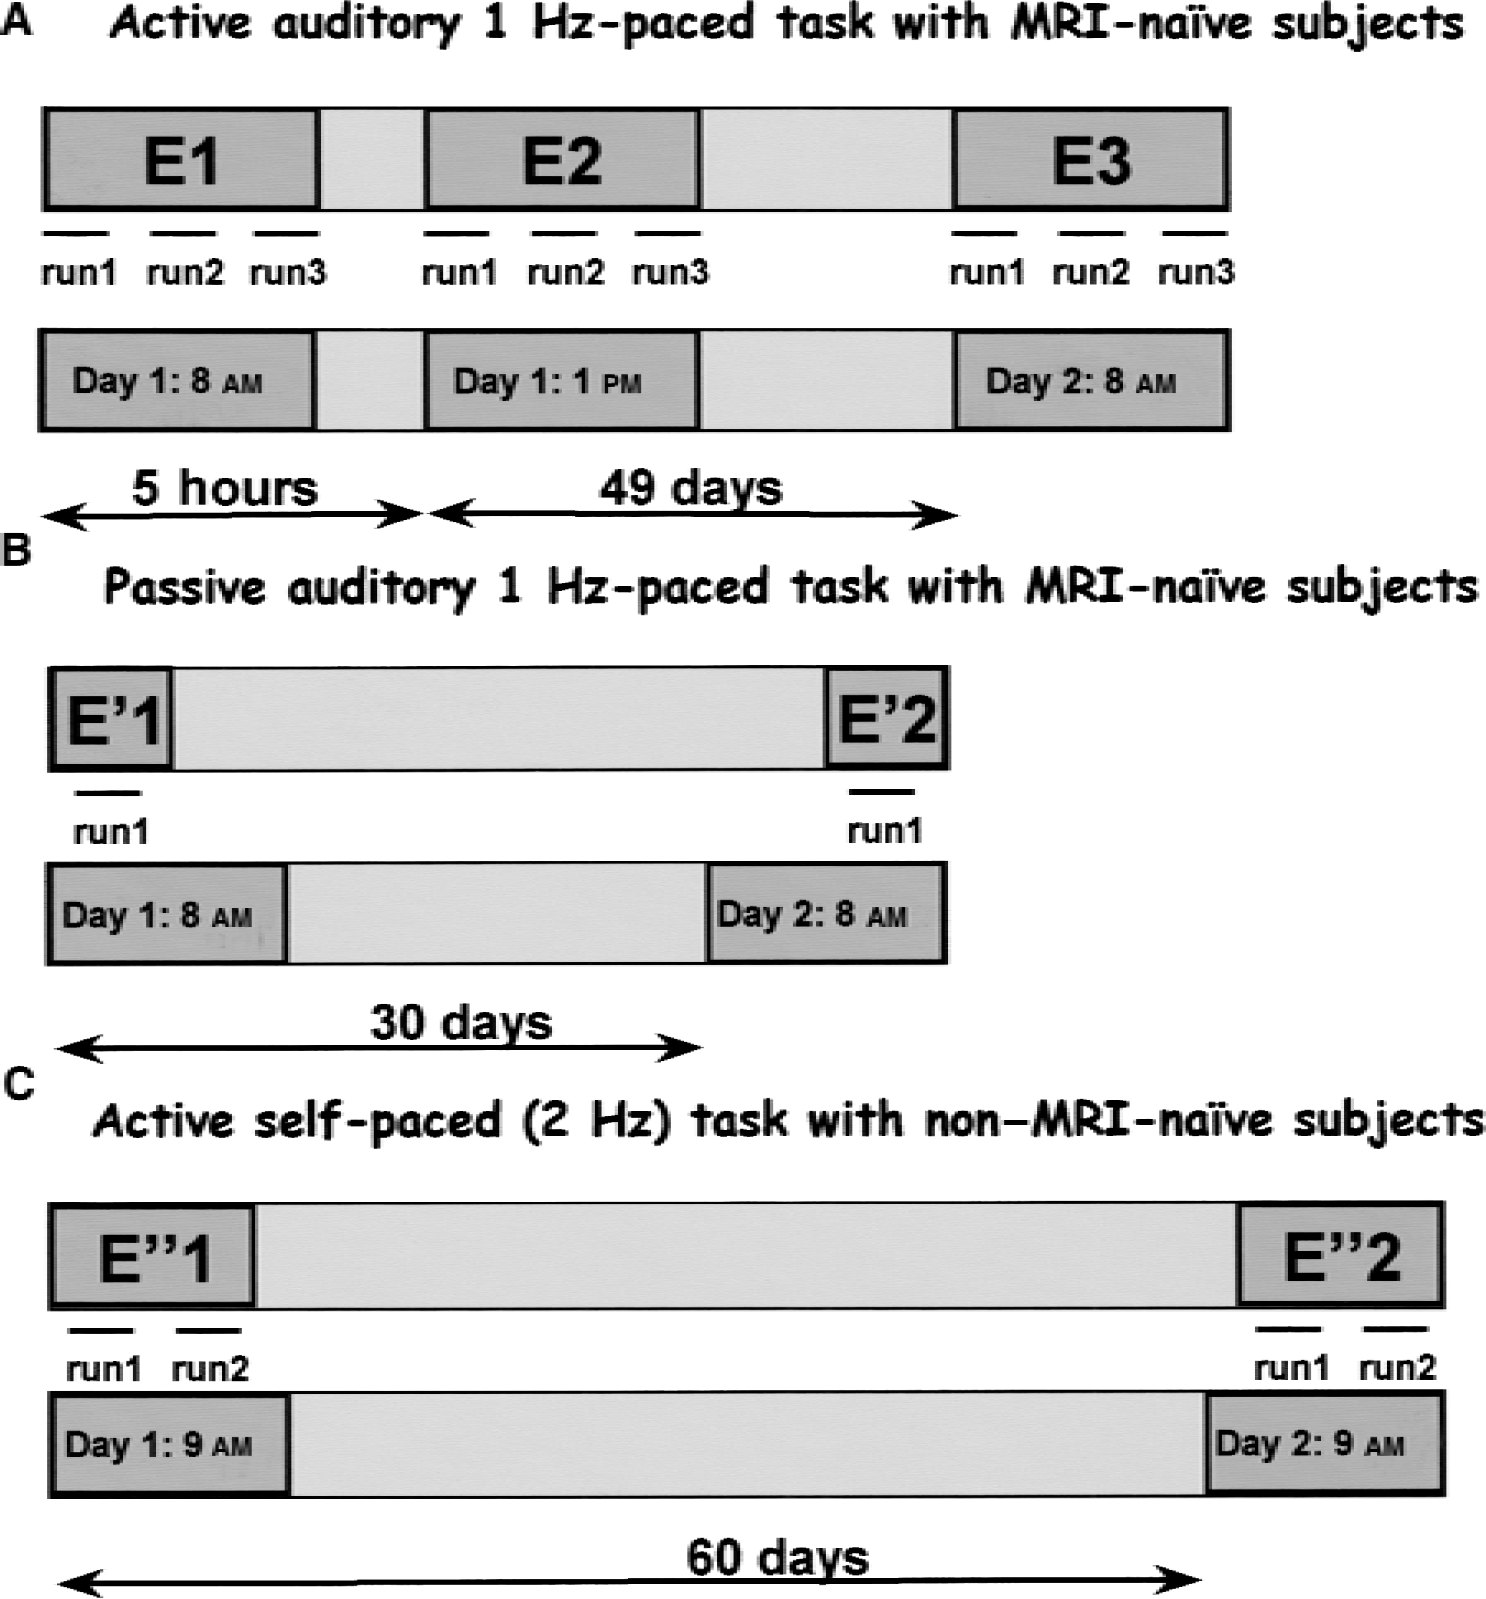
The three protocols of the study.
The task paradigm, block design, consisted of eight 30-second epochs alternating between rest (R) and activation (A) (R-A-R-A-R-A-R-A), resulting in an acquisition time of 4 minutes per functional time series. Subjects were instructed to keep their eyes closed. Head motion was minimized using foam padding and ear pads. During A, the task was performed; during R, subjects were told to relax and not think about finger movements.
For the active task (group 1), the task was an auditory 1 Hz-paced task that consisted of clenching the fist of the right hand. The 1-Hz auditory signal continued throughout the A and R periods. Three runs (R-A-R-A-R-A-R-A) (R-A-R-A-R-A-R-A) (R-A-R-A-R-A-R-A) were done so that a total of 12 pairs of R-A periods were performed. Before the subjects were positioned in the scanner, they had practiced the task. The authors verified that they performed this simple task correctly so that it was considered well learned. The execution of the task during scanning was inspected visually, and all subjects were seen to comply with the auditory pacing.
For the passive task (group 1), the subjects were instructed to stay motionless. Their arms were restrained to prevent movement of the shoulders, arms, or elbows. The passive movement, repeated extension and flexion of the right wrist, was induced by traction on the right hand at a set rate (one complete movement per second) and at calibrated amplitude (60°). One run (R-A-R-A-R-A-R-A) and thus four pairs of R-A periods were done. An electromyograph (using surface electrodes on radial muscles) was performed under the same conditions but outside the MRI scanner to check the absence of muscle activity during the passive stimulation.
For the active task (group 3), the task was the active task described above but it was at 2 Hz and self-paced. Two runs (R-A-R-A-R-A-R-A) (R-A-R-A-R-A-R-A) and thus eight pairs of R-A periods were done.
Data acquisition
Magnetic resonance imaging was performed on a 1.5-Tesla scanner (Siemens Vision, Erlangen, Germany) equipped for echo-planar imaging (EPI). A three-dimensional high-resolution T1-weighted data set of the whole brain (3D magnetization prepared rapid acquisition gradient echo [3D MPRAGE]) was acquired for each volunteer (repetition time, 15 milliseconds; echo time, 7 milliseconds; inversion time, 300 milliseconds; flip angle, 12°; 30 × 30 cm field of view; 256 × 256 matrix; voxel size, 1.17 × 1.17 × 1 mm3; 128 slices). After sagittal localization images, 9 contiguous, 5-mm-thick, axial anatomic images were obtained from the anterior commissure–posterior commissure plane through the vertex and 3 contiguous images of the cerebellum were acquired (T2-weighted images, repetition time, 418 milliseconds; echo time, 10 milliseconds; flip angle, 30°; 20 × 20 cm field of view; 128 × 128 matrix).
For fMRI studies, blood oxygen level-dependent (BOLD) imaging was performed using a T2*-weighted single-shot EPI sequence (repetition time, 0.8 milliseconds; echo time, 60 milliseconds; flip angle, 90°; 20 × 20 cm field of view; 64 × 64 matrix; 3.125-mm inplane resolution; 5-mm slice thickness). Twelve slices (9 + 3) were acquired every 3 seconds, coincident with the T2-weighted reference images.
Postprocessing
Image analysis was performed on a SPARC workstation (Sun Microsystems, Surrey, U.K.) using interactive image display software (Analyze, Biodynamics Research Unit, Mayo Clinic, Rochester, MN, U.S.A.), Matlab (Math Works, Natick, MA, U.S.A.), and SPM96 4 2.c software (Wellcome Department of Cognitive Neurology, London, U.K.). The first four images of each time series were discarded to eliminate signal intensity variations arising from progressive saturation. Echo-planar images were realigned to the first functional image of each time series to remove residual head movement. The functional images of each subject and of each time series were coregistered with the first functional image of one subject taken as a model. Images then were resized into the standard anatomic space defined by the atlas of Talairach and Tournoux (1988) to perform a group analysis. For each run, the mean of the first rest signal was calculated. For the rest signal of each run to be at the same intensity, all values in each run were translated. The images were smoothed with a gaussian kernel of full width at half maximum 6 mm to reduce the anatomic and functional variability between subjects.
Next, statistical parametric maps were generated using the general linear model used by SPM96 to identify areas of interest that covaried positively with movements (Friston et al., 1995). Data analysis was performed by modeling the active and rest conditions as reference waveforms (that is, half-sine wave functions). The differences between baseline and activation were assessed with the t statistic at each voxel for each run of each subject separately. All activation maps were inspected for evidence of misregistration (for example, edge effects, rims of activity along the cortical surface, absence of activity). Scans in which obvious movement artifacts or registration artifacts leading to an absence of activity in the primary sensorimotor area were identified were excluded from subsequent analysis.
Subjects in group 3 were analyzed individually and maps of activation against rest were calculated.
Group analysis using a fixed effect model (each subject is considered a repetition) was then performed for groups 1 and 2 using SPM96.
First, a group analysis was done for each session (E1, E2, E3, E′1, E′2) comparing activation against rest in statistical parametric maps ([ACTI − REST]Ei > 0; Z score > 3.09 for peak height (P < 0.001) and P < 0.05 for the cluster (corrected for multiple comparisons)) (Friston et al., 1995) (Fig. 2). These maps were overlain onto the anatomic 3D images. Only changes in the activated areas were considered for the following statistics (the condition Ei > 0 or E′i > 0 is specified as a mask with SPM software).
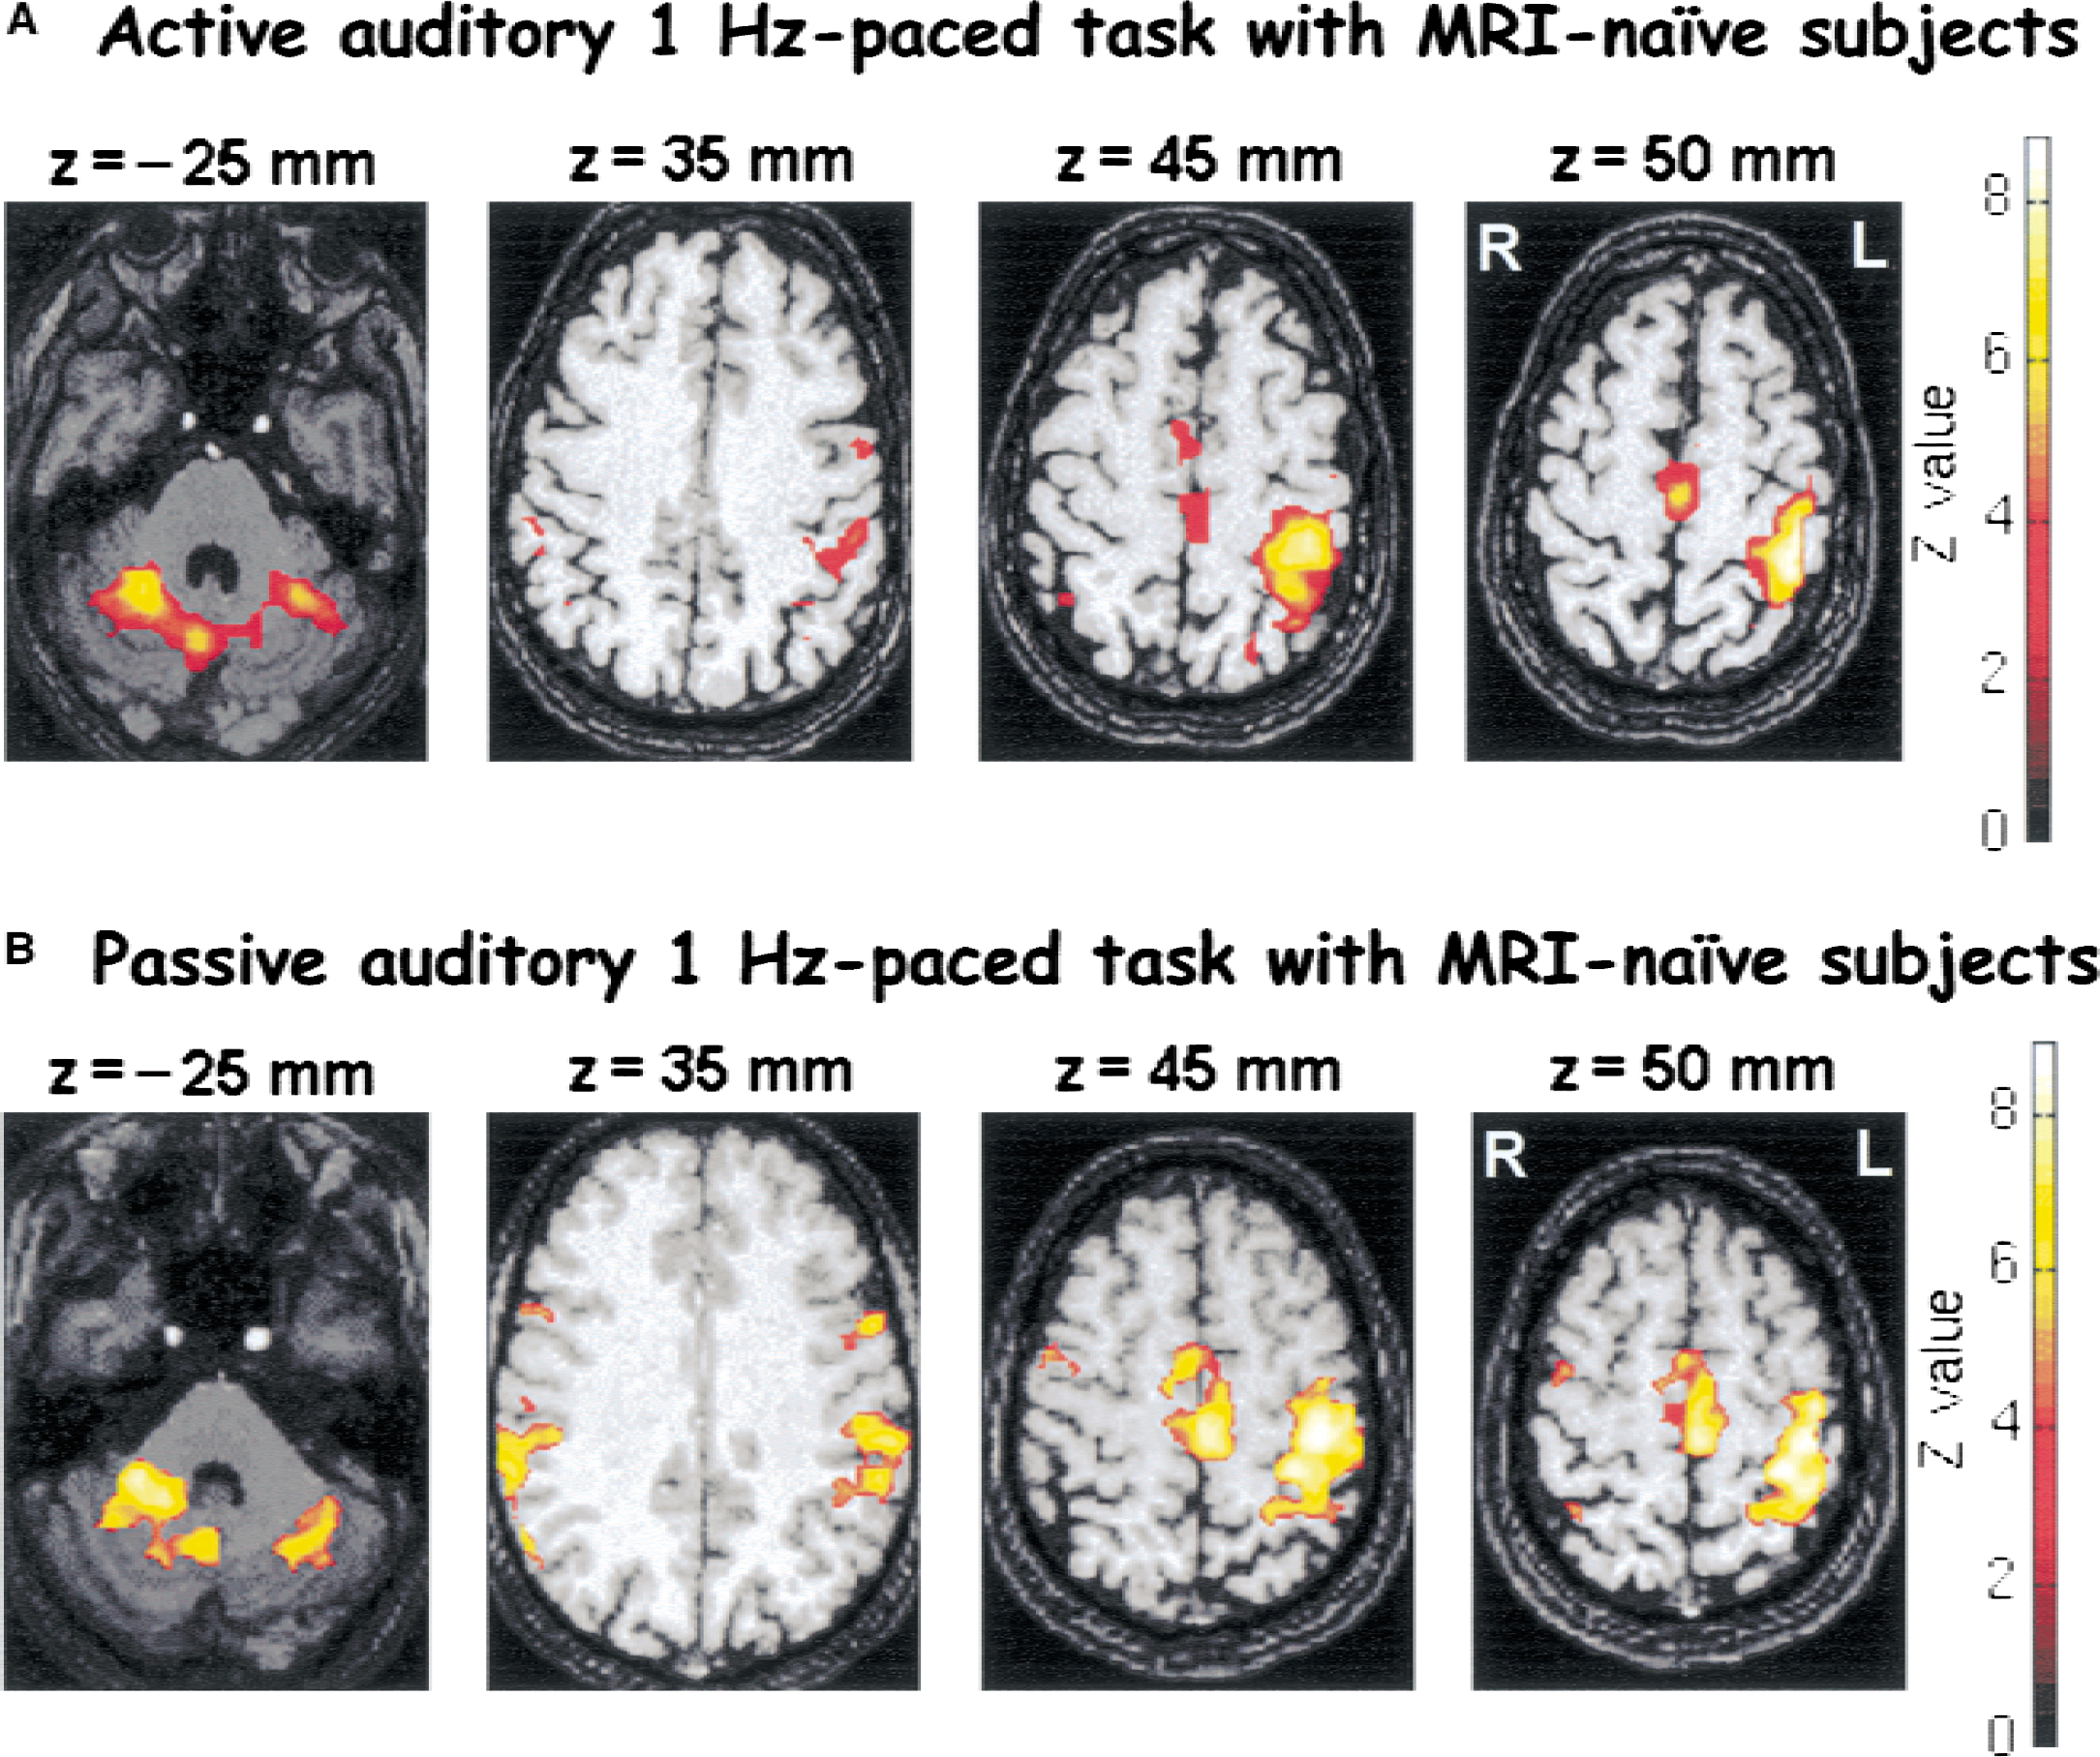
Foci activated by right-hand movements [ACTI − REST] > 0 at E1 and E′1 superimposed on T1-weighted magnetic resonance images. Four transaxial images of −25, 35, 45, and 50 mm under and above the anterior-posterior commissural line are shown. The pixels in yellow show the level of statistical significance greater P < 0.001 for peak height and P < 0.05 for spatial extent (corrected for multiple comparisons). A corresponding Z score bar is provided. The left side of the figure corresponds to the right hemisphere. Note a large activation, mainly in the right cerebellum ipsilateral to the movement, in parietal bilateral cortex (BA 40), and in primary and secondary left motor cortices. Similar activation maps are found for the active
Second, reproducibility was tested within each fMRI session by group analysis. With SPM96, the authors looked for a monotonic and linear change in the amplitude of activation for the active task and its 12 successive activations and for the passive task and its 4 successive activations.
Third, a monotonic and linear change in signal activation was tested in a group analysis along all the sessions with SPM96.
Fourth, reproducibility of the amplitude of activation was tested from one session to another. Statistical parametric maps were generated of [(ACTI − REST)E2 − (ACTI − REST)E1] > 0 and < 0 for the active task. In a more simplified form, E2 − E1 > 0 and < 0 increased and decreased activation 5 hours apart on the same day, and E3 − E1 > 0 and < 0 increased and decreased activation 49 days apart (Z score > 1.69, P < 0.05 uncorrected for multiple comparisons, corrected for spatial extent [>15 voxels per cluster], E1 > 0). Similarly, for the passive task, statistical parametric maps were generated: E′2 − E′1 > 0 and < 0 increased and decreased activation 1 month later.
Fifth, for each subject, the integral and the maximal amplitude of the activation peaks representing indexes of activation signal intensity were calculated at their maximum Z scores.
Sixth, for each subject, coordinates of the maximum peak of activated areas (primary sensorimotor cortex [S1M1], supplementary motor area [SMA], cerebellum) were collected. Centers of mass were computed and the intra-and intersession displacements of the maximum peak were calculated. Intersubject variability in the location of activation for each region was also calculated across subjects by the coefficient of variation, which is the ratio of the standard deviation to the mean, expressed as a percentage. Z scores were collected for these points.
Finally, an analysis of variance was performed on the number of activated voxels in the contralateral sensorimotor cortex. For each subject, regions of interest were drawn encompassing S1M1 on three slices (z = 40, 45, and 50 mm), and the number of activated voxels was summed over the three slices. Measures were then collected for the three runs of E1 and E2 sessions (n = 12) and for the single run of E′1 and E′2 sessions (n = 6). The coefficient of variation (ratio of the standard deviation to the mean) of the S1M1 volumes was computed as extent variability.
RESULTS
Active and passive motor activation maps
Figure 2 shows the activation maps obtained for the first session E1 (group 1) of the active task and for the first session E′1 of the passive task (group 2). For either active task or passive task, similar patterns of activation were found. Areas of activation mainly included contralateral and to a lesser extent ipsilateral S1/M1, parietal cortices (BA 40, BA 7), SMA, cingulate cortex (BA 24, BA 32), bilateral premotor cortices, and cerebellum (Tables 1 and 2). The presence and size of all activated areas, including the contralateral S1/M1 cortex, were variable among subjects. For this reason, the activation maps obtained with the two tasks were not statistically compared because subjects differed from one group to another and a group effect would be a confounding factor. Identical focus locations were found for the active and passive tasks. The maximal activation in the sensorimotor cortex was found in the posterior bank of the central sulcus. The only difference found was that passive movement activated the posterior SMA, the posterior parietal region (BA 7), and the lateral premotor cortex (BA 6) to a lesser extent, while it activated the inferior parietal region (BA 40) to a larger extent. Also, contralateral frontal cortices (BA 8–9) were activated in the active task and not in the passive task.
Activated areas during an active movement
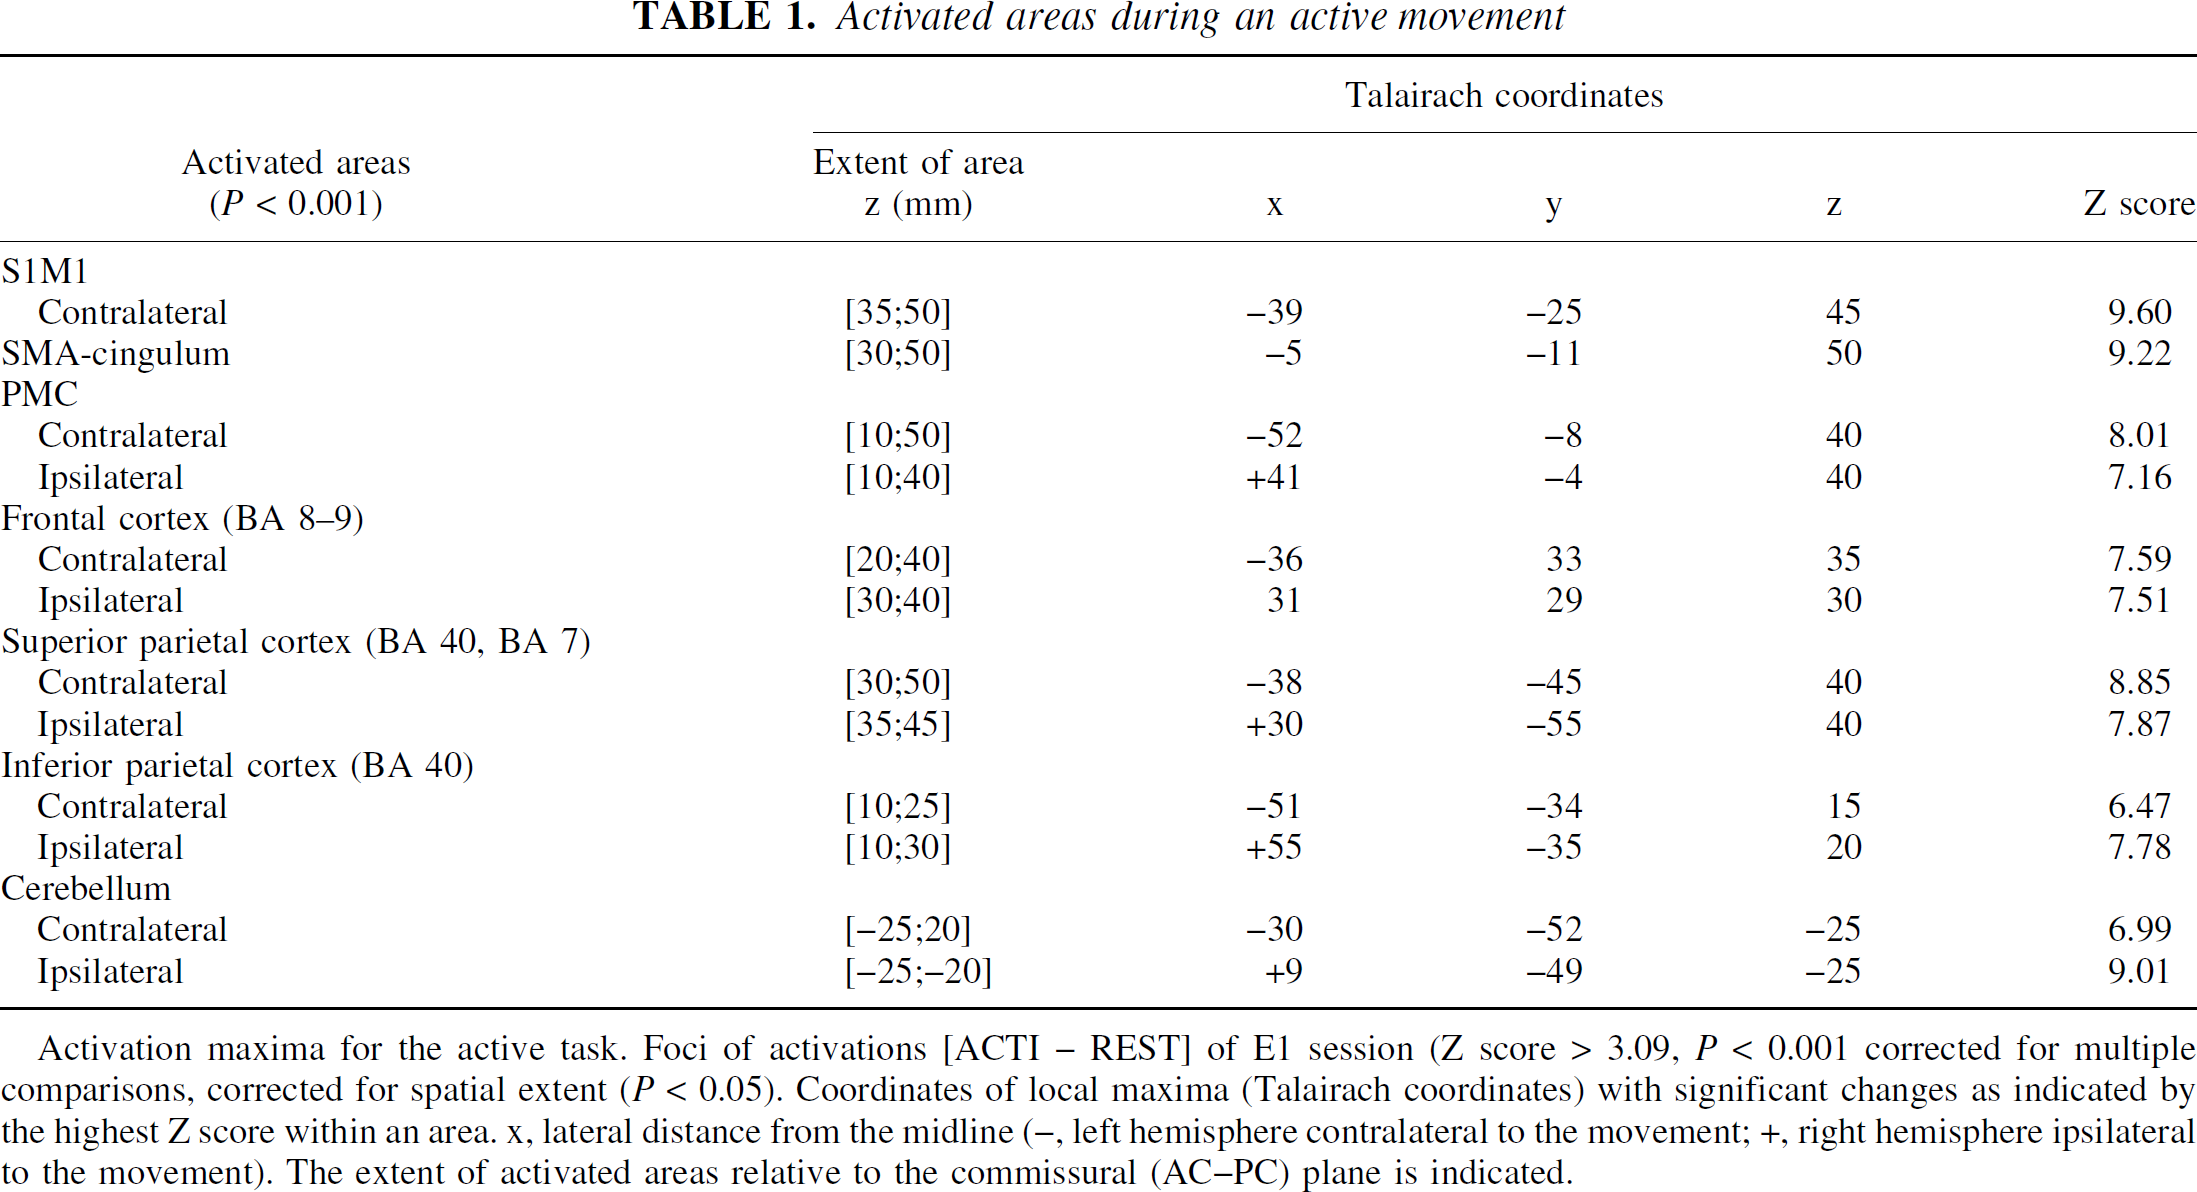
Activation maxima for the active task. Foci of activations [ACTI – REST] of E1 session (Z score > 3.09, P < 0.001 corrected for multiple comparisons, corrected for spatial extent (P < 0.05). Coordinates of local maxima (Talairach coordinates) with significant changes as indicated by the highest Z score within an area. x, lateral distance from the midline (−, left hemisphere contralateral to the movement; +, right hemisphere ipsilateral to the movement). The extent of activated areas relative to the commissural (AC–PC) plane is indicated.
Activated areas during a passive movement
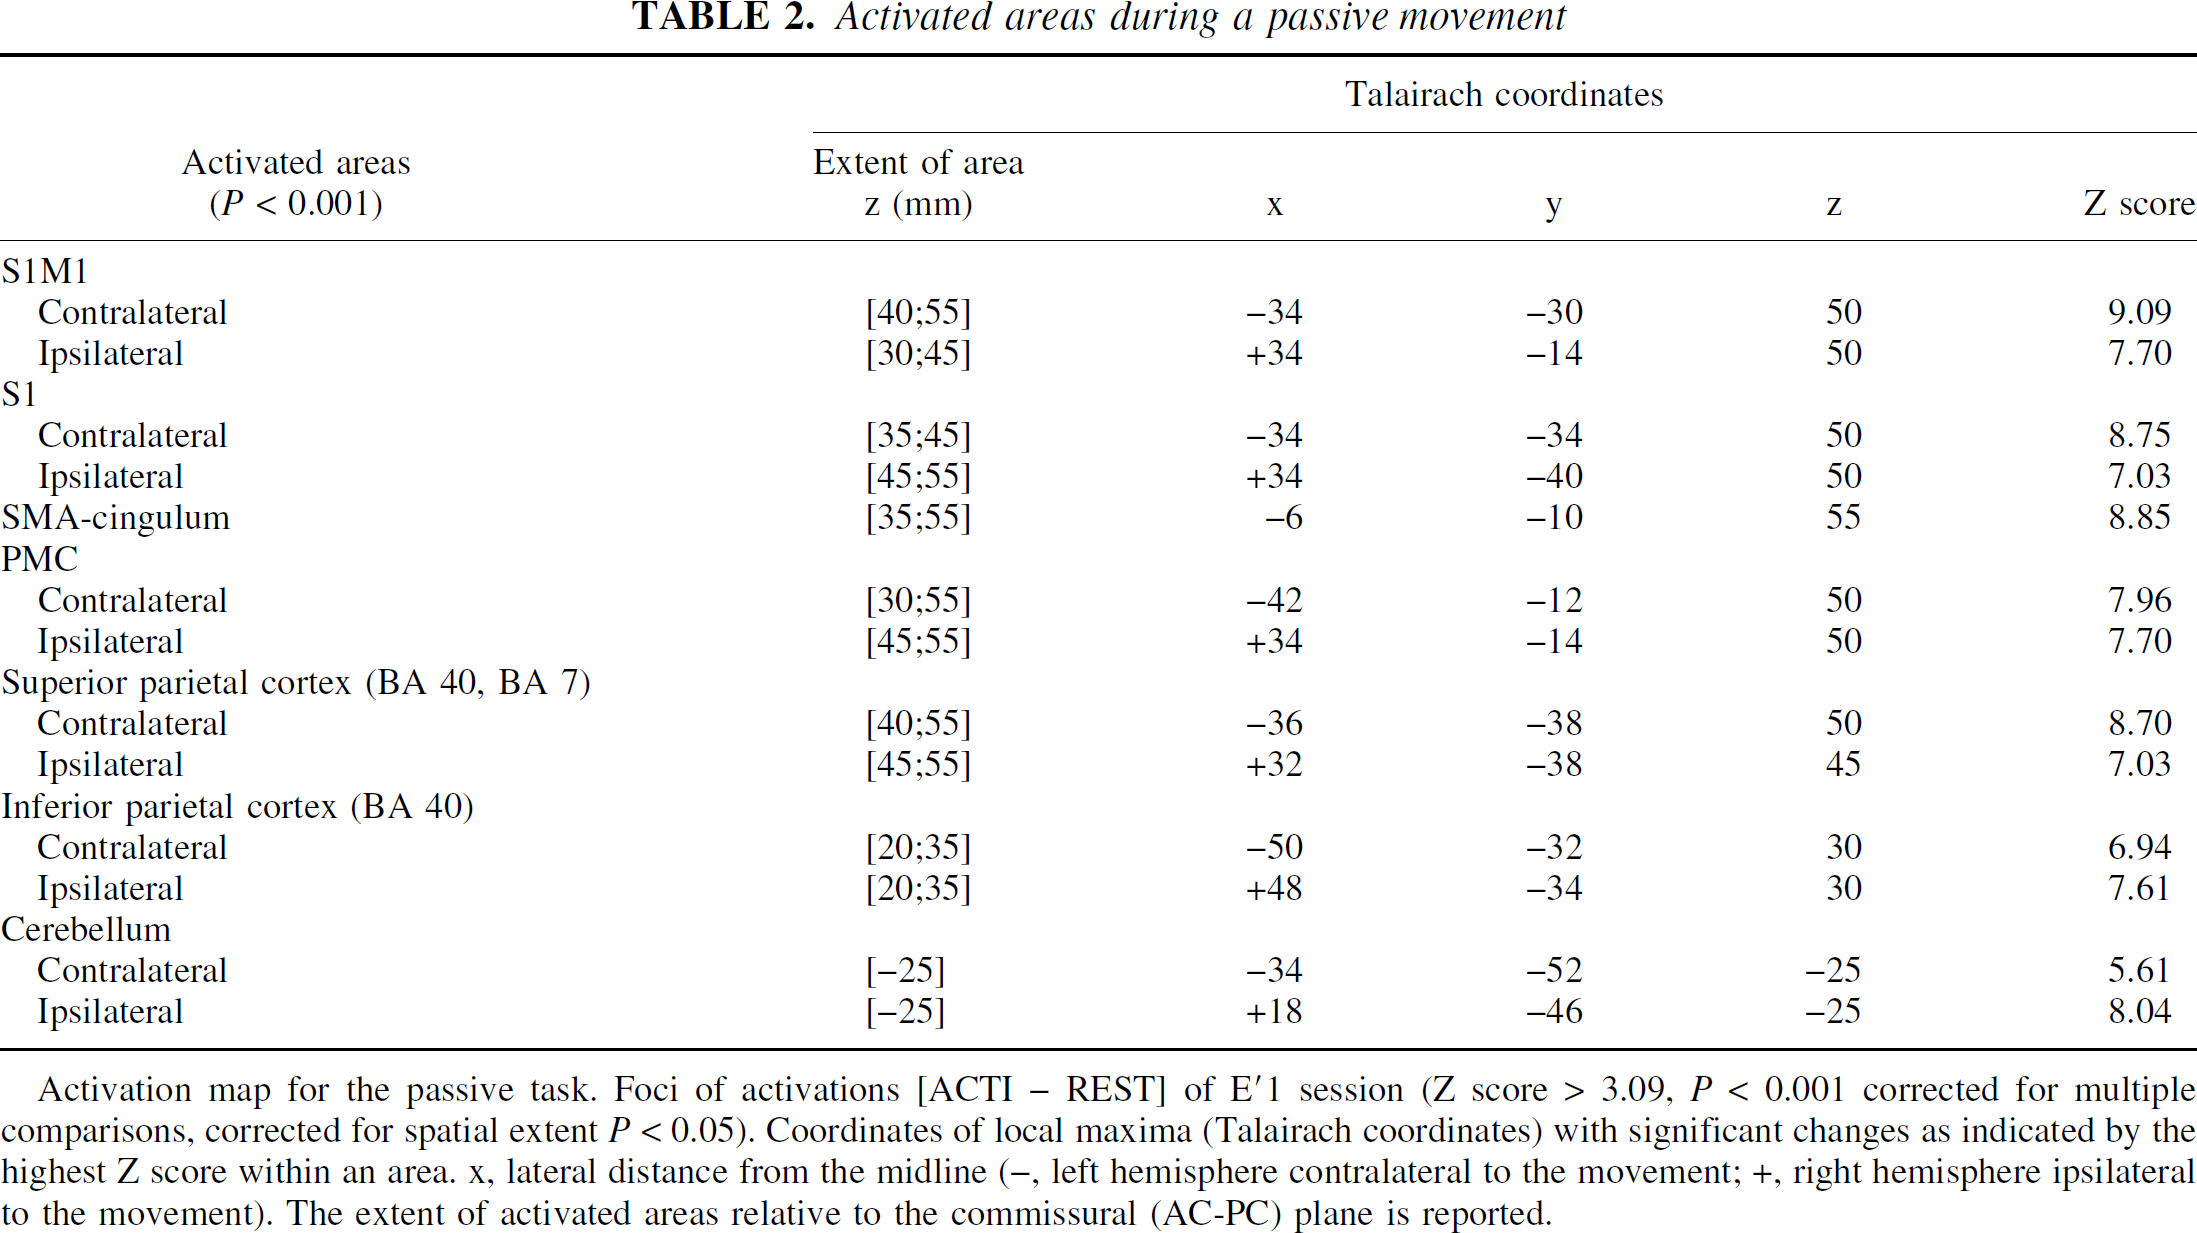
Activation map for the passive task. Foci of activations [ACTI – REST] of E'1 session (Z score > 3.09, P < 0.001 corrected for multiple comparisons, orrected for spatial extent P < 0.05). Coordinates of local maxima (Talairach coordinates) with significant changes as indicated by the highest Z score within an area. x, lateral distance from the midline (−, left hemisphere contralateral to the movement; +, right hemisphere ipsilateral to the movement). The extent of activated areas relative to the commissural (AC-PC) plane is reported.
Reproducibility
The mean variability of maximum peak location across subjects is given in Table 3. This intersubject variability assessed by the coefficient of variation was very low. Table 3 also shows the mean displacement of the maximum peak of the activated areas (S1M1, SMA, cerebellum) among subjects within and between sessions. Displacement was not statistically different for the active or passive task. It was very small, given the resolution of the functional images. Also, the intersession displacements were not bigger than intrasession ones.
Shift of the peak maximum in the activated areas
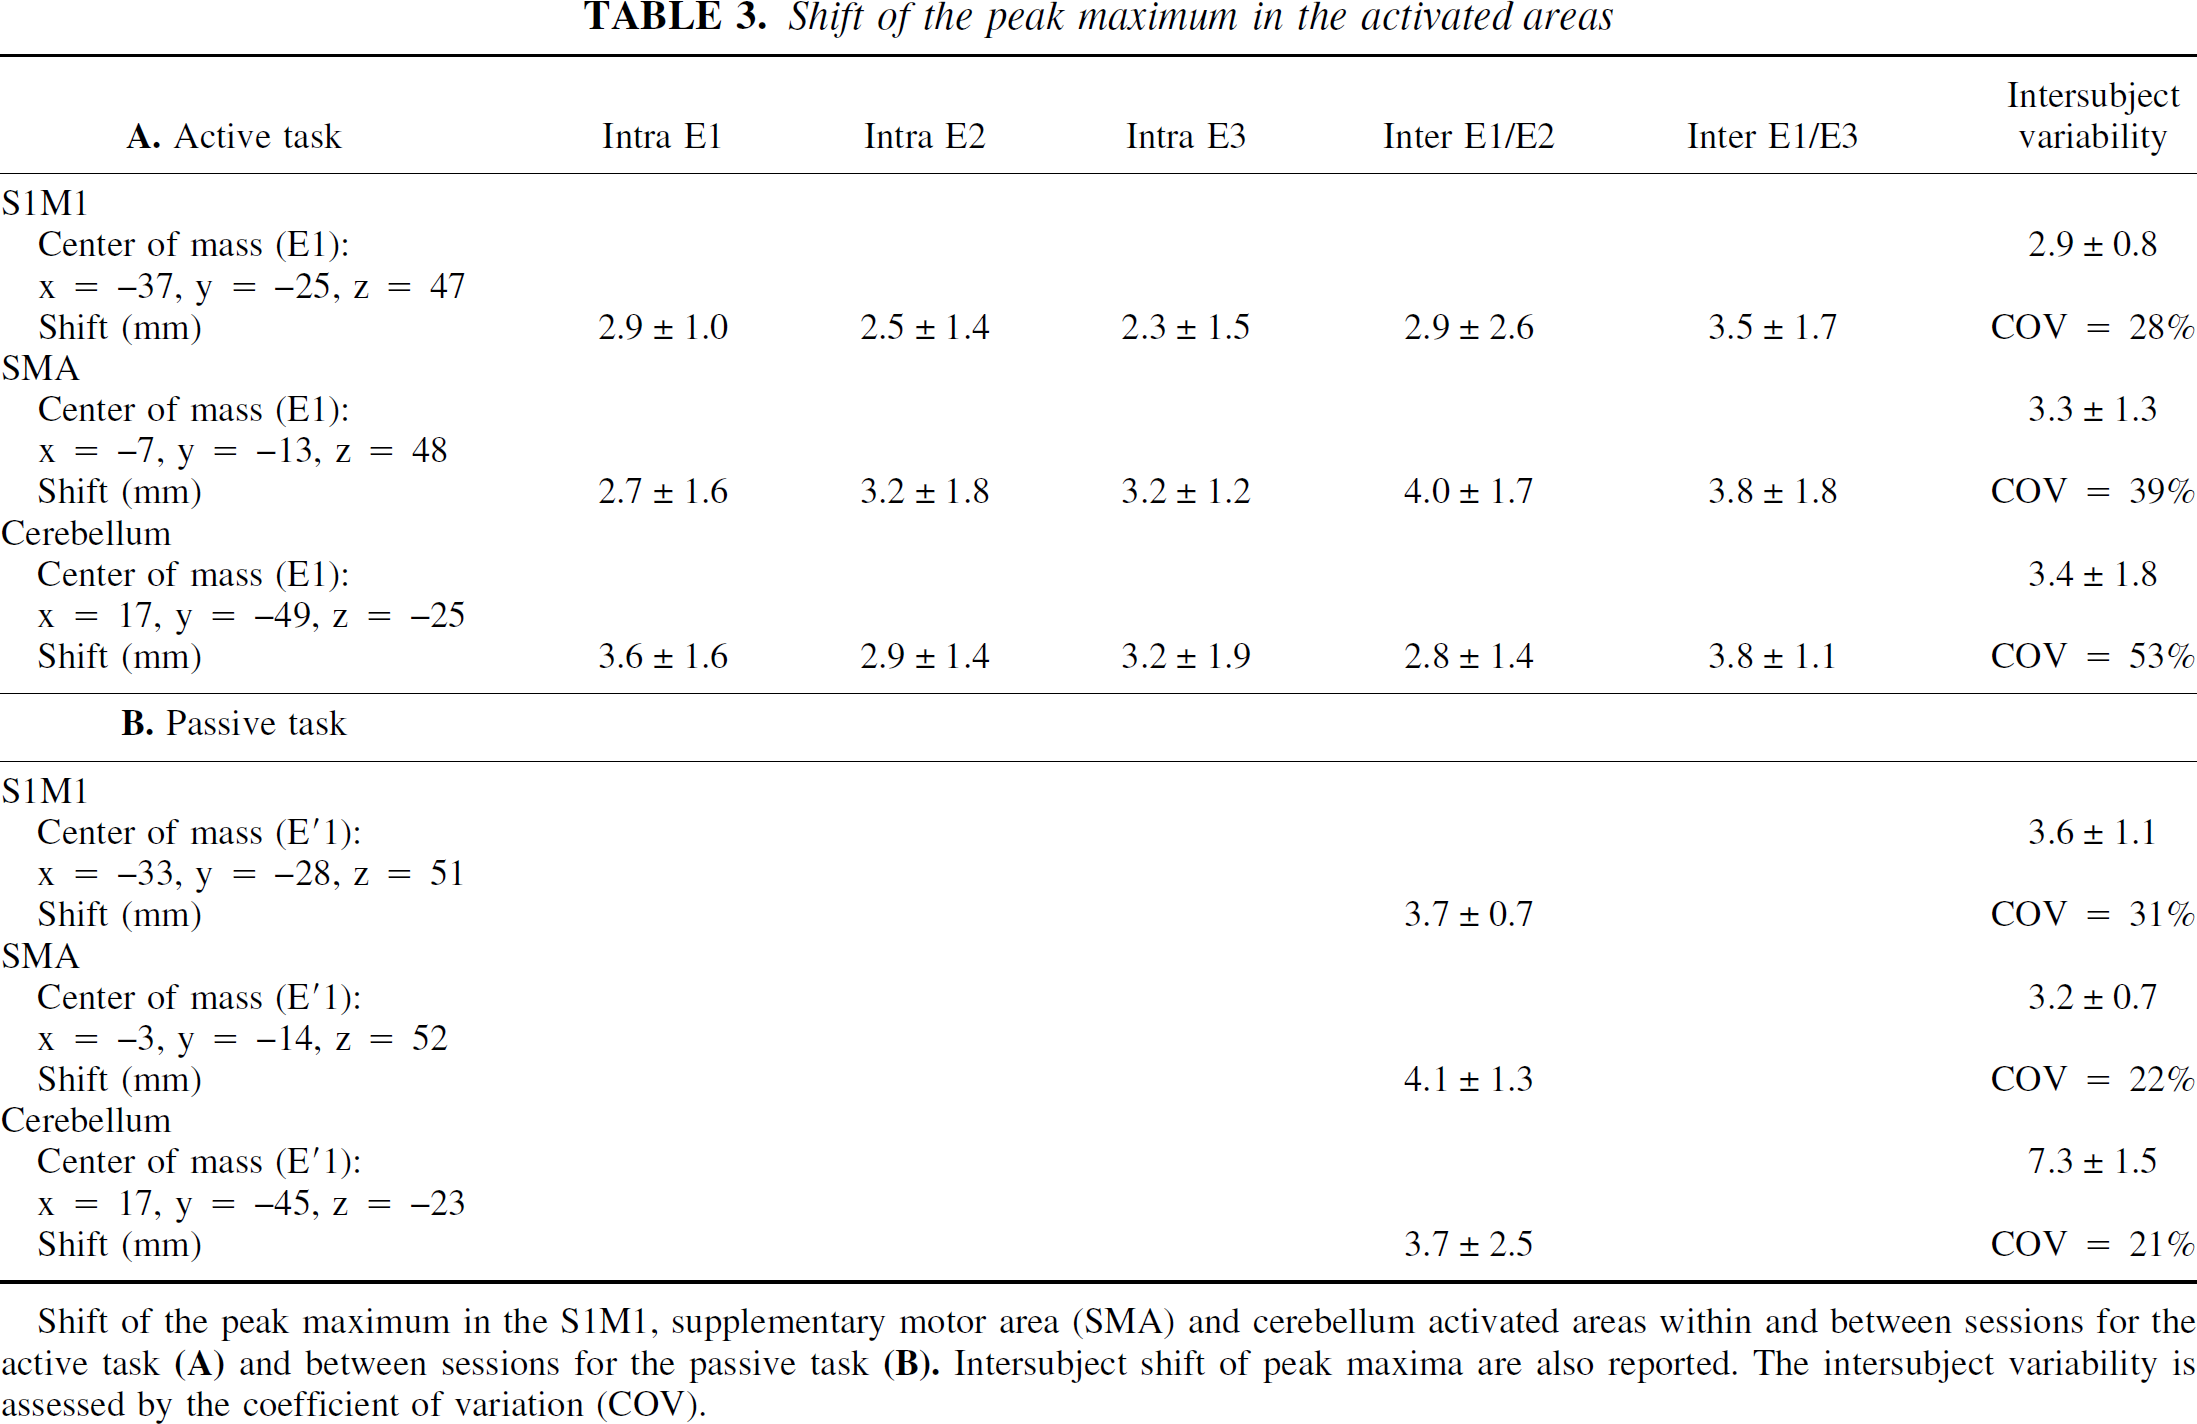
Shift of the peak maximum in the S1M1, supplementary motor area (SMA) and cerebellum activated areas within and between sessions for the active task
Z score and peak maximum integral (or peak maximum amplitude) of each activated area (for example, S1M1, SMA, cerebellum) of each subject were plotted. The intersubject variability of the activation intensity assessed by the coefficient of variation for the active and passive tasks was respectively 11% and 15% for the S1M1 cortex, 28% and 20% for the cerebellum, and 35% and 20% for the SMA. In the within-and between-session comparisons, no session or run effect was found. Thus, a good stability of fMRI activation was shown within sessions and between sessions for the active and passive tasks. This stability is illustrated in Fig. 3 for the S1M1 activated by the active task (group 1). This means that activation was reproducible within and between sessions at maximum peak whether signal level was high (that is, 2% in S1M1) or lower (that is, 1.5% in SMA or 1.3% in cerebellum). The unique exception was that Z scores were significantly reduced at E′2 compared with E′1 for S1M1 activated by the passive task (P < 0.03).
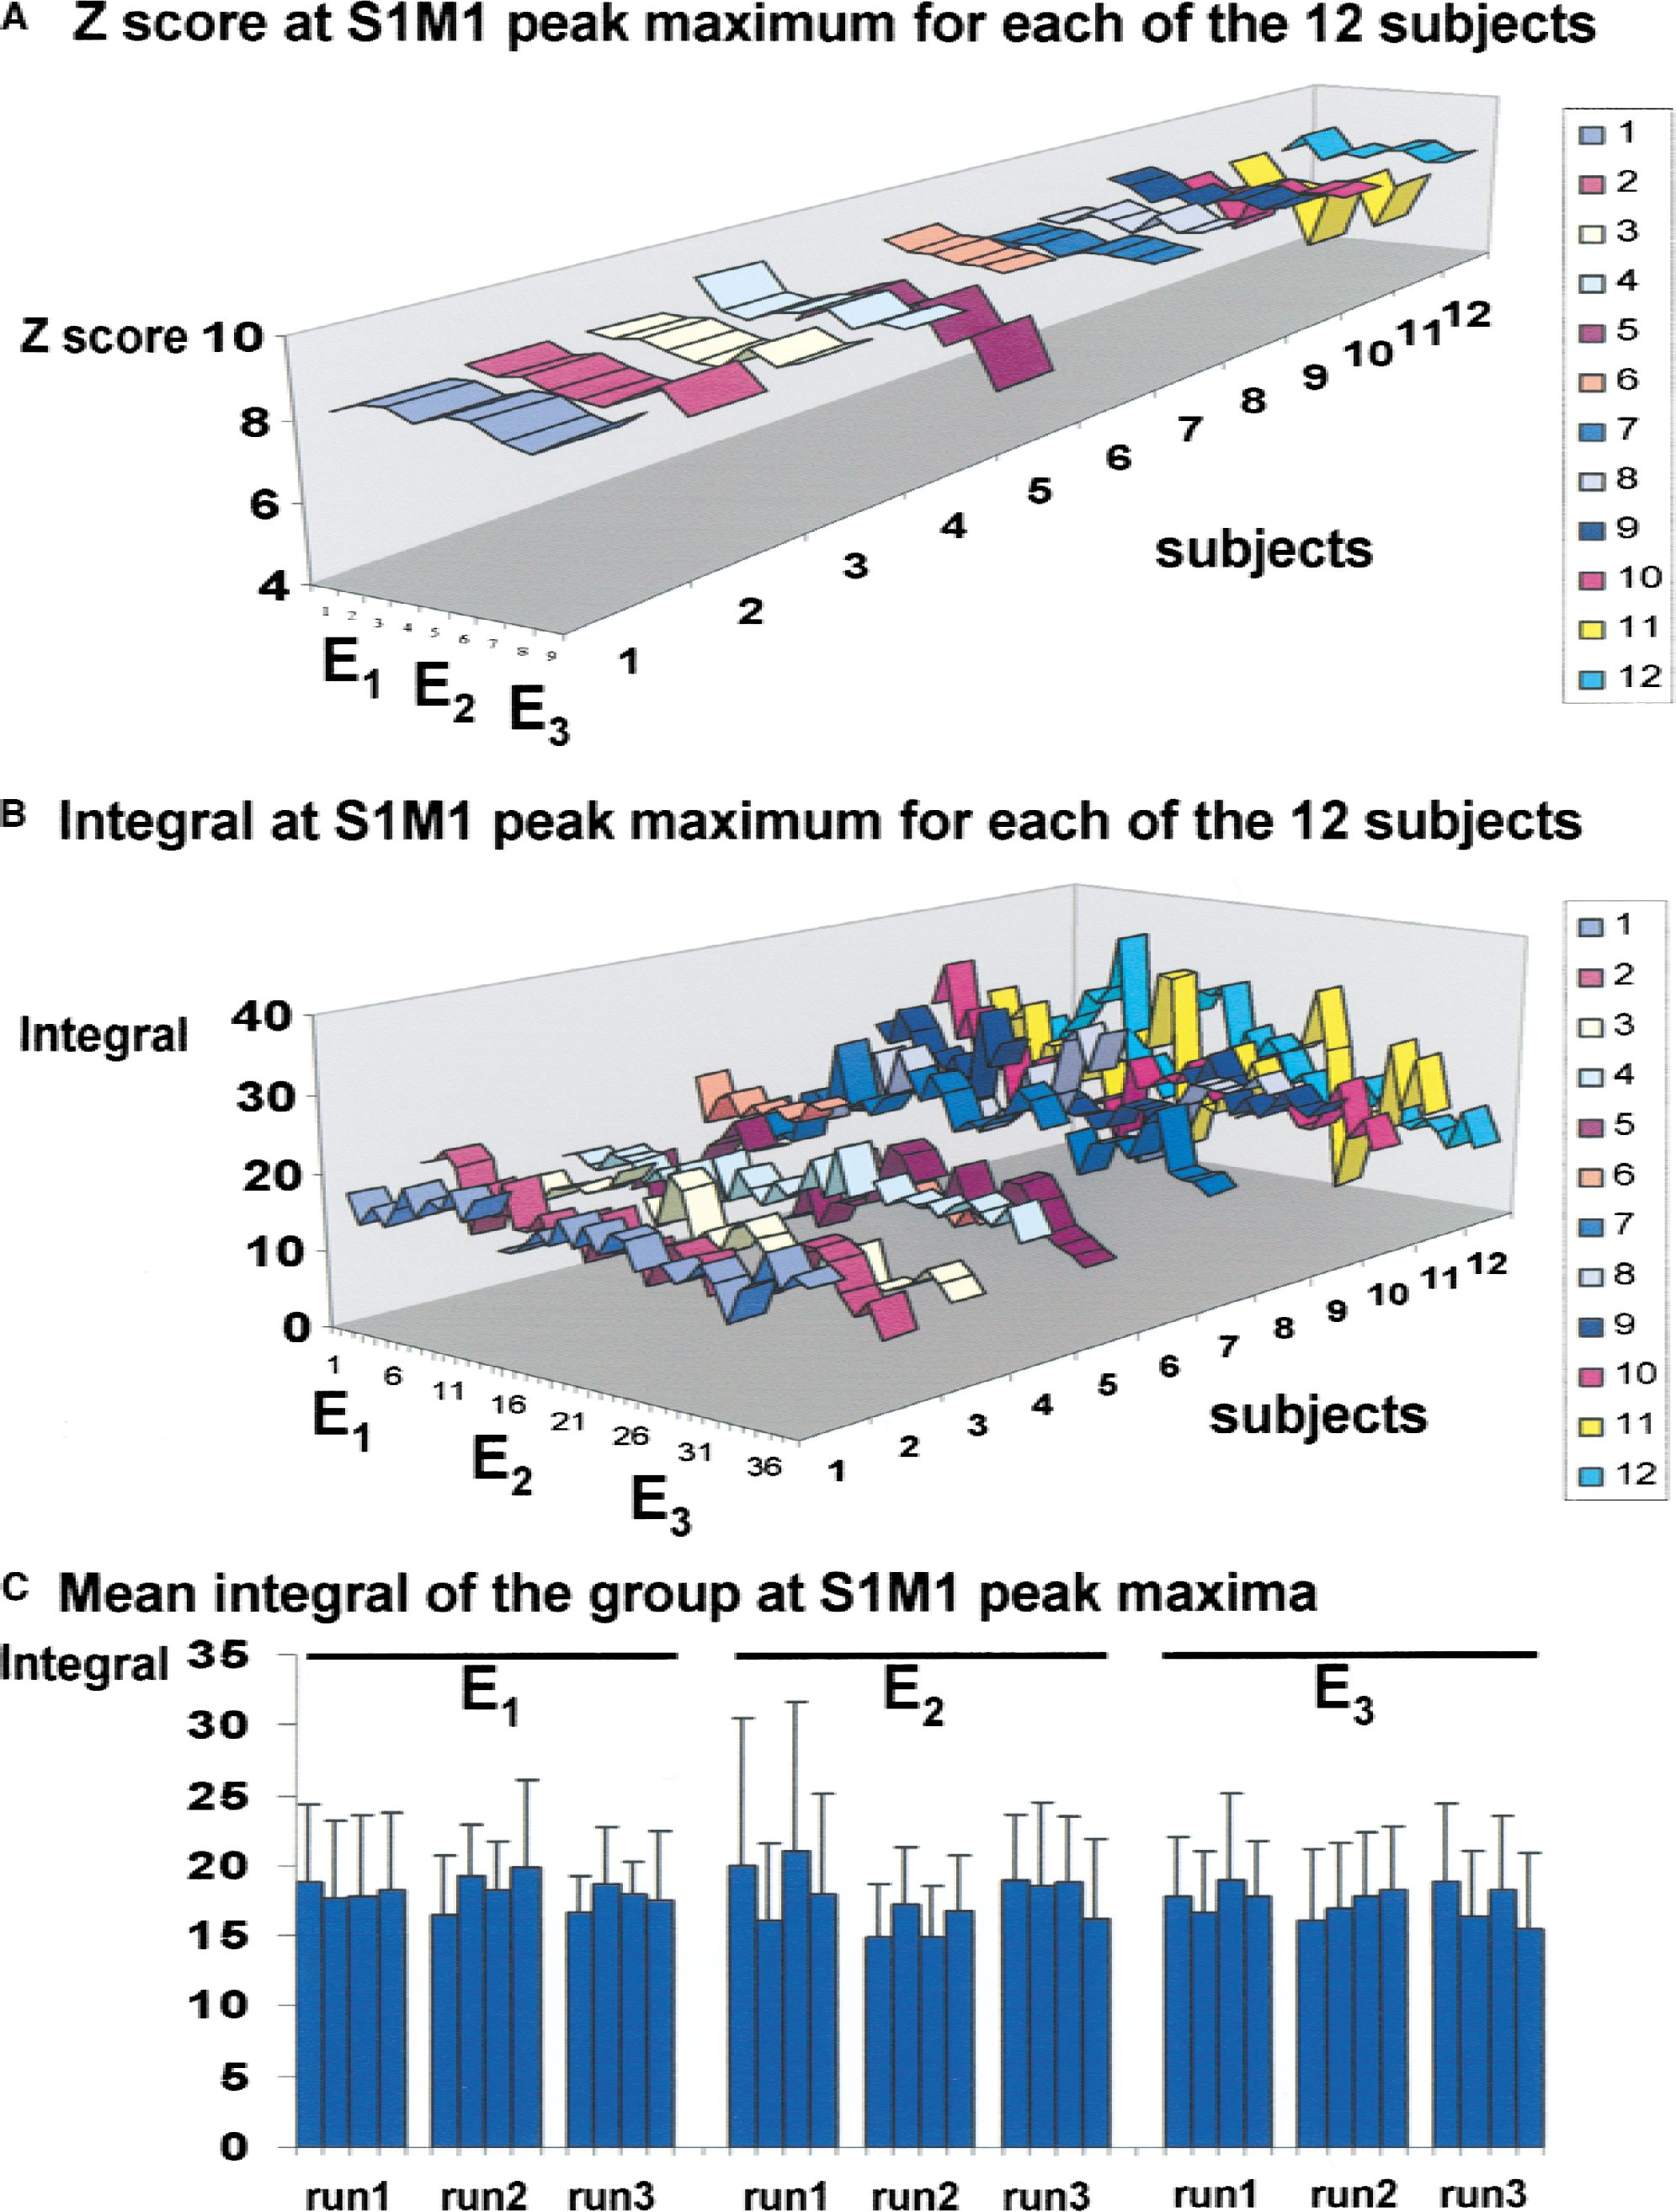
Patterns of the signal at peak maximum for each subject in left primary sensorimotor cortex (S1M1) showing good intra-and intersession reproducibility of the activation for the active task.
The authors further statistically tested the reproducibility of the fMRI activation through the whole brain within one session. Excellent intrasession reproducibility of the fMRI signal was found when naïve-MRI subjects performed the active or passive tasks whether it was the first, second, or third session.
The analysis of variance performed on the size of the activated area in the contralateral sensorimotor cortex measured over the three runs with the active task for sessions E1, E2, and E3 did not show a significant difference and thus showed no run effect. On the whole, these data showed excellent individual or group within-session reproducibility of the fMRI BOLD signal.
Interaction between session and movement: test–retest effect
Significant evoked signal intensity changes were observed between sessions in specific areas. Mainly, for the group analysis, the test–retest effect between the first and second fMRI sessions resulted in an increase of activation in the contralateral premotor cortex (PMC) and in a restricted region located at the border of the activated ipsilateral anterior cerebellar cortex, whereas a decrease of activation was observed at the supratentorial cortical level (contralateral S1M1, posterior SMA and posterior cingulum, parietal cortex) (Fig. 4, Table 4). Similar results were found for the active or passive tasks. Figure 5 shows the individual patterns of the activation that significantly changed in the anterior cerebellum and in S1M1 at the second session for the group analysis. Most of the subjects experienced these effects, validating the notion that the clusters given as statistically significant by the group analysis do not arise from a random effect but indicate a common feature between subjects. Similarly, all significant clusters were verified. When the group of 12 subjects performing the active task was split at random into two groups of 6, and when this test–retest effect was considered, no statistical difference was found between the test–retest effect of the two groups. This statistic again validated that such a test–retest effect existed and was reproducible among groups of subjects.
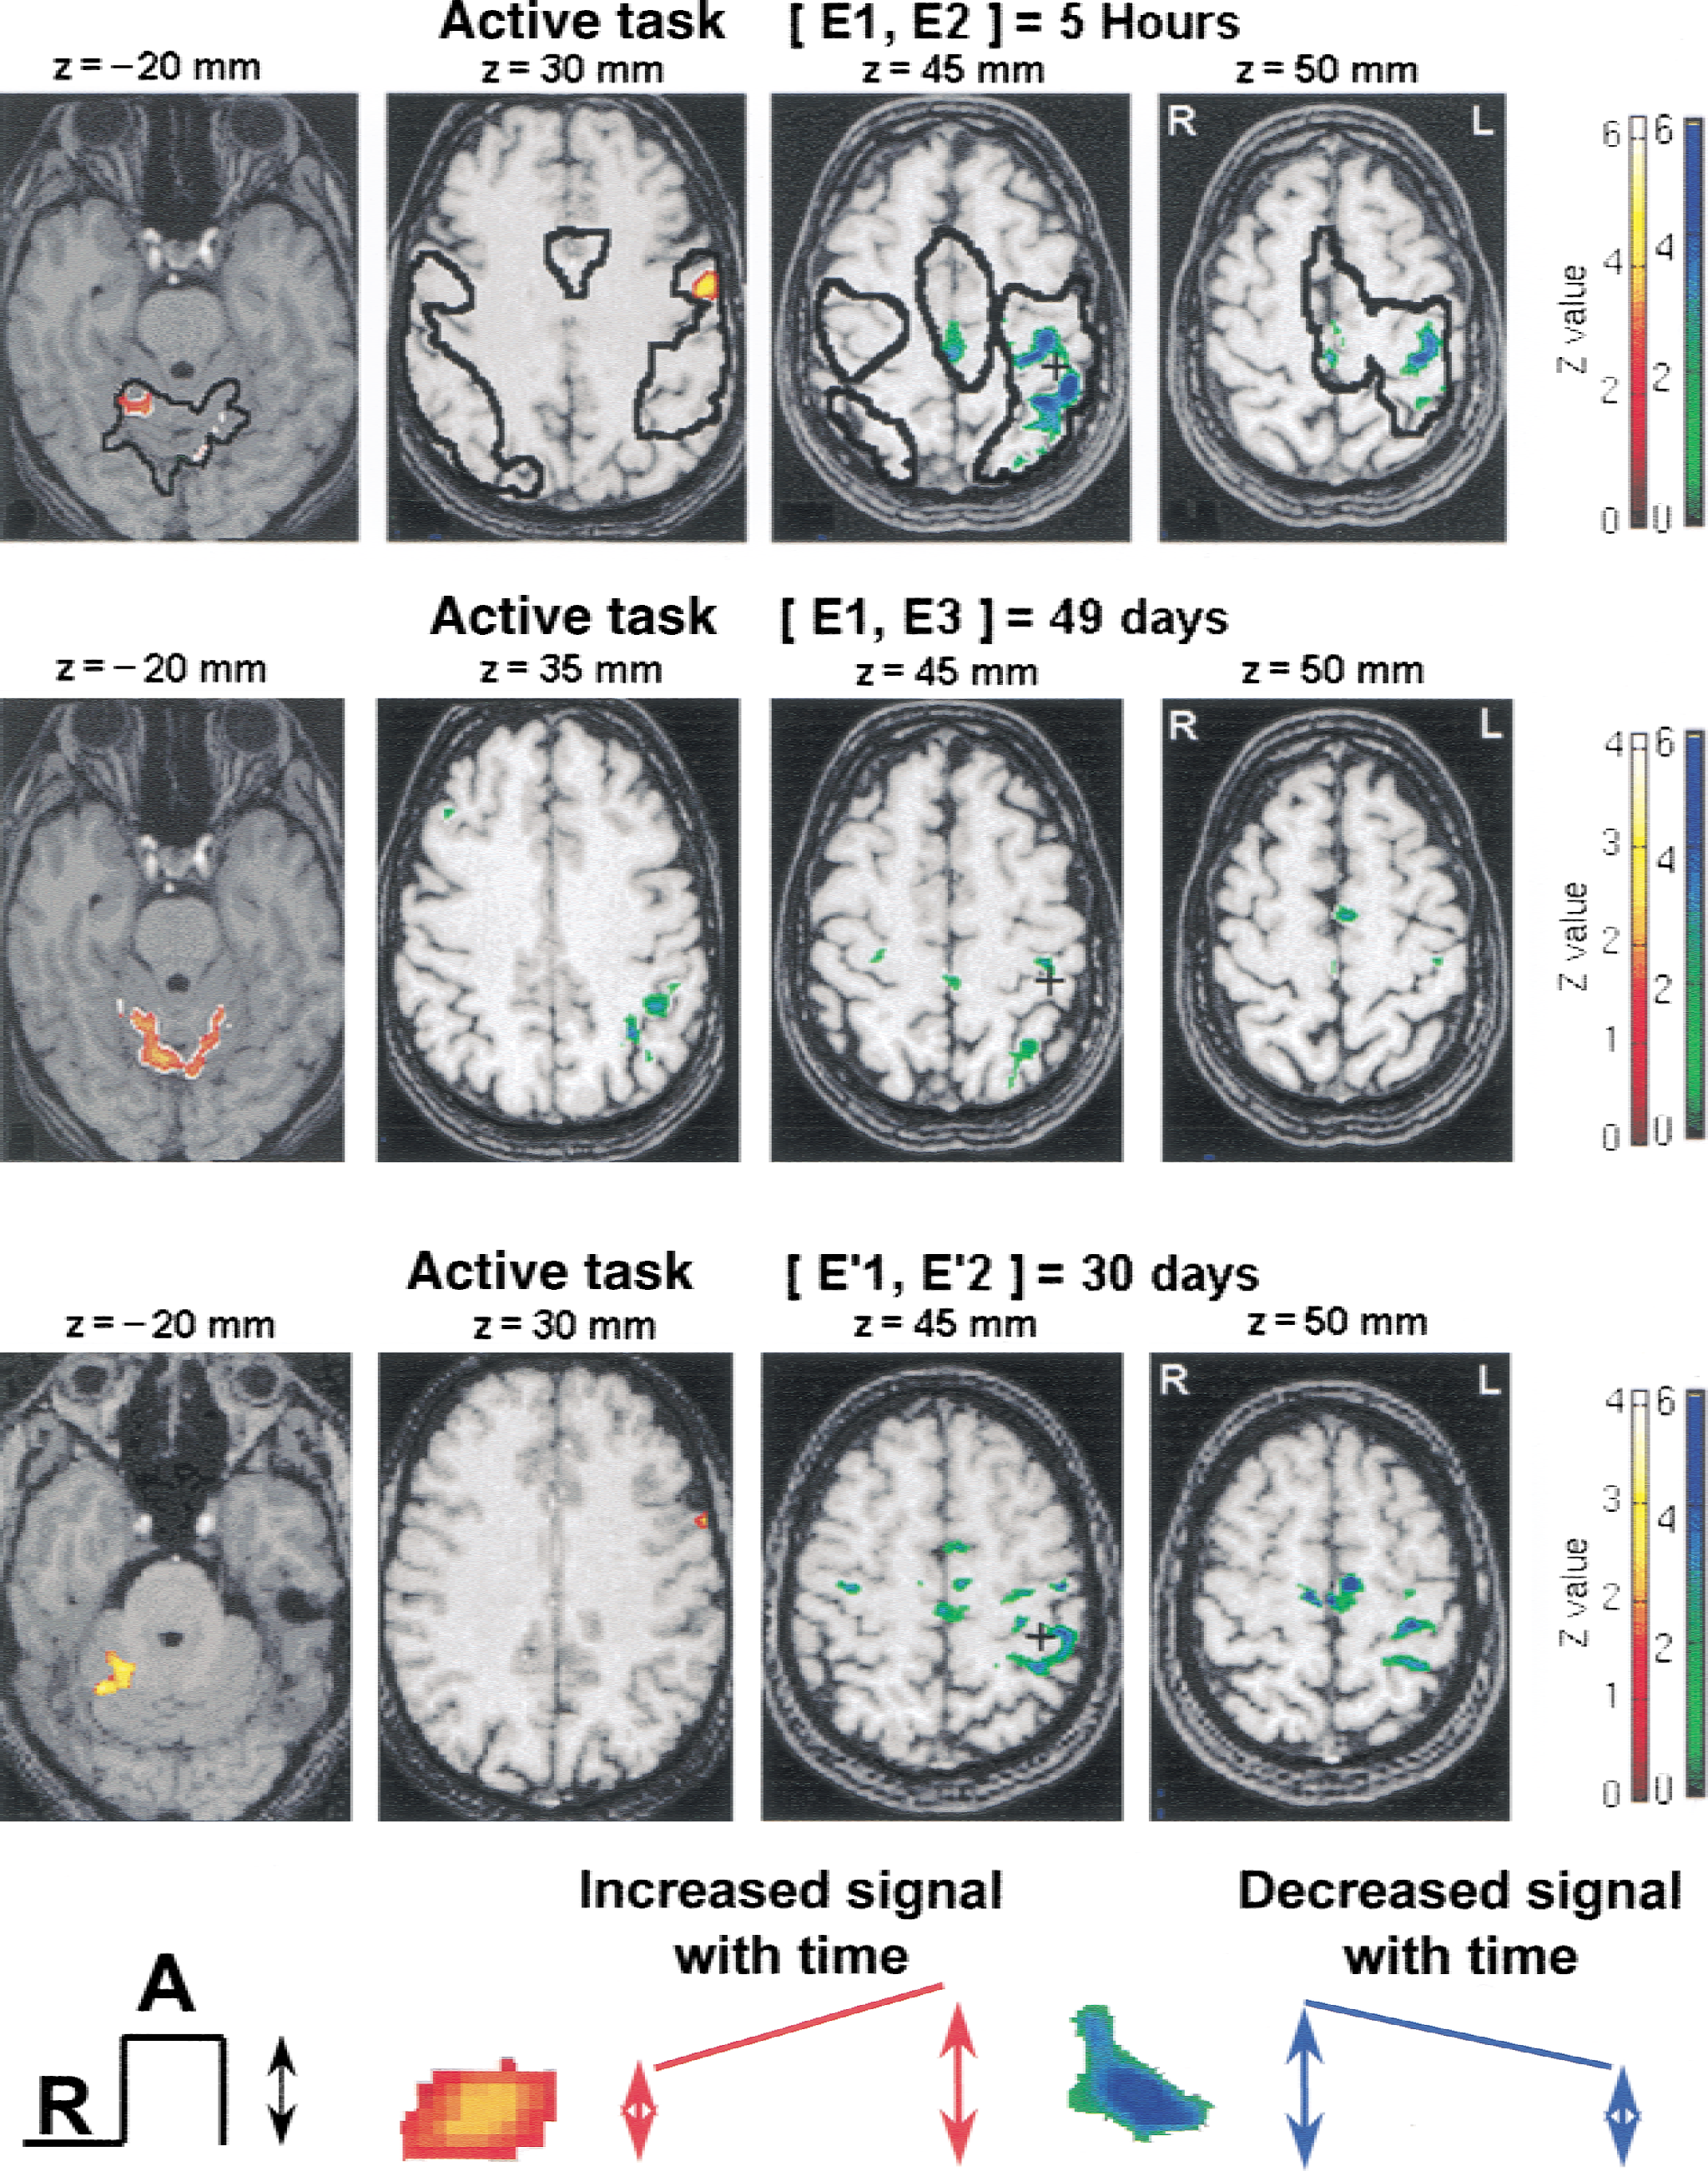
Comparisons of activations [ACTI − REST] between sessions superimposed on T1-weighted magnetic resonance images (Z score > 1.69;P < 0.05 uncorrected and corrected for spatial extent). A corresponding Z score bar is provided. Four transaxial images of −20, 30, 45, and 50 mm under and above the anterior–posterior commissural line are shown. The left side of the figure corresponds to the right hemisphere. Areas of activation E1 are outlined on the images of the first row. Note that a large increase in signal intensity (red-yellow clusters) occurred in a restricted area of the ipsilateral cerebellar cortex and in the premotor cortex and also that a parallel large reduction of signal intensity (green-blue clusters) occurred in primary and secondary motor cortices. All the other areas inside the contours provided a reproducible signal.
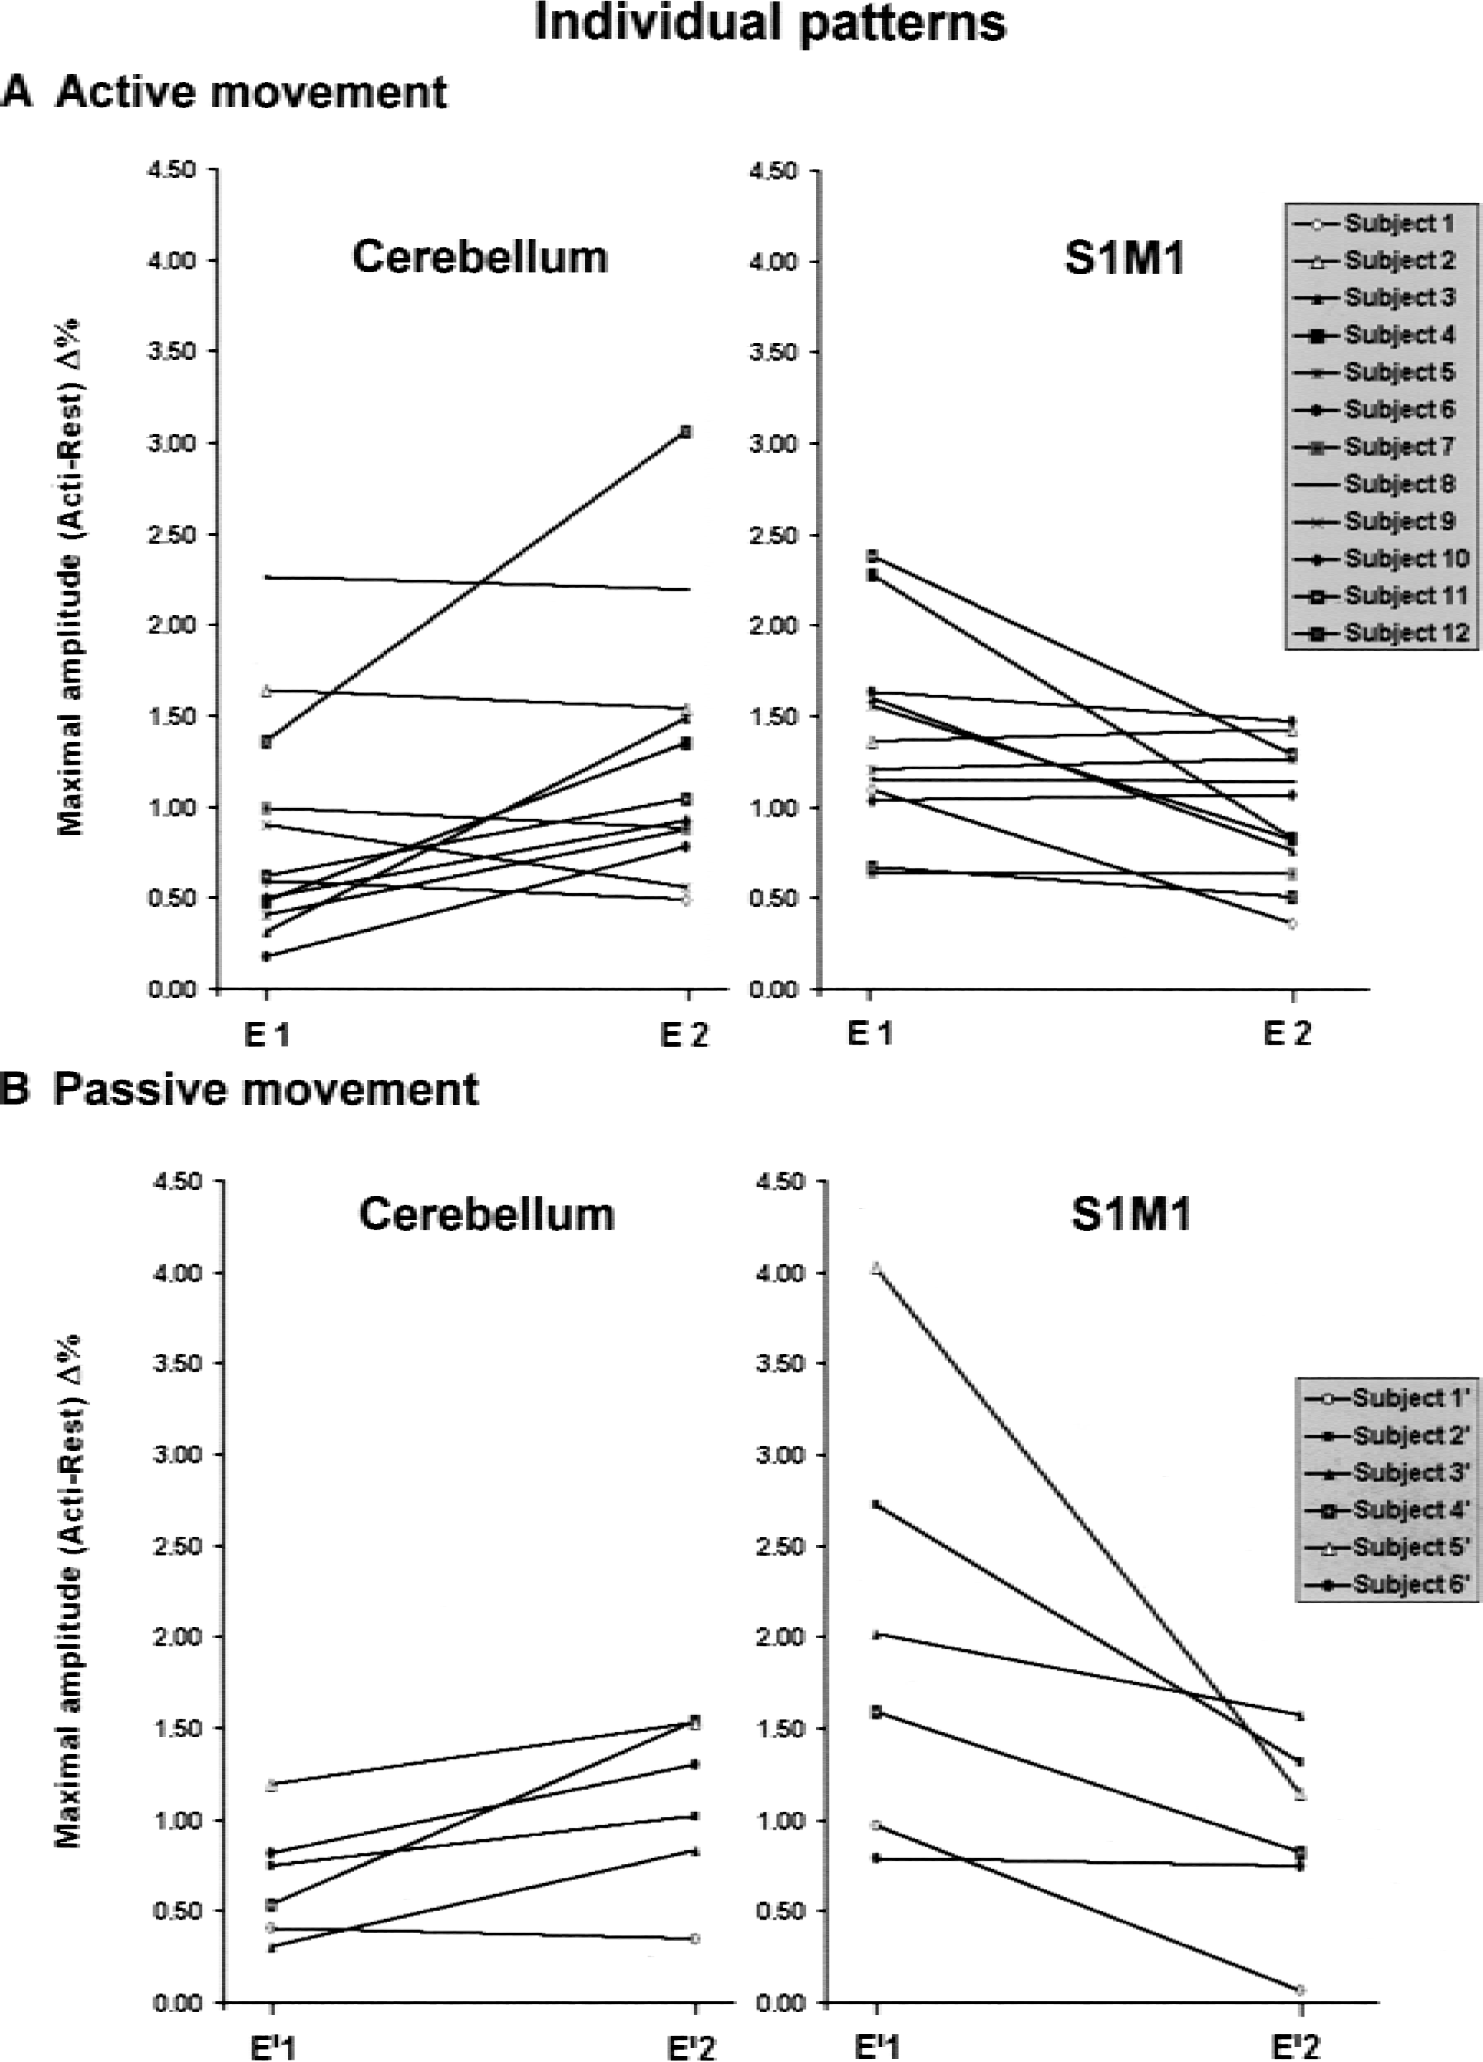
Individual patterns for the active task
This test–retest effect was observed whether the delay period between the first and the second sessions was 5 hours, or 1 or 2 months. These changes persisted after 2 months in some regions (E3) (Fig. 4). They were less significant at E3 in most parts: in the borders of the activated S1M1 (Figs. 4 and 6), the SMA, the superior left parietal cortex (BA 40, BA 7) and the left PMC, whereas they consolidated at E3 in the left inferior parietal cortex (BA 40) (Fig. 6). In the cerebellum, the increase seen at E2 in the ipsilateral anterior cerebellar cortex seemed to shift to the vermis and the contralateral side at E3 (Fig. 4;Tables 4 and 5).
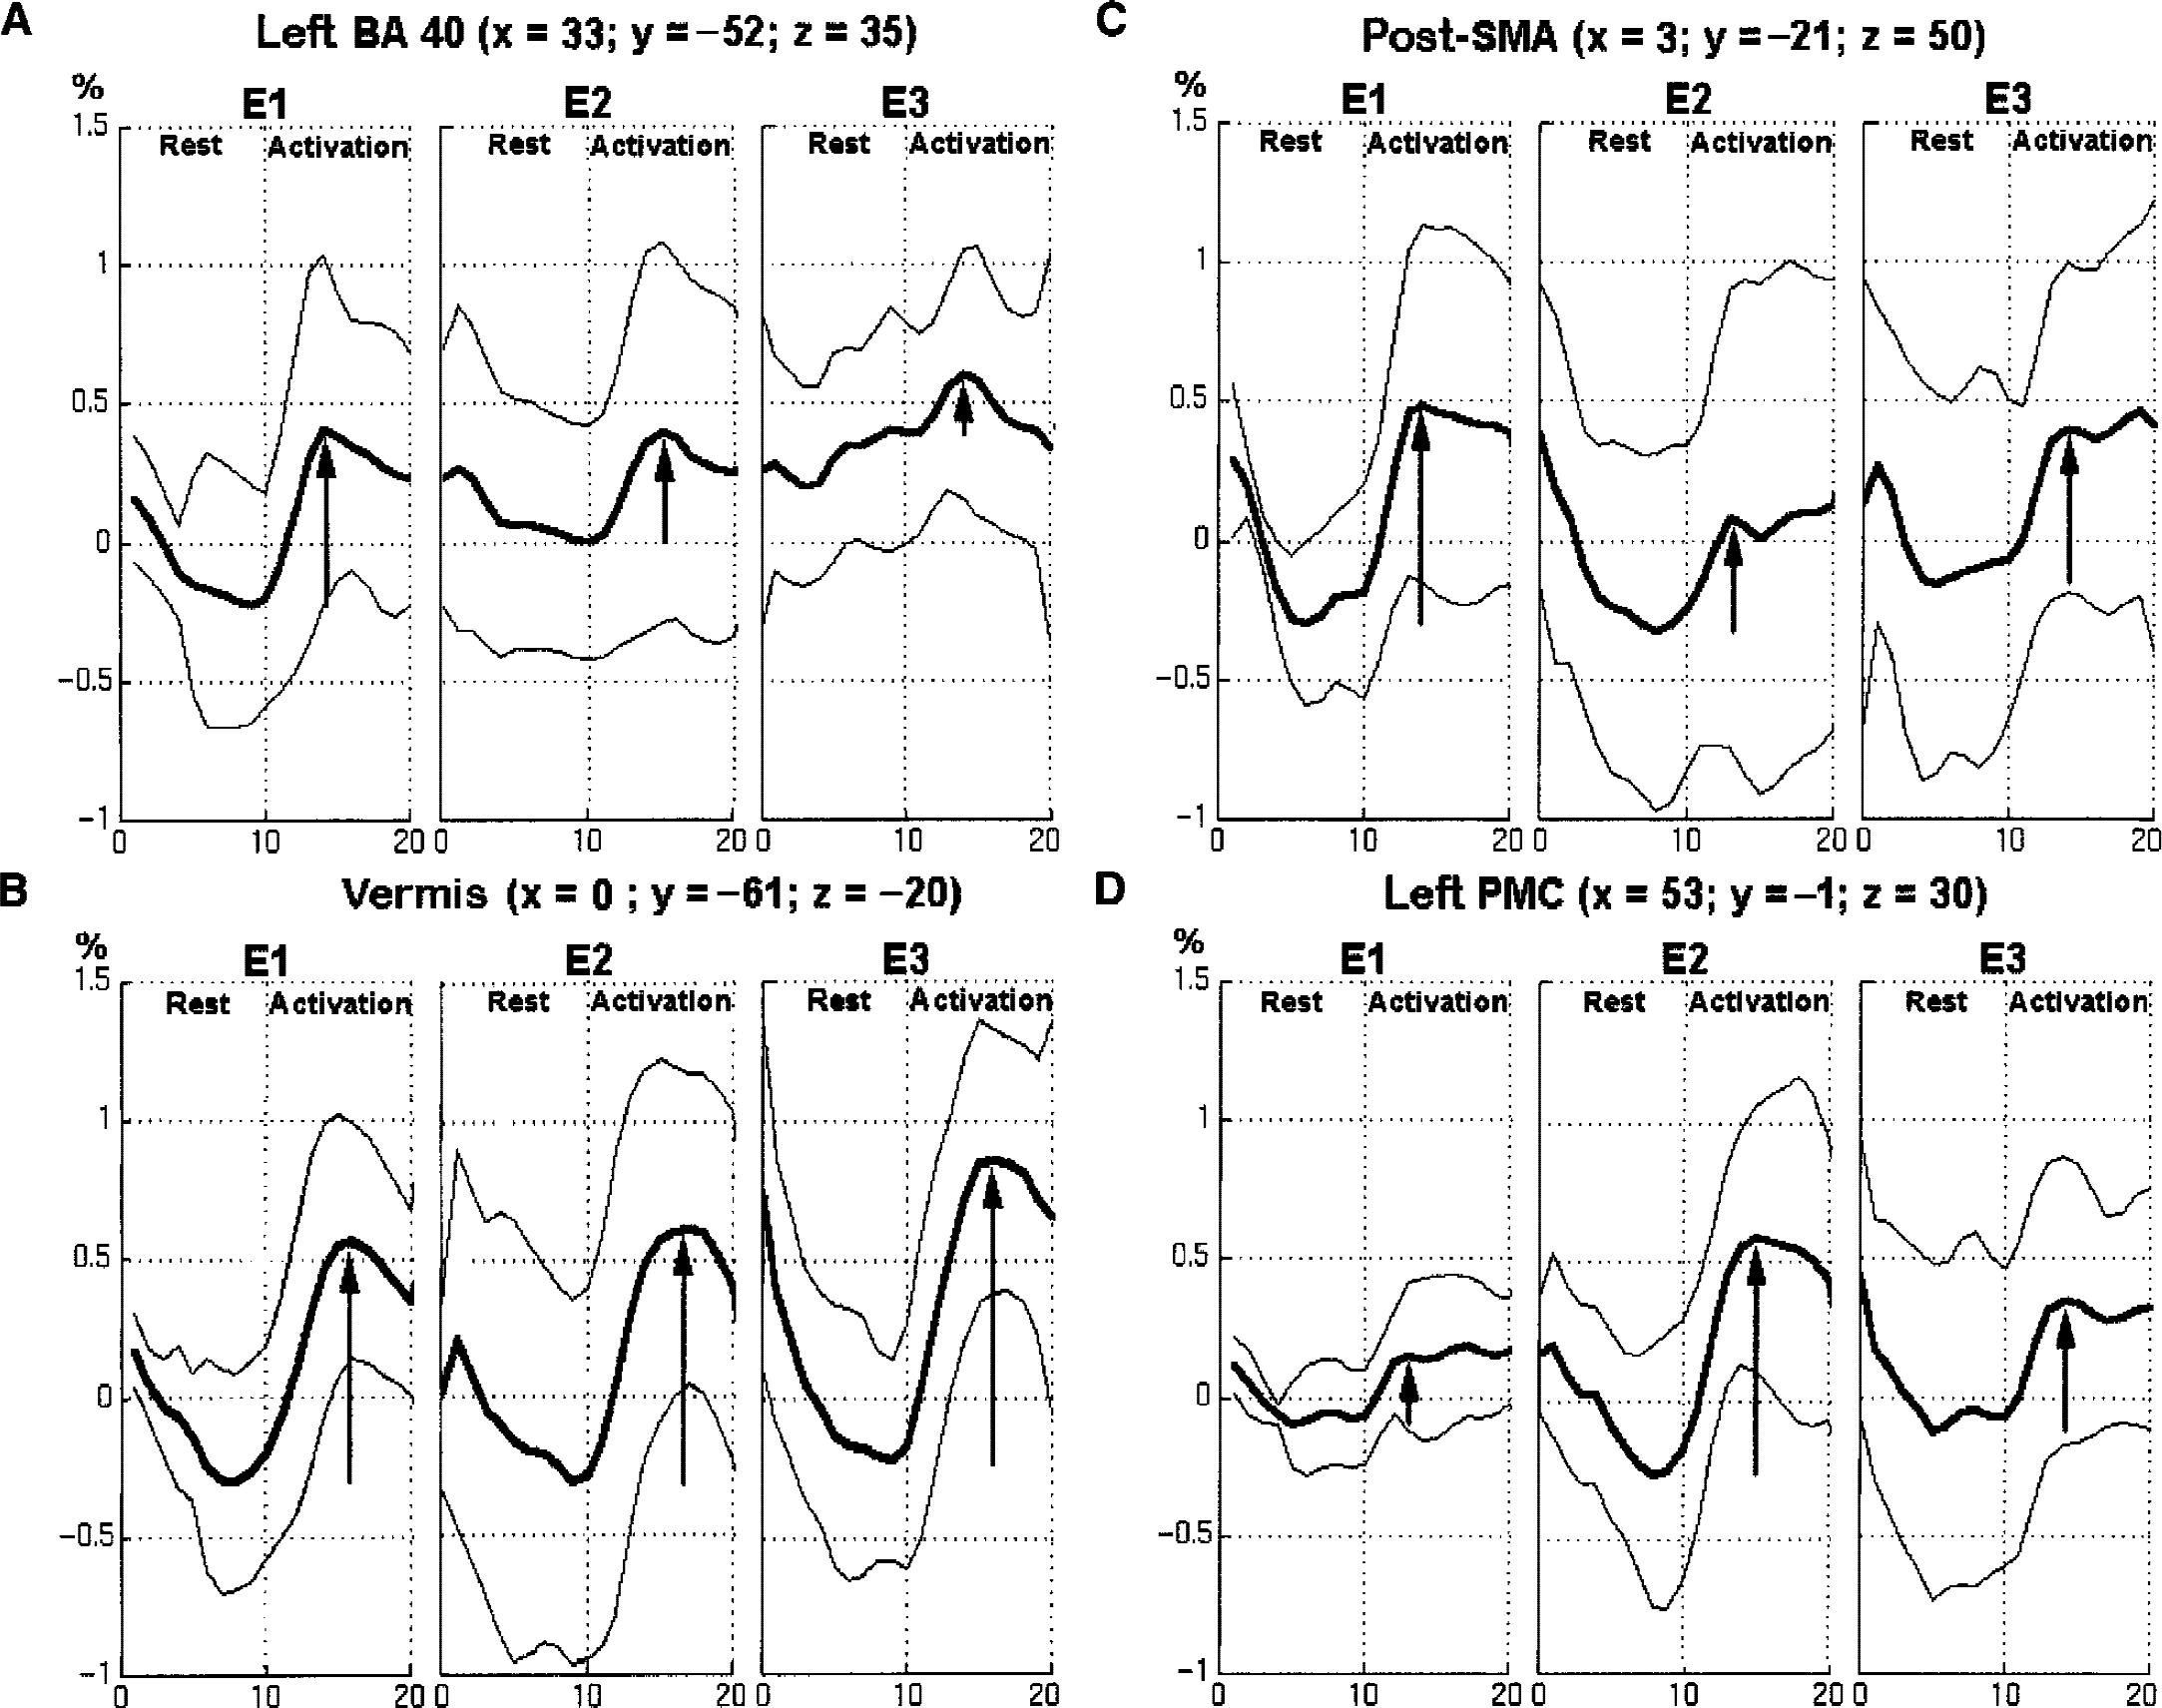
Four different patterns of the mean activation signal changes for the 12 subjects between E1, E2, and E3.
Time effect between E1 and E2 and between E1 and E3 during an active movement
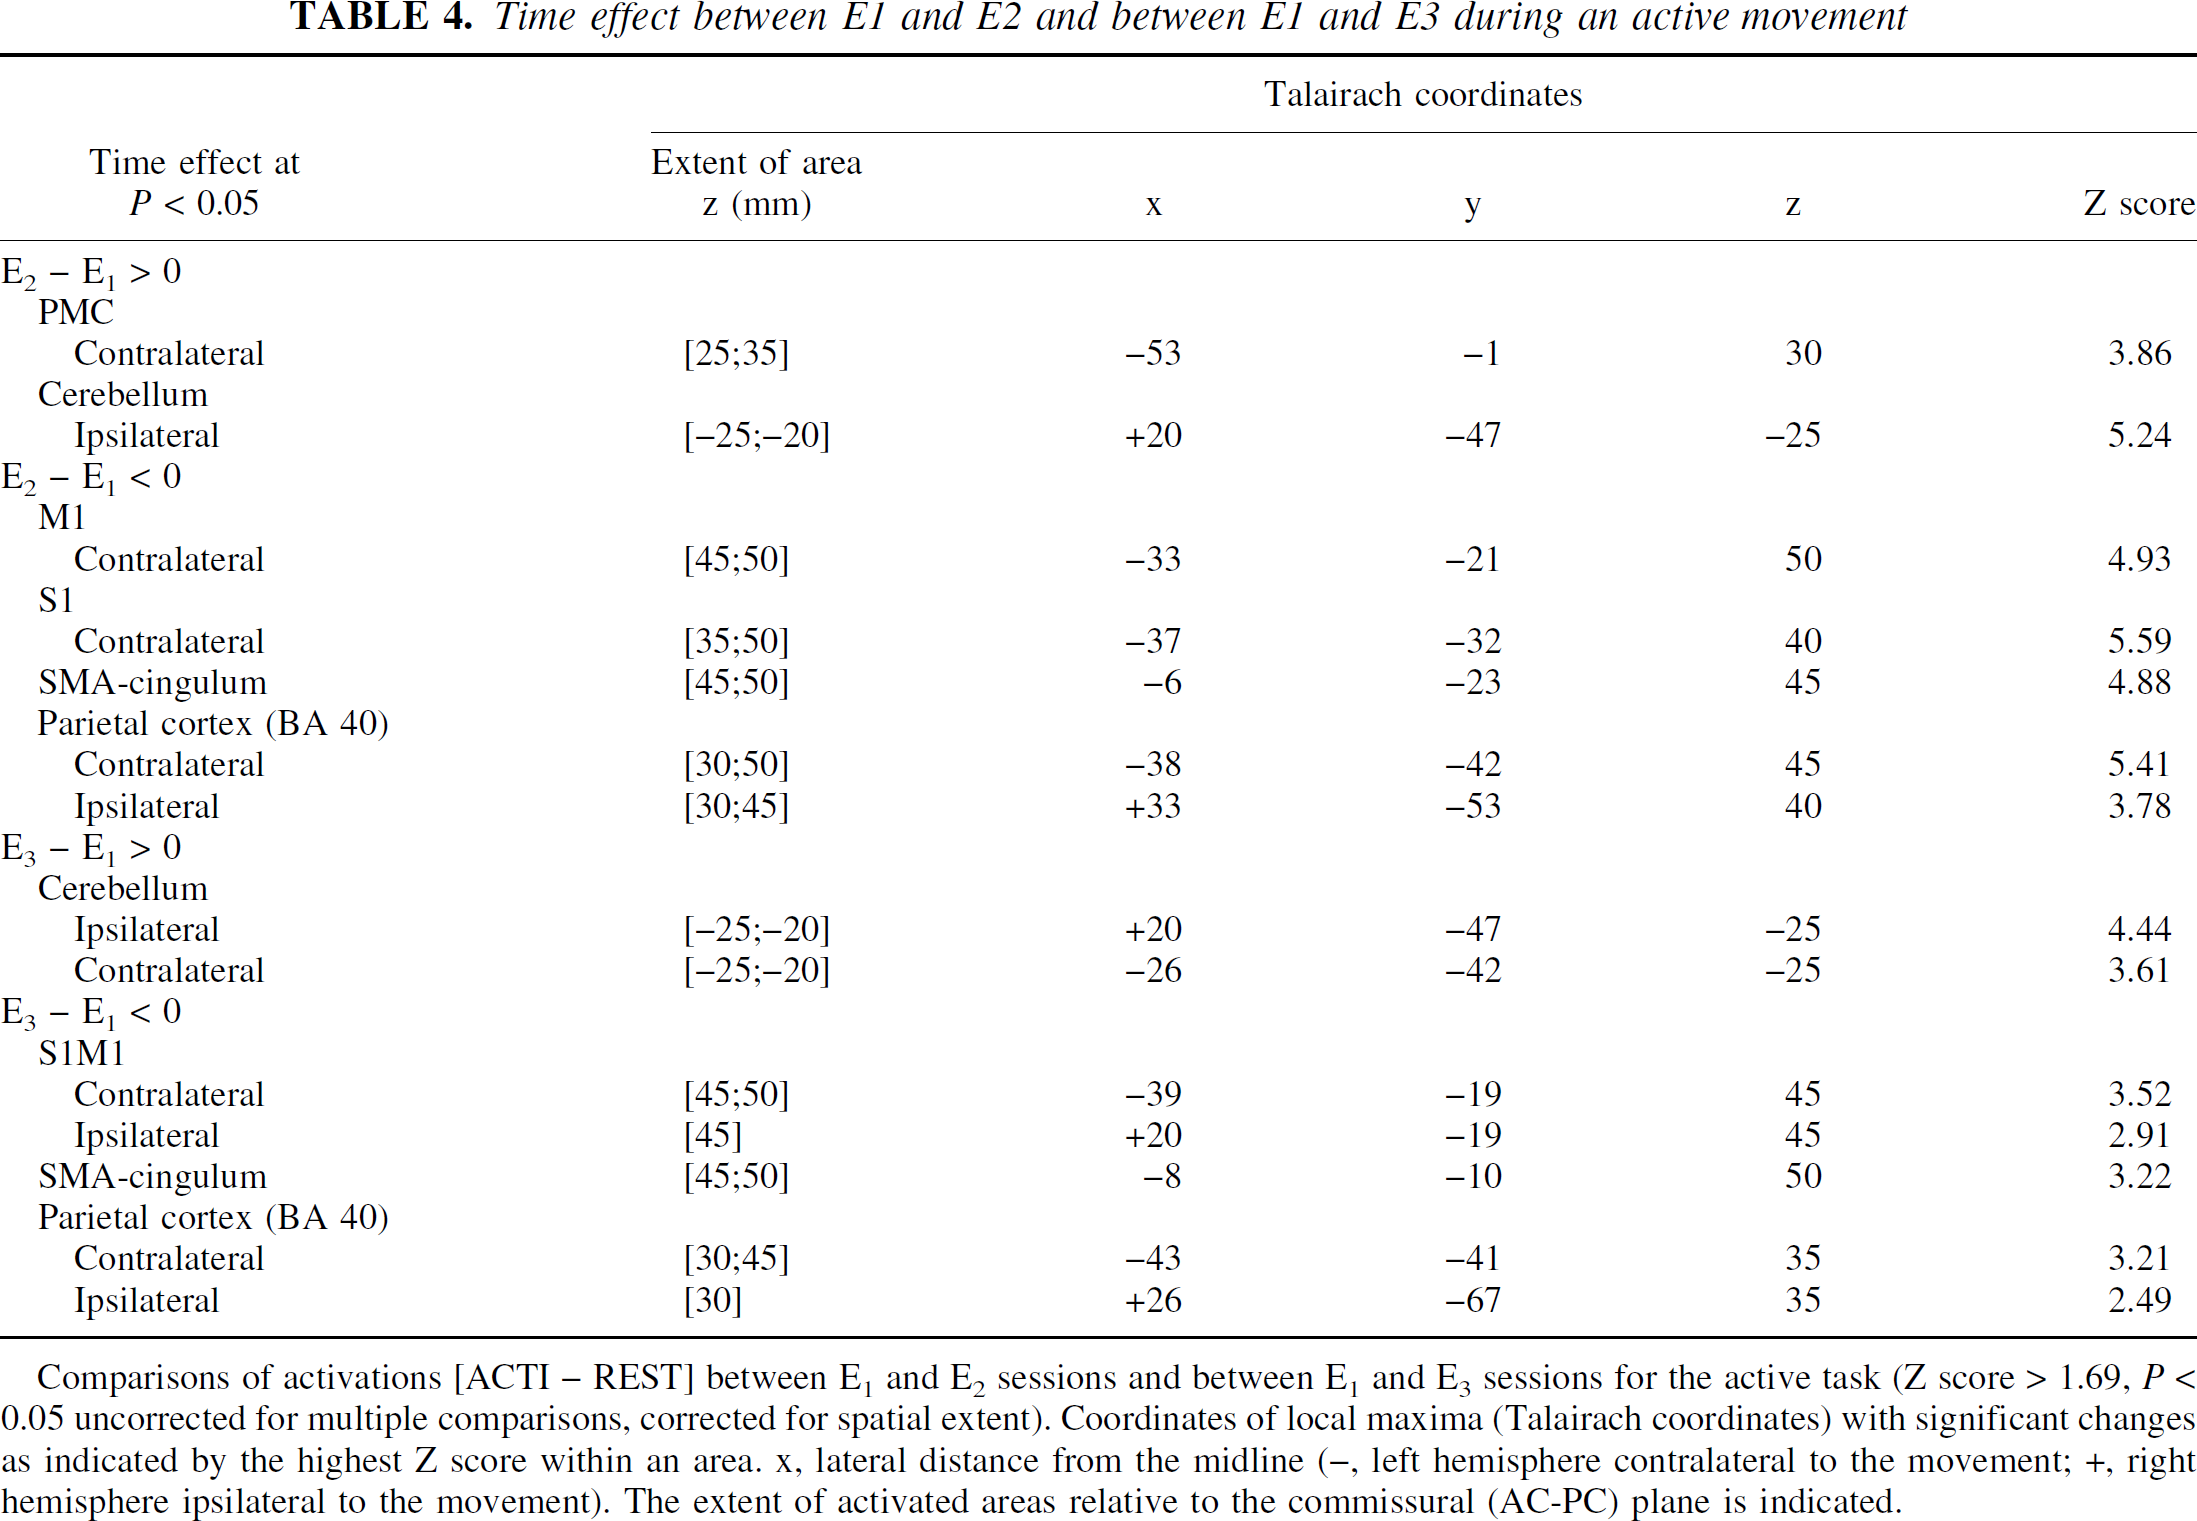
Comparisons of activations [ACTI – REST] between E1 and E2 sessions and between E1 and E3 sessions for the active task (Z score > 1.69, P < 0.05 uncorrected for multiple comparisons, corrected for spatial extent). Coordinates of local maxima (Talairach coordinates) with significant changes as indicated by the highest Z score within an area. x, lateral distance from the midline (−, left hemisphere contralateral to the movement; +, right hemisphere ipsilateral to the movement). The extent of activated areas relative to the commissural (AC-PC) plane is indicated.
Time effect between E′ 1 and E′ 2 during a passive movement
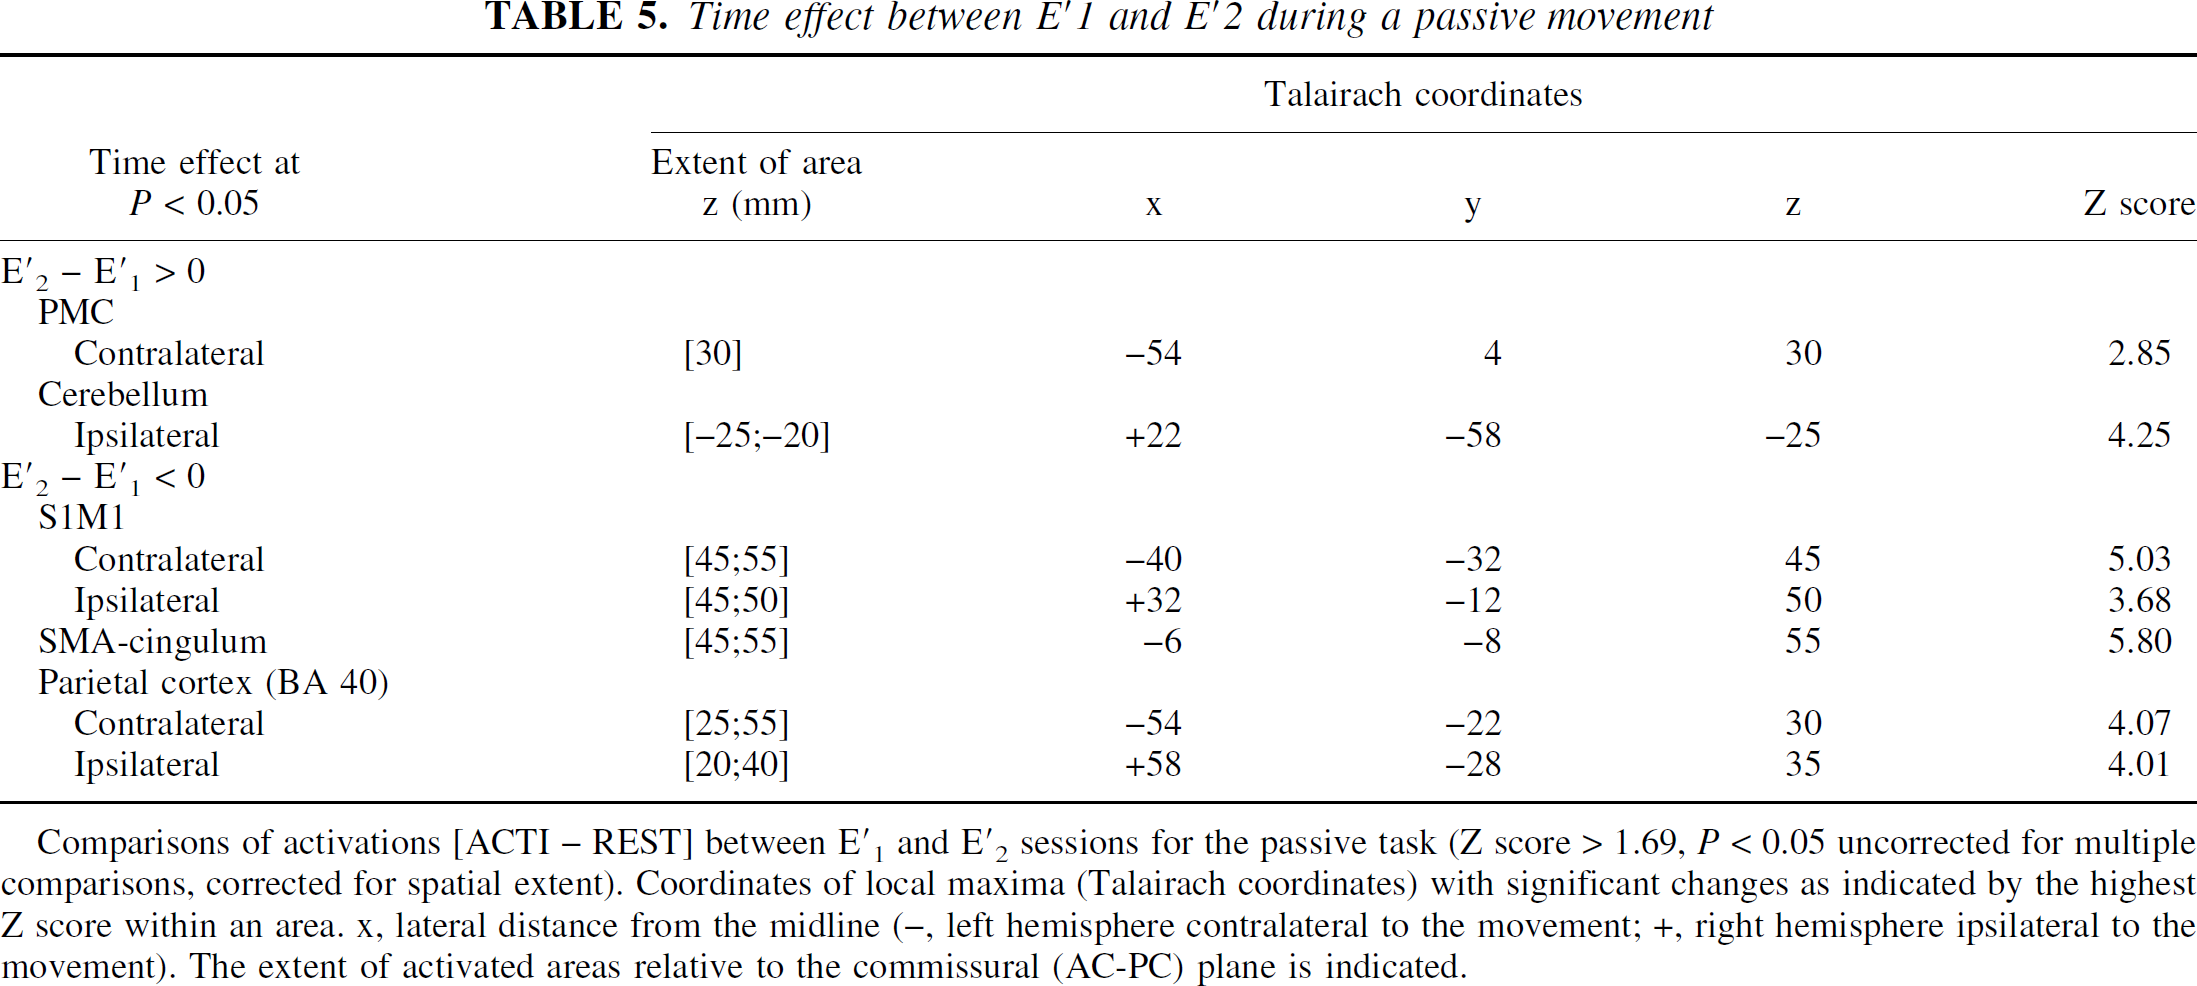
Comparisons of activations [ACTI – REST] between E′1 and E′2 sessions for the passive task (Z score > 1.69, P < 0.05 uncorrected for multiple comparisons, corrected for spatial extent). Coordinates of local maxima (Talairach coordinates) with significant changes as indicated by the highest Z score within an area. x, lateral distance from the midline (−, left hemisphere contralateral to the movement; +, right hemisphere ipsilateral to the movement). The extent of activated areas relative to the commissural (AC-PC) plane is indicated.
The analysis of variance performed on the size of the activated area in the contralateral sensorimotor cortex measured for the active and passive tasks showed a session effect (P < 0.05). The mean region of interest size was significantly reduced at E2 (664 ± 490 activated pixels, coefficient of variation 74%) compared with that at E1 (809 ± 524 activated pixels, coefficient of variation 65%). It returned to above initial levels at the third session. For the passive task, the mean region of interest size also was significantly reduced at E′2 (409 ± 214 activated pixels, coefficient of variation 52%) compared with that at E′1 (1,167 ± 641 activated pixels, coefficient of variation 55%) (Fig. 7). The intersubject variability of the activation extent assessed by the coefficient of variation was also high.
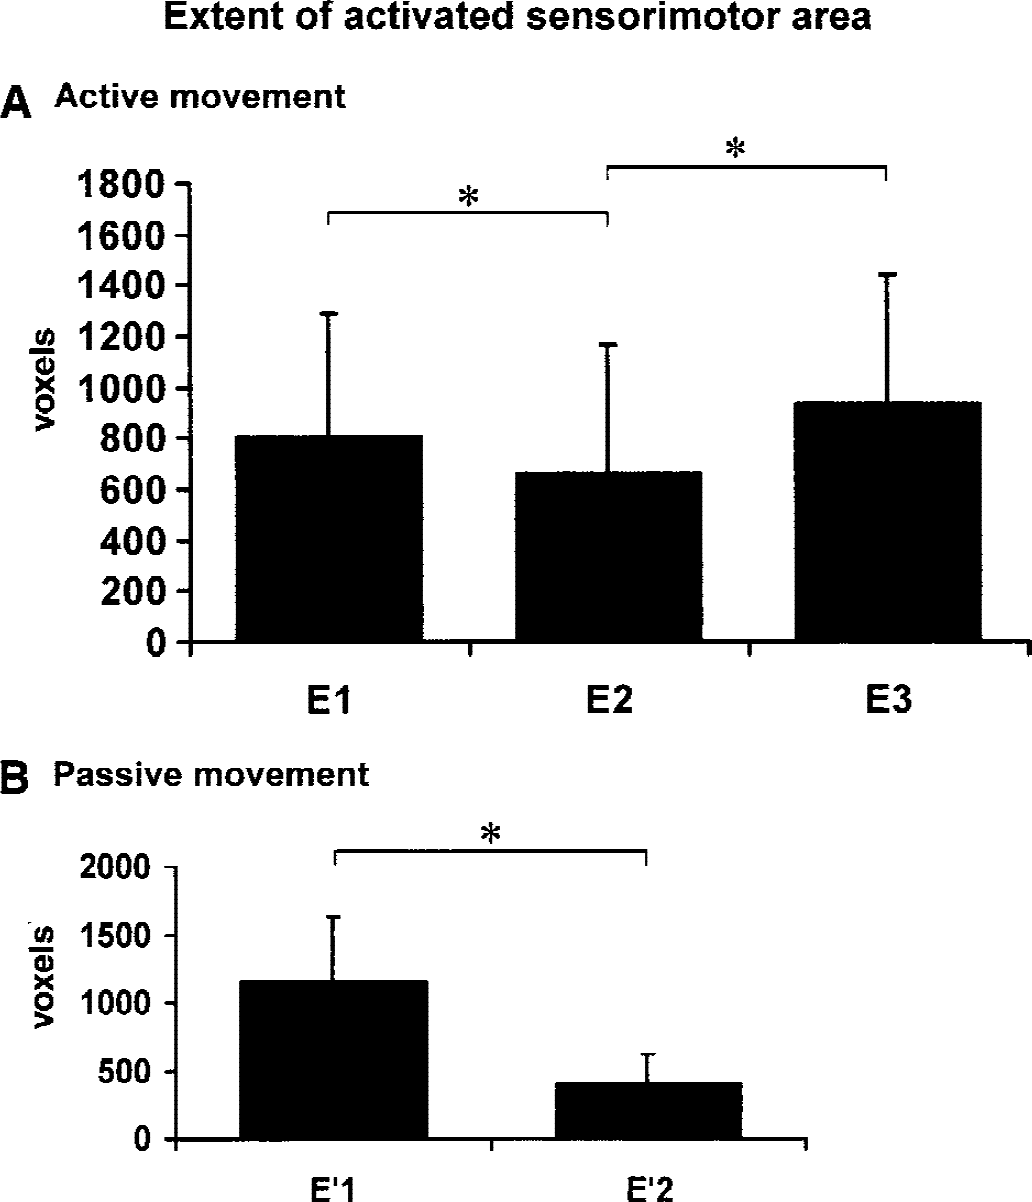
Size of the activated area in the contralateral primary sensorimotor cortex measured for the active
Data from the non–MRI-naïve subjects
The first subject had performed one nonmotor fMRI experiment before, the second one had performed two, and the third one had performed several experiments including motor tasks like the active task of the experiment. A large decrease of signal activation in the cortex at the second session was found for the first two subjects but not for the third.
In conclusion, for the active task, because the activation between sessions was reproducible at peak maximum and the activated area was reduced, the test–retest phenomenon consisted of a restriction of the sensorimotor activated area without diminution of the peak maximum signal. For the passive task, both area and maximum were reduced. These changes between sessions occurred abruptly when a new session began, but the signal was perfectly stable within each session, even in these regions where test–retest effects occurred.
DISCUSSION
For both active and passive motor tasks, signal activation was highly reproducible within sessions whether it was the first, second, or third session. Therefore, no intrasession habituation occurred with an active well-learned task or a passive task. However, the authors showed a test–retest effect: abrupt significant changes between two sessions in specific areas. This test–retest effect was mainly a lower cortical signal at the second session. In S1M1, this lower cortical signal was characterized by reduced activated areas and the signal of the peak maximum did not change for the active task, whereas it decreased for the passive task. Lower cortical activity at the second session seems to be in accordance with an habituation phenomenon that would not occur within an examination of repeated events but between two similar examinations. These changes reversed at the third session. Thus, the study evidences a systematic neurophysiologic process that could be an habituation-learning process involving all of the fMRI experimental conditions.
Cerebral representation of active and passive movements
The active and passive activation maps in the current study were in accordance with those found previously by others for the active task (Catalan et al., 1998; Colebatch et al., 1991; Rao et al., 1996) and for the passive task (Alary et al., 1998; Nelles et al., 1999; Weiller et al., 1996). No major difference was found between the active and passive tasks. Except for the contralateral frontal area BA 8–9, which was activated in the active task but not in the passive task, identical structures were activated by active and passive movements, and activations were found in the same location. However, the activation maps of passive movement compared with active movement showed less activation in lateral premotor cortex (BA 6), posterior parietal cortex (BA 7), and posterior SMA, whereas they showed more activation in the inferior parietal cortex (BA 40), supporting earlier findings (Weiller et al., 1996). Although the active and passive movements were not strictly the same in the current study, these discrepancies were too large to be attributable to a difference in the somatotopy of the hand and wrist but rather arose from the active or passive nature of the task.
Interindividual variability
The authors showed that the intersubject variability of maximum peak location was low. However, the activation signal during sensorimotor tasks varied considerably in both intensity and size from one subject to another, as previously found by others with similar simple motor tasks (Tegeler et al., 1999; Ye et al., 1997). It is probably due to functional anatomic differences or to different cognitive strategies.
Reproducibility: no time effect and no habituation within one session
For both active and passive tasks, the reproducibility of fMRI signal activation within one session without repositioning was good in terms of intrasession, interrun, or intrarun reproducibility. This points out the reproducibility of fMRI signal intensities also evidenced in studies using carbogen-induced activation (Gozal et al., 1994; Robinson et al., 1995) or motor and cognitive activations (Carey et al., 2000; Noll et al., 1997; Rombouts et al., 1998). No habituation phenomena or monotonic task-independent changes in activity were found within the first fMRI session, as Rajah et al. (1998) found with PET scans. This discrepancy may be attributed to the fact that the tasks were well learned or calibrated or that the fMRI session lasted less than 30 minutes, whereas the PET experiments lasted 90 to 120 minutes. It is likely that the subjects found the PET procedure more demanding and tiring. Moreover, the current authors did not find less activation within one session with the sensory passive task, unlike Silva et al. (1999) and Hsu et al. (1998), who found less with sensory electrical stimulations in rats. However, Silva et al. did not find this decrease when the interval between the stimuli was increased to 5 minutes. Thus, this discrepancy may come from the timing and the characteristics of the stimulations.
Test–retest effect between sessions
The current study showed that significant test–retest effects occurred between 2 sessions separated by 5 hours or by 1 or 2 months. They mainly consisted of a restriction in the extent of activation in the primary and secondary motor areas and an enhanced activation in the premotor cortex and in the anterior ipsilateral cerebellar cortex at the second session. These changes reversed at the third examination, except in the left parietal cortex and in the cerebellum, where they went on augmenting. This implies that one or several processes carry on until the third session. It may reflect a change in the neural representation of movement. Parts of this experiment showing such test–retest effects between two sessions have already been published (Carel et al., 2000; Loubinoux et al., 1999).
Taking into account the reproducibility of fMRI activation within one session and also between two sessions in many regions, such as most parts of the cerebellum, such changes cannot be explained by any technical bias. Changes in the parameters of movements (force, amplitude) between sessions could not explain such phenomena either, because a calibrated passive task was used to check for this. The test–retest effect occurred even when the task was self-paced. The authors do not believe it can be explained by a diurnal effect, because the passive protocol was performed at the same time (8:00 am) on two different days. Nor do the authors believe that it is linked to time. It might be closer to an order effect.
The authors have found few studies fully assessing the reproducibility of fMRI signals during functional tasks between two experiments separated by several hours or months. A reduced extent of cortical motor activated areas was found when 10 to 30 minutes or 5 to 16 weeks separated the experiments (Ramsey et al., 1996). Similar results have been reported in PET experiments, but the reduced cortical activity was not found significant (Carey et al., 2000; Nelles et al., 1999). The lower cortical activity in the second experiment is consistent with the known effects of habituation observed either with an active or a sensory passive task in one session (Hsu et al., 1998; Karni et al., 1995, 1998; Maclean et al., 1975; Mauguiére and Fischer, 1990;Näätänen et al., 1994; Silva et al., 1999), although in the current experiments the authors did not observe it within a session but between two sessions. In parietal cortical areas, the signal went on decreasing through the three sessions (see Fig. 6). The parietal cortex, like other associative motor areas, has been found to be involved in attentional processes (Corbetta et al., 1993; Jueptner et al., 1997; Nobre et al., 1997; Pardo et al., 1991; Posner and Dehaene, 1994). Less arousal, stress, and attention at the second and third sessions may be components of the inhibition of cortical activity (Courchesne and Allen, 1997; Jueptner et al., 1997; Meyer et al., 1991).
The current authors thought that the test–retest effect could be dependent on the MRI context and its novelty. Staying motionless in the noisy MRI machine and performing particular tasks in a specific time frame may be an unusual experience when performed for the first time. For this purpose, the authors looked for the nonoccurrence of a test–retest effect in three subjects familiar with the fMRI experiment. Surprisingly, the test–retest effect was observed in two subjects who had performed one or two nonmotor fMRI experiments before. However, it was not observed in the third subject who had performed many fMRI experiments, including motor experiments, before. Further studies with two groups of non–MRI-naïve subjects, one familiar with the task and another not, should clarify this point. In conclusion, the authors suggest that the test–retest effect might come from habituation to the MRI experiment context, including the MRI environment, and also the task to be performed.
The effect observed after a long period between the two sessions, up to 2 months, suggests that a long-term memory representation of the stimulation had been implemented into the motor system. Plot A in Fig. 7 evokes a learning fMRI pattern like the one found by Karni (1995) with a first habituation step (restricted sensorimotor activated area) and a second recovery afterward (recovery of the extent of the activated area) while learning carries on. Many studies showed that the primary motor cortex, SMA, cingulum, cerebellum, and prefrontal cortex that were concerned in test–retest-dependent changes in this study may be involved in different periods of learning (Doyon et al., 1997; Friston et al., 1991; Grafton et al., 1992; Imamizu et al., 2000; Jenkins et al., 1994; Jueptner et al., 1997; Pascual-Leone et al., 1995; Petersen et al., 1998; Seitz et al., 1990, 1994). Such learning studies have been mainly focused on procedural learning. Procedural learning cannot explain the test–retest effect because the tasks were ordinary and because the active tasks were well learned. The authors propose that a learning process occurs: a long-term memory representation of the sensorimotor task, not only with its characteristics (for example, active or passive task, frequency, external or internal trigger, force, amplitude) but also with its context (MRI, a fMRI block design), becomes integrated into the motor system along the sessions. This process may involve the retrieval of a kind of episodic memory, of learned information associated with a particular place, task, and time frame.
In learning functional imaging studies, neural response decreases to repeated stimulus presentations have been found (Büchel et al., 1999; Raichle et al., 1994). This repetition suppression is thought to indicate a progressive optimization of neuronal responses elicited by the task (Büchel et al., 1999; Haier et al., 1992), and the authors showed that in parallel to this adaptation, an increase in effective connectivity occurred between distinct cortical systems. The test–retest effect could indicate an increase in effective connectivity.
Consolidation
Increases in activity similar to the ones found here have been found in the left premotor cortex and in the right anterior cerebellar cortex when subjects again performed a well-learned visuomotor task practiced 5.5 hours before (Shadmehr and Holcomb, 1997), and they were interpreted as a change in the neural representation of the motor internal model and as a consolidation process. The transformation with the passage of time, and in the absence of further practice, from an initial fragile state to a more solid state is called consolidation. Thus, the authors postulate that the abrupt test–retest effect between sessions can be attributed to consolidation. The cerebellum and premotor cortex are involved in motor planning. As the movement is practiced, the cerebellum learns to link, within itself, the context in which the movement is made to the lower level of generators (Thach, 1997). Premotor areas receive influences from the cerebellum and are active in the preparation of movements (Wise et al., 1997), body–space interaction, and sensory integration (Sadato et al., 1997; Van Oostende et al., 1997). The premotor areas could still plan without the help of the cerebellum, but not so automatically, so precisely linked to the context, or so free of error (Thach, 1997).
The authors believe that the current data provide a new insight into the issue of reproducibility of fMRI signals. In particular, they hope that this study makes it clear that the cerebral activation produced by simple motor tasks is highly reproducible within one session under the conditions of the current experiments, and that activated areas undergo a test–retest effect between two sessions. Their determination will be a major concern, especially in learning paradigms or in clinical longitudinal studies focused on patients' recovery.
Footnotes
Acknowledgments:
The authors thank Dr. Claire Thalamas and Le Centre d'Investigation Clinique du CHU (Center Hospitalier de Toulouse) for their assistance.