
Abstract
The possible role of oxygen metabolism in supporting brain activation remains elusive. We have used a newly developed neuroimaging approach based on high-field
Introduction
Normal brain function requires large amounts of energy. This high energy demand is met mainly through the chemical process of oxidative phosphorylation in the brain mitochondria to produce adequate quantities of adenosine triphosphate (ATP; Attwell and Laughlin, 2001; Du et al, 2008; Hyder et al, 2006; Lei et al, 2003; Raichle, 1987; Sokoloff, 1991). Under the resting condition, this process is responsible for the consumption of most glucose used by the brain, generating ~ 36 ATPs from each glucose molecule. It is also tightly coupled to cerebral oxygen utilization and is responsible for ~ 20% of the total oxygen consumption in the human body even though the brain constitutes only ~ 2% of the body weight. Therefore, the cerebral oxidative metabolism is essential for supplying brain energy and supporting brain function. Consequently, cerebral metabolic rate of oxygen (CMRO2) consumption provides an important physiologic parameter that can be used to evaluate cerebral bioenergetics in healthy and diseased brains at rest; as well as to investigate the functional neurometabolic relation during brain stimulation and/or task performance. However, the ability to directly and reliably image resting CMRO2 and CMRO2 alteration during brain activation has been a major challenge for several decades. Positron emission tomography (PET) combined with 15O radiotracers has been perhaps the only established
Qualitatively, the finding that the ratio between the stimulus-evoked percent CMRO2 change versus that of CBF or CMRglc is much smaller than 1 (Fox et al, 1988) is consistent with and underlies the interpretation of the blood oxygenation level dependence (BOLD) contrast (Ogawa et al, 1990; Raichle and Mintun, 2006) detected by functional magnetic resonance imaging (fMRI), which has become the most prominent neuroimaging modality for mapping brain activation (e.g., Bandettini et al, 1992; Kwong et al, 1992; Ogawa et al, 1992). However, fMRI is unable to directly detect neuronal activity; instead, it relies on a complex interplay among CBF, cerebral blood volume (CBV), and CMRO2 changes induced by altered brain activity (Ogawa et al, 1993). Precise interpretation of fMRI results requires a better understanding of the quantitative relationship between the fMRI BOLD contrast and the underlying neurophysiology—in particular the stimulus-evoked CMRO2 change.
Therefore, the ability to image absolute CMRO2 with relatively high spatial resolution and temporal resolution is crucial towards understanding cerebral metabolic events that occur during brain activation, and their implication on quantifying neuroimaging signals. Towards this goal, we recently established the three-dimensional (3D) 17O magnetic resonance spectroscopy imaging (MRSI) method at high/ultrahigh magnetic fields (Zhu et al, 2002; Zhu et al, 2007) as a noninvasive neuroimaging modality for imaging CMRO2
Materials and methods
Animal Preparation
Five female adolescent cats were used to conduct this study. Cats were initially anesthetized with a mixture of ketamine (15.0 mg/kg) and xylazine (2.5 mg/kg). After oral intubation, mechanical ventilation (30 to 33 stokes/mins) was applied and anesthesia was switched to 0.9% to 1.2% isoflurane (~ 1.5 MAC) in a N2O/O2 mixture of 70:30 volume ratio throughout the experiment. The pupils of the cat were dilated with atropine sulfate solution; corrective contact lenses were placed to focus the eyes on the visual stimulus by refracting and locating the fovea of the cat retina with the aid of a fundus camera (Zeiss, Jena, Germany). The visual stimulus was a binocular high-contrast square-wave moving and rotating gratings (0.3 cycle/deg, 2 cycles/sec, and 16° rotation for every 4 secs) to achieve optimal visual stimulation of the neurons with different orientation preferences in the cat primary visual cortex. The cats were placed in a cradle with head position restrained by the mouth and ear bars. The animal physiologic condition was continuously monitored and maintained during the entire experiment. All animal surgical procedures and experimental protocol were approved by the Institutional Animal Care and Use Committee of the University of Minnesota.
Magnetic Resonance Spectroscopy Imaging and Magnetic Resonance Imaging Measurements
The 17O MRSI and 1H MRI measurements were conducted on a 9.4 T horizontal animal magnet (Magnex Scientific, Oxford, UK) interfaced with a Varian INOVA console (Varian Inc., Palo Alto, CA, USA). A radiofrequency (RF) probe consisted of a 17O surface coil covering the cat V1 region for acquiring 17O MRSI and a larger 1H coil for brain anatomic images and fMRI was used in this study.
Two paired measurements for collecting series of 3D 17O MRSI before and during 2 to 3 mins inhalation of 17O2 gas (up to 89% 17O enrichment purchased from ISOTEC Inc, Miamisburg, OH, USA) were performed for each cat in the absence and presence of visual stimulation, respectively; and only Cat 5 had repeated twice the paired 17O MRSI measurements in the same experimental session to test the reproducibility and reliability of the CMRO2 imaging approach.
The natural abundant 17O signal of brain water obtained before the 17O2 gas inhalation was used as internal reference for quantifying the absolute metabolic H217O concentration in the brain; and the dynamic change of the metabolic H217O concentration obtained during 17O2 gas inhalation was applied to determine CMRO2 using the linear regression model and to generate 3D CMRO2 images (Zhang et al, 2004; Zhu et al, 2002; Zhu et al, 2007). The functional CMRO2 activation maps were created based on the value of ACMRO2/CMRO2, in which ACMRO2 represents the difference between the stimulated and control CMRO2 values.
Two criterions were applied to quantify the CMRO2 values measured under resting and stimulated conditions, as well as ACMRO2/CMRO2. The 17O RF surface coil used in this study provides optimal sensitivity for detecting the 17O MRSI signal in the cat V1 and surrounding brain regions. In contrast, the detected 17O signal intensity reduces substantially in the brain regions, which are distant from the RF coil, resulting in a low signal-to-noise ratio (SNR). Thus, the first criterion was to exclude the 17O MRSI voxels with low SNR of natural abundance brain water signal from further CMRO2 quantification. The averaged SNR from the 17O MRSI voxels, which were included in CMRO2 quantification was approximately 10:1. The Monte Carlo simulation (unpublished results) has suggested that the CMRO2 fitting error measured by the high-field 17O MRSI approach can reach a few percents if the SNR of natural abundance brain water signal is below 10:1. Thus, the second criterion was to set a threshold of −5% > ACMRO2/CMRO2 > 5% for calculating the stimulus-evoked percent CMRO2 change (i.e., ACMRO2/CMRO2); and generating the functional metabolic activation maps of ACMRO2/CMRO2.
The functional ACMRO2/CMRO2 maps were further analyzed in two ways. The first way was to average the baseline and stimulated CMRO2 value, respectively, only from the same brain regions showing a positive stimulus-evoked CMRO2 change; and these averaged CMRO2 values were further used to calculate the averaged value of positive ACMRO2/CMRO2. The second way was to calculate the baseline and stimulated CMRO2 value, respectively, averaged from the brain regions showing either a positive or a negative stimulus-evoked CMRO2 change; and these CMRO2 values were used to present the averaged value of net change of ACMRO2/CMRO2 in these brain regions.
The fMRI measurements were based on the block paradigm design: three control and two task periods in an interleaved way. Activation maps were generated using a time-shifted cross-correlation method (Bandettini et al, 1992; Xiong et al, 1995). The activated pixels were identified by correlating the fMRI time course with a trapezoidal function (the modified box-car function with the capability of accounting for hemodynamic delays). This procedure generated typical activation maps in V1, which were consistent across different cats. We chose a statistical threshold of
The paired
Results, Discussion, and Conclusions
Stimulus-Evoked Cerebral Metabolic Rate of Oxygen Increase During Brain Activation
Figure 1 shows the 3D images of absolute CMRO2 values obtained at rest and during visual stimulation, functional metabolic activation maps of ACMRO2/CMRO2, BOLD-based fMRI maps, and their corresponding brain anatomic images in four adjacent image slices chosen from 3D image data in a representative cat brain. This figure clearly illustrates a significant CMRO2 increase in the activated brain region in the cat visual cortex (defined as activated V1 region herein) in response to a full-field, binocular grating visual stimulation. The size and location of the activated brain regions depicted in the functional ACMRO2/CMRO2 maps largely coincide with those regions determined by fMRI maps showing positive BOLD changes in the same cat brain despite of different spatial resolutions between CMRO2 and BOLD functional images. Figure 2 shows the absolute CMRO2 values averaged over these activated brain regions in different image slices from one representative cat, and the summarized results of six measurements from five cats (one cat having two repeated measurements under control and stimulated conditions). The CMRO2 value averaged spatially from the activated cat V1 region showing a positive change of ACMRO2/CMRO2 was 1.26 ± 0.09 μmol/g per min (
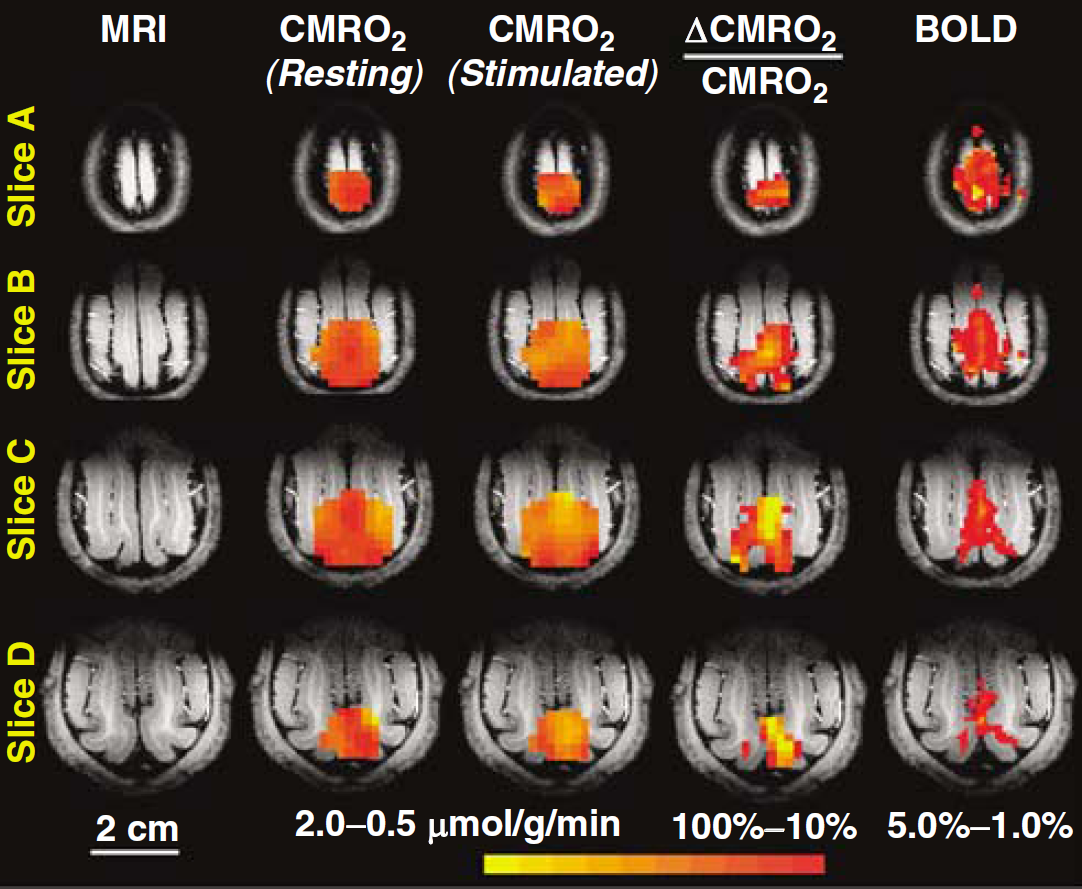
Significant CMRO2 increase in activated visual cortex. Three-dimensional CMRO2 maps obtained at resting (second column from the left) and stimulated (third column) conditions; 3D functional metabolic activation maps showing percent changes of CMRO2 elevated by visual stimulation (fourth column); BOLD-based fMRI maps (fifth column); and anatomic brain images (first column) in four adjacent image slices from a representative cat brain.
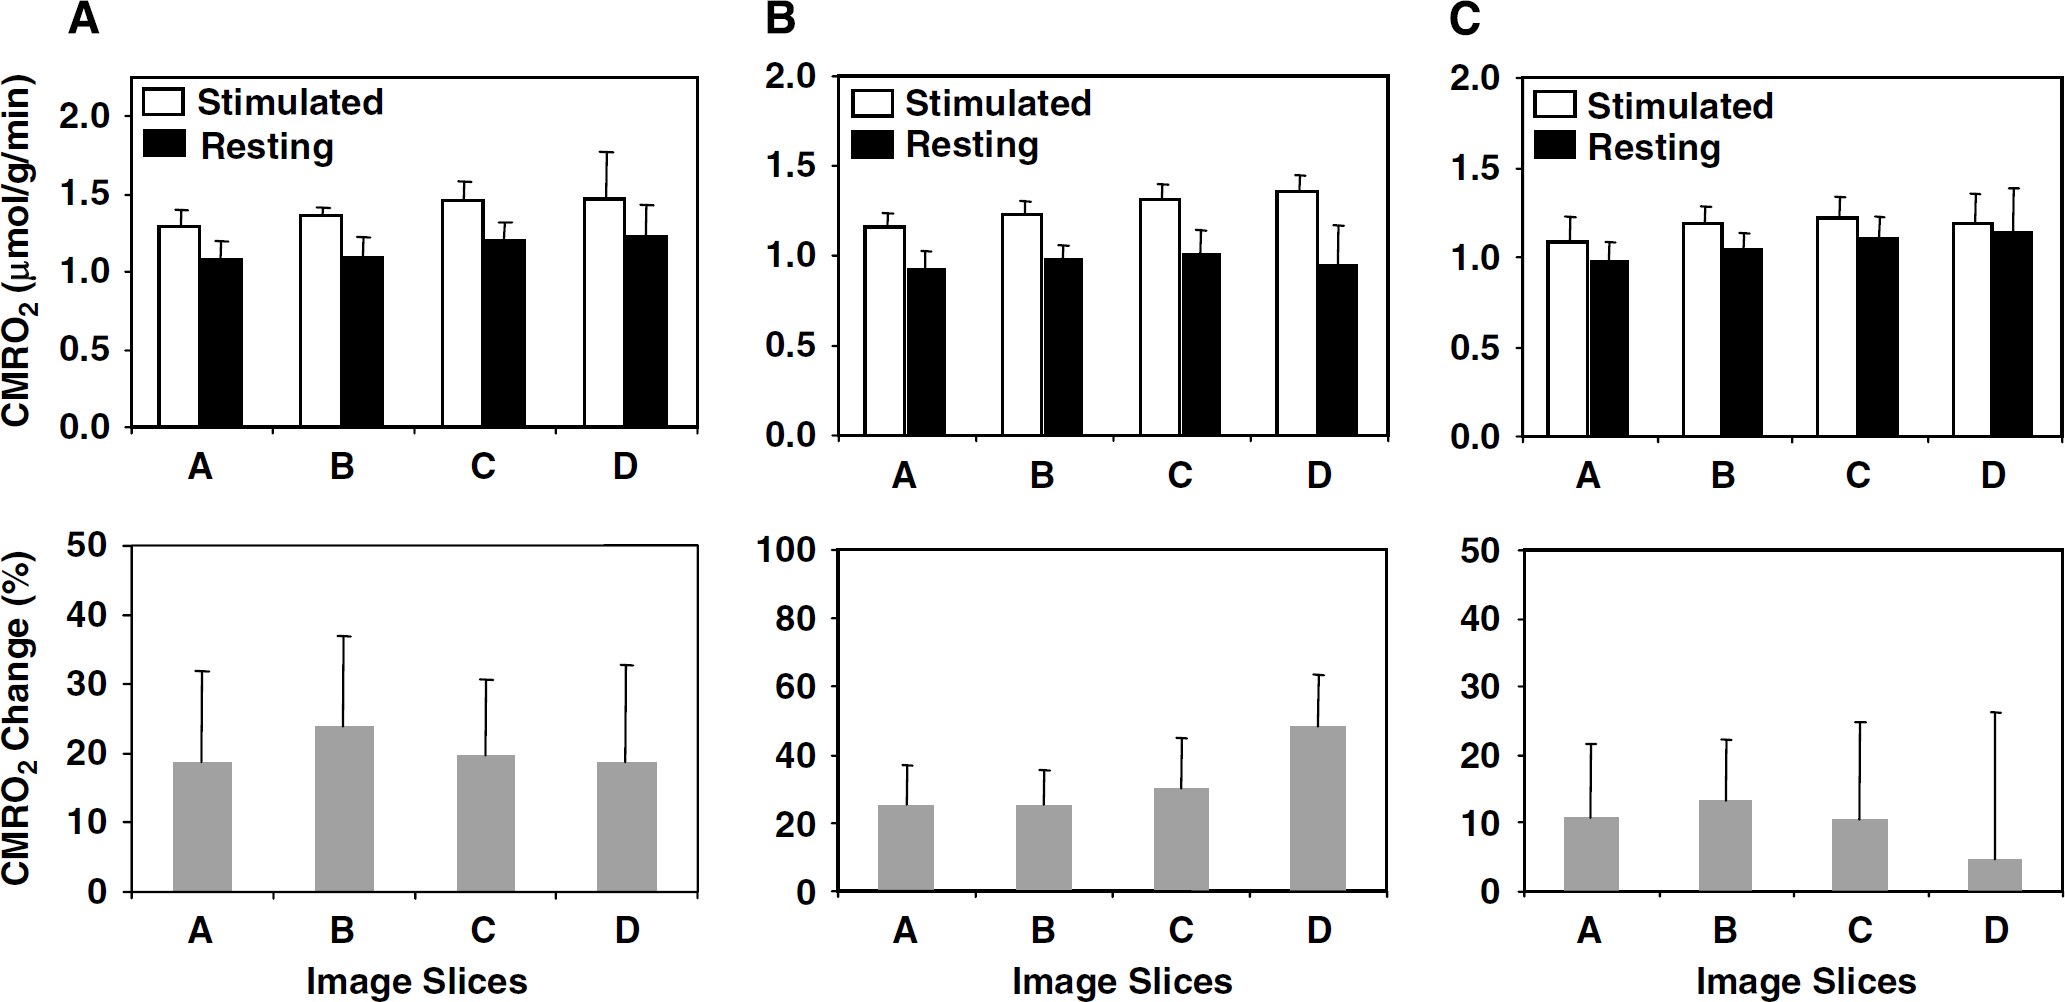
Summary of resting and activated CMRO2 and percent changes. Summarized absolute CMRO2 values measured at resting and during visual stimulation (top inserts) and their percent changes (bottom inserts) from four CMRO2 image slices covering the visual cortex of cat anesthetized with isoflurane. (
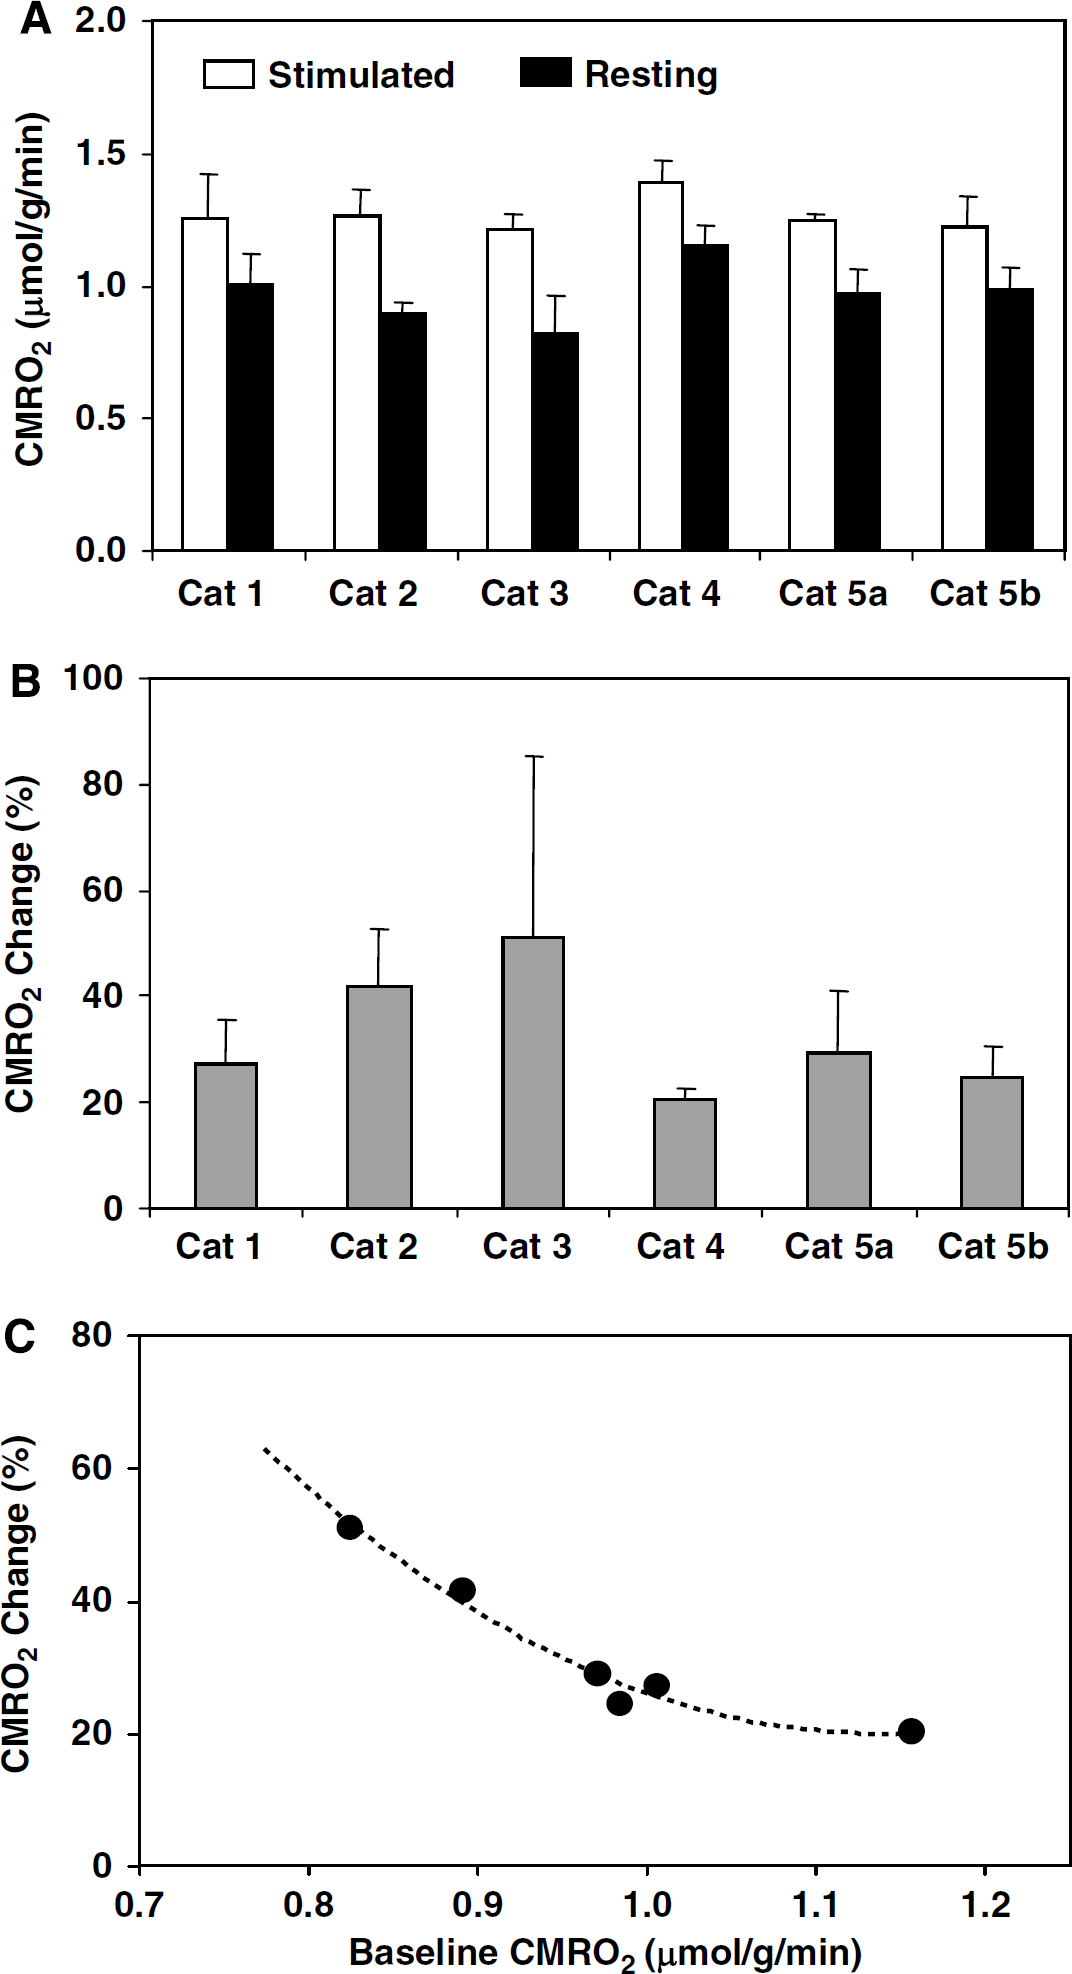
Stimulus-evoked CMRO2 increase and its relation to resting CMRO2.(
Total Brain Energy Expenditure During Brain Activation
Interestingly, we also consistently detected a CMRO2 decrease in the brain region surrounding the territory showing positive CMRO2 or BOLD change in the cat V1. This phenomenon was observed in all cats, and the functional metabolic CMRO2 image results from two representative cats are shown in Figure 4. When both positive and negative CMRO2 alterations were counted and spatially averaged, the net CMRO2 increase induced by visual stimulation reduced to 9.7%± 1.9% (
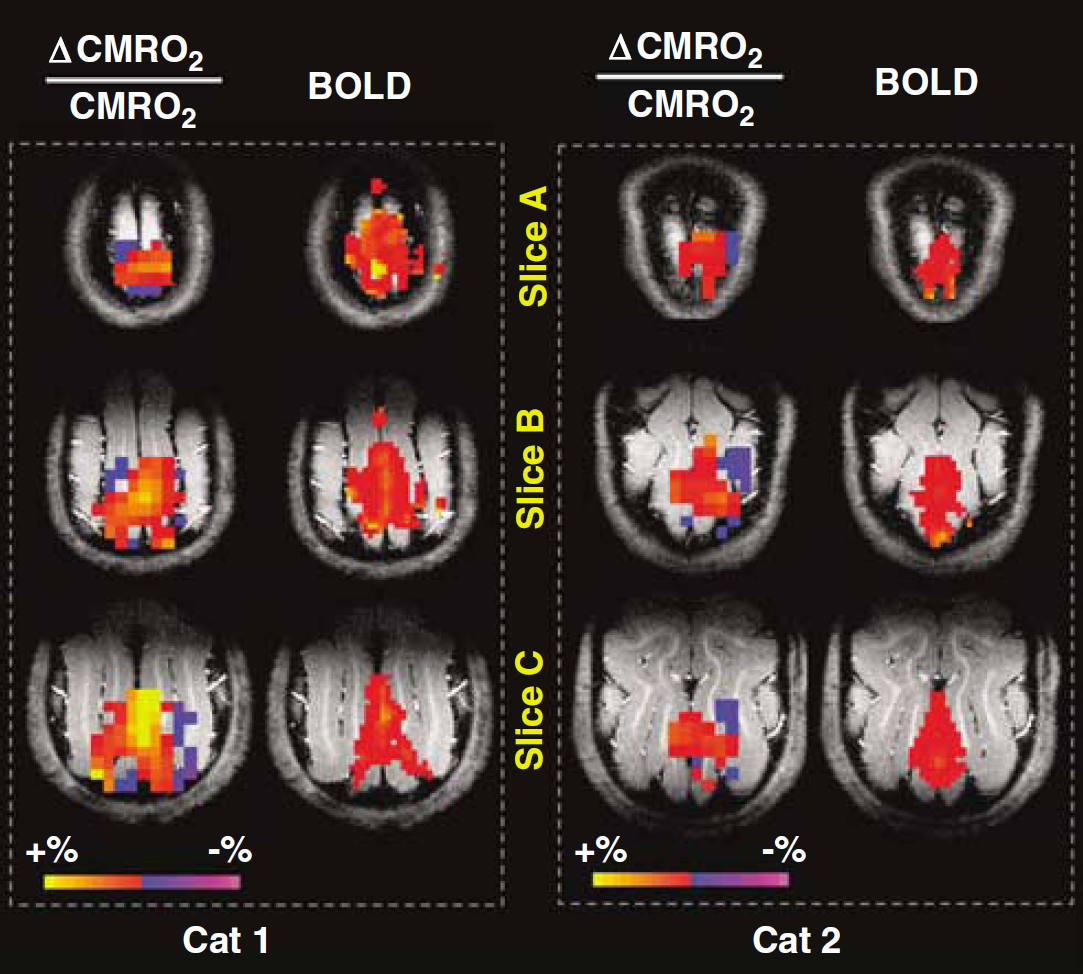
Spatially compensated CMRO2 changes elevated by brain stimulation. Functional CMRO2 maps (show both positive and negative changes) and fMRI BOLD maps during visual stimulation from two representative cats. This figure shows that the CMRO2 increases in the central activated visual cortex regions are commonly accompanied by CMRO2 decreases in surrounding brain regions.
Similar spatial characteristics have been shown by other physiologic measurements based on the hemodynamic changes of CBV and CBF or BOLD contrast. For instance, negative CBV changes surrounding the central visual cortical regions showing stimulus-evoked increases in CBV were previously reported in the cat brain (Harel et al, 2002); and negative changes bordering on the territory of positive changes in BOLD and CBF maps were also observed in the human brain during retinotopic visual stimulation (Shmuel et al, 2002). In the latter, BOLD modeling was used to argue that the negative CBF/BOLD changes could correspond to a decrease in CMRO2 in these brain regions; however, ambiguities in the BOLD modeling was recognized and only a qualitative conclusion was reached (Shmuel et al, 2002).
Our results suggest that CMRO2 indeed decreases in the brain regions surrounding the primary foci of increased activity, suggesting that the neuronal activity in the regions with negative CMRO2 change might be suppressed owing to a tight neurometabolic coupling. Consistent with this notion, reduction in electrophysiologic signals of neuronal activity was recently reported in the negative BOLD regions surrounding the activated visual cortex in the primate (Shmuel et al, 2006). Therefore, these collective lines of evidence suggest that there are similar trends among CMRO2, CBF, CBV, and neuronal activity changes in response to visual stimulation in both activated cortical region and surrounding deactivated cortical region, indicating that a tight coupling among the metabolic and hemodynamic responses to neuronal activity change might qualitatively hold under both activated and deactivated conditions (Raichle and Mintun, 2006).
The negative CMRO2 changes observed during visual stimulation in this study could be driven by oxidative metabolic, other physiologic or neuronal process. Irrespective of the operative mechanism, however, this observed CMRO2 phenomenon may arise to limit total brain energy expenditure superimposed on an expensive energy budget used at the resting state, for instance, to maintain the resting brain network and neuronal connectivity sustained by spontaneous neuronal activity rhythm (Buzsaki and Draguhn, 2004; Fox et al, 2006) and to provide a significant amount of ‘house-keeping’ ATP energy (Du et al, 2008). This means that a resting brain is not truly at ‘rest’ and it costs sizeable brain energy. Thus, the increased energy demand in the activated brain regions could be partially compensated by the reduction of energy usage in other brain regions, leading to a smaller extent of total (or global) brain CMRO2 increase during activation. This energy compensation mechanism could provide a satisfactory explanation for the observation in the present study as well as to the surprising finding from a well-documented work published in 1955, showing no global CMRO2 change in the human brain during an intense mental arithmetic task (Sokoloff et al, 1955). Two speculations were discussed in this early publication to interpret the finding: one was that the total energy requirements of the brain, as reflected by the cerebral oxygen consumption, may be independent of the brain activity change elevated by task performance; the other speculation was that the task performance may lead to a spatial redistribution of neuronal and metabolic activities, that is, brain regions with increased functional and metabolic activities could then be counterbalanced by regions of reduced activities so that the global CMRO2 is unchanged (Sokoloff et al, 1955). Nevertheless, it was difficult to justify these two possibilities by the global CMRO2 measurements (Sokoloff et al, 1955) because lack of information regarding the spatial distribution of positive and negative CMRO2 changes inside the brain. The results from the present study provide vital evidence suggesting that the increased neuronal activity evoked by brain stimulation requires a significantly higher energy demand of oxygen consumption in the activated brain regions than that at rest; however, this increased regional energy demand could be partially compensated by the reduction of energy demand in other brain regions resulting in a smaller increase in CMRO2 over a larger brain volume. This mechanism could be critical for maintaining normal, sustained brain activation in a working brain.
Although, the present study is unable to examine whether the metabolic activity itself or neuronal activity is the primary origin driving the CMRO2 suppression in the surrounding brain regions during visual activation, it has been suggested that the decrease of CMRO2 likely indicates regional depression of synaptic activity (Pasley et al, 2007; Seitz and Roland, 1992; Shmuel et al, 2006).
One important implication of both negative and positive CMRO2 alterations in the nearby brain regions during stimulation as observed in this study is that the averaged stimulus-evoked CMRO2 change (in either relative or absolute scale) becomes substantially smaller when the spatial resolution of CMRO2 imaging is inadequate to differentiate the regions showing negative and positive CMRO2 alterations; with increased imaging voxel size (i.e., reducing spatial resolution) and increased partial volume effect, the change in CMRO2 may even become undetectable. This observation could provide key for potentially reconciling the long-standing controversy in the literature regarding the essential questions: if, and how much CMRO2 changes in response to brain stimulation; and whether the oxygen metabolism is vital in supporting brain work (Barinaga, 1997).
It is interesting to note that although the negative CMRO2 (this study) and CBV (Harel et al, 2002) changes were observed in the surrounding regions of cat visual cortex, the negative BOLD was not robustly seen in all cats in our study. This observation suggests the complexity of the BOLD signal nature owing to its dependence on the interplay among three stimulus-evoked physiologic parameter (i.e., CMRO2, CBF, and CBV) changes as well as on the baseline levels of these parameters as discussed in the following section. Thus, a single CMRO2 parameter may provide a better and more quantitative measure reflecting the brain energy state or the corresponding neuronal activity level if the limited 17O detection sensitivity is not a major concern; and it should be useful for understanding many neuroscience questions, for example, the relationship between brain energy usage and neuronal excitation versus neuronal inhibition (Buzsaki et al, 2007).
Importance of Baseline Cerebral Metabolic Rate of Oxygen
Another striking observation in the present study is that the positive percent CMRO2 changes evoked by visual stimulation were negatively correlated with their corresponding baseline CMRO2 values, as shown in Figure 3C. This finding indicates a strong influence of baseline metabolic activity level on the percent CMRO2 change in response to brain stimulation (Hyder et al, 2002; Pasley et al, 2007; Shulman et al, 2007); thus, the stimulus-evoked percent CMRO2 change alone can become less significant for quantitatively interpreting and fully understanding the neurometabolic relationship if the baseline CMRO2 is not determined.
According to the trend shown in Figure 3C, we could further speculate that the stimulus-evoked CMRO2 percentage change in the awake brains would be less pronounced as compared with the anesthetized brains because a higher baseline level of CMRO2 is expected under the awake state. The visual cortex of the awake human, for instance, has a relatively higher baseline CMRO2 value of B1.7 μmol/g per min (Fox et al, 1988) compared with the value of 0.97 μmol/g per min in the anesthetized cat visual cortex as measured in the present study. On the basis of Figure 3C and the assumption of similar CMRO2 change behaviors between the human and cat visual cortices in response to visual stimulation, one could expect that the percent CMRO2 increase in the human visual cortex during visual stimulation should be significantly less than 32% observed in the anesthetized cat brain in this study, and certainly substantially smaller than the CBF change of 40% to 50% in the human visual cortex (Fox et al, 1988; Zhu et al, 1998). This notion is consistent with the fact that a hyperoxygenation level in the blood is elevated in the activated brain region because the mismatched CMRO2 and CBF changes, leading to a positive BOLD contrast in fMRI (Ogawa et al, 1990). This estimated range of percent CMRO2 increase in response to visual stimulation is also qualitatively consistent with the literature results reporting a wide range from 5% to 30% in the human visual cortex (Chen et al, 2001; Davis et al, 1998; Fox et al, 1988; Hoge et al, 1999; Kim et al, 1999). However, ultimately studies under the awake state either with the 17O CMRO2 imaging methodology or using this methodology as a calibration for BOLD modeling (Davis et al, 1998; Hoge et al, 1999; Kim et al, 1999; Ogawa et al, 1993) will be necessary to draw definitive conclusions in the human brain.
The possible mechanism to link the negative correlation between the stimulus-evoked percent CMRO2 change and its baseline CMRO2 level shown in Figure 3C can be explained by two possible models with distinct assumptions. The first one assumes that CMRO2 can rise from its baseline level to a higher and constant level in the activated brain region during stimulation (Hyder et al, 2002; Pasley et al, 2007) so that the absolute stimulus-evoked CMRO2 becomes independent of the baseline CMRO2 level. In this case, a relatively low baseline CMRO2 level should result in a larger stimulus-evoked percent increase in CMRO2; this is consistent with the negative correlation in Figure 3C. The second model is to assume that CMRO2 can rise from its baseline level to a higher level but with a constant CMRO2 increment in the activated brain region. On the basis of this model, the stimulus-evoked percent CMRO2 increase will be larger again if the baseline CMRO2 level is relatively low; this scenario will also lead to a similar negative correlation as shown in Figure 3C. Owing to the inevitable variation among animals in the CMRO2 data measured in the present study, these two models are difficult to be justified with statistical confidence; although the first model was slightly favored by our data showing a relatively smaller intersubject variation (quantified by s.d.) in the absolute values of stimulus-evoked CMRO2 compared with that of stimulus-evoked CMRO2 increments.
The tight correlation between the percent CMRO2 change and baseline CMRO2 level as shown in Figure 3C has several profound impacts on both fMRI methodology and functional brain electrophysiology. First, the percent change of stimulus-evoked CMRO2 can vary as a function of baseline CMRO2 level, and the influence of relative (percent) CMRO2 change on the percent change of BOLD signal measured by fMRI could rely on the baseline CMRO2 level, which can vary substantially among subjects or between awaked and anesthetized brains. Therefore, it is critical to consider the implication of baseline CMRO2 level on quantifying the
The overall findings lead to an important conclusion that both baseline and stimulus-evoked brain energies should be vital for normal brain function in performing specific tasks, and the fraction of these two brain energy expenditures relies on the baseline metabolic activity level, which could be susceptible among subjects, species, and physiologic/pathologic conditions; and the baseline level can also be manipulated readily by varying experimental conditions, for instance, by changing anesthetic depth. The isoflurane anesthetic applied in the present study could significantly low the baseline CMRO2 activity level in the cat visual cortex, ultimately, lead to a relatively larger increase in the percent CMRO2 change and a large absolute CMRO2 increment during brain stimulation as compared with the waked brain state. If the basal CMRO2 level can be further suppressed by using different anesthetic, for example, α-chloralose (Ueki et al, 1992), the percent CMRO2 increase could be even larger. Thus, the stimulus-evoked percent CMRO2 change is sensitive to the baseline CMRO2 level and can cover a wide range from deeply anesthetized to awaked brains. This notion provides an explanation to the large discrepancy of the CMRO2 percentage changes reported in the literature (e.g., Fox et al, 1988; Hyder et al, 2001).
In addition, our results suggest that both baseline CMRO2 level and the stimulus-evoked percent CMRO2 change are equally important for brain to work properly. Although the baseline CMRO2 level can be easily modulated, the total brain energy may have to be resumed and integrated for supporting brain activation during stimulation if the involved neurons can fully response to the stimulus.
Advantages and Promise of 17O-Based Cerebral Metabolic Rate of Oxygen Imaging Method
Overall findings in this study offer new insights into the underlying physiology of cerebral oxidative metabolism and its essential role in bioenergetics associated with brain activation; they also provide possible clarifications to a number of long-standing neuroscience questions. Moreover, they also highlight the importance of the neuroimaging capability to noninvasively imaging absolute CMRO2 values under both resting and activated brain states with adequate spatial resolution, for instance, to differentiate different brain regions with positive and negative CMRO2 changes in response to visual stimulation as illustrated in this study (Figure 4). This ability is crucial to quantitatively investigate the coupling relationship between the stimulus-evoked neuronal and oxidative metabolic activities. The high-field
Owing to the large differences in spatial resolution and voxel shape between the functional CMRO2 and BOLD maps in the present study, the investigation for correlating the stimulus-evoked CMRO2 change and BOLD signal was not pursued in this study. Nevertheless, the superior quality of high-field
Footnotes
The authors declare no competing financial interests.