
Abstract
This study characterizes the regional changes in vascularity, which accompanies chronic progressive hydrocephalus. Fifteen dogs underwent surgical induction of hydrocephalus and were used for histologic studies. Animals were divided into 4 groups: surgical control, short term (≤5 weeks), intermediate term ((8 weeks), and long term (10 to 12 weeks). Vessel diameter, density, and luminal area were calculated by imaging quantification after manual vessel identification in the cortical gray, white matter, and caudate nucleus. Capillary vessel diameter decreased 23.5% to 30.2% (P < 0.01) in the caudate, but then returned to normal at 12 weeks. Capillary vessel density decreased 53.5% (P < 0.05) in the cortical gray, but then increased to 234.8% (P < 0.01) over surgical controls at 12 weeks. There was no initial decrease in capillary density in the caudate; however, the long-term group capillary density was significantly greater (172.8% to 210.5%, P < 0.01) than surgical controls. Overall, there was a short-term decrease in lumen area, with recovery in the longer term. Glial fibrillary acidic protein (GFAP) immunohistochemistry demonstrated the pattern of GFAP staining and reactive astrocytes differed in the caudate compared with the occipital cortex. This data suggest that an increase in capillary density and diameter may be an adaptive process allowing maintenance of adequate cerebral perfusion and metabolic support in the hypoxic environment of chronic hydrocephalus.
Enlarged cerebral ventricles and compressed brain tissue caused by an accumulation of cerebrospinal fluid (CSF) characterize hydrocephalus. The mechanisms by which hydrocephalus first reversibly and then permanently injures the brain are not understood, although increased intracranial pressure, decreased cerebral blood flow, tissue edema, tissue compression and, stretch may all play a role. Many studies have suggested an important role for cerebrovascular compression (Del Bigio and Bruni, 1988; Jones et al., 1991; Oka et al., 1991) and tissue hypoxia (Del Bigio, 1993; Higashi et al., 1986; Richards et al., 1989) in the pathophysiology of hydrocephalus. Although paraventricular capillary compression may result in reversible and irreversible hypoxia, (Oka et al., 1986; Okuyama et al., 1987; Sato et al., 1984) the extent, time course, and distribution of these changes is not known for chronic hydrocephalus. Problems of interpretation and variability in results have resulted from studies using different species, ages, and hydrocephalus of variable severity and time courses.
Although most studies have described cerebrovascular compression, a few studies have observed increased vascularity in certain brain regions and at various time points in hydrocephalus. Penfield and Elvidge (1932) observed, but did not quantitate, an initial increase in vessels on the pial surface followed by vessel collapse with later and more severe hydrocephalus. Similarly, Hassler (1964) and Ransohoff et al. (1975) reported an increase in vessel number in later stages of hydrocephalus.
In the current study, the authors quantify cerebrovascular changes in their previously developed model of progressive chronic hydrocephalus (Johnson et al., 1999). They measure vessel diameter, density, and percent luminal area in the occipital cortex from the cortical surface to the periventricular white matter and in the caudate nucleus. The goal of this study was to characterize the regional changes in vascularity that accompanies chronic progressive hydrocephalus.
Because astrocyte activation and gliosis have been widely used as an indicator of central nervous system (CNS) damage (Eng et al., 1992; Halliday et al., 1996; Petito et al., 1992; Price et al., 1992), the authors also performed glial fibrillary acidic protein (GFAP) immunohistochemistry and quantified the density of GFAP positive fibers in these regions.
MATERIALS AND METHODS
Hydrocephalus induction
All animal experiments were performed in accordance with NIH and The Cleveland Clinic Foundation Guidelines for the Use and Care of Laboratory Animals. Twenty of the adult mongrel canines weighing between 20 to 25 kg that were used in the initial model development (Johnson et al., 1999) were used in this study. Adult obstructive hydrocephalus was produced by injecting 0.25 to 0.35 mL cyanoacrylate glue (Applied Industrial Technologies, Eastlake, OH, U.S.A.) into the anterior fourth ventricle (Fig. 1). Refer to Johnson et al. (1999) for a more detailed description of the induction method. Most animals exhibited transient signs of lethargy, episodes of posterior limb ataxia, and vomiting limited to 3 to 7 days postinduction. However, no long-term focal neurologic deficits were observed in any animal.
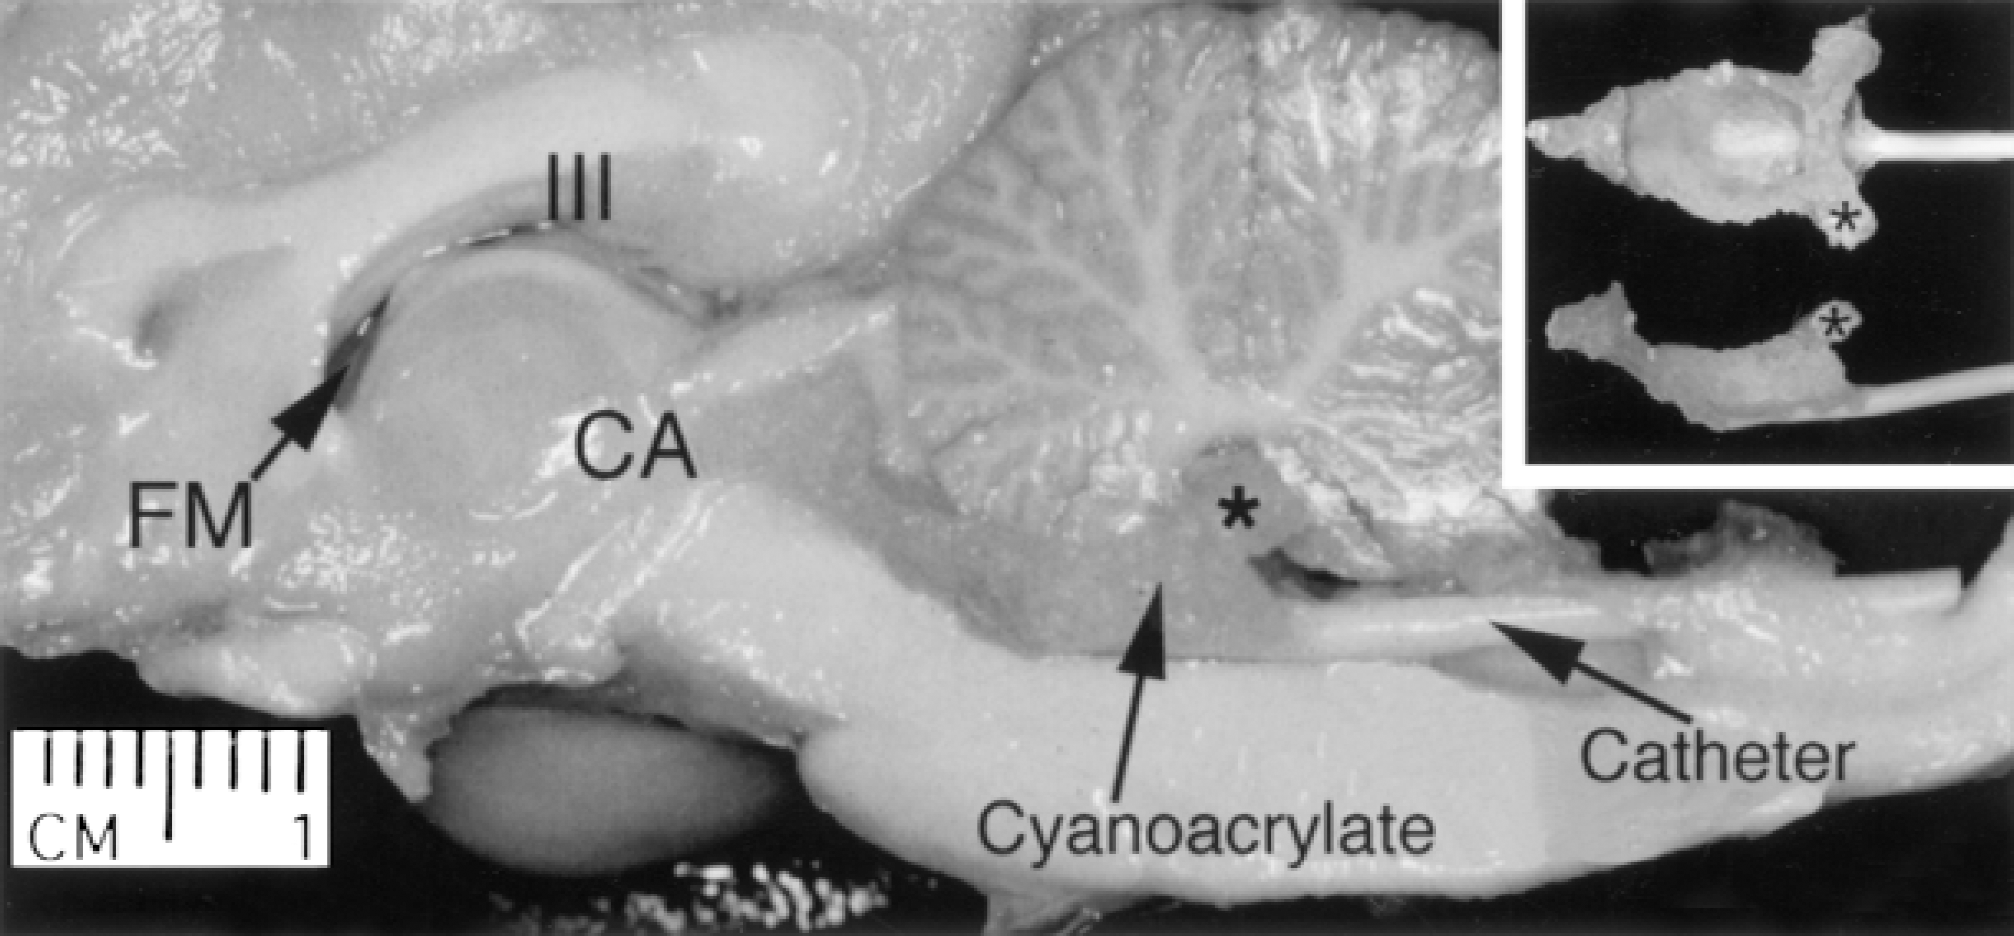
A hemisected canine brain in which hydrocephalus had been induced demonstrating the localized cyanoacrylic cast of the fourth ventricle and injection catheter that effectively obstructs ventricular circulation. FM, Foramen of Monro; III, third ventricle; CA, cerebral aqueduct. *Left foramen of Luschka. Asterisk identifies the same region of the gel cast on all three images.
Magnetic resonance imaging monitoring and measurements
Obstructive hydrocephalus evolved for a maximum of 12 weeks and was monitored through magnetic resonance imaging every 3 weeks postinduction and 1 to 2 days before death. Both baseline and postinduction images were collected as a routine spin echo, multiplanar reconstruction on a 1.5T Seimens Vision Magnetom and then transferred onto hard copy films. An illustrated example of ventricle enlargement is shown in Fig. 2. The thickness of the caudate and the occipital cortex of each animal were measured from pre- and postinduction hard copy magnetic resonance films. The caudate thickness preinduction (n = 9) and postinduction (n = 13) was measured at the level of the foramen of Monro. Left and right caudate were measured and an average thickness was calculated. Caudate thickness could not be calculated in all animals because some did not have a caudate margin clearly visible on the magnetic resonance imaging. However, these animals were histologically quantitated. Measurement of the occipital cortex included gray matter and periventricular white matter and was obtained at the posterior end of the fornix. Measurements were taken from the left and right hemispheres at the widest portion and perpendicular to the pial surface. These measurements then were averaged to obtain a single reading.
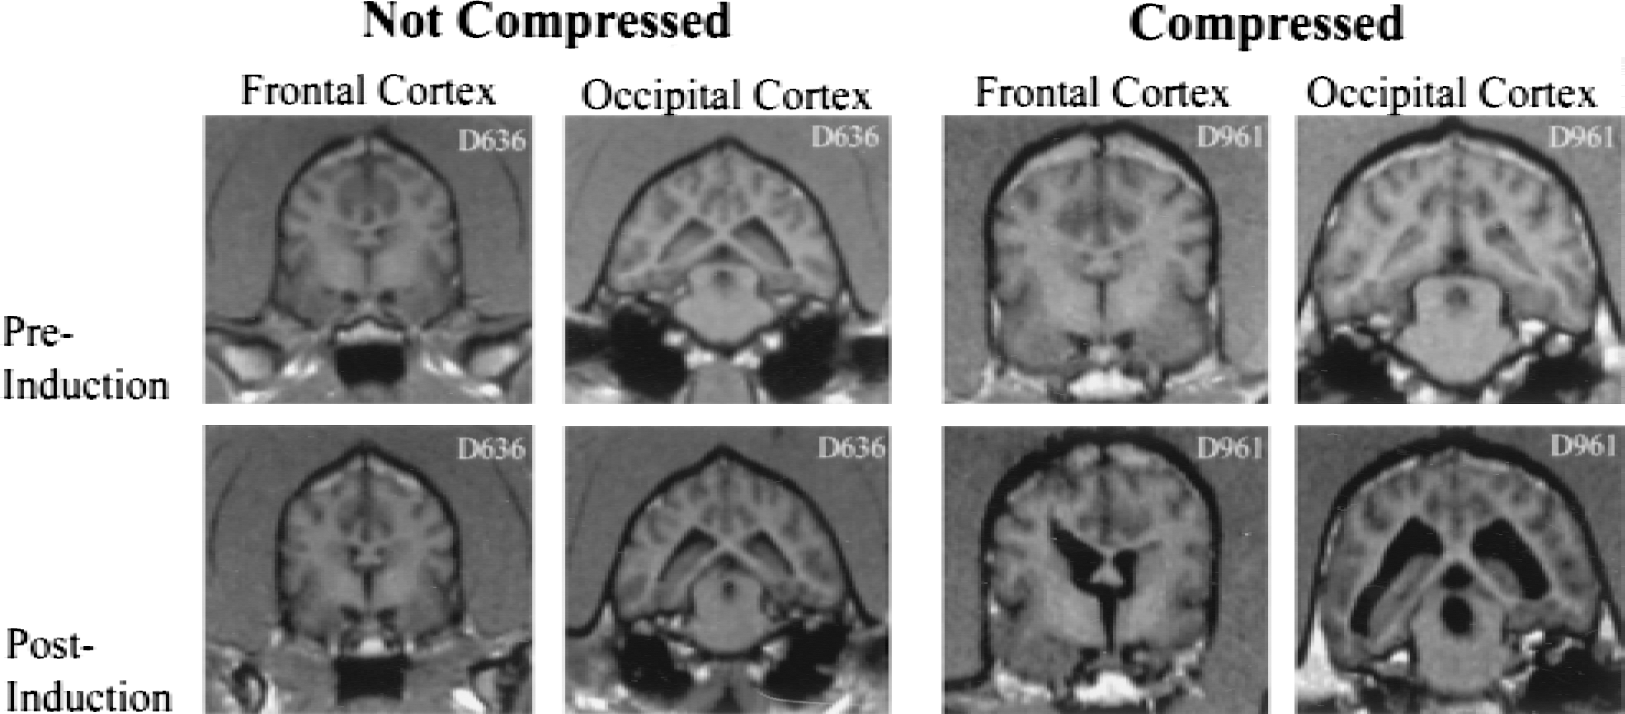
Preinduction and postinduction magnetic resonance images of the frontal and occipital cortexes for two individual canines. The first animal demonstrates no compression of the cortex (surgical control) and the second animal demonstrates compression of the cortex (successful hydrocephalus induction). Images were acquired 2 to 3 days before induction and 2 to 3 days before death.
Animal groups
Fifteen dogs were used for this study based on the verification of ventriculomegaly and appropriate length of follow up. Animals were assigned to one of four groups based on changes in occipital thickness measurements and time after hydrocephalus induction. The five animals not included did not meet the grouping criteria (Fig. 3).
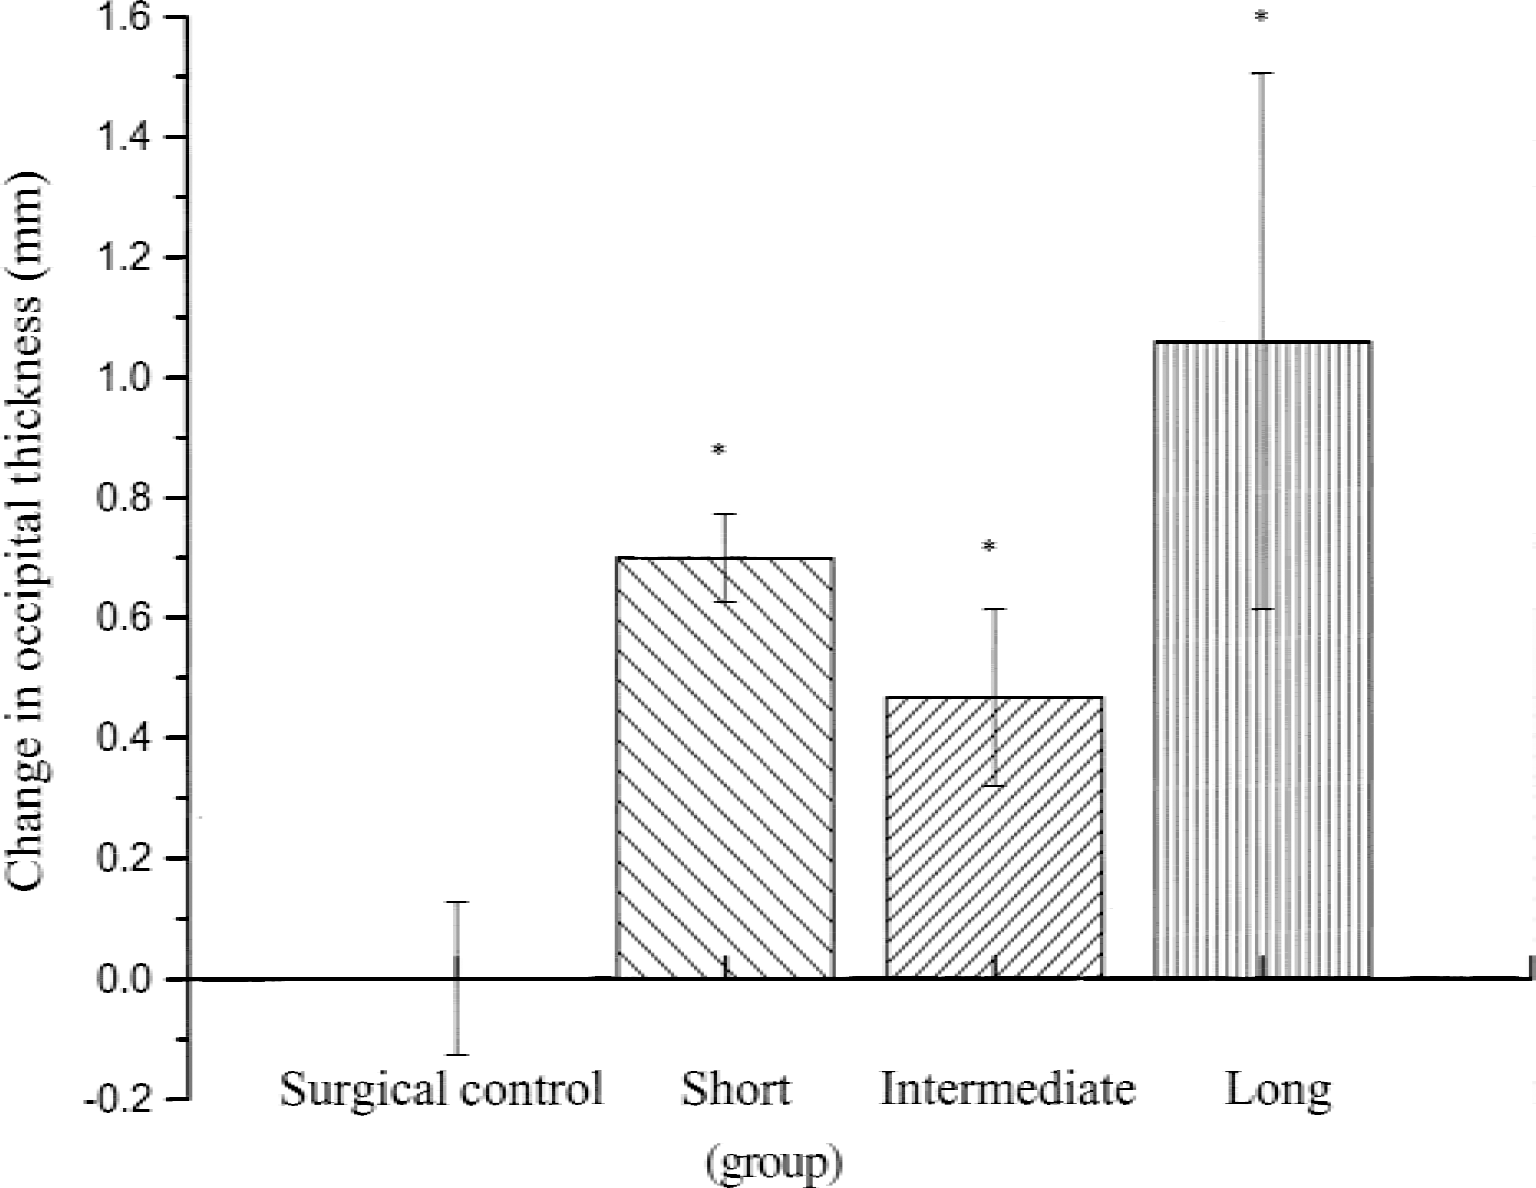
Change in occipital cortex thickness (mm) from preinduction to postinduction in the four animal groups. There was a significant difference among the groups (P = 0.0002). *Significance from the surgical control. All data are expressed as the mean ± SD.
Surgical controls (n = 5)
Animals that showed no clinical signs of hydrocephalus and no ventricular enlargement were killed in the short term. They were considered as induction failures with probable periobstructive CSF leakage (Johnson et al., 1999) and, therefore, served as surgical controls. Animals in this group were killed at ≤5 weeks with a mean of 32 days (range 29 to 35 days). They experienced no occipital cortex compression with a mean postinduction thickness change of 0 mm (range −0.13 to 0.13 mm).
Short term (n = 4)
The short-term group consisted of animals that were killed at ≤5 weeks with a mean of 25 days (range 8 to 35 days) after induction. They experienced occipital compression with a mean of 0.70 mm (range 0.64 to 0.76 mm).
Intermediate term (n = 3)
The intermediate-term group consisted of animals that were killed at approximately 8 weeks with a mean of 56 days (range 54 to 58 days) after induction. These animals had an occipital compression mean of 0.47 mm (range 0.38 to 0.64 mm).
Long term (n = 3)
The long-term group consisted of animals that were killed at 10 to 12 weeks with a mean of 77.67 days (range 72 to 85 days) after induction. These animals had an occipital compression mean of 1.06 mm (range 0.64 to 1.52 mm).
Tissue preparation
Animals were deeply sedated with sodium pentobarbital in combination with inhaled halothane. They were killed with a transcardial perfusion of 0.9% saline (500 mL) and 4.0% formaldehyde (4 L). After perfusion, brains were extracted and allowed to post-fix in 4.0% formaldehyde for 1 to 5 days, after which they were blocked and immersed in a cryoprotective solution consisting of 30% sucrose and phosphate-buffered saline. Intraanimal consistency in blocking was based on gyri and sulci landmarks, as well as anterior to posterior coordinates. Frontal brain landmarks included the orbital sulcus (anterior) and cruciate sulcus (posterior). Occipital brain landmarks included the ectosylvian sulcus (anterior) and ectolateral sulcus (posterior) (Lim et al., 1960).
Cerebrovascular morphology: silver impregnation and analysis
Five-micron paraffin-embedded serial sections from the occipital and frontal region were impregnated with silver to visualize changes in the vascular tree. The protocol used was adapted from Putt (1972). The tissue was incubated with 5.5% (w/v) D (+)-glucose anhydrous (assay >99.5% HPLC) (Fluka BioChemika, Milwaukee, WI, U.S.A.) for 2 minutes at 37°C followed by the following: 1) 0.15% (w/v) AgNO3 (Sigma, St. Louis, MO, U.S.A.) for 2 minutes; 2) 5.5% (w/v) D (+)-glucose anhydrous for 2 minutes; 3) 1.0% (w/v) NH4Br (Mallinckrodt Chemical, Phillipsburgh, NJ, U.S.A.) and 3.0% (w/v) CoBr2 (Fluka Biochemika, Buchs, Switzerland) for 2 minutes; and 4) D (+)-glucose anhydrous 5.5% for 2 minutes. The tissue then was washed in fresh 5.5% D (+)-glucose anhydrous for 5 minutes and exposed to ultraviolet light for 120 minutes. Immediately after, the tissue was counterstained with toluidine blue (Fisher Scientific, Fairlawn, NJ, U.S.A.), run through graded alcohols and mixed xylenes, and coverslipped using Krystalon (Electron Microscopy Sciences, Fort Washington, PA, U.S.A.). One hematoxylin and eosin slide per animal was prepared to study general tissue structures.
To maintain interbrain consistency, the suprasylvian gyrus was used as an anatomic landmark. From rostral to caudal, three serial sections in each dog were analyzed. Specific brain regions from the occipital cortex chosen for vascular quantitation included: superficial gray matter (layers I and II), deep gray matter (layers V and VI), and deep white matter of the cortex. The “cortical gray region” is derived from the combination of measurements from the superficial gray matter and deep gray matter. In addition, four regions of the periventricular white matter were chosen for analysis-superior periventricular white matter, inferior periventricular white matter, lateral periventricular white matter, and medial periventricular white matter. Two regions of the caudate in the frontal cortex were quantitated-deep caudate and periventricular caudate.
Slides were viewed under a light microscope at a magnification of 40x, saved on disk, and quantitatively analyzed with Bioquant 95 (R&M Biometrics), a computer-imaging analysis system. Thresholding color techniques and manual selection were used.
Four measurements were obtained: 1) area of tissue analyzed (region of interest), 2) number of vessels in the region of interest, 3) lumen area (jxm2) of vessels, and 4) diameters of the respective lumen areas. From these measurements calculations were made for the following: 1) diameter of vessels (mm), 2) density (number of vessels per mm2 of tissue area), and 3) lumen area (percentage of tissue that is blood vessel lumen area). Calculations were made for capillaries and large vessels, as well as capillaries and large vessels combined.
A clearly identifiable endothelial cell lining, endothelial cell nucleus, and/or a smooth muscle wall was used to manually select vessels. The morphometric measuring technique of vascular diameters was similar to that of Jones et al. (1991). Each vessel lumen diameter was measured from a calibrated screen image as the Feret diameter at 90 degrees to the longest Feret (Keep and Jones, 1990). The differentiation of vessels was based on lumen diameter (Berne and Levy, 1993; Krause and Cutts, 1994) and classified in a similar method as Del Bigio and Bruni (1988). Vessels with a Feret diameter of <10 microns were quantified as capillaries, and vessels with a Feret diameter ≥10 microns were quantified as large vessels.
Positive glial fibrillary acidic protein fiber density: immunohistochemistry and analysis
The immunohistochemical protocol used to assess GFAP was adapted from a previous study (Collins, 1979). Frontal and occipital regions were sectioned and processed at a thickness of 40 μm to provide the best visualization of the astrocytes. Tissue sections were rinsed thoroughly in tris-buffered saline before treatment with 1.0% hydrogen peroxide and 0.1% triton X-100. The tissue then was incubated in 3.0% normal goat serum (Sigma) followed by an overnight incubation at 4°C with a polyclonal antibody directed against GFAP (anti-bovine GFAP, Dako, Carpinteria, CA, U.S.A.) diluted at 1:2000. Sections were rinsed and treated with a biotinylated goat anti-rabbit IgG at a dilution of 1:500. Tissue sections were then rinsed again and treated for 60 minutes in avidin-biotin complex (ABC ELITE KIT, Vector Labs, Burlingame, CA, U.SA.), and then treated with 3,3-diaminobenzidine tetrahydrochloride (DAB Tablets, Sigma) for 5 minutes. Sections were rinsed in water, mounted on chrom-alum coated slides, allowed to dry overnight, dehydrated, cleared with xylene, and coverslipped using Krystalon (Electron Microscopy Sciences). Forty-micron sections, adjacent to those processed for GFAP immunohistochemistry, were used for cresyl violet and hematoxylin and eosin stains to identify cell morphology and cortical cytoarchitecture.
The following regions of interest were evaluated for positive GFAP fiber density: caudate nucleus, occipital gray matter (suprasylvian sulcus), and the occipital periventricular white matter (middle of the lateral periventricular wall). A grid counting technique was used to assess the number of GFAP-stained processes in a 0.04 mm2 area, in 3 adjacent fields at a magnification of 63x (oil immersion). The technique was used for each region of interest in the following manner: gray matter-3 adjacent strips perpendicular to the pial surface, spanning only the superficial layers; caudate-3 adjacent strips perpendicular to the medial portion of the ventricle wall spanning the entire width of the caudate; and the occipital periventricular white matter-3 adjacent strips perpendicular to the ventricle wall and pial surface spanning the superficial layers. Glial fibrillary acidic protein density was calculated by dividing the total number of positive GFAP processes by the total area analyzed.
Statistical analysis
Vascular parameters and positive GFAP fiber densities were analyzed with one-way analysis of variance. If analysis of variance indicated significant differences, pairwise comparisons between animal groups used Student's t-tests (with Bonferroni P value adjustments) to compare differences in the tissue regions for diameter, density, and percent lumen area. All data are expressed as the mean ± SD. For the diameter measured in a given tissue region, the average diameters were calculated. Density and percent vascularity in periventricular white matter were calculated as an average of the four periventricular regions. One animal, D687 (short term), did not have an inferior periventricular white matter measurement. Density and percent vascularity in PW for this animal were calculated as an average of the three remaining regions. A paired t-test was used to compare mean pre- and postinduction occipital and caudate thickness measurements.
RESULTS
Hydrocephalus induction
Postinduction occipital cortex (n = 15) thickness decreased significantly when compared with preinduction occipital cortex (x = 4.22 mm and × = 4.71 mm, respectively; P < 0.01). The caudate also showed significant compression when postinduction caudate (n = 7) thickness was compared with preinduction (n = 7) thickness (x = 1.44 mm and × = 1.78 mm, respectively; P < 0.05). As described in the Methods section, animals were divided into groups based on duration and occipital compression. Overall, there was a significant difference (P < 0.01) in occipital compression among the four groups (Fig. 3). The short-term, intermediate-term, and long-term groups showed significant occipital compression (P < 0.01) when compared with the surgical control (short term = 0.70 mm, intermediate term = 0.47 mm, long term = 1.06 mm, and surgical control = 0.00). The intermediate-term group change in occipital thickness was significantly less then the short-term group (P < 0.05), however, the long-term group occipital compression was not statistically different from the intermediate-term or short-term group.
Vessel diameter
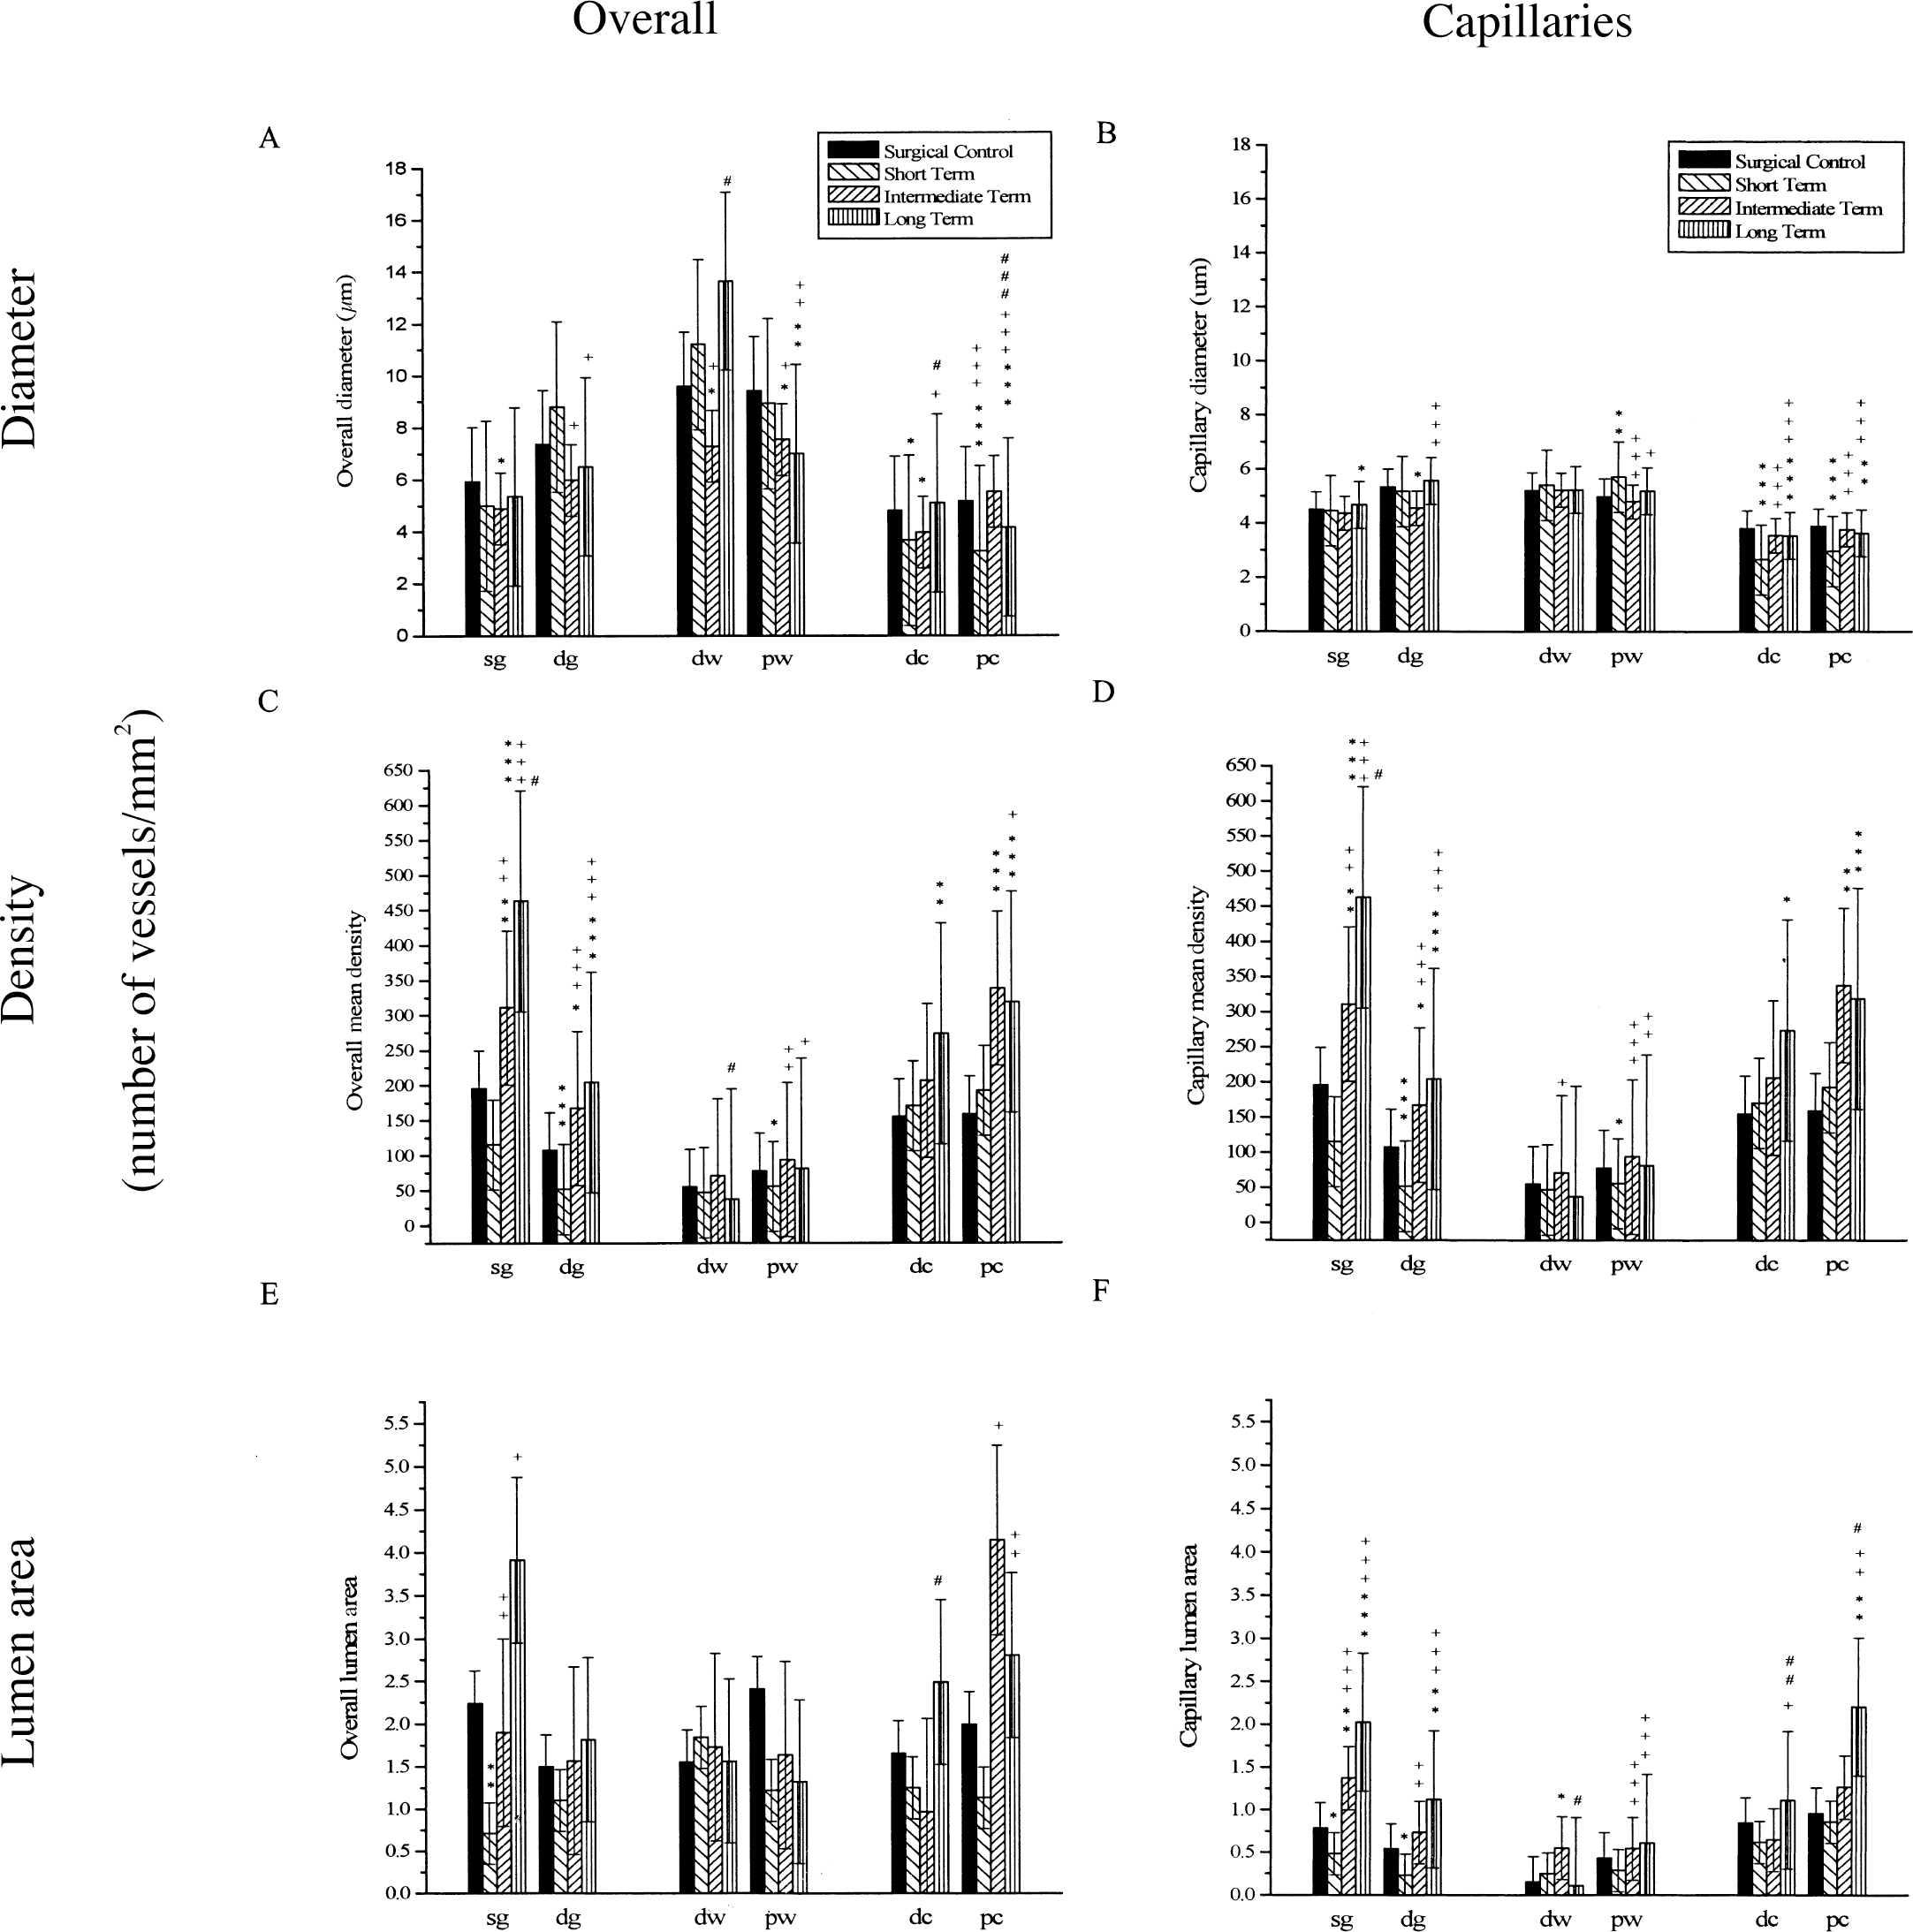
Significant changes in overall vessel diameter and capillary vessel diameter among the four groups can be seen in Figs. 4A, 4B, and 5. Periventricular structures, especially the caudate, showed the most significant diameter changes. Differences are observed in overall vessel diameter, but more so when capillaries are considered separately. There is a general pattern of vessel diameter compression followed by vessel diameter recovery, seen most clearly in the caudate where vessel diameter was near that of surgical control at 12 weeks. Capillary vessel diameter decreased 23.5% to 30.2% (P < 0.01) in the caudate, but then returned to normal at 12 weeks.
Significant changes in overall and capillary vessel diameter
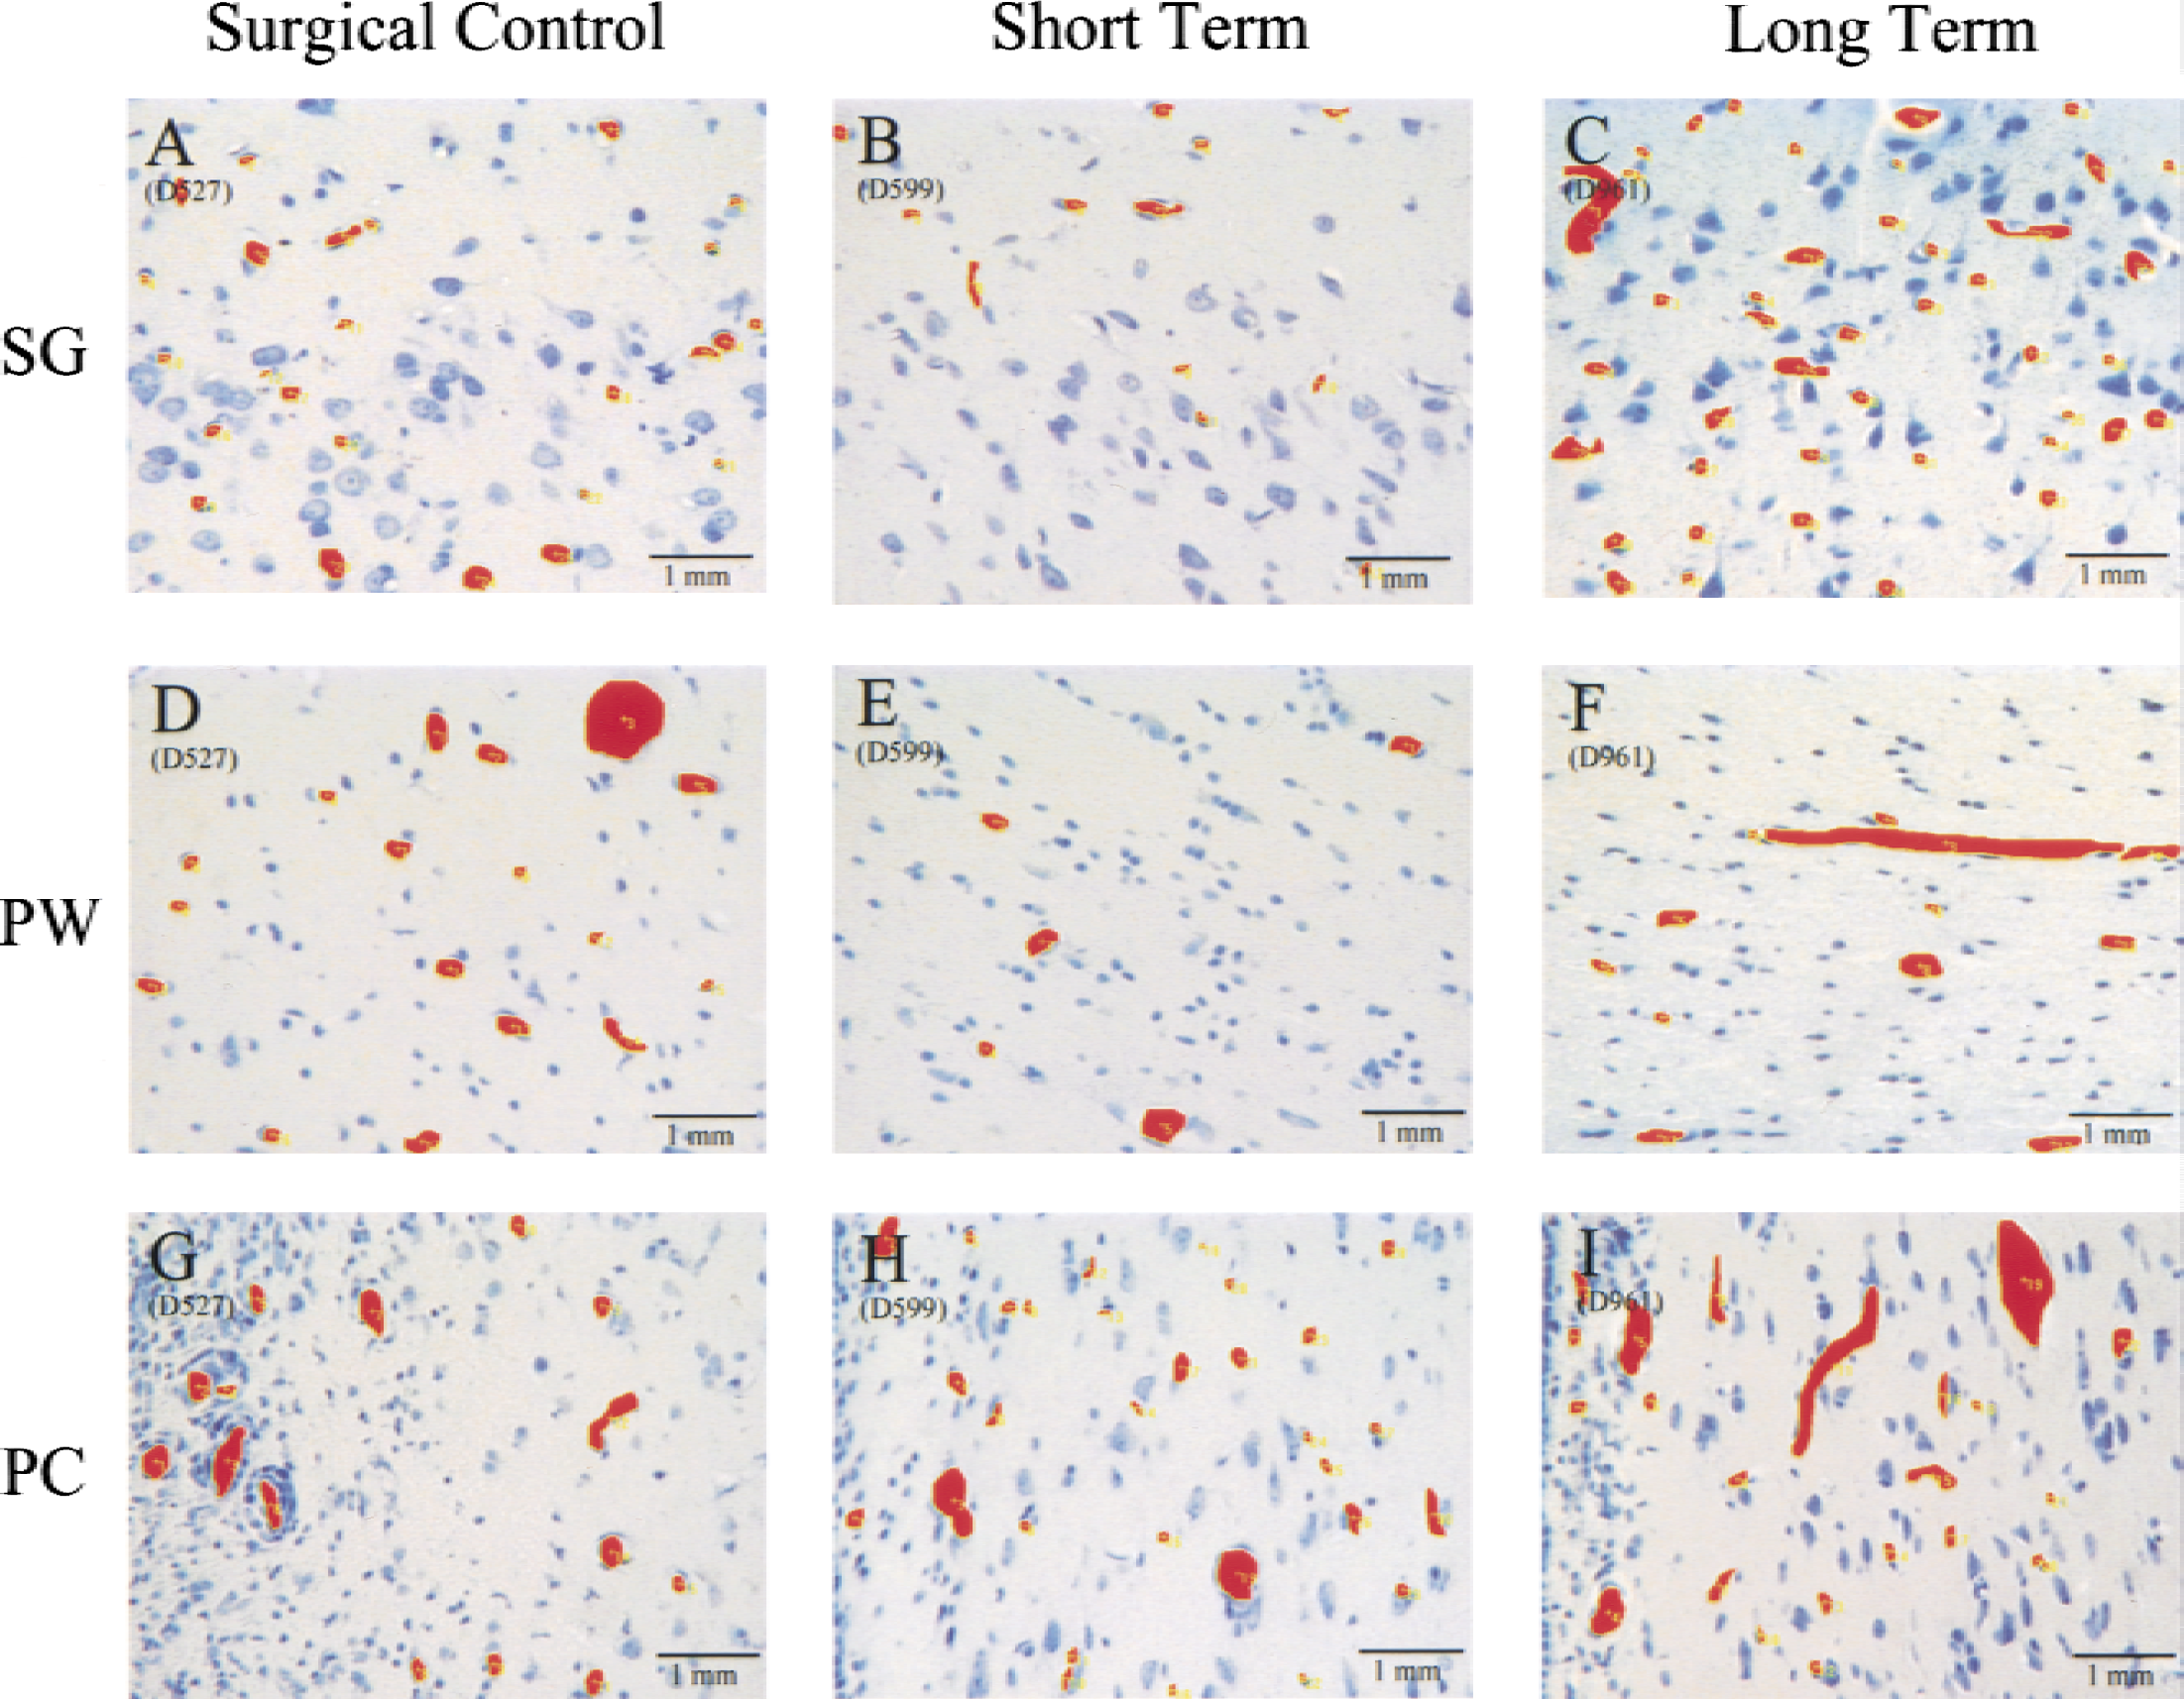
Slides viewed at 40x under a light microscope, saved on disk, and quantitatively analyzed with Bioquant 95. The diameter, density (number of vessels per mm2 of tissue area), and lumen area (percent of tissue that is blood vessel area) were calculated by the program after manual selection of the region of interest and vessels.
Vessel density
Changes in overall and capillary vessel density can be seen in Fig. 4C and 4D. The overall vessel densities changes are parallel and are explained by density changes of the capillaries considered alone. Unlike vessel diameter, more significant changes were seen in the cortex than in the caudate. Although the caudate did not show an initial decrease in vessel density, the long-term group capillary density was significantly greater (172.8% to 210.5%, P < 0.01) than surgical controls. In the cortex, when comparing groups to the surgical controls, again there is an initial decrease in the short term, followed by later recovery. When the superficial gray matter and deep gray matter are combined, the cortical capillary vessel density decreased 53.5% (P < 0.02), but then increased 234.8% (P < 0.01) over surgical controls at 12 weeks.
Percent lumen area
The changes observed in vessel lumen area can be seen in Fig. 4E and 4F. Overall mean percent lumen area is affected by diameter and density. Therefore, it showed some of the same patterns observed in the cortex and caudate (Fig. 5). With the exception of deep white matter, all regions showed the same pattern of decreased percent lumen area followed by a significant increase. Significant decreases were observed in superficial and deep gray matter. All regions showed a significant increase in percent lumen area over time.
Immunohistochemistry
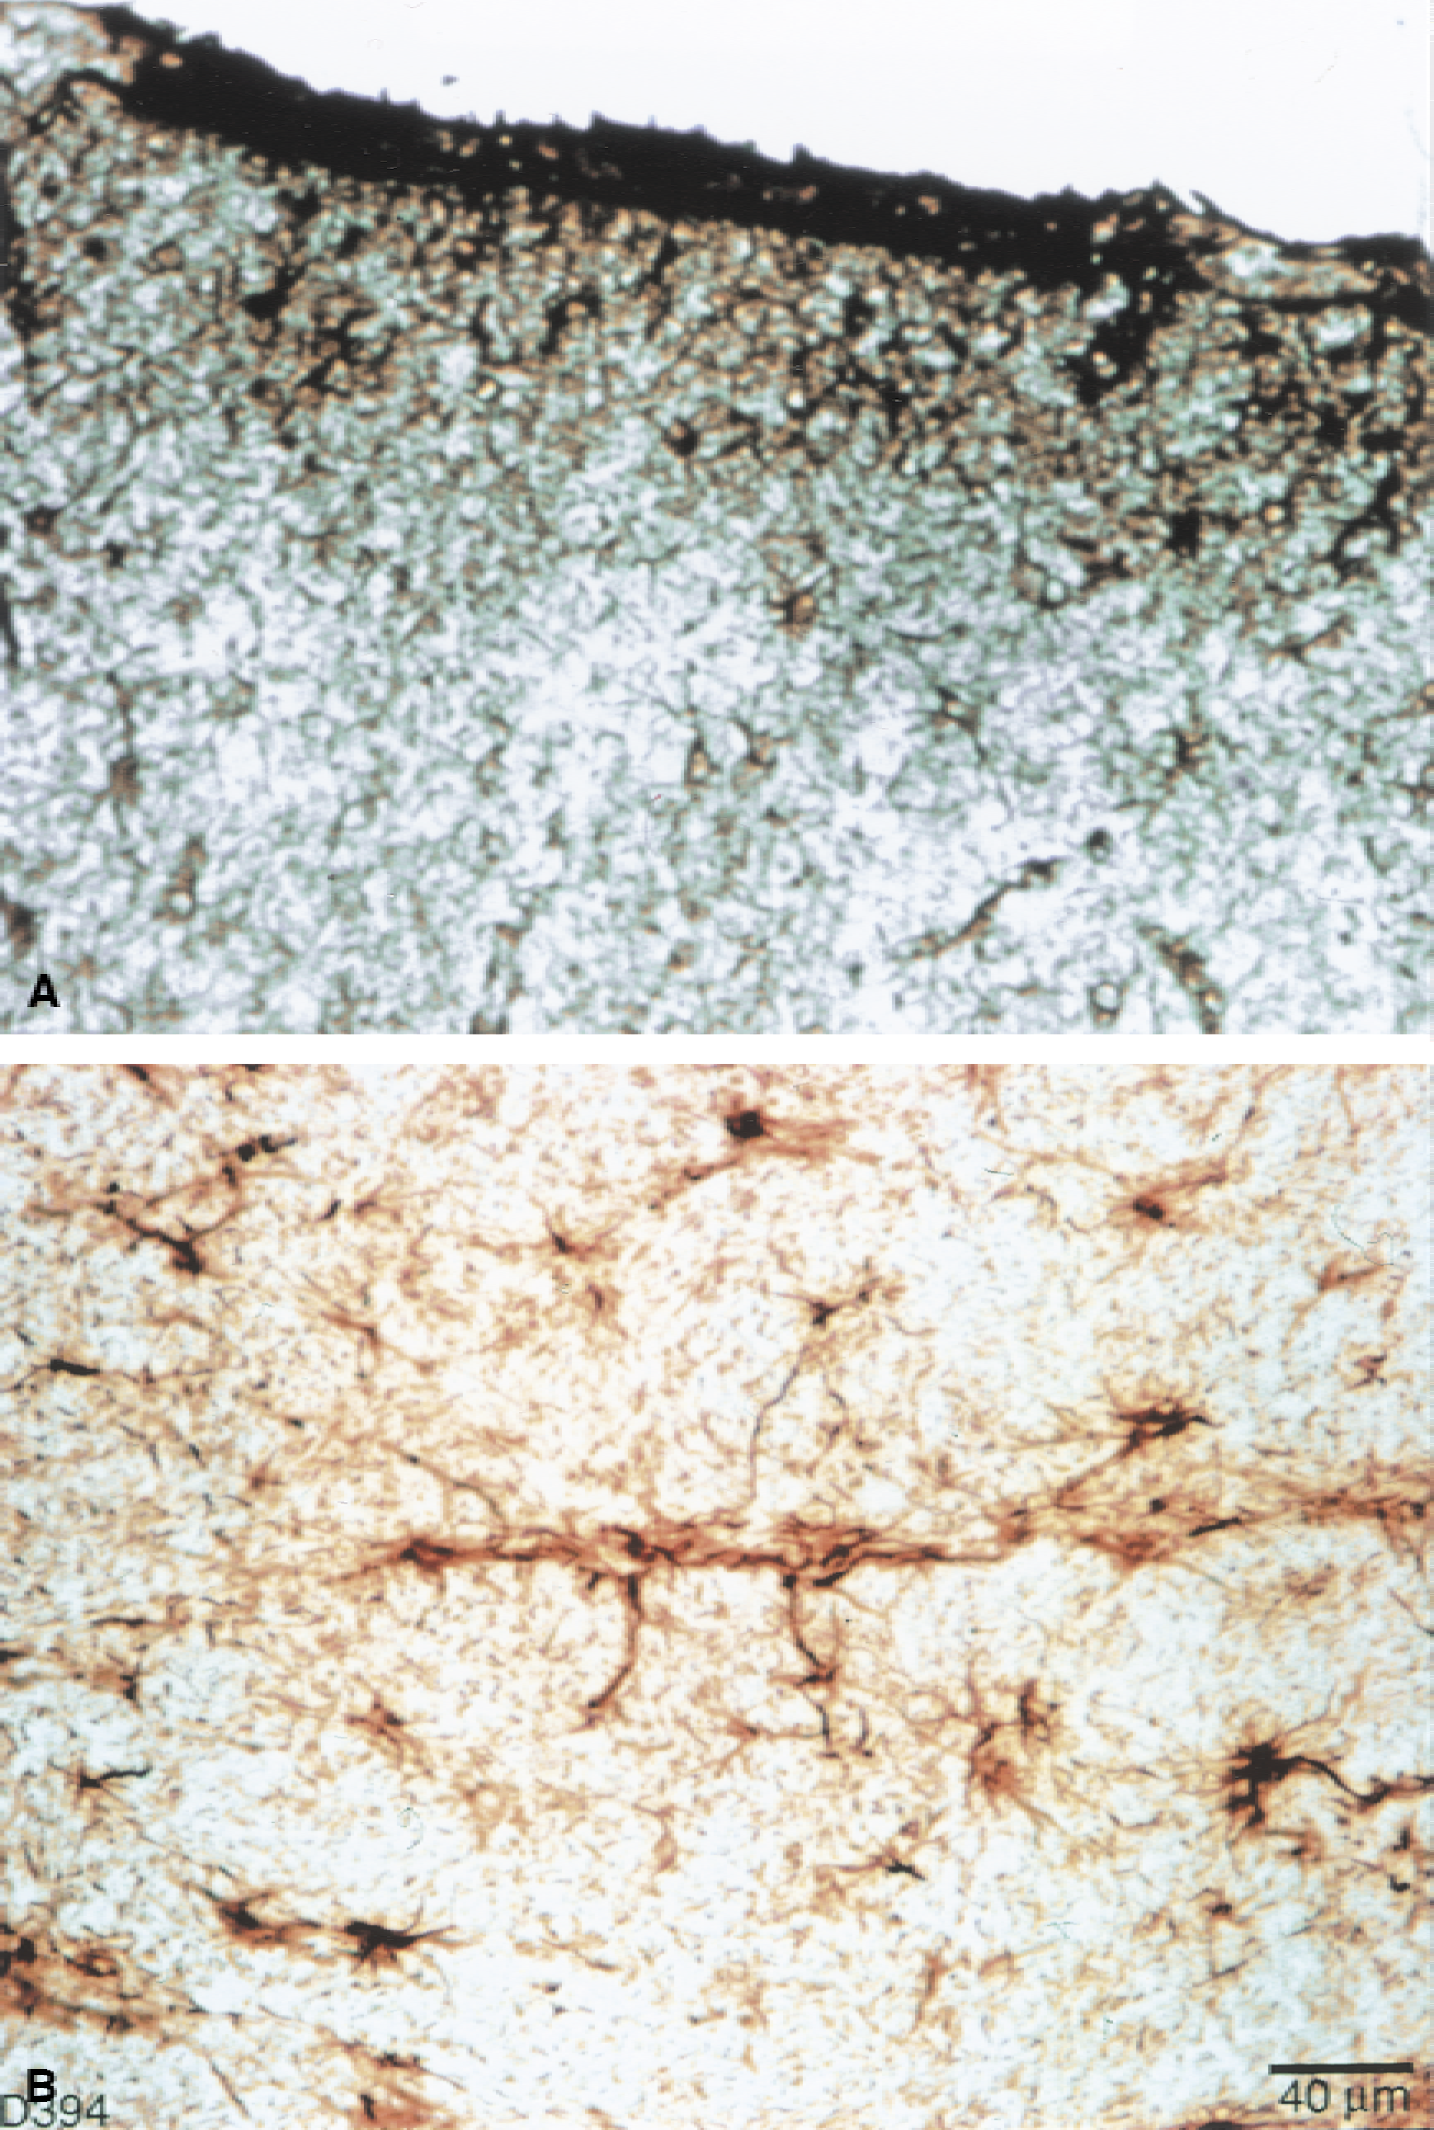
Glial fibrillary acidic protein immunohistochemically stained sections of the caudate revealed morphologic changes of activated astrocytes with hydrocephalus. As caudate compression increased, astrocytes exhibited swelling of the soma and shortening and thickening of processes (Fig. 6), although fiber density was not significantly increased (Fig. 7). There were more stained fibers in occipital white matter then in occipital gray matter (Fig. 7). Within the cortical gray matter there was increased vessel fiber density superficially in the subpial region (Fig. 8A), and pericapillary staining was observed (Fig. 8B). In the caudate, there was an initial increase of GFAP staining followed by a significant (P = 0.05) GFAP fiber density decrease. There were no significant differences among the four groups in the occipital gray matter or the occipital white matter, however, a pattern of initial decrease followed by recovery similar to that of the vascular parameter measurements, was observed in occipital gray and white matter.
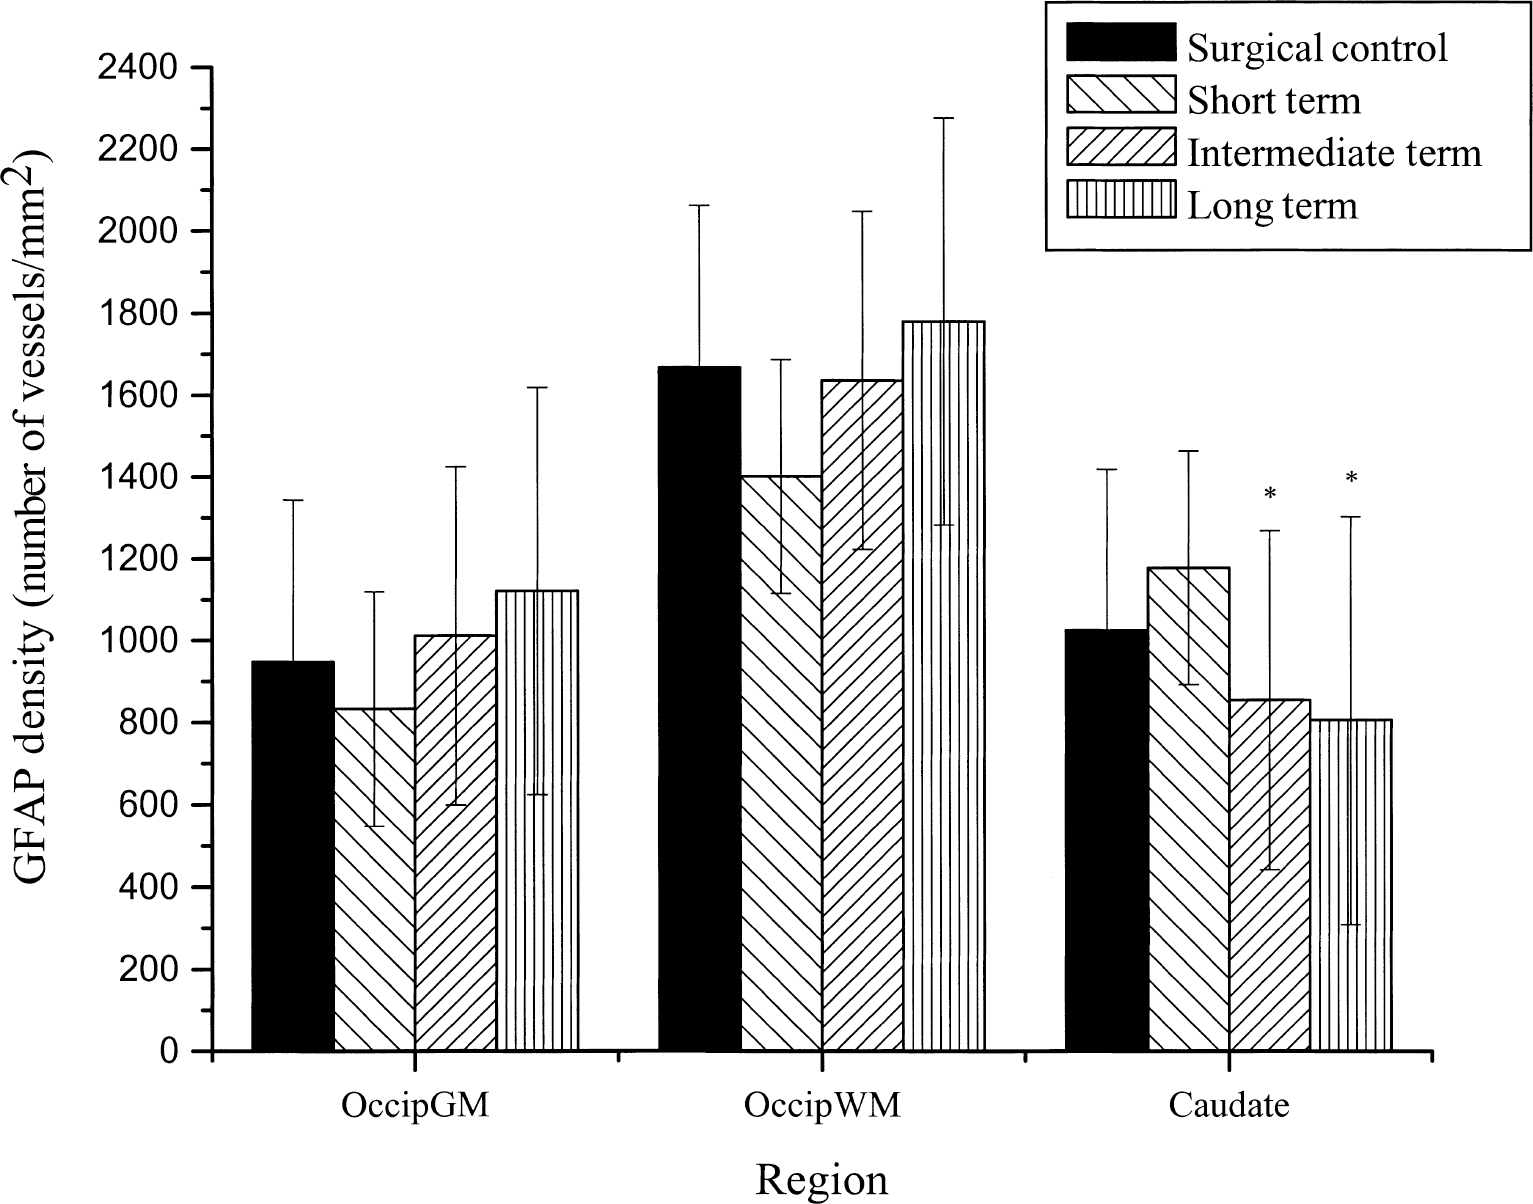
Glial fibrillary acidic protein (GFAP) density (number of vessels/mm2) in the occipital gray matter (Occip GM), occipital white matter (Occip WM), and the caudate region of the brain in the four groups of animals (surgical control, short-term, intermediate-term, and long-term compression). In the caudate, there was an initial activation of GFAP staining followed by a significant GFAP fiber density decrease (P = 0.05). *Significance from the surgical control. All data are expressed as mean ± SD.
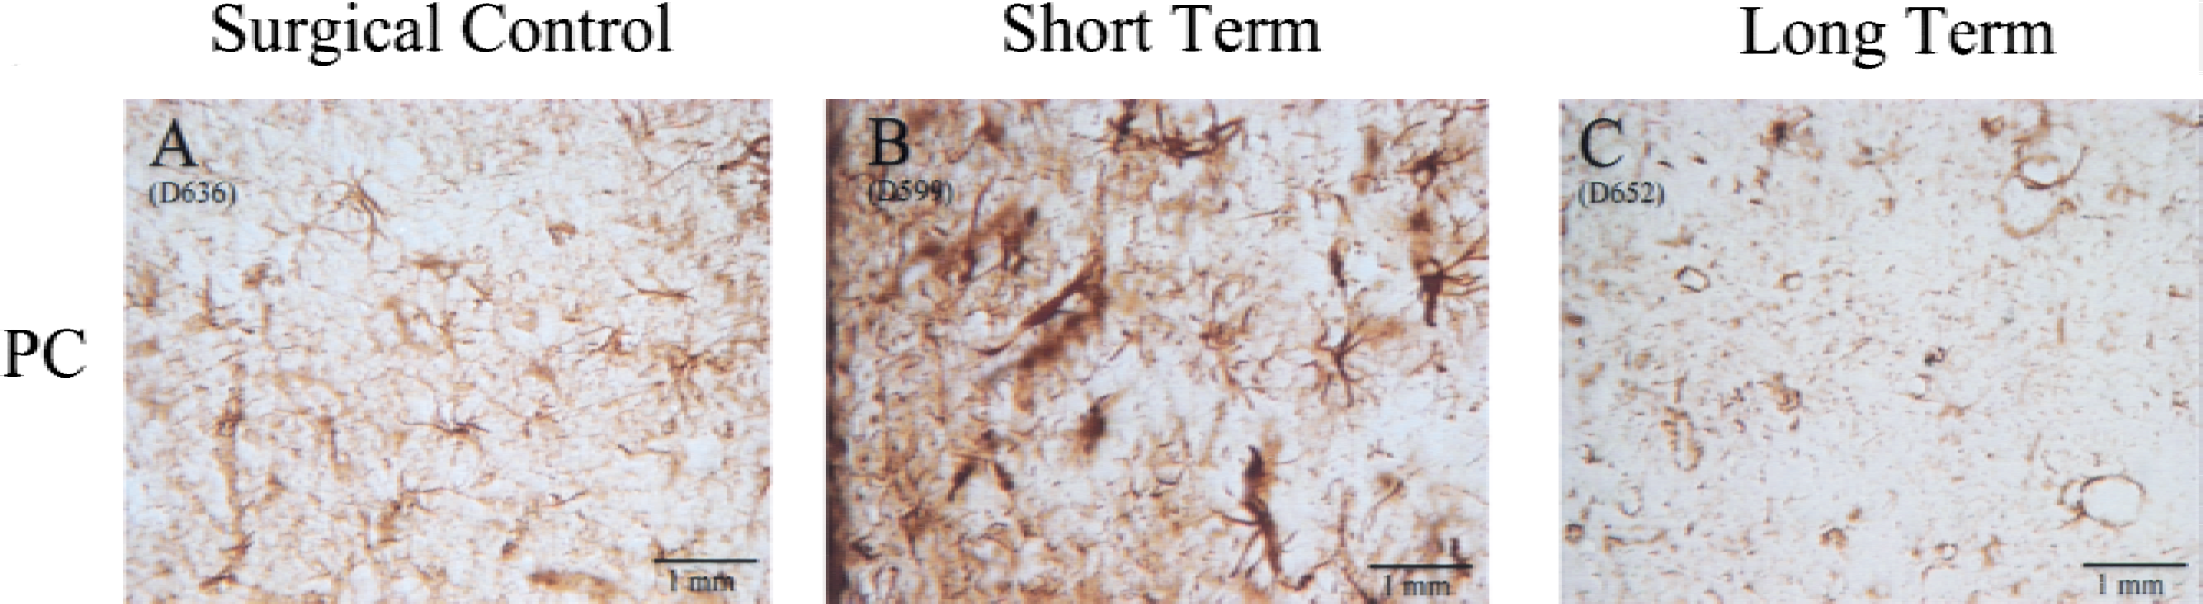
Pictures illustrating the change in glial fibrillary acidic protein (GFAP) staining in the periventricular caudate (PC) in the surgical control group
DISCUSSION
The current study demonstrates changes in cerebrovascular vessel diameter, density, and lumen area in the authors' model of chronic hydrocephalus. The temporal pattern of these changes varied by region and over the 12 weeks of observation. The overall pattern of parameter change was that of initial decrease in vascularity followed by return to baseline. The periventricular gray of the caudate differed in its pattern of change and degree of recovery when compared with cortical gray and periventricular white matter. Finally, cortical gray vascularity appears to recover and surpass control levels of vascularity.
The model of chronic hydrocephalus used in this study involves the surgical obstruction of CSF flow in the fourth ventricle, resulting in reliable ventricular expansion and tissue compression (Johnson et al., 1999). The ventricular expansion was gradual and allowed survival with maintenance of good CNS function and minimal symptoms of acute increased intracranial pressure. Unlike congenital hydrocephalus models, kaolin injection models, and balloon obstruction of the fourth ventricle, the tissue effects observed cannot be attributed to an unknown genetic pathophysiologic mechanism, inflammation, or hindbrain distortion, respectively. With the above considerations taken together, the vascular changes observed in this study were more likely to be the direct result of hydrocephalus. In addition, surgical controls were treated identically to the experimental animals with a posterior fossa craniectomy and cyanoacrylic glue injection. Surgical controls did not develop clinical symptoms of increased intracranial pressure (ICP) and ventricular expansion, presumably because of incomplete blockage and CSF leakage (Johnson et al., 1999), and therefore differ from the experimental groups in CSF obstruction and hydrocephalus only. It should be noted, however, that these surgical control animals were killed in the short-term time period only.
Several previous studies using a variety of animal models also have observed evidence of vessel compression in hydrocephalus. In kaolin-induced hydrocephalus in cats, Ransohoff et al. (1975) observed decreased periventricular vessels in acute stages. Sato et al. (1984) described capillary congestion and collapse in the periventricular white matter in dogs. Similarly, Oka et al. (1986) reported a progressive decrease in number and in diameter of capillaries in white matter, but no changes in gray matter. Oka et al. (1991) found a decrease in number and size of vessels in gray and white matter in kaolin-induced hydrocephalic rats. Del Bigio and Bruni (1988) induced hydrocephalus in rats using silicone oil and reported a decrease in the number of patent capillaries and no change in larger vessels. Similar results have been obtained from congenital models, indicating progressive decrease in the number and diameter of all vessels (Wozniak et al., 1975), periventricular vessel collapse (Okuyama et al., 1987), and decrease in capillary density in the auditory and visual cortex in chronic hydrocephalus (Jones et al., 1991).
Jones et al. (1991) found an approximately 30% decrease in capillary density in hydrocephalic H-Tx rats when compared with control animals. In the current study, similar results were observed, however, the magnitude of capillary density decrease was greater with less ventriculomegaly. The difference in the amount of density change in the two studies may be because of the difference in etiology (congenital in the H-Tx rat and artificial obstruction in the canine), age of onset, developmental stage, and the ability for cranial expansion in the H-Tx rat. Many previous studies involved models with a more acute and severe hydrocephalus and seem consistent with the authors short-term compression group, in which decreases in capillary diameter (caudate) or density (cortical gray) were observed.
A few studies have reported increases in various vascular parameters with hydrocephalus. Penfield and Elvidge (1932) observed an increased number of surface pial vessels in humans with hydrocephalus, but observed vessel collapse in later stages. Although these findings are unquantified and the observations were of the surface vascularity only, they are consistent with the authors finding of the development of hypervascularity in the superficial cortex. Ransohoff et al. (1975) also noted an increase in vessel number in chronic hydrocephalus although there is no illustration, quantitation, or description of the nature and the distribution of these changes.
An important general finding of the current study is the initial reduction in vascularity in the majority of regions studied followed by a recovery over the 12-week period. In the caudate, however, this pattern of reduction then recovery appears to result primarily from a decrease and then a return to baseline in capillary diameter. The cortex reacted quite differently. Here, the reduction in vascularity was because of an initial decrease in capillary density followed by a return of density, which was increased over surgical controls at 10 to 12 weeks (long-term group). Because these density changes were in both directions and out of proportion to the degree of tissue compression, they could not be explained by spatial compression of an intact vascular tree. The bioquant methodology used in this study depends on the identification of vessel lumen. Therefore, a decrease in number of observed vessels could be related to capillary collapse, whereas a recovery might be related to increased capillary filling. Although not proven in this study, capillary angiogenesis may also explain increased cortical capillary density.
Many studies have indicated a chronic hypoxic state in hydrocephalus (Del Bigio, 1993; Higashi et al., 1986; Richards et al., 1989). It is possible that in this state there may be an increase in angiogenesis factors increasing the density of capillaries. For example, this is seen clinically in Moya Moya disease in which capillary neogenesis is a critical adaptive process (Scott and Renkens, 1994). LaManna has described capillary angiogenesis in rats after several weeks of hypobaric cerebral hypoxia (LaManna, 1992; LaManna et al., 1994; LaManna and Harik, 1997). In his rat model, animals are exposed to hypobaric chambers with the oxygen tension of approximately 50% that of normal (LaManna and Harik, 1986). Capillary densities increase in a time course consistent with the current study (LaManna, 1992; LaManna et al., 1994; LaManna and Harik, 1997). This capillary increase is seen primarily in metabolic reactive areas such as the cortex (Penfield and Elvidge, 1932). Furthermore, these increases are reversible over the course of weeks when the animals return to normal oxygen tensions (LaManna, 1992; LaManna et al., 1994). In other studies using the current model (unpublished data), the authors observed decreased oxygen saturation in brain parenchyma compared with controls, which normalizes with shunting. Thus, the increased capillary density seen in the cortex of animals with chronic hydrocephalus may be an adaptive response (angiogenesis) to a chronic hypoxic state.
The GFAP immunohistochemistry revealed an expected increase in GFAP staining in hydrocephalic animals. Glial fibrillary acidic protein fiber densities were generally greater in the white matter than in the cortical gray or caudate nucleus. Large reactive astrocytes were seen in the caudate with thickened GFAP-positive fibers in the short-term group. The number of fibers, however, decreased significantly in the longer-term groups. This finding is consistent with an activation of astrocytes with subsequent decrease in GFAP staining after injury (Eng et al., 1992). Interestingly, however, the pattern of GFAP fibers staining was different in the cortical region. Here the pattern of decrease and subsequent recovery in fiber density paralleled the vascular density changes, but as a trend only. Because GFAP fibers were most dense in the superficial gray area and were seen surrounding capillaries, the authors speculate that there is an additional continual stimulus for astrocyte GFAP activation accompanying the progressive increase in capillary density.
Conclusions
This study suggests that there are significant changes in the cerebral vascular anatomy in slowly progressive hydrocephalus, in which there is minimal symptomatology and good CNS function is maintained. Although decreases in periventricular capillary diameters, as seen in the caudate, are consistent with periventricular compression suggested by other studies, the authors also observed significant recovery and increase in cortical capillary density over 12 weeks. They speculate that this increase in vascularity in the metabolic active cortex is an adaptive process allowing maintenance of adequate cerebral perfusion and metabolic support. This may be one mechanism that allows continued cerebral function with progressive ventricular expansion and cortical thinning. Further studies will be aimed at identifying the cause of the increased cortical density and will investigate the possibility of capillary angiogenesis. In addition, time course and pattern of vascular changes under varying severity and chronicity and after surgical treatment will be studied. Cerebral blood flow studies are also needed to demonstrate a physiologic correlate to these anatomic changes. If an increase in capillary density is indeed an adaptive process, which reduces the level of hypoxia and CNS injury in hydrocephalus, then enhancement of this process may be an important adjunct to ventriculoperitoneal shunting in chronic hydrocephalus.
Footnotes
Acknowledgment
The authors thank David Nelson, M.S., Senior Biostatistician in the Department of Biostatistics and Epidemiology at the Cleveland Clinic Foundation, for his help with statistical analysis.