
Abstract
Blood-brain ratios (BBR) of phenylalanine (Phe) were determined by quantitative in vivo 1H magnetic resonance spectroscopy (1H-MRS) in 17 adult patients with early-treated phenylketonuria who were randomly selected from a sample of 75 adults. Measurements were performed in all patients during steady-state conditions. The BBR showed a unimodal distribution with a mean of 4.0 (range 3.3 to 4.5). Blood-brain ratios were comparable for subgroups of patients with genotypes classified as severe, moderate, or mild and for patients on different types of diets. Brain Phe concentrations showed a strong linear correlation with blood Phe values (r = 0.93, P < 0.001). There were no saturation effects for blood Phe values up to 1.8 mmol/L, and a local regression analysis did not confirm increasing BBR for increasing blood Phe values. The intellectual outcome (Wechsler Adult Intelligence Scale) was correlated with long-term dietary control (r = −0.65, P < 0.05), fluctuation of blood Phe values during treatment (r = −0.60, P < 0.05), and concurrent blood and brain Phe concentration. The severity of white matter changes visible on magnetic resonance images (MRI) was increased with high blood and brain Phe concentrations but failed to reach statistical significance. No correlation was found between BBR values, intelligence quotient, and MRI grade. Based on the assumption that BBR show intraindividual stability, the current data do not support the hypothesis that blood-brain barrier transport of Phe is a key explanatory factor for outcome variability in the vast majority of “typical” patients with phenylketonuria.
Keywords
Phenylketonuria (PKU) is an inborn error of metabolism (McKusick 262600) because of a deficiency of the hepatic enzyme phenylalanine hydroxylase (PAH). Early inception of a phenylalanine (Phe)-restricted diet soon after birth prevents mental retardation, neurologic symptoms, and severe behavioral disturbances in patients with PKU. A large number of mutations in the PAH gene has been identified (PAH database, www.mcgill.ca/pahdb), associated with differences in predicted residual enzyme activity (PRA) (Guldberg et al., 1998). Thus, PAH-deficient hyperphenylalaninemia is heterogeneous, ranging from “classical” PKU with zero PRA to mild hyperphenylalaninemia not requiring treatment (Scriver et al., 1995). During the last decades, the relations between predictive parameters, such as start of treatment or long-term strictness of biochemical control, and outcome-most frequently measured as intelligence quotient (IQ)-have been elucidated in numerous studies on early-treated PKU patients (Azen et al., 1991; Burgard et al., 1996b; Beasley et al., 1994). Based on an extensive analysis of PAH mutations, PRA values, blood Phe concentrations, and IQ, Lichter-Konecki et al. (1994) showed that, in addition to the overall long-term level of Phe, IQ also correlates significantly with the fluctuation of Phe values during treatment. In contrast to the long-term Phe level, which can be interpreted as a measure of dietary compliance, Phe fluctuations were associated with the genotype and correlated significantly with the PRA values of the patients.
Magnetic resonance imaging (MRI) scans of most early-treated patients with PKU show typical signal changes in the white matter of both hemispheres, cerebellum and brain stem (Pietz et al., 1996a). Thus, in addition to IQ, the severity of these abnormalities became another focus of interest. Most studies agree that Phe levels during the time before or at the MRI scan are most predictive for the extension of these signal abnormalities (Pietz et al., 1996; Cleary et al, 1994; Thompson et al., 1993). However, all these studies were based on blood Phe concentrations.
Proton magnetic resonance spectroscopy (1H-MRS) has made it feasible to determine brain Phe concentrations noninvasively (Novotny et al., 1995; Kreis et al., 1995; Kreis, 1997). Based on this approach, the characteristics of the blood-brain barrier (BBB) transport of Phe under steady-state conditions and during oral Phe loads were investigated. Avison et al. (1990) used an animal model of hyperphenylalaninemia and compared Phe levels determined by in vivo 1H-MRS with those obtained from postmortem amino acid analysis of brain tissue. However, they failed to observe a strong correlation of these parameters with concurrent blood Phe values. In a first application to human PKU subjects, Novotny et al. (1995) also found substantial differences in the blood-brain ratios (BBR) of Phe. Although these variations were not verified to arise from interindividual differences as opposed to experimental error, they speculated that interindividual differences in BBB transport of Phe might account for differences in treatment outcome in human PKU.
Further data were added by the group of Möller et al. (1995), who described a nonlinear relation between brain and blood Phe with a decreasing slope for high blood Phe values, consistent with the interpretation that Phe transport into the brain shows a saturation when blood Phe values exceed 1.2 mmol/L (Möller et al., 1995) or 1.5 mmol/L (Möller et al., 1997). In addition, Möller et al. (1998) described three adult women with PKU who had preserved normal to slightly subnormal intelligence without any treatment. Such “atypical” patients probably represent 1% to 2% of all PKU cases (Primrose, 1983). In these patients, brain Phe levels were near their detection limit (that is, less than 0.15 mmol/kgww at blood levels approximately 1.2 mmol/L Phe). In contrast, brain Phe levels in typical PKU patients were between 0.4 to 0.7 mmol/kgww. Blood Phe values were comparable to the “atypical” patients. On the basis of these results, Möller et al. (1998) concluded that variations of BBR might be a major causative factor for the individual vulnerability to PKU.
Recently, Moats et al. (2000) reported MRS data on four other exceptional PKU patients with low brain Phe concentrations and normal IQ development despite high historic blood concentrations of Phe. Consequently, differences in BBR might be an important marker influencing individual prognosis that may need to be taken into consideration when discussing the strictness of dietary control.
These data conflict with the authors' previous finding of a strong correlation between blood and brain tissue Phe concentrations in eight patients (Pietz et al., 1995). In that study, blood Phe concentrations of 1.0 mmol/L were consistently associated with brain concentrations of 0.2 to 0.3 mmol/kgww. Small interindividual differences in BBR did not seem to contribute to the cerebral toxicity effect of Phe elevations during treatment.
To further examine this issue, the current study sought to determine the characteristics of blood-brain transport of Phe as reflected by the BBR and to evaluate the clinical relevance of individual BBR. For the latter issue, the relation between BBR and important predictive parameters (genotype, long-term dietary control, fluctuation of Phe, concurrent Phe) and outcome parameters (intelligence, MRI) was evaluated.
MATERIALS AND METHODS
Subjects
Twenty patients were randomly selected from a total of 75 adult patients (18 or more years in age) that recently were being monitored for metabolic diseases at the authors' outpatient clinic (OPC). One male patient refused to participate because of agoraphobia related to the MR machine. Thus, 19 patients (10 females, 9 males) were included in this study, which was approved by the Ethics Committee of the University of Heidelberg. Before the study, the protocol was explained to all subjects and their written informed consent was obtained. Two patients were excluded from further analyses because the PRA could not be calculated for mutations that they harbored (P225R, G239V). However, inclusion of these two patients for analyzes beyond the genotypic classification did not change the results at all. Finally, all statistical analyses are based on the remaining sample of 17 patients (9 females, 8 males). The mean age was 25.8 years (range 18 to 31). Start of dietary treatment, defined as the first blood Phe level less than 0.6 mmol/L after start of diet, was at a mean age of 31 days after birth (range 11 to 63). None of the patients had a history of other factors that could disturb brain development. In addition, 10 healthy subjects (mean age 25.3 (20 to 46) years) were investigated by 1H-MRS to determine the normal MRS background signals and to estimate the size of the experimental error in the MRS measurements.
Clinical data
Mutations were identified by denaturing gradient gel electrophoresis (DGGE) scanning of the whole PAH gene and sequencing as described elsewhere (Zschocke and Hoffmann, 1999). Using a recently described scoring system (Guldberg et al., 1998), mutations were classified as either severe, moderate, or mild, and a combined assigned value (AV) was calculated to represent the individual patient's predicted disease severity. Blood Phe concentrations during the study (concurrent Phe) were determined by an enzymatic assay (Quantase® Phe assay, Porton, Cambridge, U.K.). The concurrent concentrations of the other large neutral amino acids-valine, methionine, leucine, isoleucine, tyrosine, tryptophan, and histidine-were analyzed as described in Pietz et al. (1999). The long-term level of biochemical control (Index of Dietary Control (IDC) level) was calculated as the mean of yearly computed median Phe values. Using the method of Lichter et al. (Lichter-Konecki et al., 1994) and Burgard et al. (1996a), the fluctuation of all Phe values during treatment (IDC fluctuation) was derived by computing the standard error of estimate of the Phe levels versus age for each patient (residual variation of Phe values). Six patients were off the PKU diet, three patients practiced a protein-restricted diet without intake of amino acid supplements, and eight patients practiced a varying degree of protein restriction in combination with the intake of amino acid mixtures. The latter patients stopped intake of amino acid supplements 1 to 2 weeks before the MRS examination.
All patients were investigated with a standardized neurologic examination and a standard MRI scan. White matter abnormalities were graded as described earlier (Pietz et al., 1996). Intelligence was tested with the German version of the revised Wechsler Adult Intelligence Scale before the MRS examination.
Proton magnetic resonance spectroscopy
To determine brain tissue concentrations of Phe, localized 1H-MRS was performed on a routine 1.5 T MR scanner (General Electric Medical Systems, Milwaukee WI, U.S.A.) as described in detail elsewhere (Kreis et al., 1995; Pietz et al., 1999). In brief, spectra were recorded from a large volume of 60 cm3 above the ventricular system involving white and gray matter. Spectra were acquired using a PRESS sequence (Bottomley, 1984) with outer volume suppression, water presaturation, and phase rotation (echo time = 20 milliseconds, repetition period = 3 seconds, 2048 data points). For the determination of different brain compartments and water referencing, a series of separate recordings with different echo times, but without water suppression, was acquired.
The data processing scheme was based on a three-compartment model (brain tissue, CSF, blood), in which the visibility of blood Phe was set to zero and the Phe content of CSF was assumed to be equal to that of brain (Pietz et al., 1999). Conversion to absolute concentration units relied on the unsuppressed water signal and an assumed cerebral Phe content of the healthy control group of 0.050 mmol/kgww. The determination of the Phe peak area was performed using a time-frequency domain fitting program (Slotboom et al., 1998) based on the use of the parameterized normal background signal, the parameterized spectrum of an aqueous Phe solution, and phase and lineshape information gained from the unsuppressed water signal obtained from the same region of interest.
Brain tissue concentrations are given in units of mmol/kg wet weight, whereas blood concentrations are listed in units of mmol/L. Concentration gradients of Phe between blood and brain are reported as dimensionless values, obtained by a unit conversion using brain density values of 1.05 kg/L.
Statistical analysis
Computations of statistical significance were performed using the SAS statistical software package (Version 6.12) (SAS Institute, Cary, NC, U.S.A.) on Windows-NT. All regression and correlation analyses were based on first order polynomial models (linear regression). Alternatively, a local regression analysis referred to as “loess” (local regression) (Loader, 1999) was performed to fit a polynomial model within a sliding window (locally weighted least squares) to gain further insight into different intervals of the relation between blood and brain Phe levels. This nonparametric model, which was computed using LOCFIT (Loader, 1999), is suitable if the parametric form of a regression is not available. The best fit for loess smoothing was determined by the method of generalized crossvalidation. Because of the small number of subjects in the subgroup with mild-type PKU (n = 2), the nonparametric Kruskal-Wallis test was applied to test for differences between the three genotypic subgroups. The test of Olkin and Siotani (1976) was applied to compare different correlation coefficients (within group comparison).
RESULTS
Clinical data
Table 1 shows the genetic and further clinical data of all 17 subjects included in this study. According to the phenotype categorization (Guldberg et al., 1998), nine patients were classified as having severe PKU, six patients had moderate PKU, and two had mild PKU. In patient 11, one mutation could not be determined despite repeated DGGE analysis; this is generally thought to indicate the presence of a large deletion or mutation in one of the large introns that would be expected to completely abolish enzyme activity. Previous analyzes indeed showed that such “unidentified” alleles resemble severe (null) mutations (unpublished data), and the allele was classified accordingly.
Genetic and clinical data of 17 patients with phenylketonuria
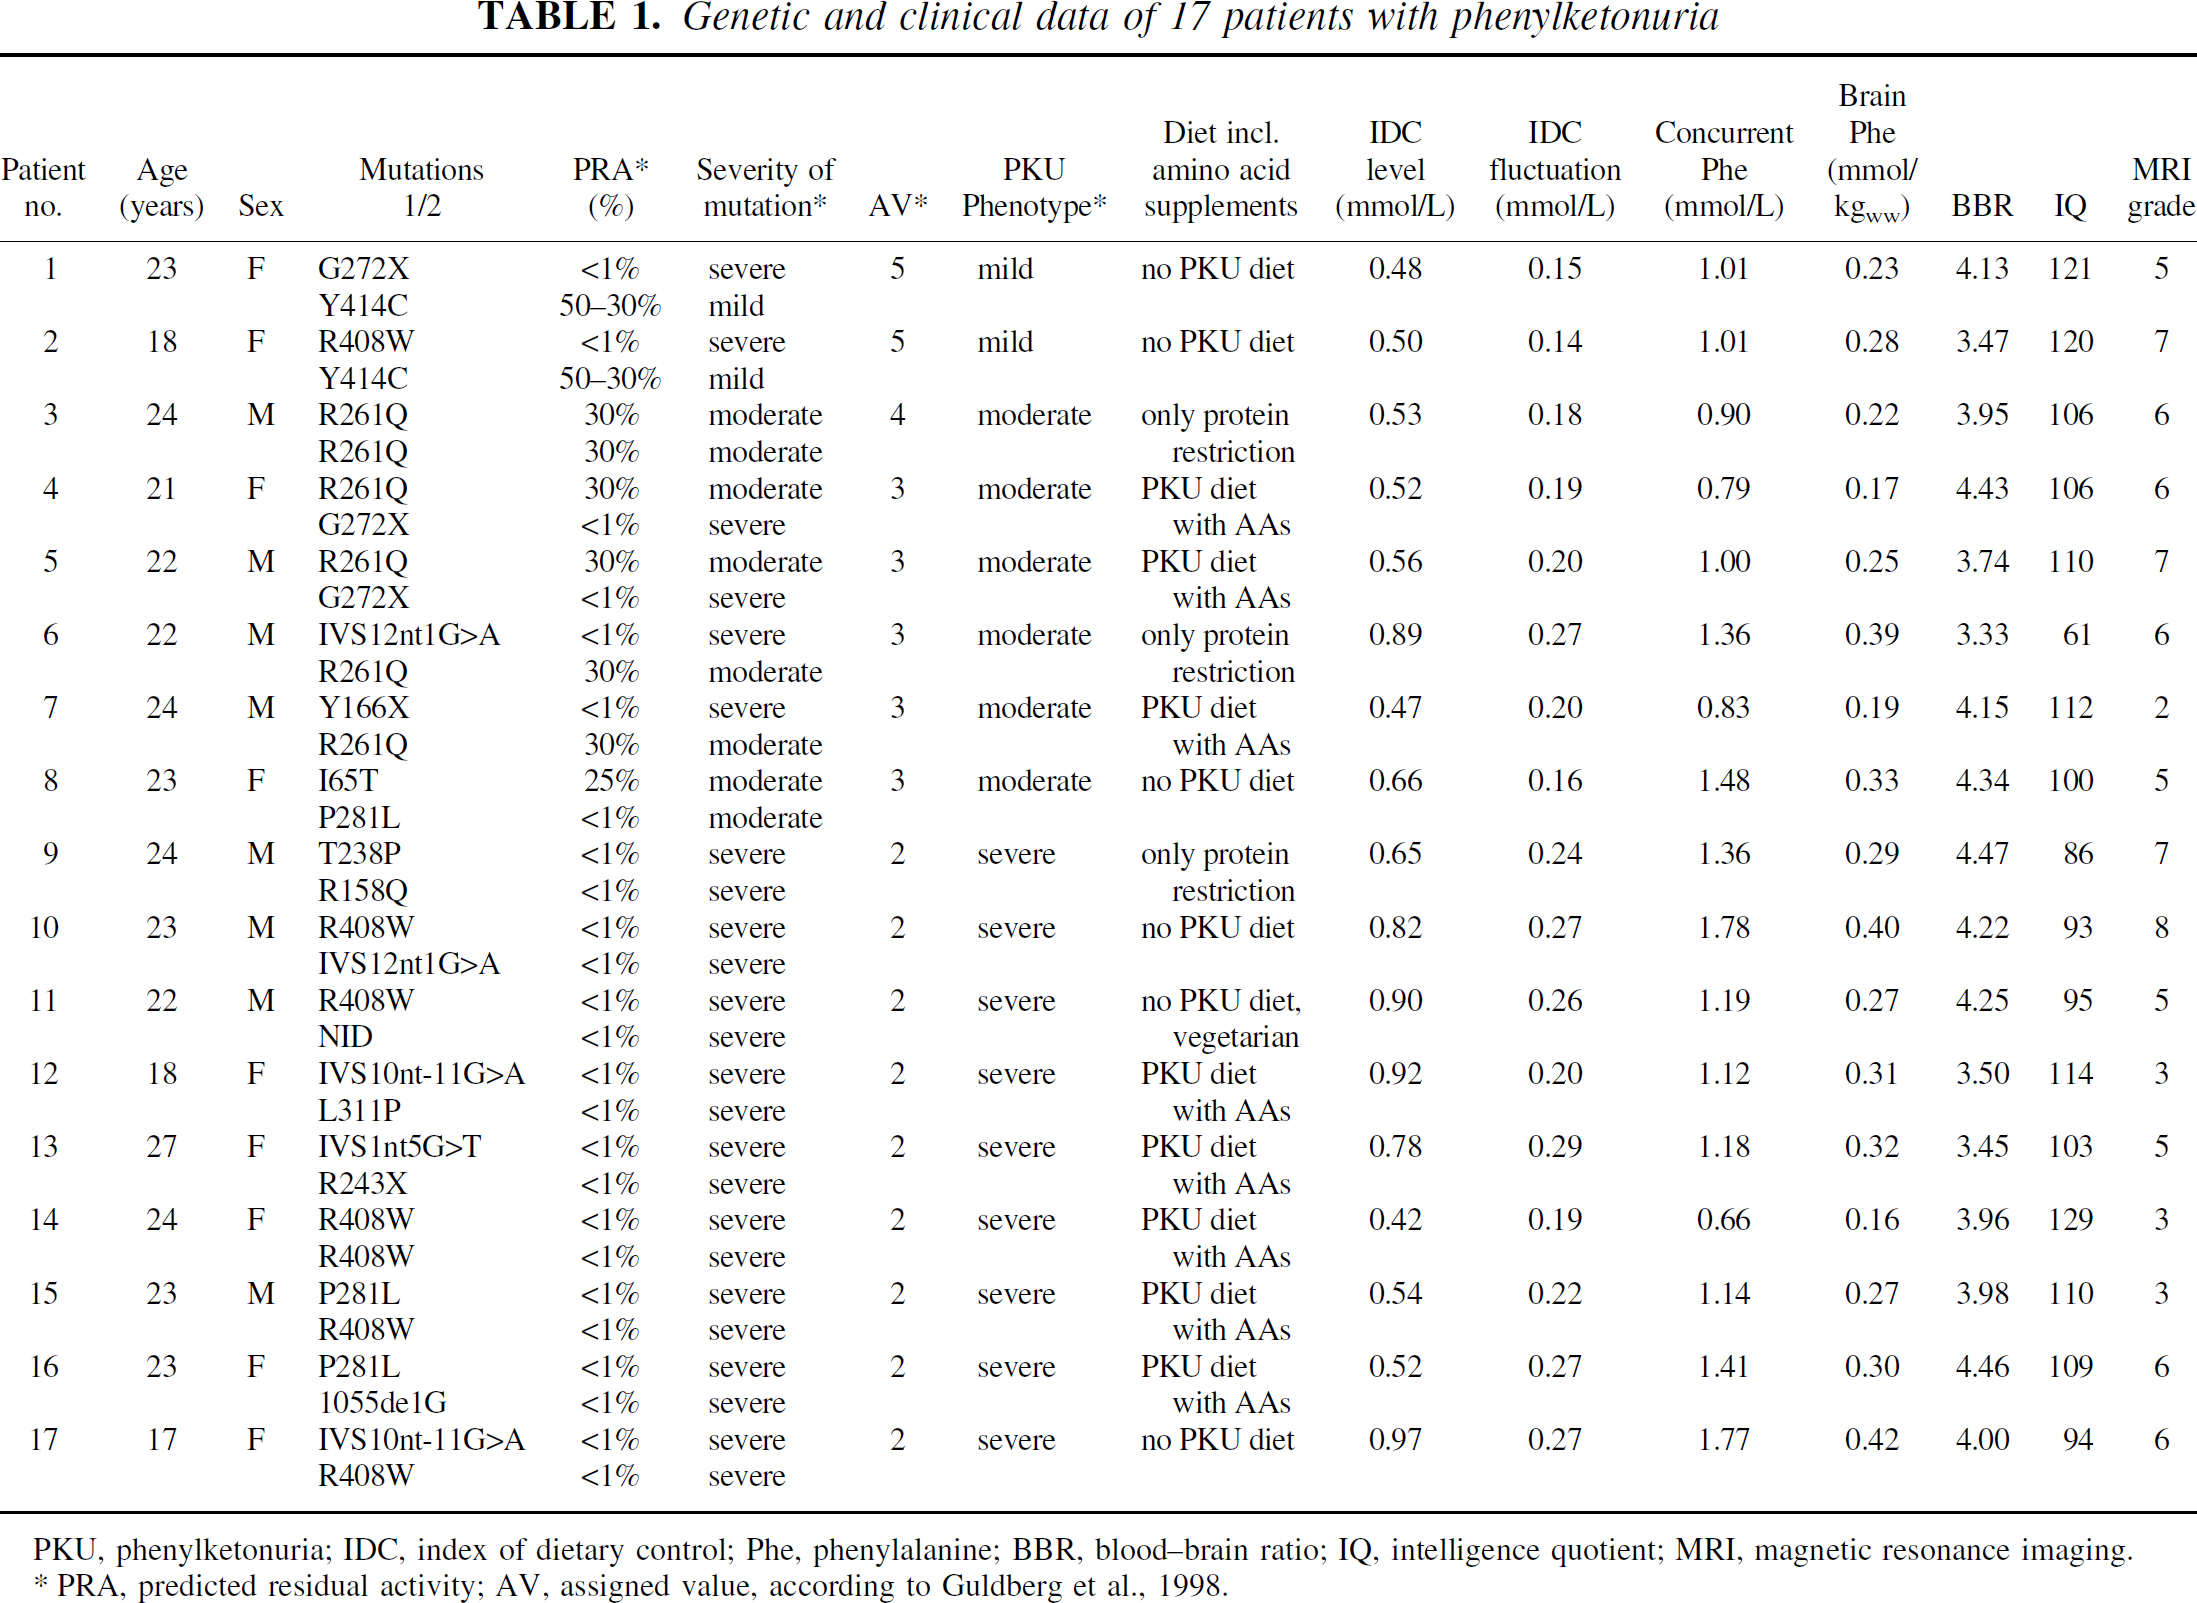
PKU, phenylketonuria; IDC, index of dietary control; Phe, phenylalanine; BBR, blood-brain ratio; IQ, intelligence quotient; MRI, magnetic resonance imaging.
PRA, predicted residual activity; AV, assigned value, according to Guldberg et al., 1998.
In the total sample, concurrent blood Phe values ranged between 0.66 to 1.78 mmol/L (mean 1.17 ± 0.32), which is the typical range for adult patients with PKU (Table 1). Blood concentrations of all other LNAAs were in the normal range (for example, mean valine 274 ± 74 μmol/L, leucine 123 ± 25 μmol/L, tyrosine 48 ± 12 μmol/L, tryptophan 51 ± 15 μmol/L). The concurrent Phe values of the three subgroups with mild-type (mean = 1.01), moderate-type (mean = 1.06 ± 0.29 mmol/L), and severe-type (mean = 1.29 ± 0.35 mmol/L) were comparable (x2(2) = 3.01, not significant [ns]). IDC level did not differ significantly (x2(2) = 3.87, ns) among the three subgroups with mild-type (mean = 0.49 mmol/L), moderate-type (0.61 ± 0.15 mmol/L Phe), and severe-type (0.73 ± 0.20 mmol/L Phe). In contrast, IDC fluctuation was significantly different (x2(2) = 8.15, P < 0.05) among the three subgroups with mild-type (mean = 0.15 mmol/L), moderate-type (0.20 ± 0.04 mmol/L Phe), and severe-type (0.24 ± 0.03 mmol/L Phe).
If the two patients with mild hyperphenylalaninemia (Nos. 1 and 2) that have low blood Phe concentrations were excluded from the analysis, lower blood Phe concentrations were associated with stricter diet irrespective of genotype (x2(2) = 7.04, P < 0.05). Four patients not following the diet had higher blood Phe concentrations (mean = 1.55 ± 0.28 mmol/L) in comparison with three patients who practiced a mild diet with protein restriction only (mean = 1.20 ± 0.27 mmol/L) and eight patients on a strict diet (mean = 1.0 ± 0.26 mmol/L). Blood concentrations of all other LNAAs were not different for the three subgroups on a strict diet, mild diet, or off diet.
Neurologic status was normal except for mild tremor in three patients (Nos. 3, 5, 14). Mean IQ was normal for the total sample (mean 104.1 ± 15.6, range 61 to 129). All 17 standard MRI examinations revealed supra- and infratentorial nonspace-occupying white matter abnormalities, which were most prominent as confluent or bandlike parieto-occipital periventricular areas of increased signal in T2-weighted images. The MRI grade had a mean of 5.3 ± 1.7 and ranged between 2 and 8.
For visualization of the 1H-MRS results, averaged cerebral 1H-MR spectra of normal controls and PKU patients are presented in Fig. 1. Patient spectra were grouped according to the concurrent plasma Phe level, and difference spectra with respect to the averaged spectrum of a control group of 10 subjects were constructed. The peak at 7.37 ppm was clearly increased in both the original and the difference spectra at all plasma Phe levels; furthermore, this Phe peak increased with increasing plasma level. Automated and blinded evaluation of the single spectra provided the quantitative results for brain Phe content. For the normal control subjects, a standard deviation of 0.025 resulted, which reflects the statistical uncertainty of the brain Phe measurement. The mean value for the control data was calibrated to yield 0.050 mmol/kgww as part of the prior knowledge in the MRS quantitation procedure.
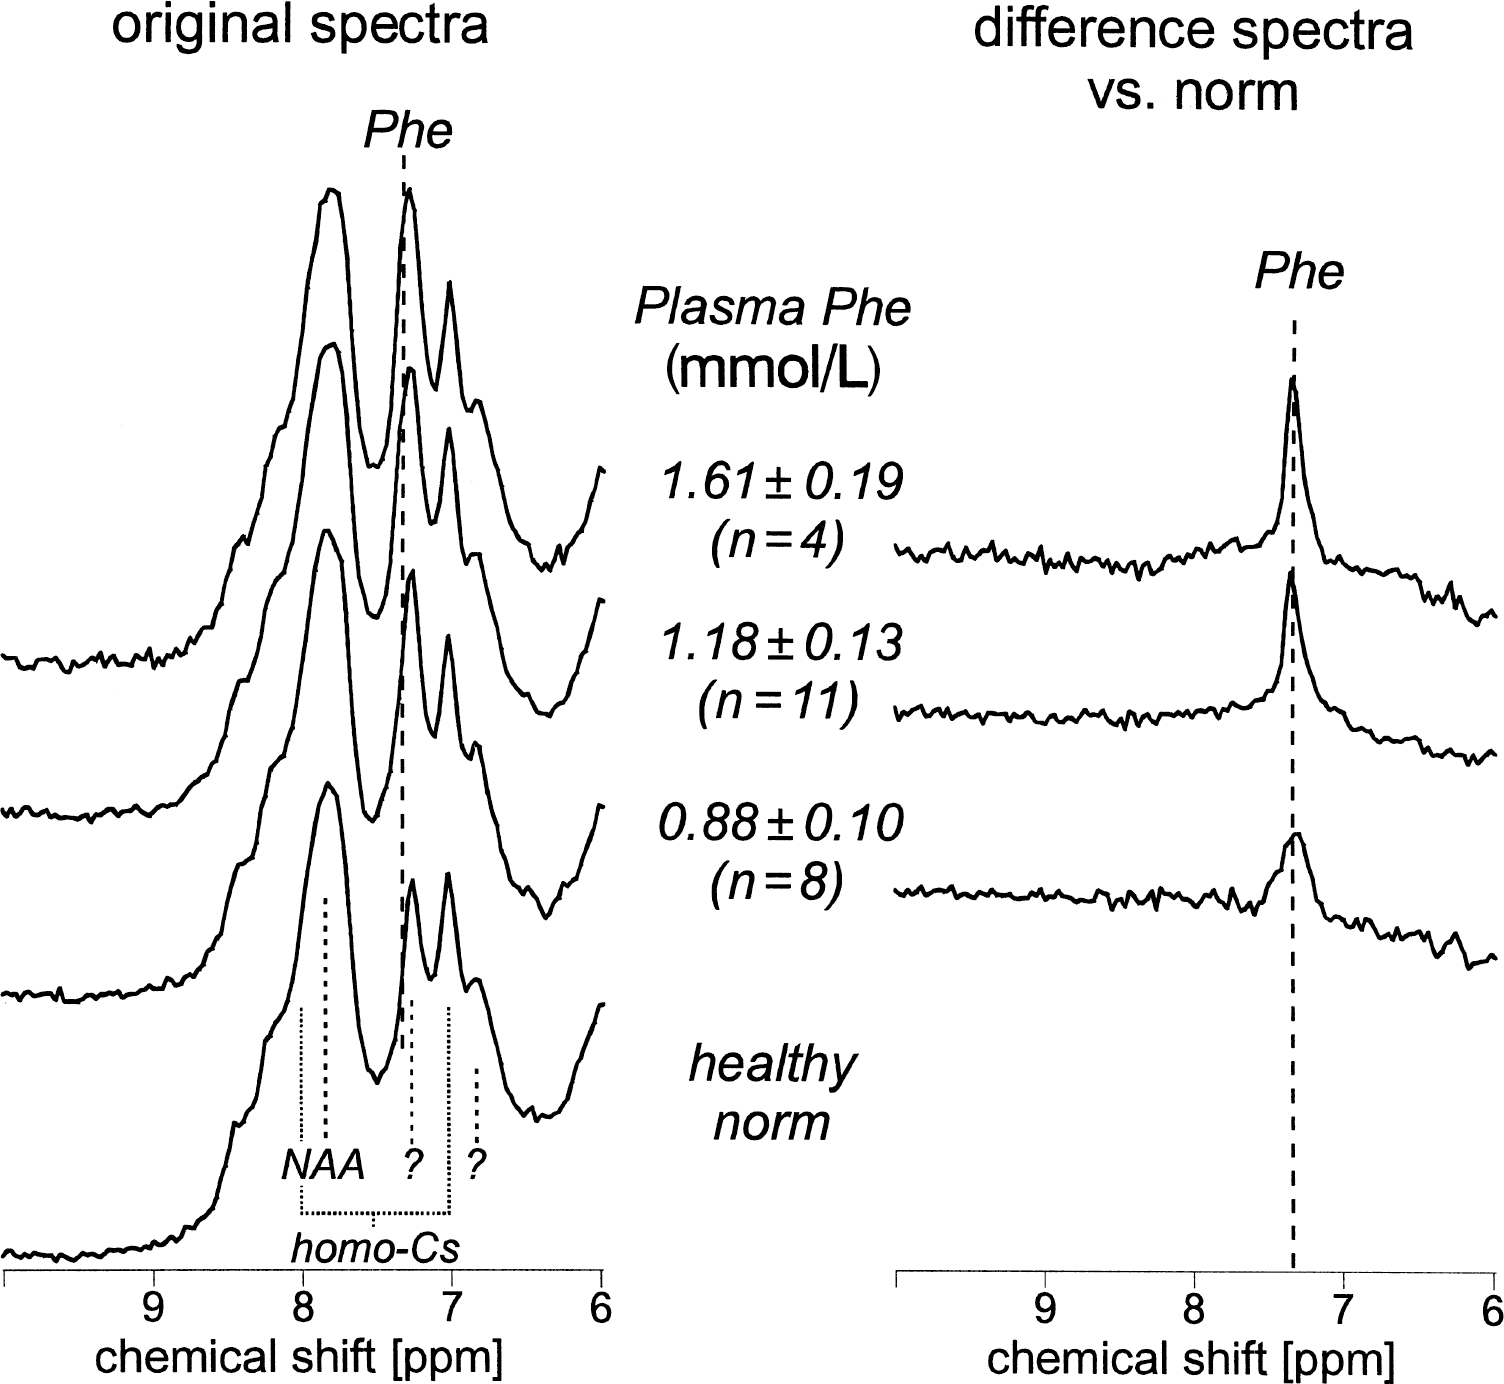
Spectra obtained at steady-state from 17 phenylketonuria (PKU) patients and 10 control subjects presented as averaged spectra grouped according to concurrent blood phenylalanine (Phe) level. Patients were divided into 3 groups: 1) blood Phe < 1.0 mmol; 2) blood Phe between 1.0 and 1.4 mmol; 3) blood Phe > 1.4 mmol with resulting average values ±1 SD of 0.88 ± 0.10 mmol, 1.18 ± 0.13 mmol, and 1.61 ± 0.19 mmol, respectively. (left) Original sum spectra are displayed scaled by the signal from brain tissue water. The Phe signal appears at 7.37 ppm on the shoulder of a relatively large resonance, which has not been unambiguously assigned. (right) Corresponding difference spectra with respect to the normal background signals. Among the other resonances in the normal downfield spectrum, the large resonance at 7.9 ppm has been assigned to the amide proton of N-acetylaspartate (NAA). Homo-carnosine (homo-Cs) has been described to yield two other prominent peaks in the 1H-MR spectrum of the normal brain (Rothman et al., 1997).
The scatter plot of blood versus brain Phe values in PKU patients (Fig. 2) suggests a linear regression model for the prediction of brain from blood Phe concentrations. The regression estimates are given in Table 2. The variance explained by this highly significant linear model was 86%. In addition, a weighted smoothing function loess was applied to study the influence of blood Phe levels on brain Phe, especially for high Phe concentrations. The best fit for loess smoothing was found for alpha = 1.2, which resulted in a generalized crossvalidation of 978.8 (dF = 2.42). The resulting R2 of 86% is equal to that found for the linear model given above. The BBR for the 3 predicted phenotype subgroups (mild, moderate, and severe PKU) were 3.80 ± 0.46, 3.99 ± 0.41, and 4.03 ± 0.37, respectively. Statistical comparison between the groups revealed no significant differences (x2(2) = 0.73, ns). Comparison of the BBR of patients who practiced strict, mild, or no diet also revealed no differences (x2(2) = 1.38, ns).
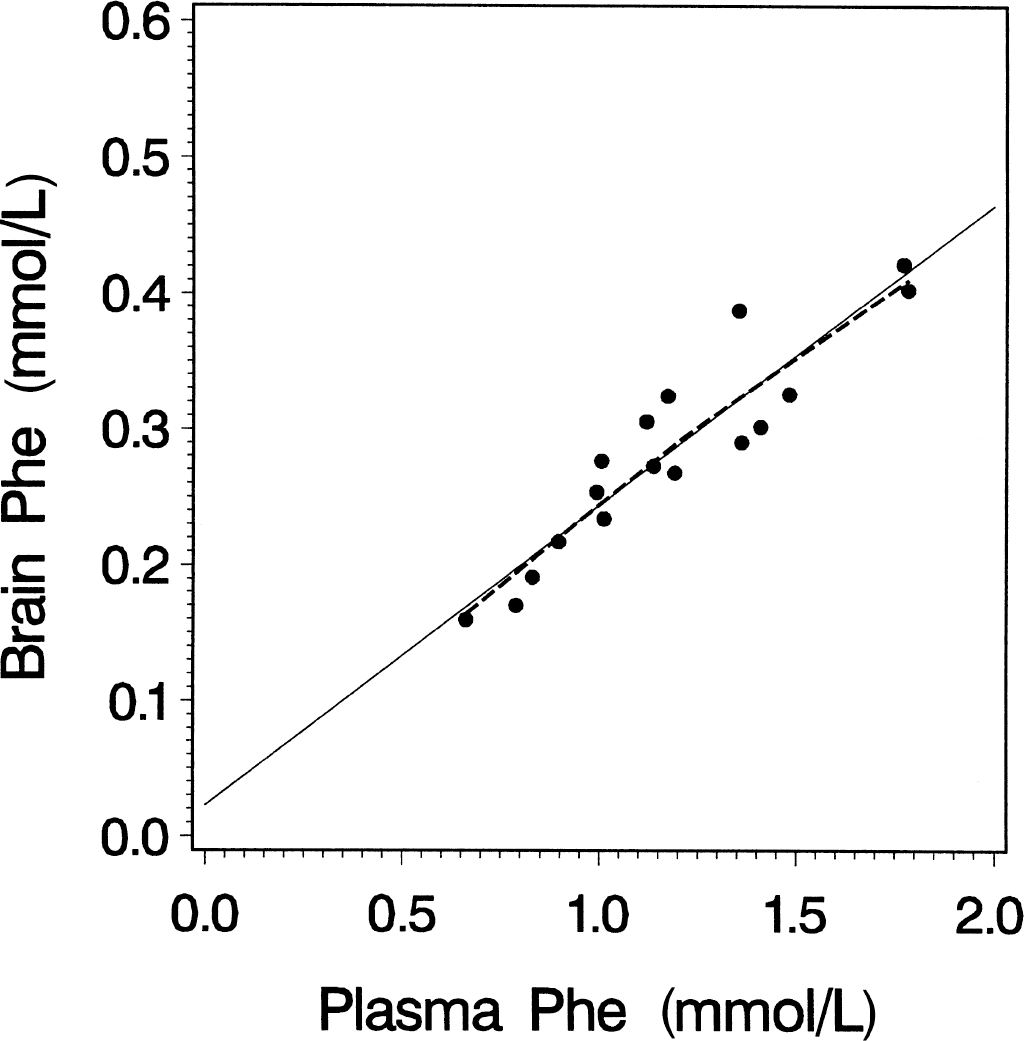
Linear regression (solid line) of blood phenylalanine (Phe) concentration on brain tissue Phe concentration (PheBrain = 22.02 + 0.22 X PheBlood, R2 = 0.86; P < 0.001) and local regression analysis (loess; dotted line) of blood Phe concentration on brain Phe concentration under steady-state conditions. Note that the linear regression model and a modern robust local regression model fit into nearly identical solutions. The explained variance for both models is 86%.
Regression coefficients and standard errors for a linear model applied to the blood and brain Phe data of patients with PKU (n = 17)
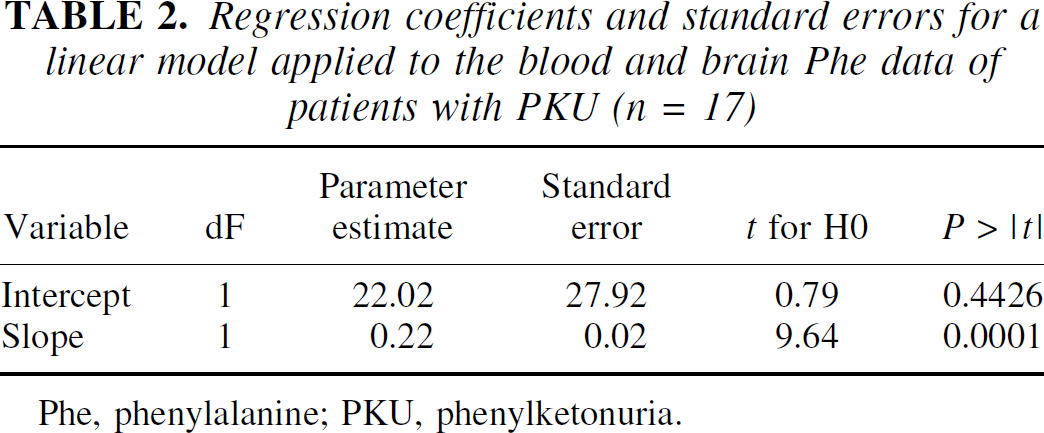
Phe, phenylalanine; PKU, phenylketonuria.
Table 3 shows the matrix of correlation coefficients for predictor and outcome variables obtained from the total sample of 17 patients. Genotype (predicted severity) correlated significantly with long-term blood Phe fluctuations, but not with long-term blood Phe levels. Intelligence quotient was correlated with all three parameters of dietary control and concurrent brain Phe level. Among the correlations between the predictor variables, it is notable that brain Phe levels correlated significantly with all measures of blood Phe. In addition, there was a trend for an association between MRI grade and concurrent blood (r = 0.47, P < 0.1) and brain (r = 0.43, P < 0.1) concentration of Phe (Table 3). The BBR, which was derived from concurrent blood and brain Phe concentrations, showed no significant association with any of the examined variables.
Pearson correlation coefficients of predictor variables, blood-brain ratio of Phe, and outcome variables
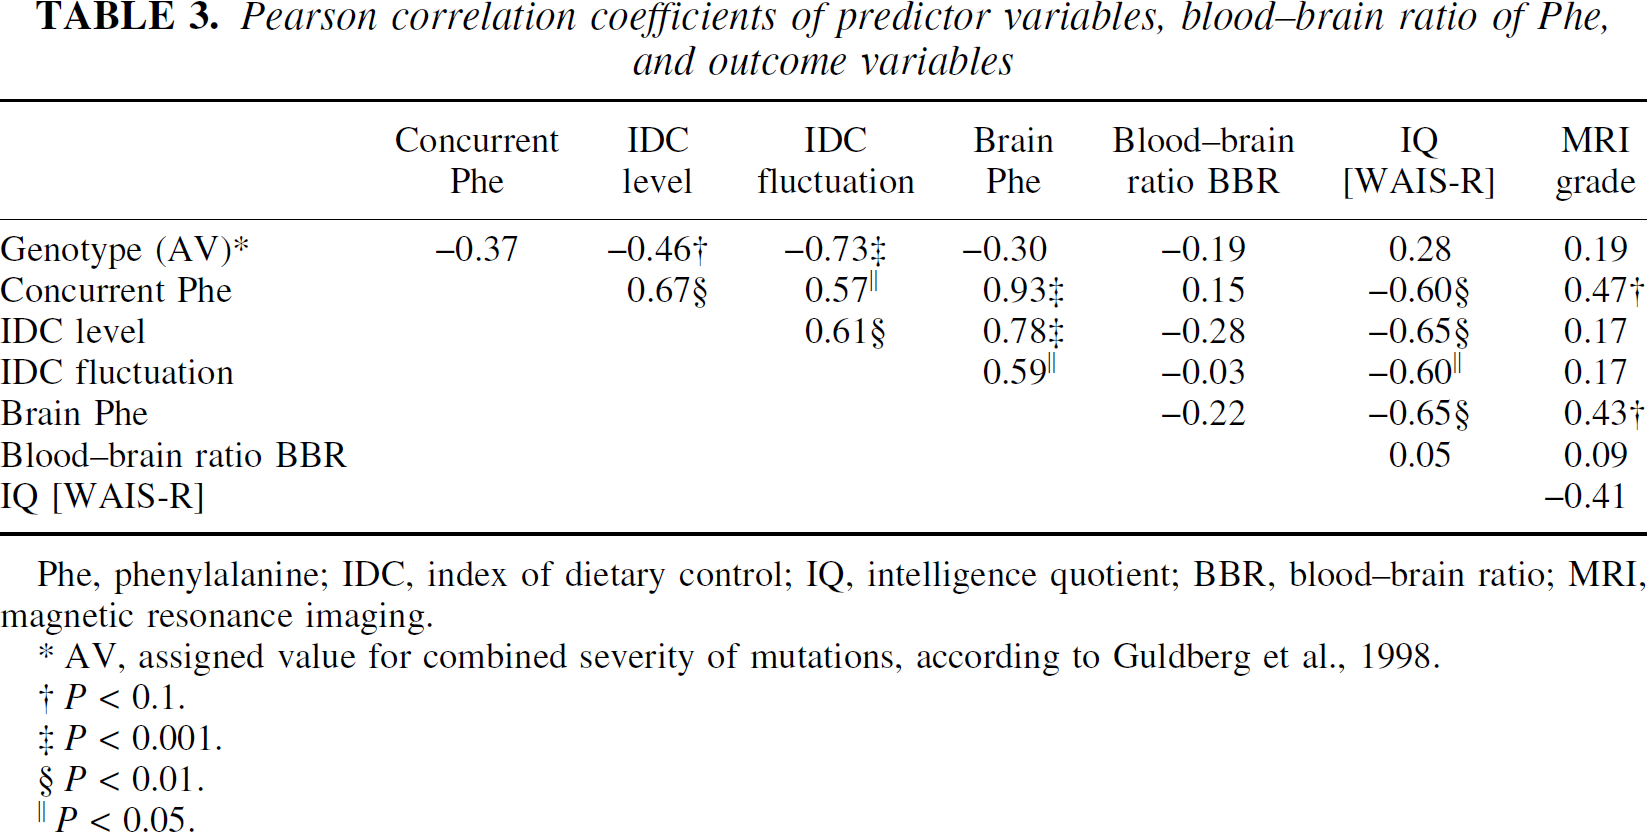
Phe, phenylalanine; IDC, index of dietary control; IQ, intelligence quotient; BBR, blood-brain ratio; MRI, magnetic resonance imaging.
AV, assigned value for combined severity of mutations, according to Guldberg et al., 1998.
P < 0.1.
P < 0.001.
P < 0.01.
P < 0.05.
To examine the influence of the BBR on clinical outcome variables, the individual IDC level, a marker for the total lifelong impact of Phe on the brain, was divided by the individual BBR taken from the current study to form an “IDC level brain.” A re-analysis now taking into account the BBR revealed that the correlation IDC level brain with IQ was unchanged (r = −0.60, P < 0.01).
Individual IDC fluctuations were also divided by the individual BBR values to form an “IDC fluctuation brain.” The re-analysis revealed that the correlation IDC-fluctuation-brain with IQ was also unchanged (r = −0.59, P < 0.01). Thus, there was no evidence for an influence of the individual BBR, taken from the authors' MRS study, on the correlations of IDC level with IQ (within group comparison of correlation coefficients: Z = 0.91, ns) or IDC fluctuations with IQ (Z = 0.10, ns).
DISCUSSION
1H-MRS represents a valuable tool to noninvasively investigate the brain level of Phe concentrations in patients with PKU. In this study, the BBR was determined by computing the ratio of brain Phe concentrations measured by in vivo 1H-MRS and concurrent blood Phe concentrations. A unimodal distribution with an estimated mean value of 4 was observed in steady-state conditions. This result exactly confirms the authors' previous study of eight patients (Pietz et al., 1995).
In a critical review on quantitative Phe 1H-MRS, Kreis (2000) showed that after unifying inherent assumptions, correcting some inconsistencies, and converting to a common set of units, the results of different studies in patients with PKU are in agreement with a blood-brain ratio for Phe close to 4. Thus, the BBR found in the current study is consistent with the results from this meta-analysis.
The measurement error in determining brain Phe content with the currently used methodology can be estimated from the results of the normal control group. It appears to be as low as 0.025 mmol/kgww. This value, which is independent of the plasma Phe content, can be used to derive an experimental error in terms of the BBR, which is greater for small blood Phe values than for large ones. Using the values of brain and blood Phe obtained in the current study and assuming negligible errors in the determination of plasma Phe (which is <5% for the relevant blood Phe levels according to unpublished calibration measurements in the authors' laboratory), the authors estimated an experimental uncertainty in the BBR of 15% to 6% for a blood Phe range of 0.8 to 2 mmol/L. The experimental uncertainty in the BBR (and its temporal stability) can be verified by repeated measurements in the same PKU patients at steady-state conditions. Using the 2 baseline measurements obtained in 6 PKU patients in the study of Pietz et al. (1999), a mean BBR fluctuation of 10% was obtained at an average blood Phe of 1.05 mmol/L.
Alternatively, an upper limit of the experimental error in the determined BBR can be obtained from the coefficient of variance obtained over the whole patient population in the current study. This value was 9% at a mean blood level of 1.2 mmol/L. Both values confirm that the 1H-MRS measurement error is indeed on the order of 0.03 mmol/kgww for brain Phe determinations by 1H-MRS.
The range of blood Phe concentrations (0.66 to 1.78 mmol/L) in the current study is comparable to those in earlier studies (Novotny et al., 1995; Möller et al., 1995; Pietz et al., 1995). The highly significant linear regression of blood Phe on brain Phe depicted in Fig. 2 was based on 17 subjects measured under steady-state conditions who were randomly selected from 75 adults monitored for metabolic diseases by the authors' OPC. This statistical model provided an excellent fit. In addition, the local regression analysis loess (Loader, 1999), which represents a modern robust curve-fitting procedure based on locally weighted regression, closely resembled the linear regression results. This analysis did not provide a better model compared with the global linear regression. Thus, the current data do not support saturation of Phe transport at the BBB up to blood levels of 1.8 mmol/L Phe, as proposed by other studies (Möller et al., 1995, 1997), just as the current data do not support an opposite trend with a positive correlation between blood Phe concentrations and BBR, as suggested by the exponential fit derived from the MRS data of Moats et al. (2000). In vitro and animal studies of LNAA transport at the BBB using different methodologic approaches confirm saturation kinetics for the L-type amino acid carrier (Smith and Stoll, 1998). However, clinical evidence contradicts strict saturation of Phe transport at the BBB. Loading experiments with PKU patients showed that effects of increased Phe levels on brain function occurred especially at high blood Phe levels (Krause et al., 1985; Schmidt et al., 1994).
Possible explanations regarding linearity within the current data need to be discussed. First, saturation could happen only at Phe values at or greater than the range investigated in the current study. Loading studies that induce a fast rise in blood Phe values might better reveal the limited transport capacity of the L-type carrier for Phe and other LNAAs. Second, additional amino acid transport mechanisms have to be taken into consideration. Hargreaves and Pardridge (1988) described a high affinity system in human brain capillaries with a Km of 0.3 for Phe in comparison with the other large neutral amino acids (for example, tyrosine 1.3, tryptophan 3.0, and valine 8.8). It cannot be excluded that there might be some overlap in specificity with other amino acid carrier systems at high concentrations. At high blood concentrations, additional transport of amino acids by diffusion could contribute substantially to net uptake under steady-state conditions. All of the adult PKU patients investigated in the current study had continuously high blood Phe values during the years before this study. Furthermore, up-regulation of the carrier could be triggered by the high concentrations of the substrate. Third, it also has to be considered that the blood-brain ratio of Phe determined in the current study reflects the balance of influx and efflux processes to the extracellular space and transport to other compartments (intracellular neuronal and glial space, CSF). Regional differences in blood-brain barrier transport because of heterogeneities in capillary density, carrier expression, and other factors might also contribute to the blood-brain ratio as determined in the study.
There are also methodologic issues regarding the conflict with previous studies (Möller et al., 1997, 1998; Moats et al, 2000). The analyses in the studies of Möller and coworkers were based on the questionable assumption of symmetric Michaelis-Menten kinetics. Furthermore, the nonlinear regressions reported by Möller et al. (1998) and Moats et al. (2000) was based on pooled data including single and repeated brain Phe measurements of single subjects in one regression analysis, which is in conflict with its assumptions, and may therefore distort the results. Finally, the scatter plot of blood versus brain Phe concentrations provided by Möller et al. (1998, Fig. 5) reveals that the individual brain concentrations of one patient (No. 1) show decreasing brain Phe for increasing blood Phe values, which is contrary to normal observations. These data points contribute substantially to the total of five values in the upper end of the blood Phe value distribution and therefore may play a crucial role in the fit.
Blood concentrations of all other LNAAs determine the influx of Phe through the blood-brain barrier (Pietz et al., 1999). Thus, patients still on a strict diet were instructed to stop intake of commercial amino acid mixtures before MRS. Examinations on the day of MRS proved that concurrent blood concentrations of all other LNAAs were in the normal range.
The authors' analysis of clinical aspects regarding the relation between important predictor variables and outcome confirmed earlier results in all aspects. The long-term quality of biochemical control (IDC level) showed a significant influence on intelligence. In addition, IDC fluctuation, which was solely correlated with the PRA values (genotype), proved to be important for the outcome, thereby confirming the results of Lichter-Konecki et al. (1994) and Burgard et al. (1996a).
Long-term Phe values influence IQ development most prominently during childhood, and IQ is known to stabilize at approximately 12 years of age (Burgard et al., 1996b; Pietz et al., 1998). The significant Pearson correlation coefficient between brain Phe values and IQ most likely reflects the association between concurrent brain and blood Phe values and long-term brain and blood Phe. Consistent with the findings of other authors, the authors found a trend for an association between MRI grade and concurrent Phe values at the time of the MRI examination. Considering that the MRI changes reflect the dietary history of several weeks to months preceding the MRS examination, while the brain, and even more so, the blood Phe levels correspond to a shorter time span of dietary control, one could indeed expect the MRI changes to be a more reliable indicator of general dietary control during the time before the MRS. Because of the short-term variation of blood Phe values, the association between MRI grade and the blood and brain Phe on the day of the MR scan might be lowered. In addition, there might be other factors (for example, interindividual differences of myelin vulnerability) that influence the MRI grade.
Regarding the clinical relevance of BBR determinations, the current results are equivocal. The authors did not find any correlation with other important predictive and outcome variables. In addition, the correlation between predictive and outcome variables in this data set was not increased when the BBR was taken into account. These results do not exclude the possibility that differences in BBR are relevant for a small number of exceptional subjects as shown by Möller et al. (1998) and Moats et al. (2000). However, the subjects in the current study that were randomly selected from a representative group of adult German PKU patients did not include one “exceptional” patient with surprisingly low brain Phe.
Furthermore, it is uncertain whether the ratio measured in adulthood is relevant for the circumstances in childhood. Alterations of BBR with maturation (Smith and Stoll, 1998) remain a potential explanation for different clinical outcome with similar blood Phe history. This was shown in an animal study (Antonas and Coulson, 1976) as well as by measurements of Phe in cord blood and brain tissue of aborted human PKU fetuses (Fowler et al., 1988). In addition, the L-type amino acid carrier is known to be modulated by amino acid availability, hormones, and second messengers (Smith and Stoll, 1998). However, although there may be individual differences that lead to different BBB kinetics, such differences did not appear to influence clinical outcome in the patients of the current study.
Conclusion
Based on the assumption that the blood-brain ratio of Phe shows an intraindividual stability, the current data do not support the hypothesis that interindividual differences of blood-brain barrier transport of Phe may be a key explanatory factor for outcome variability for the vast majority of “typical” patients with PKU. Strictness of biochemical control as represented by blood Phe concentrations remains the main factor affecting outcome, at least in the great majority of patients.