
Abstract
In vivo nuclear magnetic resonance spectroscopy can be used to measure intracerebral phenylalanine (Phe) concentrations in patients with phenylketonuria (PKU). Stationary levels, obtained under free nutrition, as well as time courses after an oral Phe load (100 mg/kg) were investigated in 11 PKU patients and were correlated with the individual clinical outcome. At blood levels around 1.2 mmol/L, brain Phe was 0.41 to 0.73 mmol/L in clinically “typical” patients, but less than 0.15 mmol/L in three untreated, normally intelligent, adult women. Kinetic investigations revealed higher transport Michaelis constants and lower ratios of the brain influx and consumption rates in these women than in the “typical” control patients (Kt,app = 0.45 to 1.10 mmol/L versus 0.10 mmol/L; Tmax/νmet = 2.55 to 3.19 versus 7.8 to 14.0). Such variations seem to be major causative factors for the individual vulnerability to PKU.
Keywords
Phenylketonuria (PKU), caused by a deficiency of the liver enzyme phenylalanine hydroxylase, which converts phenylalanine (Phe) to tyrosine (Tyr), is the most frequent inborn error of amino acid metabolism with an incidence of 1:8,000 in whites. In untreated classic PKU, this block in the hepatic catabolism of Phe leads to elevated serum levels greater than 1.2 mmol/L (normal value: less than 0.1 mmol/L) with catastrophic consequences for the developing brain, usually resulting in severe mental and psychomotoric retardation. If patients are subjected to a diet strictly reduced in Phe soon after birth their neurologic and intellectual development is, however, close to normal. Although introduced more than three decades ago, duration and strictness of the diet are still under discussion. Until recently, the policy was to relax the diet after 10 years of age, but current recommendations suggest maintaining the strict diet as long as possible (Medical Research Council Working Party on Phenylketonuria, 1993).
An individual vulnerability of patients to elevated blood Phe is well known. Several studies demonstrated different degrees of intellectual and neuropsychological deficits, cerebral white matter changes, and EEG abnormalities in patients with PKU who had similar metabolic control (Bick et al., 1993; Pietz et al., 1993; Ris et al., 1994). Single case reports described untreated patients with classic PKU and normal intelligence (Primrose, 1983). The pathogenesis of different clinical outcome in spite of comparable blood Phe levels, [Phe]blood, is still unclear. One possible explanation could be interindividual variations in brain concentrations of Phe, which crosses the blood—brain barrier (BBB) slowly, mediated by a saturable transport system.
Since the introduction of newborn screening programs in the mid 1960s, an enlarging number of patients has assembled for whom there is a need to optimize therapy. Dietary compliance is monitored measuring [Phe]blood by amino acid analysis. Up to now, it had been impossible to give individual diet recommendations. However, this would be most desirable because the burdensome diet is associated with an elevated risk of psychosocial maladjustment. Using an animal model of hyperphenylalaninemia, Avison et al. (1990) were able to show that Phe is detectable by 1H nuclear magnetic resonance (NMR) spectroscopy in the brain in vivo, providing intracerebral Phe concentrations, [Phe]brain, which closely correlated with postmortem data. In the meantime, several human studies demonstrated that this technique offers a new approach for quantifying [Phe]brain noninvasively in PKU patients (Kreis et al., 1995; Möller et al., 1995, 1997; Novotny et al., 1995; Pietz et al., 1995, Ullrich et al., 1994).
During the course of a maternal PKU study, we found three untreated women with classic PKU but normal or nearly normal intelligence. Such highly uncommon cases, which seem to be “protected” without adhering to any diet, are ideally suited for an investigation of the relation between brain Phe and individual vulnerability in PKU. We therefore performed a series of stationary and dynamic NMR experiments to examine the blood—brain correlation of Phe concentrations and Phe transport kinetics at the BBB. For comparison, data from two groups of “typical” PKU patients were additionally included in our study.
METHODS
Patient characteristics
Eleven patients were investigated. Genotypes as well as extensive blood Phe testing during the years before the examination indicated that all patients had classic PKU. None of them had any history of other factors disturbing brain development. Clinical data for all individuals are summarized in Table 1. Intelligence quotient (IQ) was tested by the German version of the Wechsler Intelligence Scale (Tewes, 1983; Wechsler, 1991). Patients of group 1 had never received any dietary treatment and were still untreated at the time of the study. However, they were almost unaffected clinically and reached normal or nearly normal intelligence scores. Patients of group 2a were untreated in early infancy and were retarded. All subjects of these groups were either born before a screening program had been launched (patients 1–4) or came from a country without systematic newborn screening. Group 2b consisted of early treated adults who had stopped the diet 7 to 20 years ago. Only patient 11 reached a good dietary control during the first 10 years of life. Intelligence quotients were within or close to the normal range in this group. Changes with T2-weighted magnetic resonance imaging (MRI) were mildest in the untreated, “atypical” group 1. Patients of groups 2a and 2b had abnormalities of cerebral white matter to a variable extent depending on their current diet status. In all individuals, brain NMR spectroscopy yielded normal signal intensities of all routinely observed metabolites, including N-acetyl-
Clinical data of patients with phenylketonuria and stationary phenylalanine levels
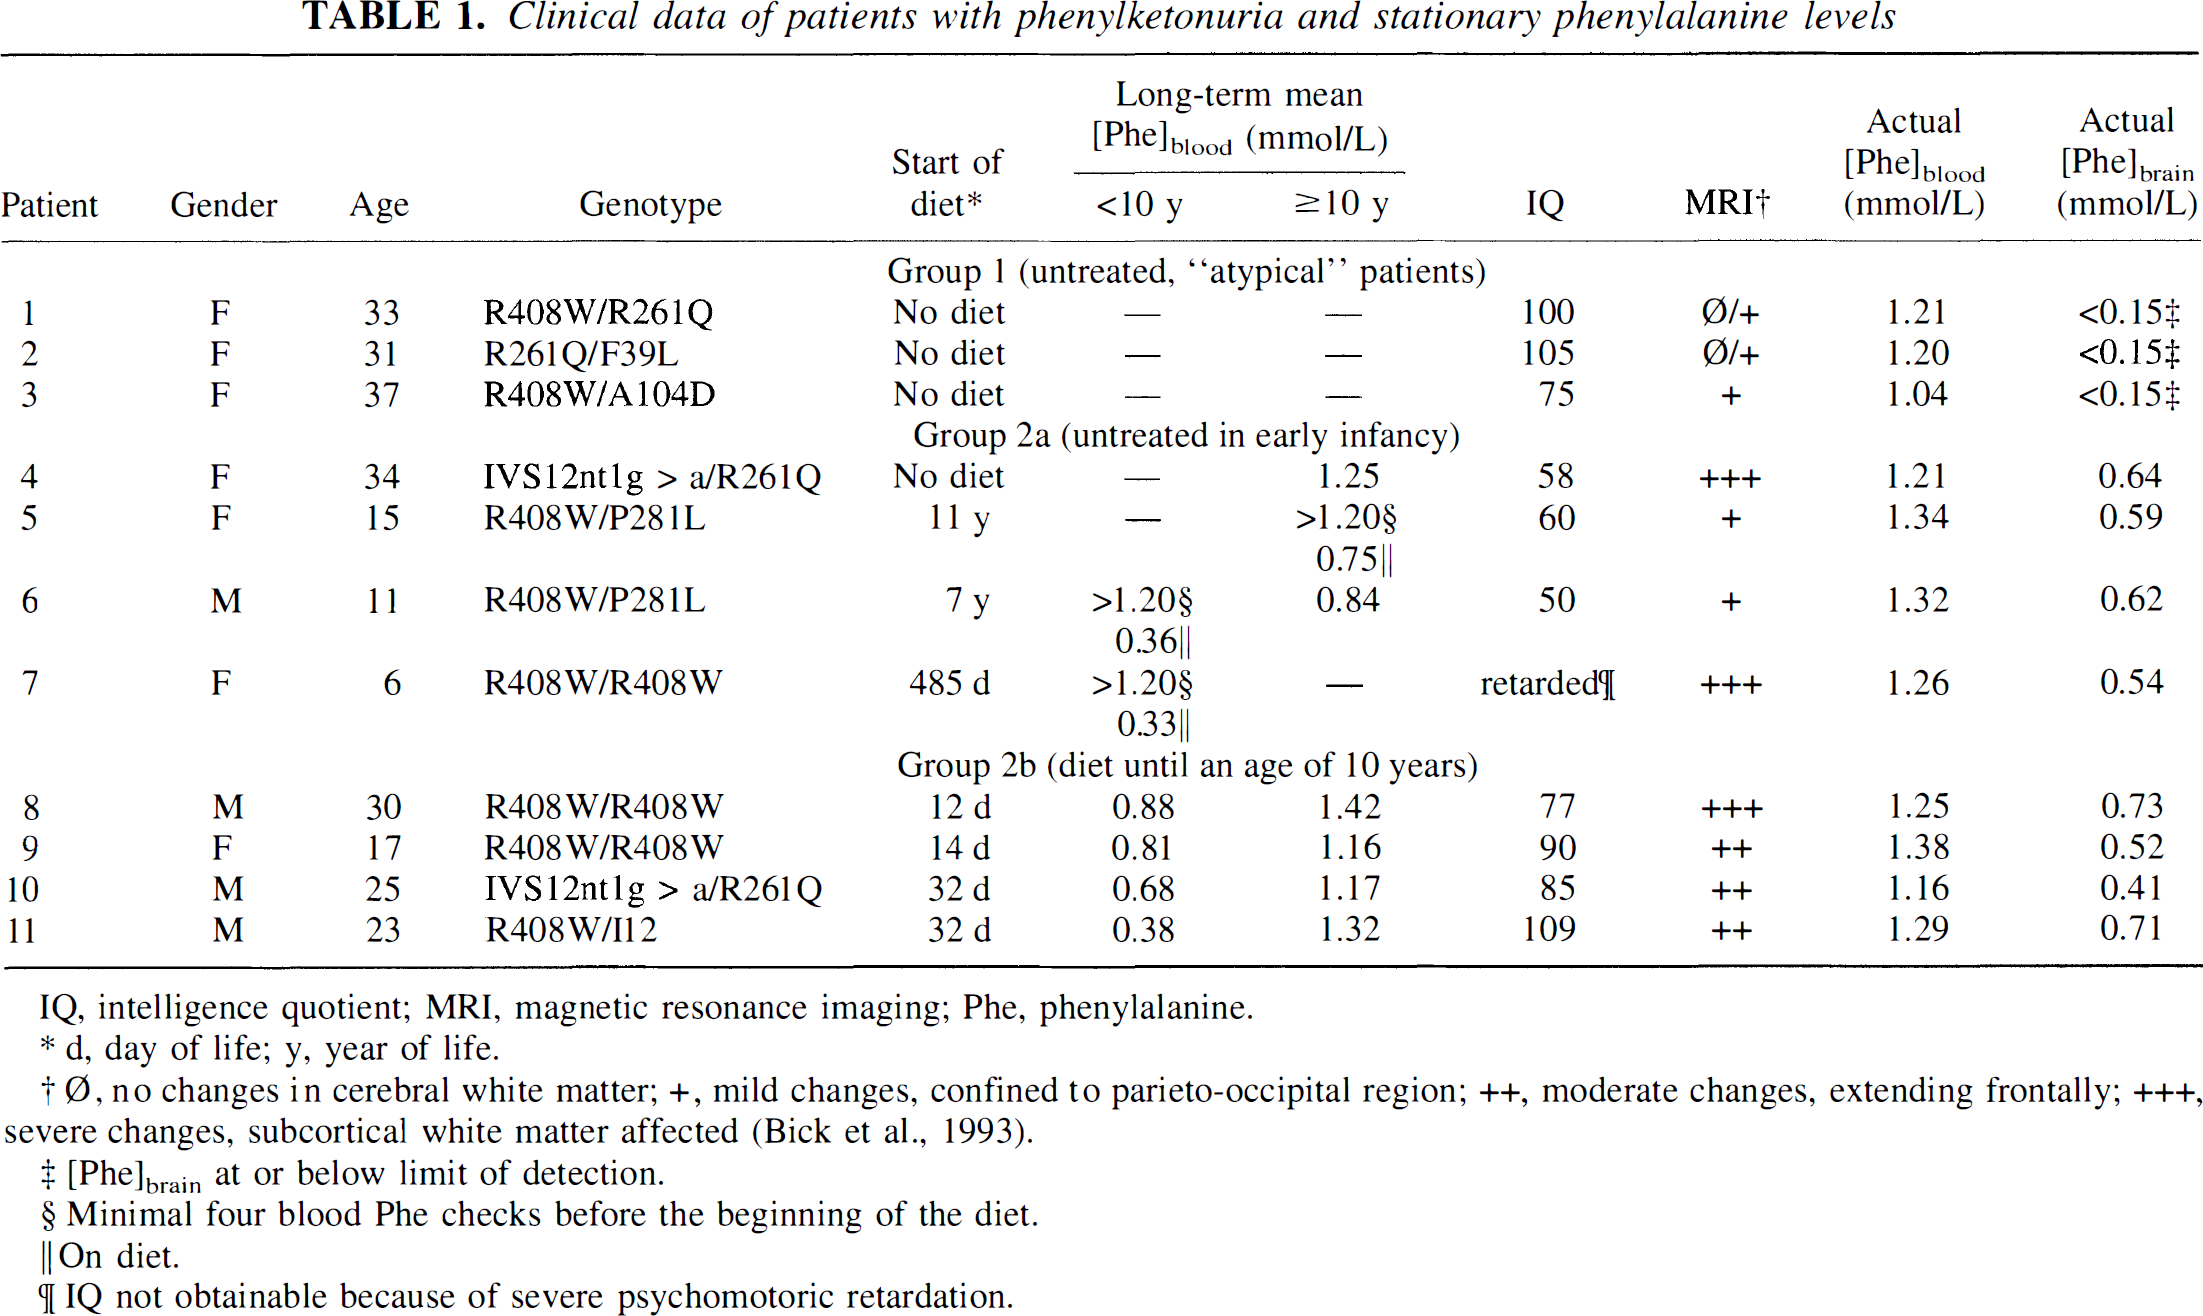
IQ, intelligence quotient; MRI, magnetic resonance imaging; Phe, phenylalanine.
d, day of life; y, year of life.
Ø, no changes in cerebral white matter; +, mild changes, confined to parieto-occipital region; ++, moderate changes, extending frontally; +++, severe changes, subcortical white matter affected (Bick et al., 1993).
[Phe]brain at or below limit of detection.
Minimal four blood Phe checks before the beginning of the diet.
On diet.
IQ not obtainable because of severe psychomotoric retardation.
Nuclear magnetic resonance spectroscopy
A 1.5 T whole-body NMR imager (MAGNETOM 63 SP, Siemens, Erlangen, Germany) and a standard head coil were used to record localized proton spectra applying the stimulated echo technique (Frahm et al., 1990). All spectra were recorded under identical conditions (echo time 20 ms, repetition time 1.6 seconds, 512 acquisitions) and from similar volumes-of-interest (36 cm3) in parieto-occipital periventricular brain with predominantly white matter. Intracerebral Phe concentrations were determined from difference spectroscopy using spectra from healthy volunteers as a baseline reference as described in detail elsewhere (Möller et al., 1995, 1997). For quantification, the signal from total creatine at 3.01 ppm was used as an internal reference, and a correction for the normal [Phe]brain in healthy volunteers, which was assumed to be 0.05 mmol/L from previous biopsy data (McKean, 1972), was applied. Parallel to NMR spectroscopy, complete blood amino acid profiles, including [Phe]blood, were measured quantitatively by HPLC.
In addition to the measurements of stationary [Phe]brain, time courses of [Phe]blood and [Phe]brain were determined after an oral loading test with
Kinetic analysis of time courses
Numerous experimental studies have revealed that the large neutral amino acids are transported across the BBB by means of a common saturable carrier. Because of the competition between amino acids, an apparent Michaelis transport constant, Kt,app, is measured under in vivo conditions, which is determined by:
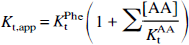
where Kt,app is the plasma Phe concentration for half-maximal transport measured in the presence of other competing amino acids sharing the same carrier, KPhet is the absolute Michaelis transport constant for Phe in the absence of competing amino acids, [AA] is the concentration of each competing amino acid, and KtAA is the absolute Michaelis constant of each amino acid (Pardridge, 1983). Recently, we showed that the relationship between [Phe]blood and [Phe]brain can be analyzed quantitatively using a symmetric Michaelis-Menten model and a constant Phe consumption velocity, νmet, in the brain cells (Möller et al., 1997):
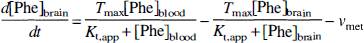
where Tmax is the maximal transport velocity. Phenylalanine transport into and out of the brain is assumed to be characterized by identical kinetic parameters, Kt,app and Tmax. Equation 2 may be regarded as the simplest quantitative description of the consequences of amino acid brain uptake and metabolism. Agreement with experimental results was already obtained under steady-state conditions (Möller et al., 1997). The mathematical treatment is equivalent to the standard model of glucose transport kinetics at the BBB (Lund-Andersen, 1979), which was proven to be useful for the analysis of in vivo NMR data on brain glucose influx and consumption (Gruetter et al., 1993, 1996; Mason et al., 1993). A symmetric Michaelis-Menten model has also been used previously in computer simulations of amino acid uptake and metabolic pathways in the brain (Hommes and Lee, 1990a, 1990b).
Fitting of the time course predicted by equation 2 to the experimental data to obtain kinetic parameters was performed by minimizing the sum of squared residuals, χ2, over a grid search (Bevington, 1969) with Kt,app = 0.05 to 5.0 mmol/L, Tmax = 0.02 to 2.0 mmol·L−1·min−1, and νmet = 0.002 to 0.2 mmol·L−1·min−1. Estimates of standard deviations were based on the range over which the parameters could be varied without significantly increasing χ2. Brain Phe concentrations were determined with an accuracy of approximately ±0.15 mmol/L, which was taken into consideration for the error estimation of the kinetic parameters.
RESULTS AND DISCUSSION
Stationary brain Phe concentrations
In the first part of the study, [Phe]brain was investigated in all patients while having comparable stationary [Phe]blood around 1.2 mmol/L (mean values ± SD, 1.15 ± 0.10 mmol/L in group 1, 1.28 ± 0.06 mmol/L in group 2a, and 1.27 ± 0.09 mmol/L in group 2b). Representative spectra are shown in Fig. 1. Quantitative results are included in Table 1. As expected, no differences in mean [Phe]brain were observed between groups 2a (0.60 ± 0.04 mmol/L) and 2b (0.59 ± 0.15 mmol/L) with typical outcomes depending on the individual diet status. Concentration ratios [Phe]blood/[Phe]brain varied between 1.9 and 2.3 for group 2a and between 1.7 and 2.8 for group 2b, in excellent agreement with results from previous studies (Kreis et al., 1995; Möller et al., 1995; Novotny et al., 1995; Pietz et al., 1995; Ullrich et al., 1994). In contrast, brain Phe was hardly detectable in any of the “atypical” patients. Therefore, [Phe]brain must have been less than the estimated detection limit of our method of approximately 0.15 mmol/L, which is less than 25% of the mean values observed in the other two groups (P < 0.001). This excellent correlation with the clinical parameters underlines the paramount importance of stationary [Phe]brain as one key explanatory factor for the outcome in classic PKU.
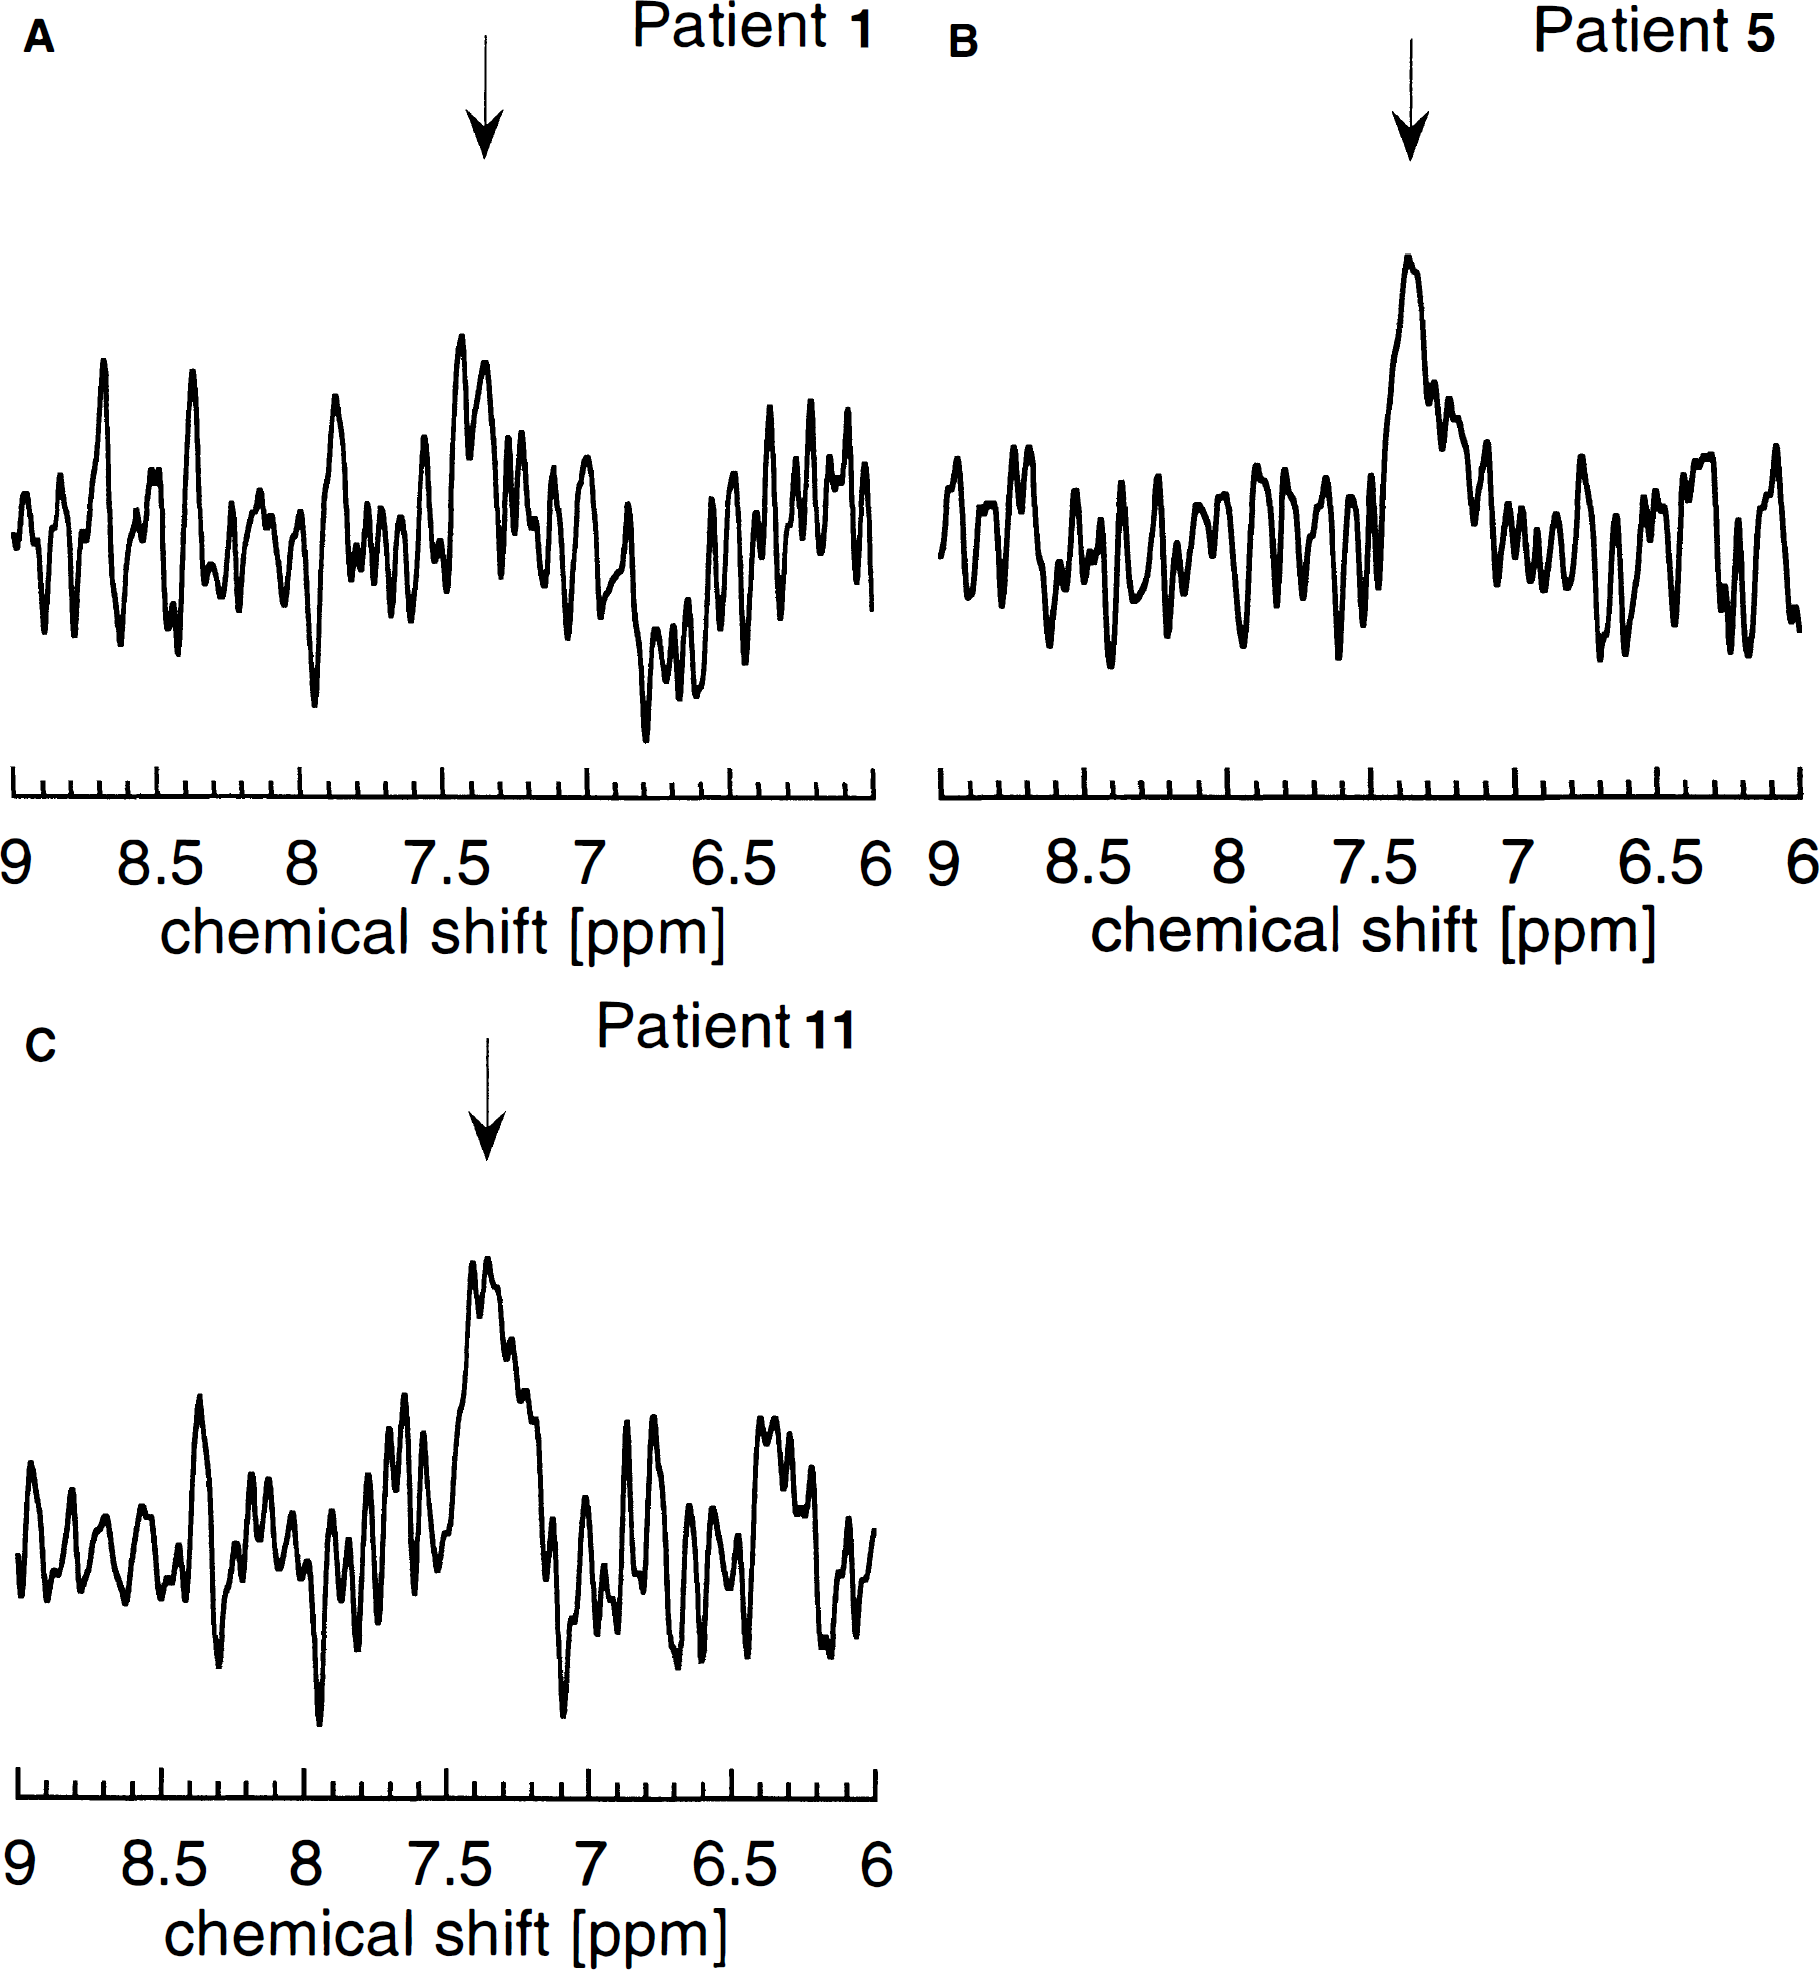
Representative difference spectra obtained at stationary blood Phe levels around 1.2 mmol/L in
Phenylalanine can interfere with the development and function of the CNS by different mechanisms. However, no single process by itself seems sufficient to explain the brain phenotype in PKU (Scriver et al., 1995). High Phe levels in the brain lead to dysmyelination and may also result in decreased neurotransmitter receptor density and cell connectivity (Hommes, 1994). Besides such morphologic changes, elevated Phe may cause an imbalance in neurotransmitter metabolism. Phenylalanine inhibits the uptake of the precursor amino acids Tyr and tryptophan into the brain with a resultant loss of dopamine and serotonin and possibly their neuronal release (Paans et al., 1996).
Time courses of brain Phe after oral loading
The CNS supply of Phe is a function of the plasma concentration and BBB transport processes. Because all patients presented with almost identical blood levels, we may conclude that the depression in [Phe]brain seen in group 1 is related to transport characteristics. To test this hypothesis, we derived brain Phe transport kinetics from the time courses of [Phe]blood and [Phe]brain measured after the oral loading tests.
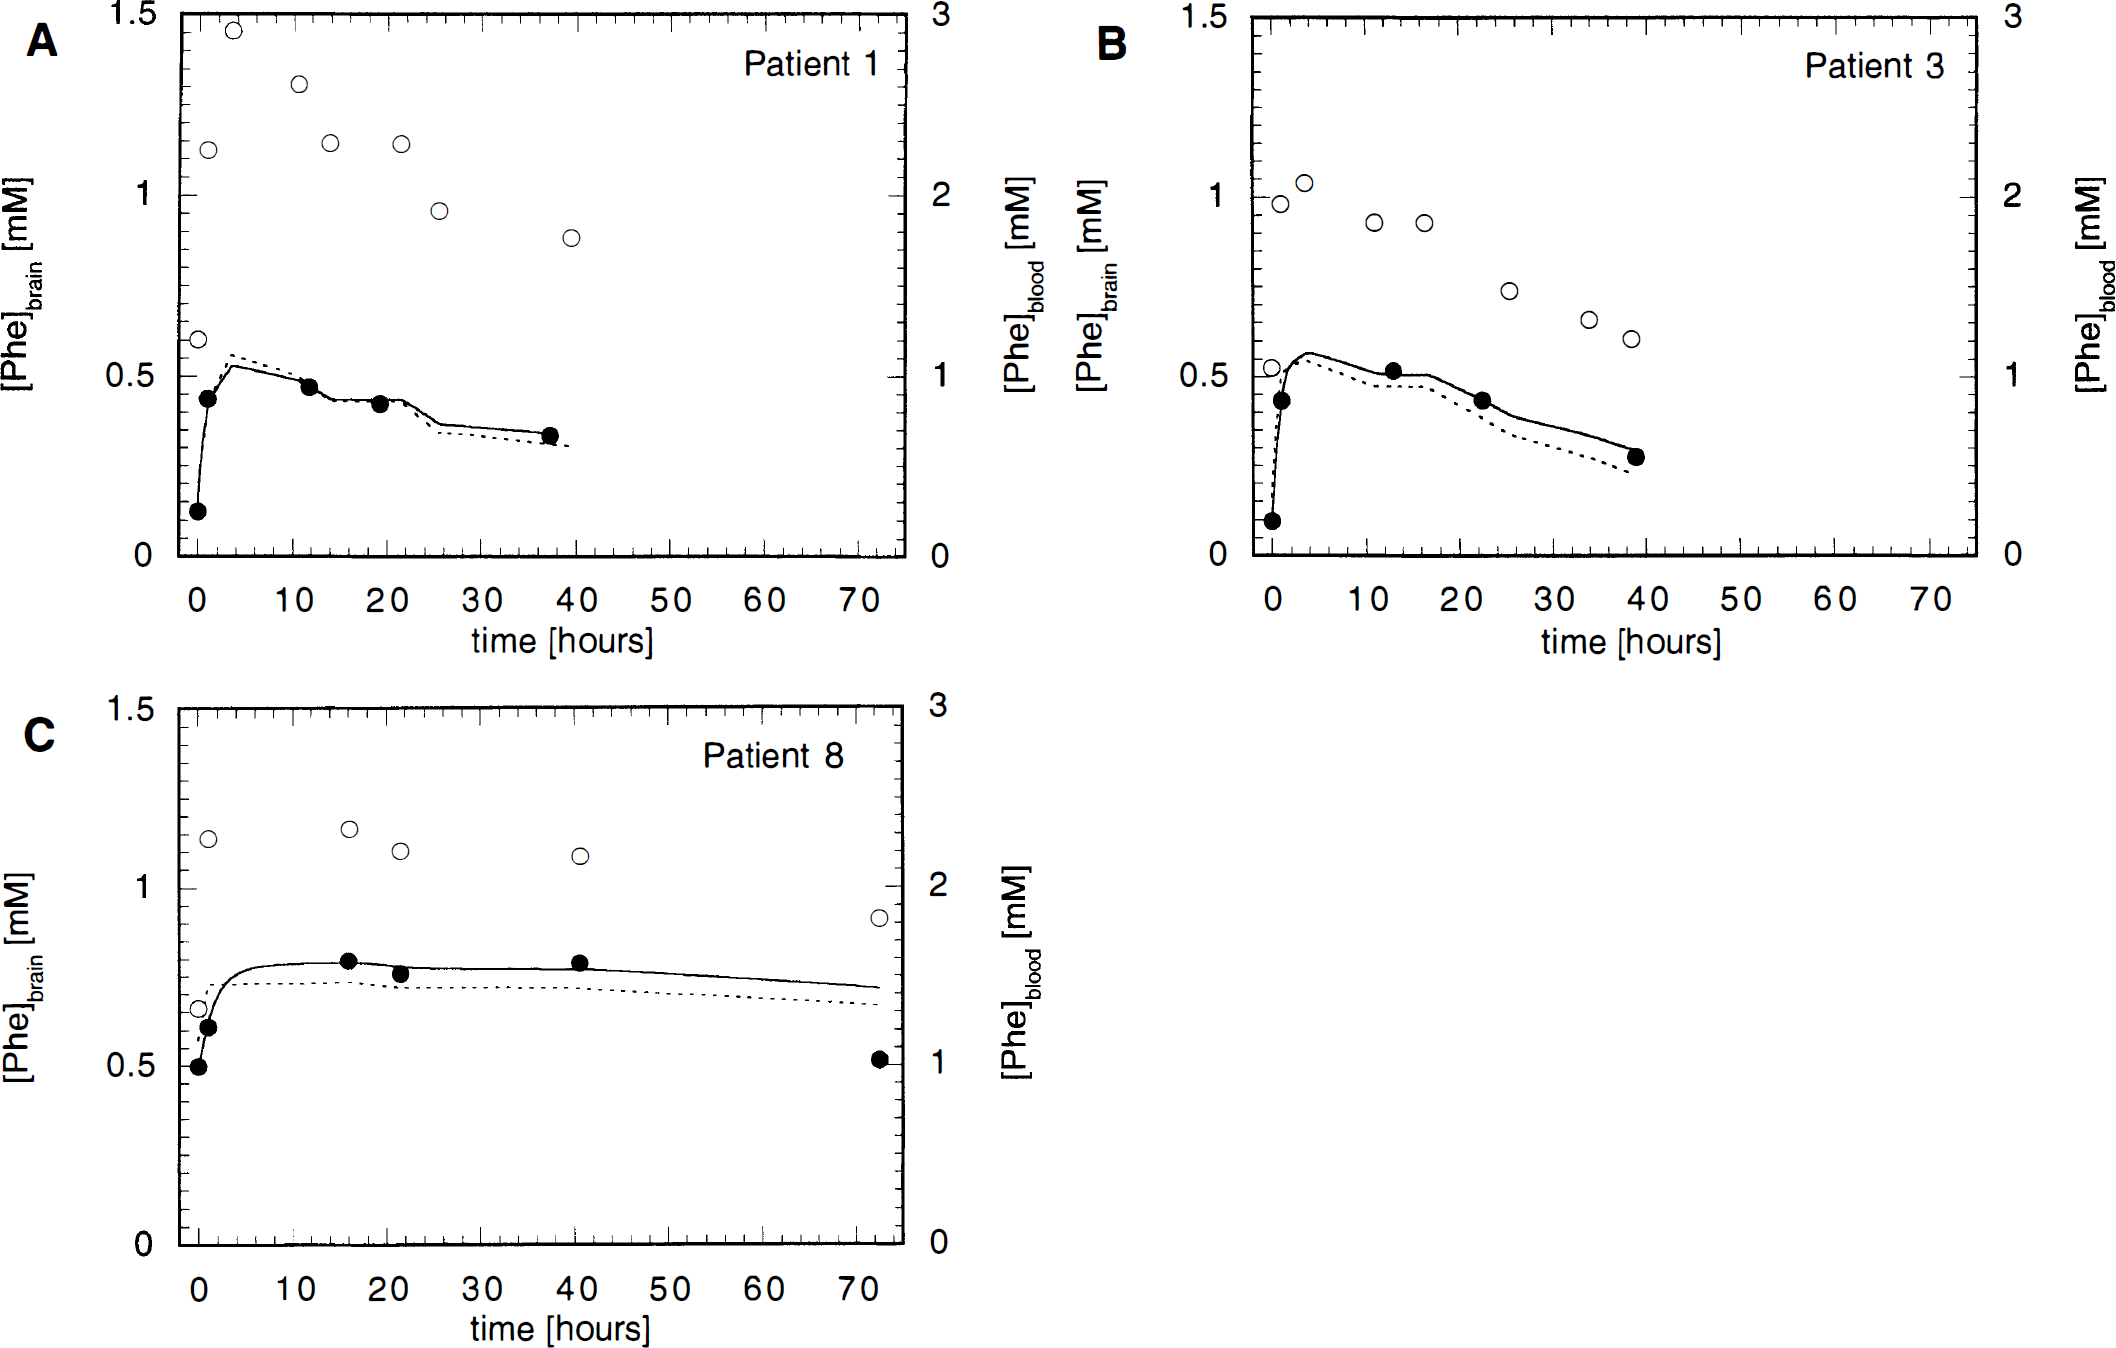
A general finding on fitting the experimental time courses to equation 2 was that Tmax and νmet could be varied over a wide range without significantly affecting the accuracy of the fit as long as the ratio of both velocities remained unchanged. This observation indicates an insufficient time resolution during the initial rise in Phe concentrations after the oral load, which results from prolonged signal averaging required to obtain reliable brain data of the low-concentration metabolite Phe. Consequently, most measurements were performed under conditions approaching a steady-state. In this situation, [Phe]brain would only depend on Kt,app and the ratio Tmax/νmet (Möller et al., 1997):
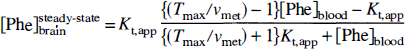
Our data analysis therefore included additional least-squares fits to the steady-state solution, equation 3. Results are summarized in Fig. 2 and Table 2. A comparison of the predicted time courses during the initial postload period indicated a delayed response of brain Phe after the rapid change in [Phe]blood, which confirms previous observations (Pietz et al., 1995). Although only the more general equation 2 is appropriate to analyze this non—steady-state situation after the load, similar numerical results were found with both methods.
Dynamic changes of [Phe]blood and [Phe]brain on oral Phe loading. Exemplary results from patients 1
Results of the numerical analyses of the time courses
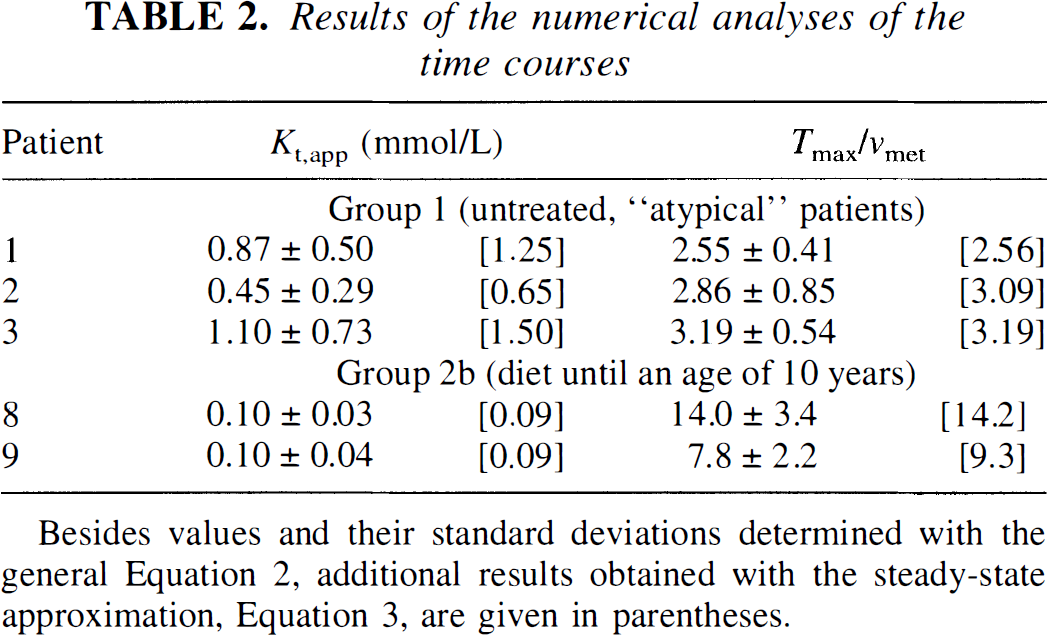
Besides values and their standard deviations determined with the general Equation 2, additional results obtained with the steady-state approximation, Equation 3, are given in parentheses.
The range of velocities for Phe brain transport and consumption obtained with equation 2 from the grid search was Tmax ≈ 0.040 to 0.25 mmol·L−1·min−1 (mean, 0.12 mmol·L−1·min−1) and νmet ≈ 0.014 to 0.098 mmol·L−1·min−1 (mean, 0.046 mmol·L−1·min−1) for group 1, and tmax ≈ 0.070 to 0.086 mmol·L−1·min−1 (mean, 0.078 mmol·L−1) and νmet ≈ 0.005 to 0.011 mmol·L−1min−1 (mean, 0.008 mmol·L−1·min−1) for group 2. These values should be considered only as rough estimates because large errors have to be considered owing to the previously mentioned insufficient time resolution. Hence, the small variation obtained for Tmax in group 2b may be accidental. Note that large interindividual variabilities in kinetic parameters were also reported for healthy volunteers examined with the double-indicator technique (Knudsen et al., 1995).
Other limitations of determining kinetic parameters from the observed relationship between plasma and brain Phe concentrations may result from several simplifying assumptions inherent in the model function, equation 2, and require further discussion.
First, in the brain, incorporation of Phe into peptides (e.g., γ-glutamylphenylalanine) or proteins and metabolite conversions (e.g., via hydroxylation or decarboxylation) provide a drain of the Phe level within the cell. In the normal state, the kinetics of the different components of this runout may be described by a Michaelis-Menten model (Kaufman, 1977; Salter et al., 1986). In contrast, the overall intracerebral metabolic rate for Phe was assumed to be constant in equation 2. This seems to be justified, knowing that brain Phe levels are increased by an order of magnitude in classic PKU as compared with healthy controls. Under such conditions we may assume that νmet approaches its maximal velocity, Vmax· This is consistent with theoretical simulations from rat data for [Phe]blood greater than 1 mmol/L (Hommes and Lee, 1990a). Patients of group 1, however, showed substantially reduced [Phe]brain even at high blood levels. Although the quality of the fits did not indicate systematic divergences and the introduction of further variables did not lead to significant reductions in χ2, we cannot completely exclude the possibility of deviations from a constant intracerebral metabolic rate in these cases.
Second, another simplification results from the use of a symmetric Michaelis-Menten model for Phe transport at the BBB, which assumes that Phe influx and efflux are characterized by identical kinetic parameters, Kt,app and Tmax. This model has been used successfully to describe steady-state data of Phe transport at the human BBB (Möller et al., 1997). Systematic deviations from the predicted saturation curve as recently reported for steady-state glucose BBB transport (Gruetter et al., 1997) did not occur in the Phe study, with [Phe]blood ranging from 0.47 to 2.24 mmol/L. A symmetric model also agrees perfectly with
The values for Kt,app and Tmax/νmet differ substantially among individuals of the same group. Pooling the data within the two groups to obtain mean values yielded standard deviations similar to those given in Table 2, which were obtained individually from the experimental accuracy (group 1, Kt,app = 0.81 ± 0.33 mmol/L, Tmax/νmet = 2.87 ± 0.33; group 2b, Kt,app = 0.10 ± 0.04 mmol/L, Tmax/νmet = 11.3 ± 4.4; the largest individual error was chosen as “standard deviation” for Kt,app in group 2b). Biologic variations may contribute to the observed range of Kt,app and Tmax/νmet within the groups. Further clarification of this point, however, requires larger data sets. Within the limitations of the very small database, statistical comparisons (Student's t test) of the mean values indicated that the obtained differences between both groups were significant (Kt,app, P < 0.04; Tmax/νmet' P < 0.03).
The kinetic parameters recorded from group 2 agree well with recent NMR results (Kt,app = 0.16 ± 0.11 mmol/L; Tmax/νmet = 9.0 ± 4.1) measured in nine clinically “typical” PKU patients under steady-state conditions (Möller et al., 1997). They are also consistent with the double-indicator measurements after Phe loading in three healthy volunteers, yielding Kt,app in a range of 0.03 to 0.58 mmol/L and Tmax of 0.0144 to 0.0943 mmol·kg−1·min−1 (Knudsen et al., 1995). In rat parietal cortex, similar values of Kt,app of 0.218 ± 0.009 mmol/L and Tmax of 0.041 ± 0.003 mmol·kg−1·min−1 were determined with the in situ brain perfusion technique (Momma et al., 1987).
Compared with these data, Kt,app appeared to be significantly larger in the “atypical” PKU patients. High BBB transport Michaelis constants make the brain uptake of amino acids in these individuals less sensitive to the effects of competition (Choi and Pardridge, 1986), which correlates well with their almost normal clinical outcome. Transport-induced brain amino acid imbalances may lead to changes in neurotransmitter metabolism and may thus influence brain function. The importance of competitive interactions, however, is still unclear. From theoretical calculations it was concluded that transport effects cannot explain Phe neurotoxicity (Hommes, 1989; Hommes and Lee, 1990a, 1990b), although others observed a significant lowering of rat brain Phe after injections of competing large neutral amino acids (Andersen and Avins, 1976).
The theoretical estimates of Kt,app at various concentrations of competing amino acids made by Hommes (1989) using equation 1 and rat data yielded values between 0.44 and 1.33 mmol/L. This matches the range observed in our study for group 1. Computer simulations demonstrated that variations of Kt,app over this range had very little effect on the Phe concentration in the brain. Hence, differences in Kt,app alone seem to be insufficient to explain the low [Phe]brain values found in group 1.
Our data provide further evidence that the excess of the influx rate over the metabolic rate is substantially reduced in group 1. From the symmetric Michaelis-Menten model (equation 2) and our crude estimates of Tmax and νmet, values, this reduction in Tmax/νmet seems more likely to be caused by increased brain Phe consumption rates than depressed Phe influx in the “atypical” patients. However, an asymmetric transport at the BBB, with Tout more than Tin in group 1, might also explain the observed differences. Our 1H NMR data do not distinguish between individual processes contributing to the drain of the intracerebral Phe level; hence, other methods are needed for further investigation of both alternatives.
In the normal state, dominant contributions to the Phe runout are hydroxylation in the liver and protein incorporation (Kaufman, 1977). It is still an unsolved question whether alternative pathways, involving transamination or decarboxylation, reflect metabolism in the body or whether it is mainly a metabolic product of bacteria in the gut. However, it has been concluded that such pathways are quantitatively only very minor ones (Kaufman, 1989). High brain Phe metabolic rates might indicate the intracerebral existence of a genetic enzyme system, restoring a more or less normal amino acid balance via hydroxylation (Kutter, 1978). Phenylalanine hydroxylation in human brain tissue has been reported from immunochemical studies leading to the assumption of an intracerebral isoenzyme of Phe hydroxylase (Bessman et al., 1977; Chestkov and Laptev, 1988; Petruschka et al., 1990), a possibility that was ruled out by others (Abita et al., 1974; Scriver et al., 1995). Alternatively, various areas of brain were shown to contain Tyr hydroxylase, which is capable of catalyzing the conversion of Phe to Tyr at a rate comparable to Tyr hydroxylation (Bagchi and Zarycki, 1973; Ikeda et al., 1965; Katz et al., 1976; McGeer et al., 1971). Although our NMR results do not provide information about the specific reactions involved in brain Phe metabolism, they are consistent with the assumption that full activity of any of those enzymes would lead to an optimal protection of the brain against neurotoxic consequences of permanently elevated [Phe]blood.
CONCLUSION
In summary, our results suggest that interindividual variations in the kinetics of Phe uptake and metabolism do exist, leading to different brain concentrations of the neurotoxin Phe at comparable blood levels. Such variations seem to be a major causative factor in the pathogenesis of PKU, providing novel insights into the enigmatic phenotypic heterogeneity of the disease. An important advantage of in vivo NMR spectroscopy, which is widely available, is that the method is essentially noninvasive. Future use of spectroscopy may include an investigation of competition interactions directly in PKU patients by performing Phe loading studies with and without additional application of competing amino acids. Dynamic NMR measurements of [Phe]brain therefore have a potential for optimizing individual treatment strategies.
Footnotes
Acknowledgments
The authors thank Professor Dr. Erik Harms and Dr. Hans-Georg Koch for helpfully reviewing the manuscript.