
Abstract
In a previous study of 10 drug-naive schizophrenic patients, the density of D2 dopamine receptors was found to be elevated in the caudate nucleus. The study raised questions about the influence of the age of the patients, the relationship of receptor density to psychosis, and the accuracy of the method used to obtain this evidence. Using positron emission tomography and constrained analysis of the brain uptake of the radioligand N-[11C] methylspiperone ([11C]NMSP), we tested four questions: Were the assumptions underlying the quantitation valid? Is there an age decline of the density of D2-like dopamine receptors in drug-naive schizophrenia and bipolar illness? If so, is it different from that observed in normal aging? Are D2-like dopamine receptors elevated at any age in either drug-naive schizophrenic or psychotic bipolar illness patients? NMSP and haloperidol partition volumes and plasma protein fractions were not significantly different among patient groups and normal volunteers. The model-derived assay of radioligand metabolites in plasma was confirmed by high-performance liquid chromatography in the patient groups. D2-like dopamine receptors declined with age, and the slope did not differ significantly between the schizophrenic patients, bipolar affective illness patients, and normal controls. Taking the effect of age into account, increases in D2 dopamine receptor density were found in seven psychotic patients with bipolar affective illness compared with seven nonpsychotic patients and 24 control subjects as well as in 22 drug-naive schizophrenic patients compared with the 24 control subjects.
Keywords
In 1986 we reported a twofold elevation of the D2 dopamine receptor density (Bmax) in the caudate nucleus of 10 patients with untreated schizophrenia compared with age-matched normal volunteers (Wong et al., 1986c). The method used to obtain this result was a modified Woolf–Hanes plot (Cressie and Keightly, 1981), which included two determinations of the distribution of [11C]N-methylspiperone ([11C]NMSP) at a high specific activity in the brain, with the second determination conducted after administration of a dose of haloperidol sufficient to block a number of D2 dopamine receptors (Wong et al., 1986a, b , 1997; Gjedde and Wong, 1990).
The significant elevation of D2 receptor density in schizophrenia was not confirmed in two studies of [11C]raclopride binding (Farde et al., 1990; Hietala et al., 1994). The lack of a difference between patients and controls also agreed with the originally negative findings of Wong et al. (1985) and Martinot et al. (1990), both of which were based on the simple ratio between radioactivity in the caudate nucleus and the cerebellum after injection of radiolabeled spiperone analogs.
Using either the ratio (Wong et al., 1984) or the actual calculation of receptor Bmax (Wong et al., 1997), we demonstrated that D2-like dopamine receptors decline with age. The decline in normal aging raises four questions: 1) Are the assumptions underlying the modified Woolf–Hanes plot valid for studies of psychosis? 2) Does the receptor decline with age also occur in psychosis, especially in schizophrenia and bipolar illness? 3) If so, is the decline different from that observed in normal aging? 4) Are D2-like dopamine receptors elevated in drug-naive schizophrenic patients and in psychotic disorders other than schizophrenia when the effect of aging is considered?
In this paper, we answer these questions. We test in vivo the hypothesis that [11C]NMSP binding is elevated in the two psychotic disorders, bipolar illness and schizophrenia, when aging effects are considered. The assumptions underlying the method were tested separately by measuring partition volumes and plasma protein binding fractions of haloperidol and NMSP in postmortem and in vivo psychotic subjects and by comparing the kinetically determined in vivo metabolites of [11C]NMSP with high-pressure liquid chromatography (HPLC) measurements. The second and third questions were addressed by determining the D2 dopamine receptor density in the caudate nucleus as a function of age in several patient groups, including those with another psychotic disorder, bipolar affective illness.
Recently, Seeman et al. (1993) showed that spiperone and its derivatives may bind to dopamine D3 and D4 receptors in addition to D2 sites, whereas raclopride binds to D2 and D3 sites only. For the binding of [11C]NMSP, a spiperone derivative, the term D2-like has been applied to the combined group of D2, D3, and D4 receptors. Elevated receptor density in psychosis, as measured by [11C]NMSP, is especially relevant because it has been hypothesized that D4 is the receptor subgroup that is elevated in schizophrenia (Seeman et al., 1993).
ASSUMPTIONS
Calculation of Bmax
The dopamine D2 receptor density Bmax was calculated by means of a modified Woolf–Hanes plot as described by Wong et al. (1997):
where Δt̅ is the difference between the time constants of binding in the presence and absence of a competitor (e.g., haloperidol) when the time constants are the reciprocal of the values of k3, the forward binding rate to the receptor; CH is the steady-state plasma haloperidol concentration; and Dw is a lumped coefficient equal to the ratio (Wong et al., 1997),

where f1 and KI refer to the unlabeled inhibitor (e.g., haloperidol) and k*on and V*d refer to the labeled radiotracer NMSP. In this paper, it is assumed that the binding coefficient Dw is the same in patients and normal volunteers. This assumption was tested by evaluating the components that constitute the lumped coefficient. Because Dw is a lumped coefficient, the assumption is valid when the constituents are constant across subject groups.
It is necessary to determine accurately the labeled metabolites of [11C]NMSP in plasma.
METHODS
Validation of assumptions
In vitro studies.
To test the key assumptions underlying the quantitative procedure, we (1) determined the partition volume for haloperidol and NMSP, and (2) confirmed the kinetic correction for NMSP metabolites by HPLC. We tested whether the partition volume of haloperidol in the region of interest was the same in postmortem tissue from patients with schizophrenia and bipolar illness and from normal controls. The numerator of Dw was calculated by determining the free fraction of haloperidol (f1) in plasma from subjects in the three groups.
Partition volume: To determine the distribution volume, V*d, for NMSP, we measured the free fraction of [11C]NMSP in plasma f*1 and the partition volume of [11C]NMSP V*e, where V*e = f*1 V*d. To compare the brain-to-blood partition volume for haloperidol in patients, we determined the haloperidol brain-to-blood partition volume in cerebellum from control subjects, patients with schizophrenia, and patients with bipolar disease. [18F]haloperidol with a specific activity of 1–2 μCi pmol–1 was produced by the method of Shiue et al. (1989). Cerebellum tissue was obtained at autopsy from seven normal subjects (mean age, 38 ± 21 years SD; four males and three females), six schizophrenic subjects (37 ± 16 years; five males, and one female), and six patients with bipolar disease (47 ± 20 years; one male and five females). Tissue was stored at −80°C (interval from death to tissue freezing less than 24 h). The cerebellar tissue was thawed to waxy consistency and dissected into tissue prisms (0.5 mm). The tissue then was suspended (25 mg ml–1) in fresh human plasma containing a σ-receptor blocker, d-pentazocine (50 nM). [18F]haloperidol (5 nM) was added to triplicate samples and incubated at 37°C for 60 min as described by Wong et al. (1997).
Plasma protein binding (f1 and f*1): The presence of plasma proteins may influence the blood partitioning of haloperidol in vivo. To determine the free fraction f1 for haloperidol and f*1 for NMSP, we measured their protein binding in plasma. Thus, plasma protein binding of [11C]NMSP and [18F]haloperidol in the different diagnostic groups (bipolar disorder and schizophrenia) was determined as described by Wong et al. (1997).
Plasma metabolites: To test the validity of the kinetic method of metabolite correction across the diagnostic groups in humans, we analyzed plasma samples for metabolites of [11C]NMSP with HPLC (Wong et al., 1997). Metabolite analysis included four normal volunteers (Wong et al., 1997), eight patients with schizophrenia, and two patients with bipolar disorder, with as many as six blood samples per positron emission tomography (PET) study for a total of 127 samples from 23 studies. The metabolite data obtained using HPLC was compared with the kinetic metabolite correction data (Wong et al., 1986a) for each diagnostic group.
In vivo studies.
To examine the effects of aging in psychosis, we measured the D2-like dopamine receptor density (Bmax) in patients with bipolar affective illness and in neuroleptic-naive patients with schizophrenia. We examined 14 patients with bipolar disorder (11 manic and three depressed at the time of study) and 22 patients with schizophrenia (10 of whom were previously presented in Wong et al., 1986c). All subjects gave informed consent in compliance with The Johns Hopkins Joint Committee on Clinical Investigation.
All patients satisfied the Diagnostic and Statistical Manual of Mental Disorders (DSM)IIIR criteria for bipolar disorder or schizophrenia. Patients were excluded if they had a history of a head injury leading to unconsciousness greater than 1 h; weight loss >25% of their body weight in the past 6 months; amphetamine or cocaine use in the past year; a history of seizures, dementia, or any other CNS disease; mental retardation; or alcohol, drug, or steroid use. All patients with schizophrenia were neuroleptic naive, as were 11 patients with bipolar disorder. The three remaining bipolar patients were medication free for at least 6 months. These last three bipolar subjects had received neuroleptic medication for previous episodes of bipolar illness but not for the current episode. Nine of the schizophrenic subjects were of the undifferentiated type, and 13 were of the paranoid type. Of the paranoid group, four had late-onset schizophrenia. Seven of the 14 patients with bipolar illness were psychotic (i.e., had one or more of the following symptoms: hallucinations, delusions, or thought disorder) at the time of PET scanning. Delusions and/or hallucinations, when present, were mood congruent in bipolar patients. Patients classified as nonpsychotic had none of these symptoms. The mean length of the current episode for the bipolar patients was 5.4 ± 7.8 months. Additional clinical characteristics and neuropsychological profiles of the schizophrenic subjects are detailed for adult onset (neuroleptic naive only) in Tune et al. (1993) and for late onset (neuroleptic naive only) in Pearlson et al. (1993). The clinical characteristics and symptom profiles of the bipolar subjects are detailed in Pearlson et al. (1995). Normal subjects were free of present and past physical or psychiatric disorders and were never exposed to neuroleptics. A summary of the age and gender distribution of the subjects is given in Table 1. PET and image analysis followed the procedure previously published (Wong et al., 1986b, 1997).
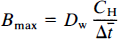
Age and sex characteristics
For all subjects, regardless of diagnostic group, all specific activities at the time of injection exceeded 1 μCi pmol–1, consistent with D2-like receptor occupancy of less than 5%. Thus, any differences between injected mass of ligand could not confound the receptor density quantification. (The age difference for schizophrenic patients and matched controls studied pre- and post-1986 was dictated by a shift in our research focus to late-onset schizophrenia and to patients who could remain medication free for extended periods.)
Statistical analysis for PET studies.
To examine the relationship between age and Bmax, simple linear regressions of Bmax versus age were first fitted separately for each of the diagnostic groups (normal controls, schizophrenic patients, psychotic and nonpsychotic patients with bipolar disease). A quadratic term for age was also tested but was never significant for any subgroup. For the regression of Bmax on age, a combined model across all diagnostic groups was tested for differences between the slopes and intercepts across these groups. The analysis employed a single-regression model with dummy variables and terms for the interaction of age and group (Kleinbaum et al., 1988). We used backward elimination with a probability limit of p = 0.05 for a variable to remain in the model.
We also compared the simple caudate–cerebellum tissue ratios (Wong et al., 1984) among diagnostic groups with the same regression model as that used for Bmax. The prehaloperidol caudate–cerebellum ratio at 45 min (R45) was the dependent variable.
To examine whether patients studied after 1986 demonstrated Bmax elevation, we performed a regression analysis with diagnosis (schizophrenia vs. control) and study period (pre- vs. post-1986) as independent variables. The model allowed separate intercepts, one for each diagnostic group and each time period; however, because of sample size limitations, we assumed that within each diagnostic group the slopes of Bmax versus age were the same for both time periods but that the slopes for each group could differ. In this model, we compared the age-adjusted mean Bmax of the post-1986 control subjects and post-1986 schizophrenic patients. Age was adjusted to 42 years, the overall mean age of both diagnostic groups and both time periods.
We also examined the stability of the receptor measurements over time. Regression analysis was performed for the Bmax values of all 24 normal control subjects studied between 1985 and 1992. For this analysis, Bmax was the dependent measure, and the date of study, age, and age by date interaction were the predictors. Statistical packages included PC-SAS and PC-CARP, Iowa State University.
RESULTS
Validation of assumptions
In vitro studies
Partition volume: In vitro the mean partition volumes for [18F]haloperidol were not significantly different among the postmortem tissue from controls, patients with schizophrenia, and patients with bipolar disease. All values approximated 3 ml g–1 (Table 1).
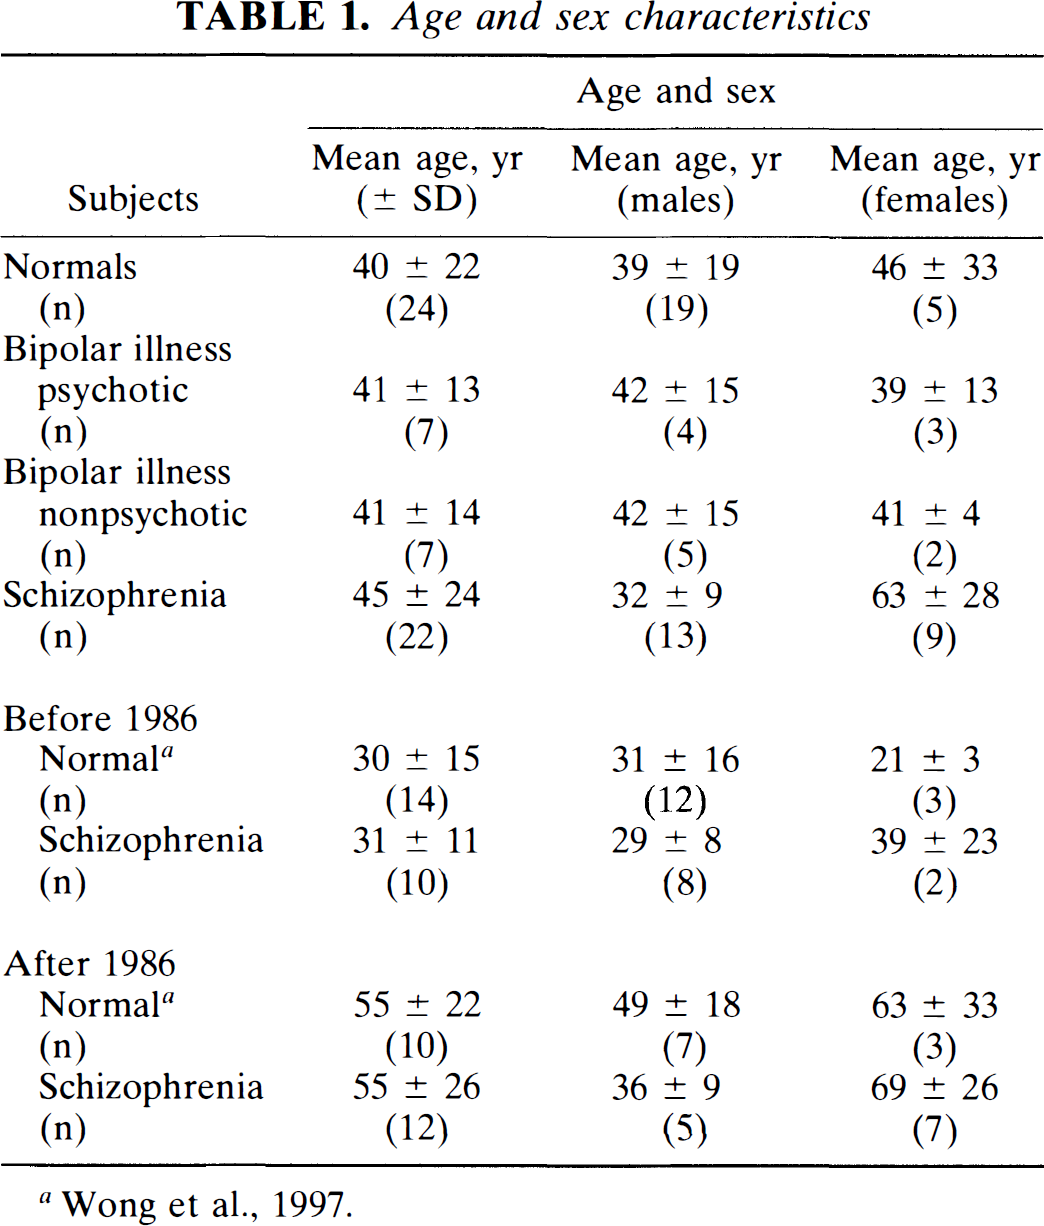
Plasma protein binding: The fractions of NMSP and haloperidol that were free in plasma (i.e., not bound to plasma proteins) were not significantly different between patients and normal volunteers (Table 2).
Tracer metabolism: The HPLC retention time was approximately 4 min for [11C]NMSP and 2.6 min for metabolites (typically, the recovery was of the order of 90%). There was an excellent correlation between modeled and HPLC-measured metabolites, r = 0.99. No significant difference between the kinetic and HPLC metabolite corrections was observed for any diagnostic group (Fig. 2).
[18F]Haloperidol partition volume (Ve) in human cerebellum versus plasma (ml g–1) (mean ± SD)
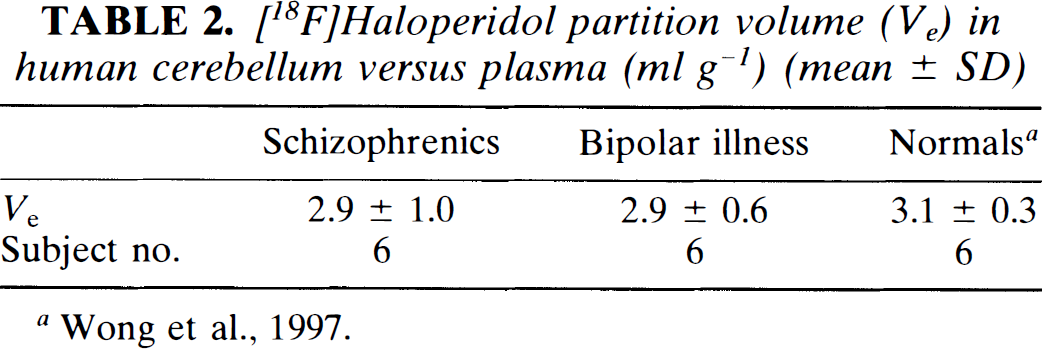
Bmax versus age is plotted for normal versus schizophrenic subjects (A) (•), SCZ; (+) NOR, and normal versus bipolar psychotic and bipolar nonpsychotic subjects (B) (•) psychotic bipolar; (○) nonpsychotic bipolar. The individual linear regression lines are plotted and given in Table 4. The statistical analysis results are given in Table 4.
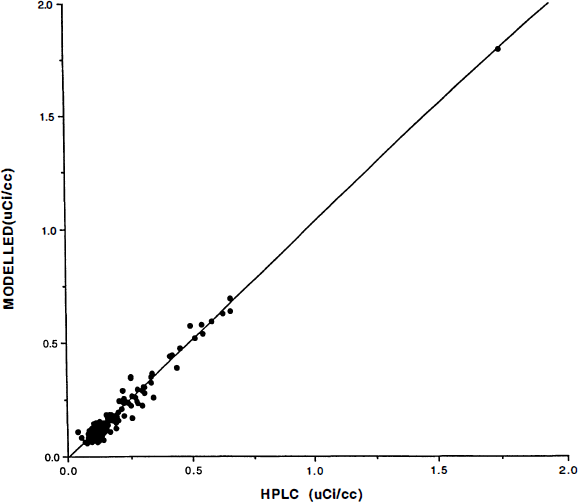
Plasma radioactivity concentrations were corrected for metabolites by two methods. On the abscissa axis are radioactivity measures corrected by high-pressure liquid chromatography (HPLC) assay described in the Methods section. On the ordinate axis are the radioactivity measures corrected using the model-derived corrections applied to the measured total plasma radioactivity for the human subjects. Units are in μCi/ml. The subject population consisted of normal controls, schizophrenic patients, and bipolar illness patients. Radioactivity measures were obtained throughout the 90-min study. The linear regression is [model corrected plasma (μCi/ml)] = (1.03) [HPLC-corrected plasma (μCi/ml)] − 0.01 μCi/ml, r2 = 0.98.
In vivo studies
Subject characteristics: Blood pressure, pulse, weight, and nutritional status at the time of the scan were not significantly different between the normal controls and patient groups. Mean ages and sex distribution for all subjects studied between 1985 and 1991 are described in Table 3. The table presents the sample characteristics separately for subjects studied pre-(overlapping Wong et al., 1986c) and post-1986.
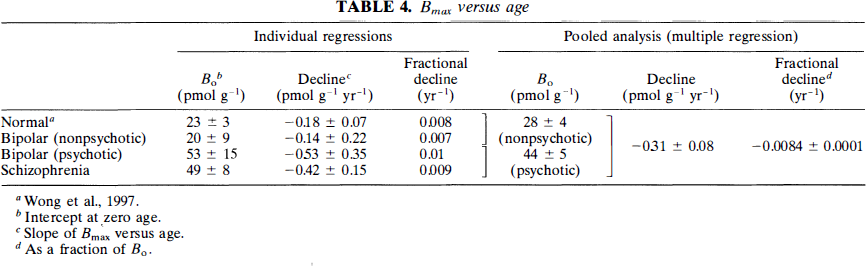
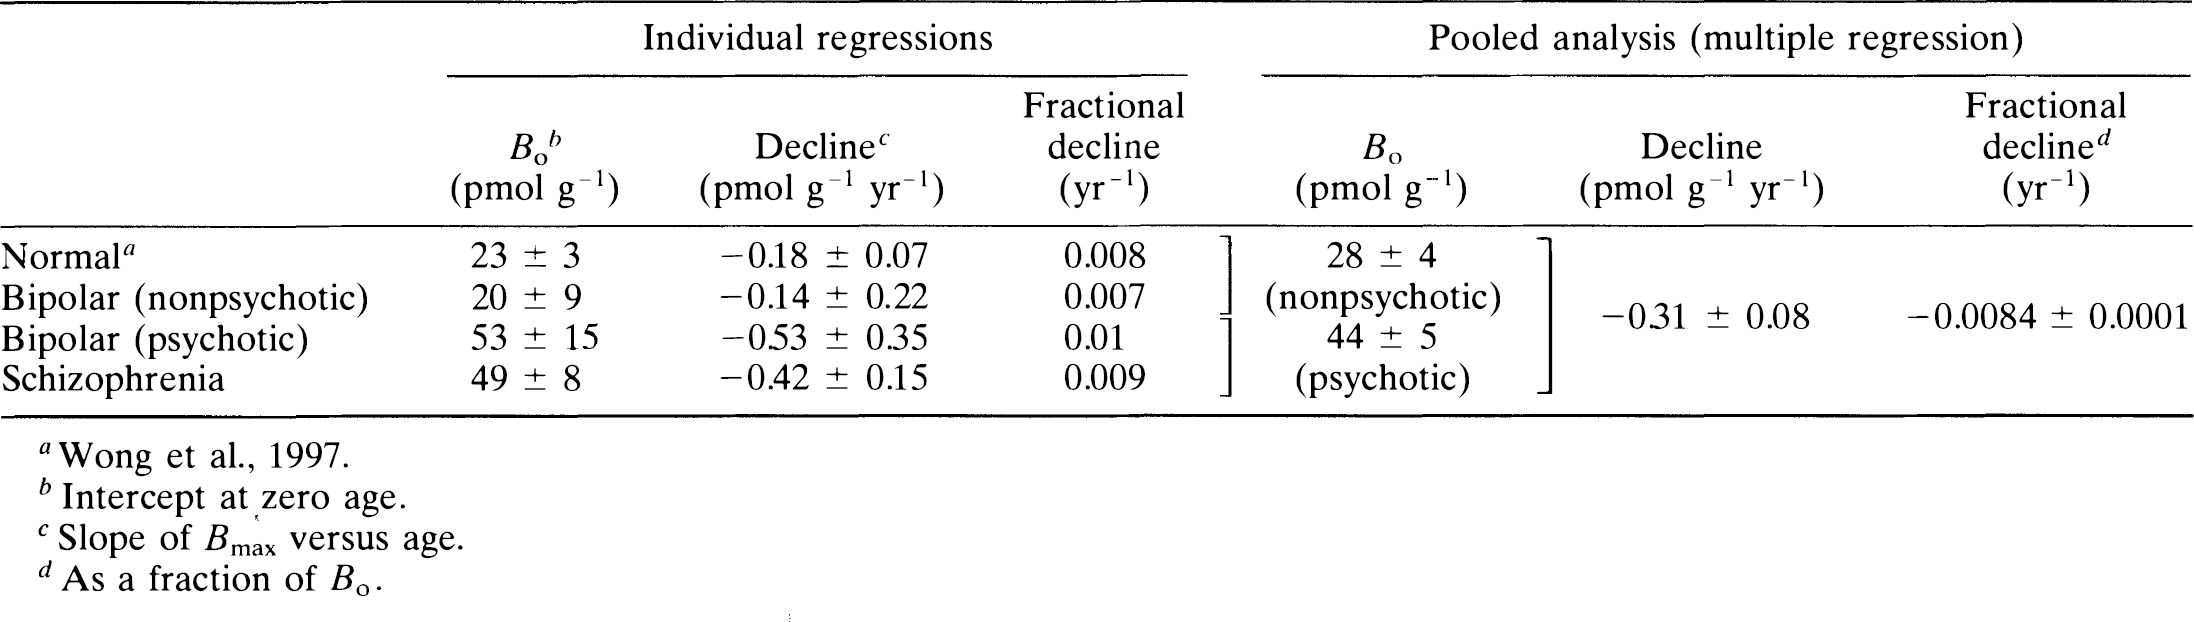
Receptor density: Regression analysis of Bmax values for all normal controls against the date of study revealed no significant effects resulting from the date of study or the interaction between age and date (p > 0.32), which suggests that no temporal bias occurred in the normal volunteers. The decline of Bmax with age examined in each patient group, including previously studied control subjects, schizophrenic patients, nonpsychotic patients with bipolar disease, and psychotic patients with bipolar disease, is shown in Fig. 1. The results of the individual regressions are provided in Table 4.
When the data from the diagnostic groups were pooled for the regression analysis, a common slope for all four groups indicated a significant change with age of −0.31 ± 0.08 (SEM) pmol g–1 yr–1. The nonpsychotic patients with bipolar disease and the normal control subjects had a single intercept (Bo) of 28 ± 4 pmol g–1. The psychotic patients with bipolar disease and the schizophrenic patients shared a single intercept of 44 ± 5 pmol g–1. Thus, when an omnibus significance test was applied, the subjects fell into two groups: one group consisting of psychotic subjects with a significantly higher intercept but equivalent slope and a second group consisting of all nonpsychotic subjects. In all groups, decline with age occurred at the rate of approximately 1% of Bo per year, indicating that all D2-like receptors have disappeared by the age of 100 years.
A separate test was carried out to determine whether patients with schizophrenia studied after 1986 had significantly elevated values of Bmax relative to normal volunteers studied after 1986. The Bmax estimates were calculated under the assumption that within each diagnostic group, the age decline was the same for pre- and post-1986 subsamples. Backward elimination for the post-1986 group suggested a common age decline for control subjects and patients. For comparison, Bmax values were adjusted to 42 years, the overall mean age of both diagnostic groups and both time periods. From the regression model, which included a variable for pre- and post-1986 data, the post-1986 age-adjusted Bmax of schizophrenic patients (24 pmol g–1) was elevated (35%) compared with control subjects (18 pmol g–1) (p < 0.05, one-tailed test). Similarly, the age-adjusted Bmax of the pre-1986 schizophrenic patients was 39 pmol g–1 versus the control value of 12 pmol g–1 (p < 0.05), an increase of 225%.
Caudate-cerebellum ratio: The ratio between the radioactivity of the caudate nucleus and the cerebellum at 45 min (R45) was compared among the groups. The linear regression of the decline with age was tabulated for each group in Table 5: normal controls, schizophrenic patients, nonpsychotic patients with bipolar disease, and psychotic patients with bipolar disease.
Radiotracer free fraction in plasma (f1 % ± SD) (n)
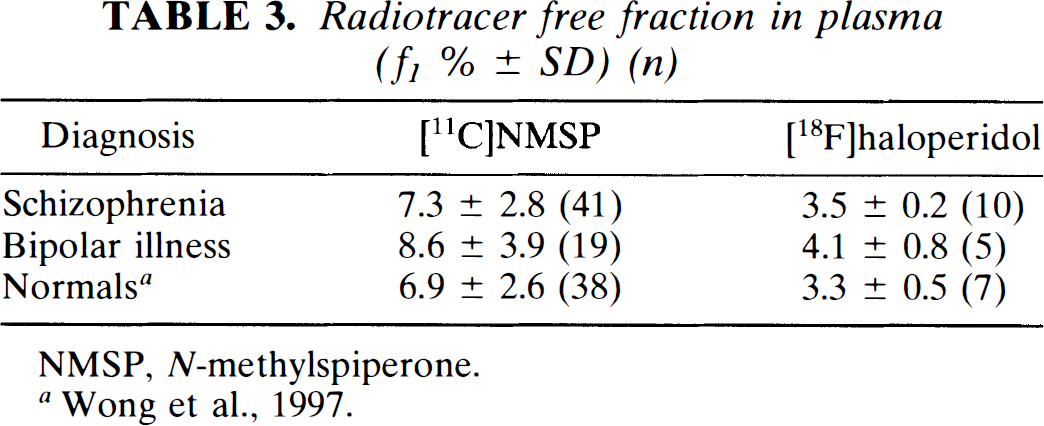
NMSP, N-methylspiperone.
Bmax versus age
Caudate/cerebellar ratio index versus age linear regressions
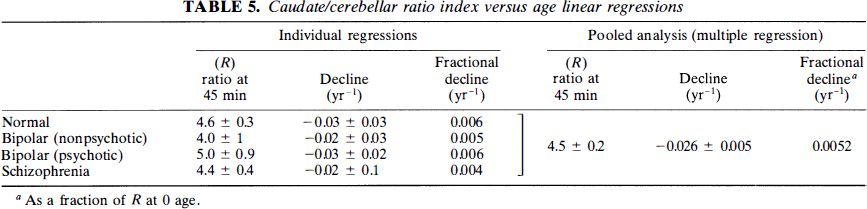
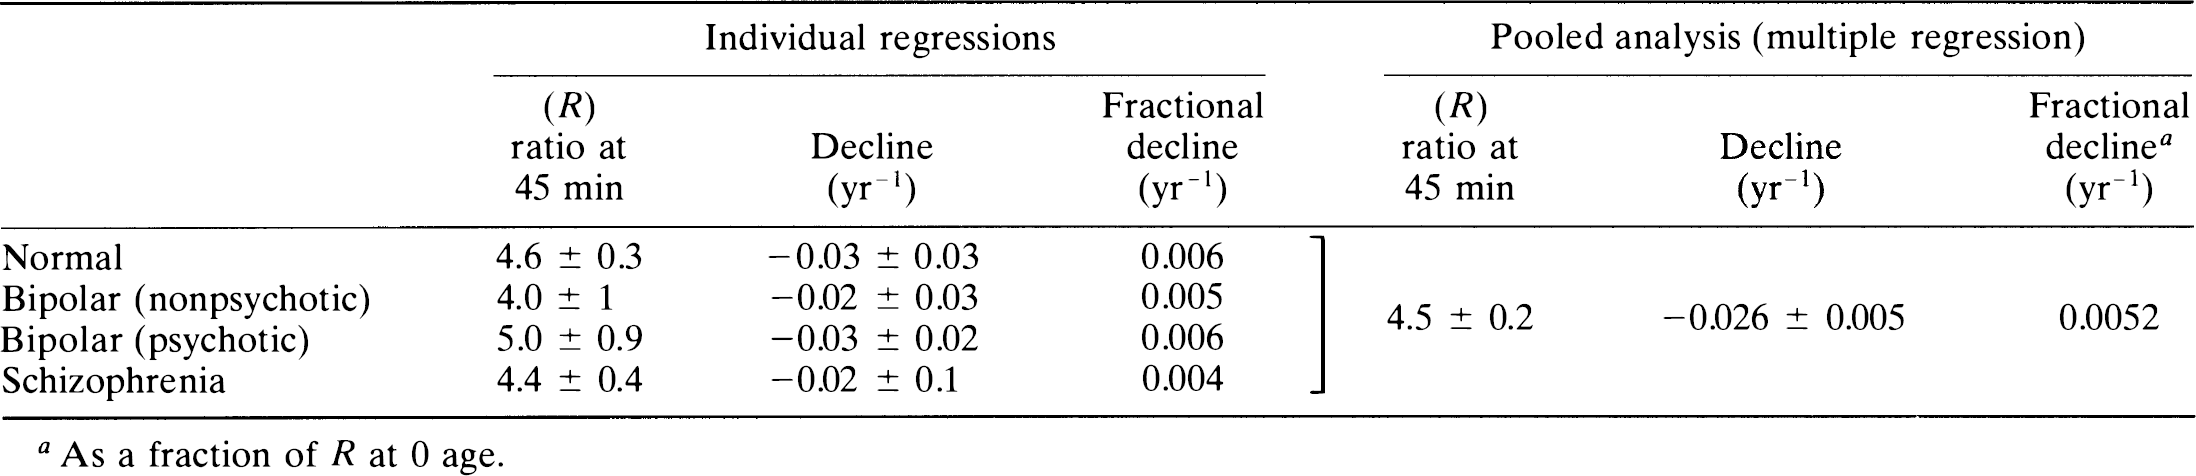
To test for group differences, we pooled the four subject groups for multiple linear regression with the ratio index as the dependent and age and diagnosis as the independent variables. Backward elimination identified a common slope for all groups and indicated a significant change with age of −0.026 ± 0.005 year–1. The subject groups shared a single zero-age intercept (R) of 4.5 ± 0.2. Thus, using the ratio method, there was no significant difference of slope or intercept among any of the patient groups.
DISCUSSION
This study addressed three questions raised by the application to psychosis of a particular solution to a quantitative model for receptor binding. The validity of the method's application to normal volunteers was considered in the preceding paper (Wong et al., 1997).
Validation of assumptions
The first question considered the validity of the assumptions underlying the Woolf–Hanes plot and the extent to which the consequent procedures biased the results in psychotic patients. The partition of NMSP between brain tissue and blood plasma was comparable to the in vivo partition volume determined with PET. The validation revealed no significant difference between the partition volume of patients and normal volunteers. The identification of free fractions of [11C]NMSP in patients and control subjects strengthened the finding of identical partition volumes in vitro and in vivo.
The metabolism of [11C]NMSP in the circulation was measured by HPLC. The evaluation demonstrated excellent agreement with the kinetic assay used previously. Both assays were unbiased across diagnoses.
Effect of age on psychosis
In response to the second question of a decline of the D2-like dopamine receptor density with age, we also demonstrated a decrease in Bmax with age in patients with psychiatric disorders. The decline with age was previously demonstrated with the modified Woolf-Hanes plot in normal volunteers (Wong et al., 1997). Hess et al. (1987) suggested such a decline with age in a post-mortem study of schizophrenia. Thus, because of the strong evidence for a decline of Bmax resulting from aging, age correction of Bmax values is necessary for the comparison of neuropsychiatric patients and control subjects. There was no significant difference between the decline with age for all four diagnostic groups (i.e., normal, schizophrenia, psychotic, and nonpsychotic bipolar disorder), although the sample size for the latter two groups would need to be enlarged to be more definitive.
Elevation of Bmax in psychosis
The third question was whether the age correction described above would lead to differences in Bmax for the two psychotic disorders relative to controls. It was recently shown that late-onset schizophrenic patients also revealed elevations in Bmax when calculated with [11C]NMSP (Pearlson et al., 1993). In the current study, the age correction of Bmax revealed elevations of dopamine D2-like receptors in a psychotic illness other than schizophrenia. Thus, the receptor density was elevated in psychotic patients with bipolar disorder compared with nonpsychotic patients who have the same disease. The present finding suggests that psychosis, whether in early or late-onset schizophrenia or in bipolar illness, is associated with the Bmax elevation of D2-like receptors (Wong et al., 1989). This finding is consistent with the positive correlation observed in bipolar patients between their Bmax for D2-like receptors and their quantitative psychosis score (mini-present state exam) (Pearlson et al., 1995).
The finding of normal Bmax estimates in nonpsychotic patients with bipolar disorder argues against a systematic error for increased D2-like receptors in patients with psychotic disorders. This finding suggests, therefore, a link between psychosis and elevated D2-like receptors. This link, that not only receptors of dopamine but also the dopamine synthesizing enzyme, dopa decarboxylase, is elevated in diseases with psychosis but normal in healthy volunteers and patients without psychosis, was recently suggested by the findings of Reith et al. (1994). Dopamine D2 receptor Bmax estimates were not significantly different in psychotic patients with bipolar disease and in drug-naive patients with schizophrenia, suggesting that D2-like dopamine neuroreceptors may play a role in all psychiatric disorders that have prominent psychotic symptoms in common.
The subset of schizophrenic patients studied since 1986 had significant elevations of Bmax when individual values were adjusted for age. The smaller increase seen in this study compared with the 225% increase observed previously (Wong et al., 1986c) may relate to differences in gender, age, and clinical characteristics of the more recently studied sample (Tune et al., 1993). This finding reflects differences in recruitment as described in Methods and also could explain in part the alleged lack of difference observed by Nordström et al. (1995) using [11C]NMSP; however, evidence of significant elevation of Bmax in schizophreniform men has raised questions about the conclusions of that study (Gjedde et al., 1995).
From the review of the literature, two questions arise: The first question is, Why are increases of Bmax not reflected in calculations of the caudate–cerebellum ratio? Most studies failed to reveal elevations in dopamine receptors with the simple caudate–or putamen–cerebellum ratio as a means of quantifying dopamine receptor density. A significant difference was not observed in the present study for the calculated ratio at 45 min (R45). The reason is the following: R45 is a mixed function of the rate constants k2 and k3, when k3 is low; however, for high k3, R45 is a function primarily of k2, which in turn is related to blood-brain permeability and blood flow and not to dopamine Bmax. A kinetic description of the ratio (e.g., R45) is given in the Appendix. Figure 3 illustrates the dependence of R45 on the magnitude of k3 relative to k2 at values of ρ ranging from 1 to 3. This correlation is weak for higher values of ρ. Thus, the dependence of R45 on k3 is not linearly proportional to the value of k3 and cannot be easily distinguished between subjects such as schizophrenic patients with high k3 values and subjects with low k3 values. Furthermore, Fig. 3 shows that R45 is a multivalued function of k3. This may explain in part why two populations with different values of Bmax may have the same value of R45. Conversely, R45 detects falls with age because both k2 and k3 fall with age. Thus, ratio indices are not reliable measures of ligand binding for tracers like NMSP that do not reach “pseudo-equilibrium” during the imaging time.
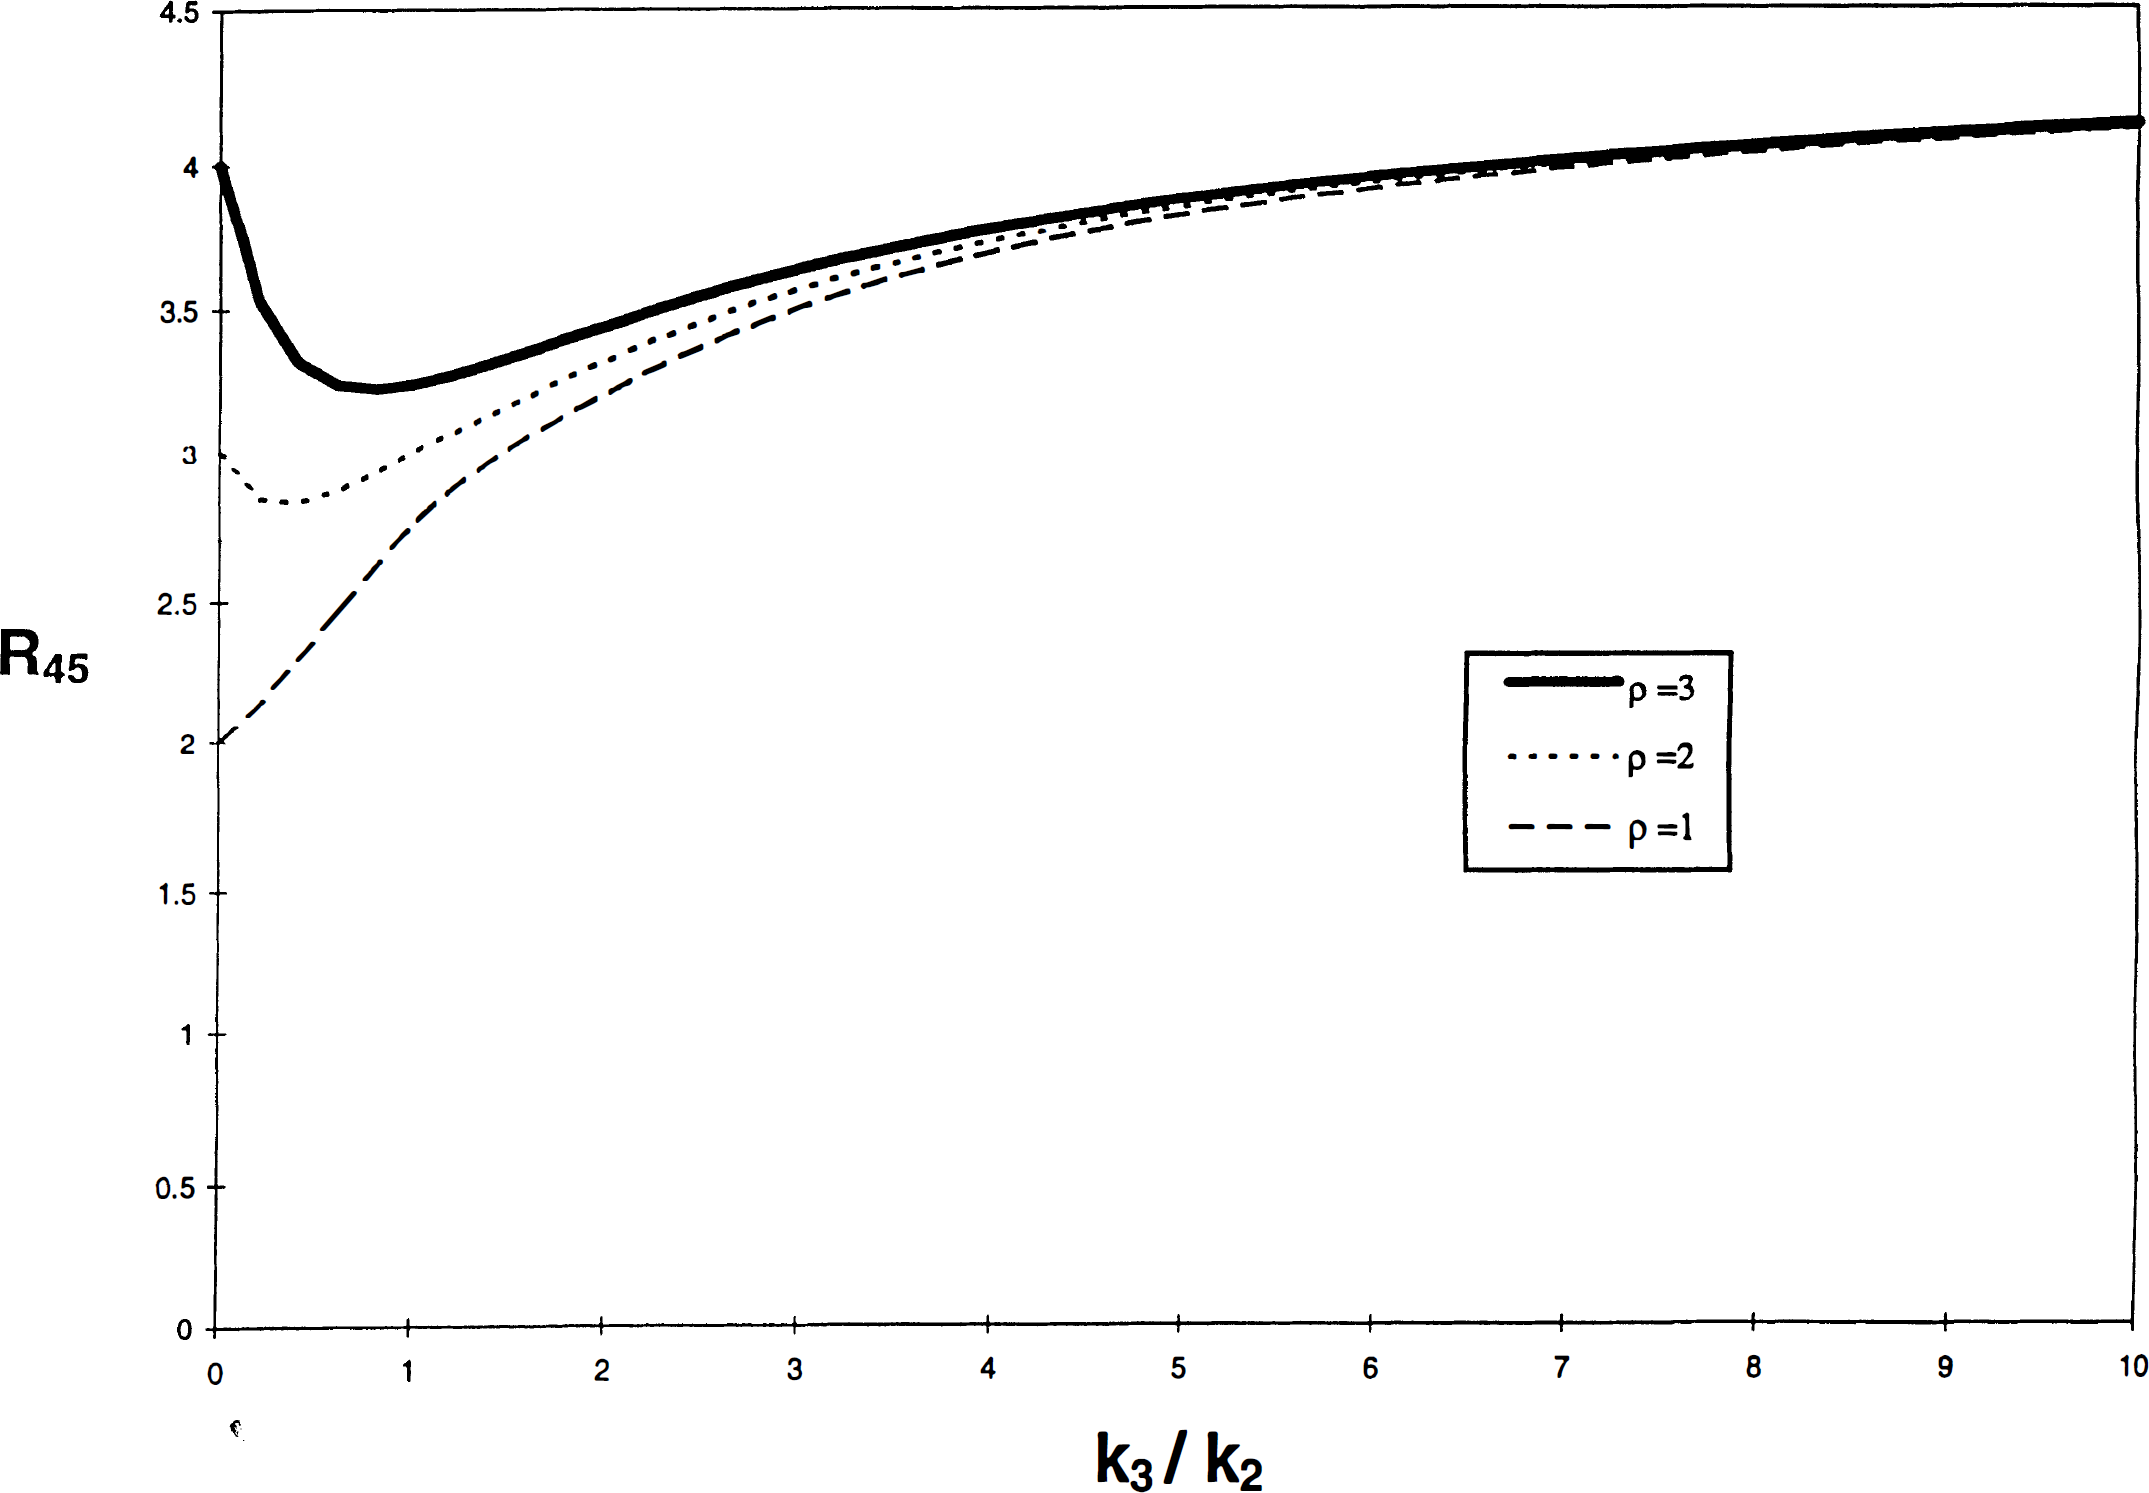
A simulated plot of R45 versus k3/k2. Eq. 4 is plotted for values of k3/k2, ranging from 0 to 10 for typical values of k3 with a fixed value of k2 = 0.05 min–1; ρ = 1, 2, and 3; Θ = 90 min. The graph illustrates the lack of sensitivity of R45 for wide ranges of k3 (hence Bmax) as well as the possibility for two values of k3/k2 for a given value of R45 (see Discussion). Ordinate R45 (ratio), abscissa k3/k2 (min–1/min–1).
The second question is, Why is no elevation generally observed with [11C]raclopride? One possibility relates to D4 receptors. Dopamine D2-like receptors include D2-D4 receptors of uncertain function and location. Because [11C]NMSP has a high and [11C]raclopride a negligible affinity for the D4 receptors, it has been suggested that the increased receptor densities observed with NMSP are due to elevated D4 receptors undetected by [11C]raclopride (Lathi et al., 1993; Seeman et al., 1993). There is an increasing general belief that the D2 receptors are presynaptically located on neuronal terminals other than the dopaminergic terminals themselves, whereas the D3 receptors are the D2-like autoreceptors on dopaminergic terminals. D4 receptors have been found in postmortem striatum in which the difference between the densities of D2-like receptors recorded with NMSP and raclopride is greatest. (D4 receptors are sparse in normal subjects.) Another neuroreceptor ligand with considerable affinity for the D4 receptor is clozapine, a promising atypical neuroleptic. A sixfold elevation of D4 receptors in the striatum of schizophrenic patients has been reported (Seeman et al., 1993). The in vitro D4 elevation was calculated from a 62% increase of [3H]emonapride binding in schizophrenic brain tissue. Although this finding and the presence of a true D4 receptor in striatum are controversial (Reynolds and Mason, 1994; Seeman et al., 1995), these findings agree in principle with the apparent “D4-like” results of other groups (Owen et al., 1978; Lee and Seeman, 1980; Seeman et al., 1984, 1987a, b , 1993; Mita et al., 1986; Murray et al., 1995). It was recently suggested that the actual D4 receptor (which has been cloned and for which mRNA can be identified) is actually distributed in cortical regions, such as hippocampus, entorhinal, and cingulate cortex, and is in fact present in very low levels in the caudate and putamen (Lahti et al., 1996). Thus, the elevations observed here and elsewhere (see Table 6) are henceforth referred to as “D4-like” (Seeman et al., 1996), which seems justified in that the literature bears out patient differences that still seem to be ligand dependent.
Studies of D2-like receptors in psychosis
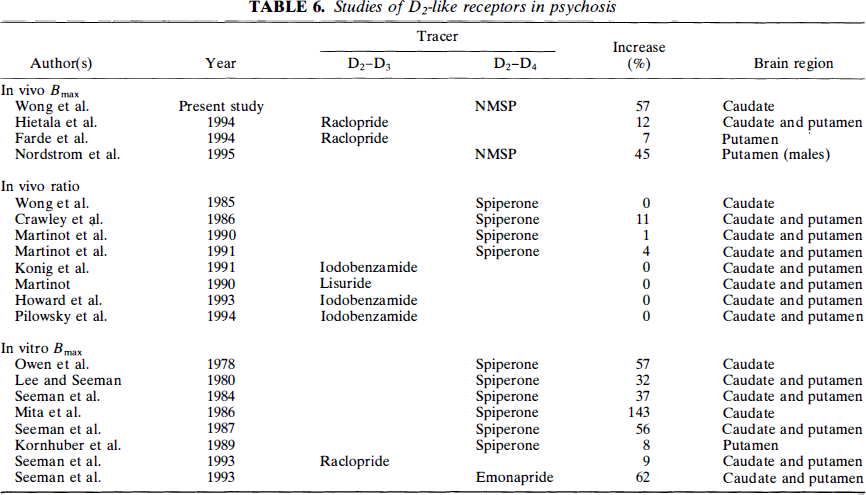
We have tabulated the current and previous clinical findings in Table 5. The data presented there reveals a ∼100% increase in [11C]NMSP binding in the caudate nucleus of all drug-naive schizophrenic subjects. Even more striking is the result when data from all psychotic patients are included, as permitted by statistical analysis, which shows no signficance in the age decline of Bmax between these groups. In this case, the increase in psychotic subjcts is ∼60%, which is remarkably consistent with data from other workers. The exception to this observed Bmax elevation in psychosis is in the in vivo ratio studies, in which quantification maybe insufficient given the nonequilibrium nature of the tracer and the lack of kinetic analysis as explained above (Farde et al., 1990; Howard et al., 1993; Martinot et al., 1991; Konig et al., 1991). The degree to which the D4 receptors actually contribute to the elevations seen in this report requires more specific experiments, aided by specific D4 ligands tested in psychotic patients. An alternative hypothesis to these apparent striatal differences may reside in the hypothesis that raclopride binds to monomers and dimers in different proportions and that the monomeric contribution is significantly elevated in psychosis. (Seeman et al., 1996) Regardless of the mechanism, an NMSP–raclopride discrepancy seems to be apparent, as seen in Table 5, although the mechanism is still unclear.
Another possibility relates to the effect of greater intrasynaptic dopamine release in schizophrenia. This possibility was already suggested by Laruelle et al. (1995), who used [11C]raclopride. The effect of this dopamine release contributing to an apparent Bmax reduction was also suggested (Wong et al., 1995). This effect may be greater with raclopride than with NMSP (Young et al., 1991; Seeman et al., 1989).
Finally, patient heterogeneity is always an important consideration in discrepant studies (Andreasen et al., 1988). The patients from this study may differ substantially from those in whom no significant differences were observed, especially those in Sweden. Differences in age of onset, duration of illness, and others could contribute importantly to the differences in the outcomes of the various studies (Tune et al., 1993).
In summary, the most important findings of this study are the evidence of declining receptor density with age in several forms of psychosis and the evidence of similar declines with age in the elevations of D2-like receptors in two different psychotic disorders. Using a validated method of determining Bmax, these findings suggest that psychosis is associated with elevations in D2-like receptors in general, not only in schizophrenia. This suggestion has important implications in its relevance to psychotic disorders, and it supports subsequent treatment protocols with D2-like dopamine antagonists.
Footnotes
Acknowledgment:
This work was supported in part by Public Health Service grants NIMH RO1 MH42821 (D. F. W.), NARSAD (D. F. W.), ROl MH40362 (L. T.), KO1 MN00723 (L. T.), NICHD 23042 (D. F. W.), MH40391, MH43775; MRC (Canada) grants SP-5, PG-41, and SP-30 (A. G.); MH43326 and MH43775 (G. D. P.), the Fred Low-Beer and EJLB Foundations, Montreal (A. G.), and MRC (Denmark) grants 94-1233-1 and 94-1234-1 (A. G.). Jakob Reith was supported by Human Frontier Science Program and Lundbeck Foundation Fellowships. We acknowledge the expert statistical consultation of David Wilson, Ph.D., University of Maryland, Department of Preventative Medicine. We acknowledge the physics and image analysis assistance of Jon Links, Ph.D., and the substantial discussions and suggestions of Susan Resnick, Ph.D. We acknowledge the mathematical consultation of Rodger D. Parker, Ph.D. Special thanks for technical assistance to Boon Chan, C. Chen, D. Burckhardt, B. Muddiman, T. Folio, E. Minkin, K. Hollis, J. Majewski, C. Alexandrescu, and L. Halliday. Special thanks to Chris Ross, M.D., for patient recruitment assistance. Thanks to T. Wei for editorial assistance.
We gratefully acknowledge the donation of the human tissue by Manuel F. Casanova and Joel E. Kleinman, Neuropathology Section, Clinical Brain Disorders Branch, National Institute of Mental Health, Washington, D.C.
Abbreviations used:
APPENDIX
The Ratio Index estimates binding of NMSP from the ratio between the radioactivity in a binding region and a nonbinding region (Wong et al., 1984; Martinot, 1990). From Eqs. 35, 36, and 37, of Wong et al. (1997), the volume of distribution of the tracer after the onset of transient equilibrium is
Thus, for k3 = 0 and ρ = 0 in a region of reference,
which expresses the absence of processes other than distribution in the partition volume of the region of reference.
The ratio (R) between the mass of the tracer in a binding region (M) and the radioactivity in a nonbinding region (M*e) is the ratio between Eqs. A1 and A2,
These equations are described in detail by Gjedde (1982) for the slightly different situation of the ratio of two brain regions by Patlak and Blasberg (1985) and also by Wong et al. (1986a). In the present description, we have directly compared the ratio method to the kinetic method and revealed its implications for application to disease states.
The ratio at 45 min, R45, was evaluated to illustrate the relationship between R45 and k3 (see Fig. 3). Computationally, R45 is determined mainly by the tracer amount in the brain in the region of interest (e.g., caudate) normalized to the nonspecifically bound tracer in cerebellum. The contribution to R45 of the region of interest consists of tracer in the free pool (Mf), the rapidly equilibrating pool (Mr), and the bound pool (Mb), as tracer in the blood volume makes a relatively small contribution.
Whether R45 rises or falls with k3/k2 (for fixed k2) depends on the relative magnitude of the first term, which rises monotonically, and the second term, which falls monotonically with k3/k2 when k2 has a fixed magnitude. The second term has important consequences for the ratio between two regions when the region of interest has both a higher partition volume and significant binding. The second term includes a term for the rapidly equilibrating but nonspecific binding in the region of interest (ρ) and a term that depends on the dynamics of the binding process, [k2/(k2 + k3)]2. In the absence of binding (k3 = 0), ρ prevails and forces the ratio to assume a high value. In the presence of binding, the value of [k2/(k2 + k3)]2 causes the second term to decline because less tracer is kept in the precursor pool in the presence of binding. The effect of ρ, equal to the k5/k6 ratio of the additional binding compartment (Mr) assumed to be in rapid equilibrium with the free tracer pool, is to magnify the total amount of tracer that is not bound to the receptors of interest (equal to the sum of free and nonspecifically bound tracer) by the factor 1 + ρ, which is itself equal to fref2/fROI2, the ratio between the free fraction in the reference region (fref2) and the free fraction in the region of interest (fROI2). Thus, at low k3 values, the amount of tracer that can pass into the bound compartment is relatively small, and most of the tracer passes back into the plasma compartment upon the onset of transient equilibrium, when k2 ≫ k3. This causes the R45 value (sum of nonbound and bound pools divided by the cerebellar nonbound pool) to decline initially, as seen in Fig. 3. For each value of ρ, a minimum of R45 is achieved at different k3/k2 values. This minimum value of R45 occurs when the decline of tracer in the nonbound pool no longer exceeds the transfer of tracer to the binding pool, and k3/k2 rises, that is, when k3 eventually becomes so high that the quantity bound overcomes the decline of tracer in the nonbound pools. Thereafter, R45 rises monotonically with increasing k3/k2. The balance between the two processes, and hence the point of minimum R45, depends on the relative magnitudes of ρ and k3. A minimum occurs at
For the special case of small ρ and specific values of k2 in the binding region of interest (e.g., caudate), R45 rises monotonically for all values of k3. An example is shown in Fig. 3, where ρ ≤ 1 and k2 = 0.05. In general, no minimum occurs when 2(1 + ρ) ≤ k2 Θ. R45 would then be monotonically increasing for all nonzero k3. Without a considerable number of binding sites in Mr, the magnification of the nonbound pool does not occur to the same degree, and the reduction of tracer in the precursor pool is countered by the tracer in the binding compartment. Hence, no actual fall in R45 occurs.