
Abstract

To the Editor:
The paper recently published in this journal (Shoaf et al., 2000), in relation to the use of α-methyl-L-tryptophan (α-MTrp) as a tracer for the imaging of brain serotonin synthesis through trapping of labeled α-MTrp, concludes that this tracer images ONLY the blood–brain barrier (BBB) transport of tryptophan (Trp). This conclusion is not supported by the data presented in that article, or by the published data (Diksic et al., 1990,1991,1995; Chugani et al., 1998, 1999; Muzik et al., 1997; Mück-Šeler et al., 1996; Mück-Šeler and Diksic, 1995,1996, 1997; Nishizawa et al., 1998, 1999; Okazawa et al., 1999; Chugani and Muzik, 2000). It should be noted that the authors state in their article (Shoaf et al., 2000, p. 250) that with an addition to the model equation of k3* [min−1] for the irreversible trapping, a significantly better fit was obtained. To me this would suggest that there is an irreversible trapping of the tracer. It is not clear what was then the basis for the conclusion that this tracer images ONLY the BBB transport of Trp. According to my understanding of the modeling, a significantly better model is the one which better reproduces the data. To confirm the statement that the conclusion is not based on presented data, one needs only to examine more closely the curves presented in Fig. 3 of Shoaf et al. (2000). To assess if the 2-or 3-compartment models fit the data better, we have digitized the curves presented in that graph and fitted them to the integral equations representing the 2-and 3-compartment models (Eqs. 1 and 2); there is no need to make an assumption on a linear portion of the curve. The equation for the 3-compartment model is (Nishizawa et al., 1998):
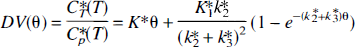
Here DV (mL/g) represents the distribution volume of the tracer at different times after the tracer injection. K1*, k2*, and k3* are rate constants for the transfer of the tracer from the plasma to the brain, from the brain to the plasma, and from the brain precursor pool to an irreversible pool, respectively. Note that there is no need for the irreversible and metabolic compartments to be same. The θ (min) is the plasma tracer integral divided by the Cp*(T) (the plasma activity of the tracer at the time T) [θ = |ir0TCp*(t)dt/ Cp*(T) [min], where Cp*(t) [nCi/mL] is the plasma time-activity curve. The equation for the two 2-compartment models, representing only the transport between the plasma and the brain in the θ-space is:
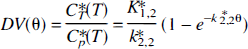
Here K1,2* and k2,2* are constants (2-compartment model) for the transfer of the tracer from the plasma to the brain and from the brain to the plasma, respectively. The least squares fit to the 2-and 3-compartment models (Eqs. 1 and 2) were obtained from the data read from the graphs (Fig. 3 in Shoaf et al., 2000), in 20-minute increments on the x-axis (Theta = θ; minutes). The residues were analyzed by an F-statistics comparison program available in SigmaStat (Jandel Scientific). For all of the curves, a 3-compartment model gave a significantly better fit [F(1,18) > 50;P < 10−5]. Note that the data points read from their graph possibly underestimate the residuals for the 3-compartment model, as it seems that Shoaf et al. (2000), in Fig. 3, are showing curves obtained from a 3-compartment fit. However, a relative comparison of the two model structures should be valid. This is also supported by their own statement on page 250, but is contrary to the conclusion of the paper. It should also be noted that the curves presented in Fig. 3 of Shoaf et al. (2000) indicate the volumes of distribution up to 1.4 mL/g, which would suggest that, if α-[11C]MTrp images only the BBB transport of Trp, the brain is accumulating these amino acids. This is not in accordance with all of the data published until now on the BBB transport of amino acids.
To further support our conclusion that a 3-compartment model fits the data obtained from the brain uptake/trapping of α-[11C]MTrp significantly better than the 2-compartment model, we are presenting here a graph (of which we have many) with the data from our own PET measurements in humans with α-[11C]MTrp (Fig. 1). The PET scans were acquired 90 minutes after the tracer injection and the images were reconstructed with a final resolution of approximately 10 mm. Even a visual examination suggests that a 3-compartment model gives a better fit to the experimental data. This is also confirmed by a statistical evaluation of the residuals from two fits. On the basis of F-statistics, a 3-compartment model is significantly better [F(1,22) = 110;P < 10−6] than a 2-compartment model. A similar conclusion, though not as statistically significant as those shown here, was previously reported by Muzik et al. (1997) and Chugani and Muzik, (2000). In addition, in the rat experiments, we have followed a tracer for up to 6 hours after injection. The fits of the 2-and 3-compartment models to the experimental points obtained in the parietal cortex of 33 rats are exemplified in Fig. 2. The fit of the 3-compartment model was significantly better [F(1,31) = 9.9;P < 0.05]. We have also previously reported (Diksic et al., 1995) a linear increase in the DV up to 6 hours after the tracer injection (θ approximately 900 minutes).
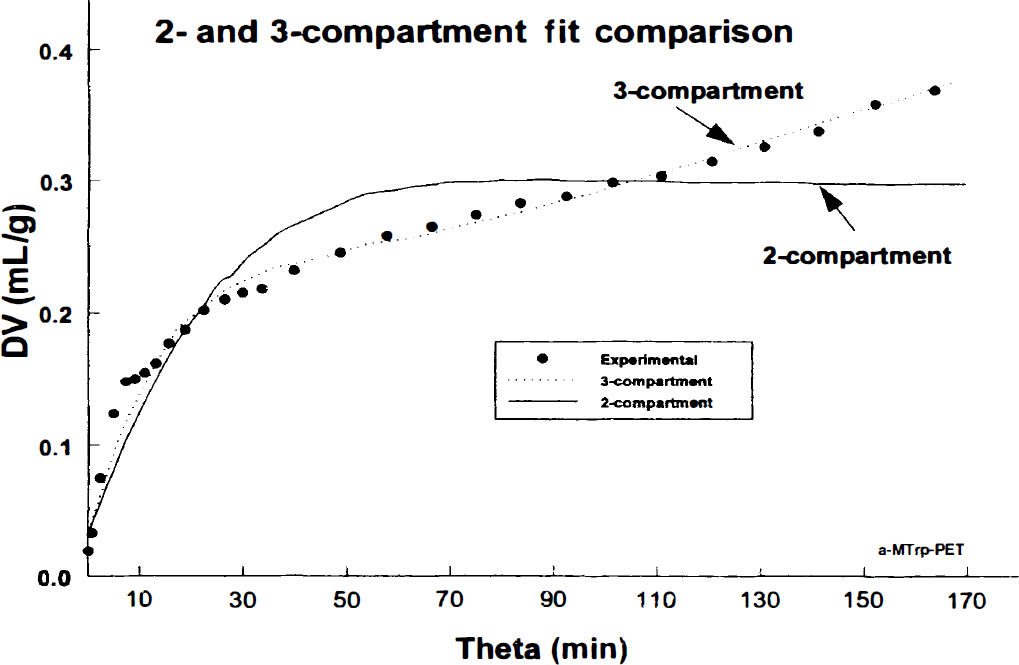
Two sets of data exemplifying the 2-and 3-compartment fit to the data (filled circles represent experimental points) obtained in the frontal cortex of 2 patients scanned for 90 minutes after the injection of approximately 12 mCi of α-[11C]MTrp. In the graph, the brain distribution volume (DV [mL/g]; calculated as the tissue radioactivity divided with plasma at different times) is provided as a function of the exposure time “Theta” (minutes; Theta = plasma integral divided by plasma at particular times). The fitting was done with the SAAM II program (SAAM Institute, University of Washington, Seattle, WA, U.S.A.). The 2-compartment model is based on an assumption that the tracer images ONLY the BBB transport of Trp, whereas the 3-compartment model assumes that there is a trapping of the tracer in the brain. In our opinion, there should not be much discussion about which model fits the experimental data better; the 3-compartment model is an excellent fit. The 3-compartment fit was significantly better in both subjects than the 2-compartment (F = 110 (1,25); p[F(1,25)] < 10−6). Again, this trapping does not imply a metabolic conversion of α-[11C]MTrp.
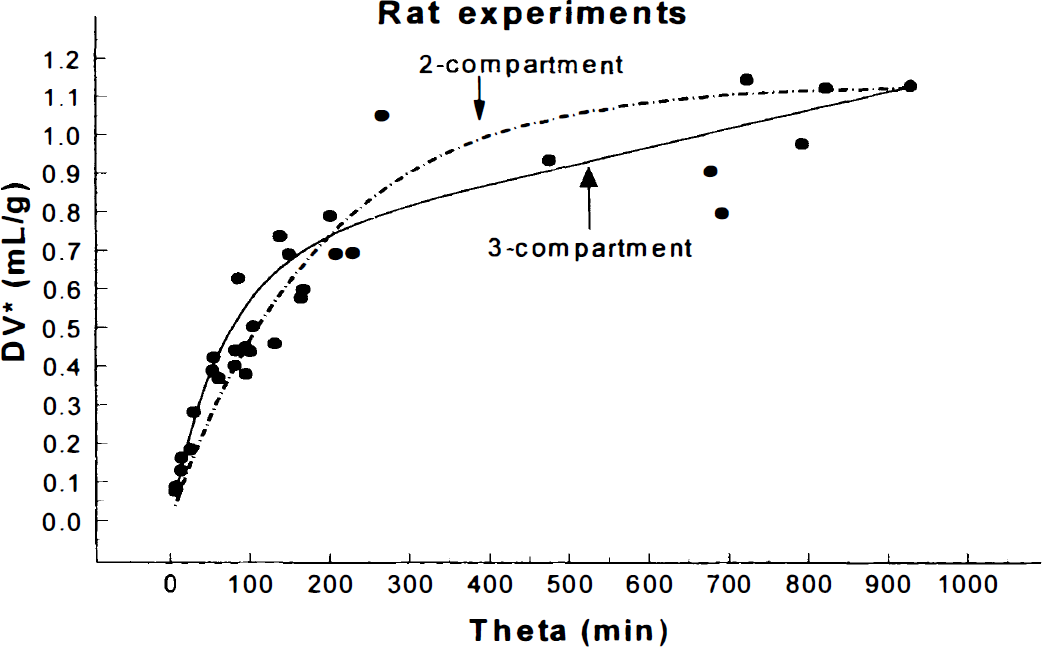
Comparison of 2- (dashed curve) and 3-compartment (solid curve) fit of the data obtained in 32 rats killed between 5 minutes and 6 hours after the injection of approximately 30 μCi of α-[14C]methyl-L-tryptophan (α-[14C]MTrp). The 2-compartment model implies that the tracer is exchanging only between the brain and plasma while in a 3-compartment model an irreversible compartment in which the tracer gets trapped is assumed. It is obvious from a visual inspection of the fit obtained with the 3-compartment model that it is much better. A statistical evaluation of residues indicate that the 3-compartment model gives a significantly (F(1,30) = 9.9;P < 0.05) better fit to the experimental data than a 2-compartment model. This suggests that an irreversible trapping of α-[14C]MTrp) has indeed occurred, and that it is unlikely that this tracer images only the blood to brain transport of tryptophan. It should also be noted that from a 2-compartment fit a steady-state distribution volume would be greater than 1, the value which one would not be able to explain easily; it would mean that the tracer is actively transported into the brain.
In a separate set of experiments (not published), we have measured the permeability surface area products (PS; mL/g/min) in 20 second experiments for Trp (PST) and α-MTrp (PS(). We have compared these with the tissue unidirectional uptake constant (K; mL/g/min) for the two compounds (in the case of Trp, only the fraction metabolized via the 5-HT metabolic pathway was used in the comparison; KT5HT). The constant for the incorporation of Trp into proteins was also measured. These experiments showed a very significant correlation (P < 0.05; Pearson Product Moment correlation) between the PST and PSα, but neither of these is correlated with K-s, for either Trp metabolism via the 5-HT pathway (KT5HT) or the brain trapping of α-MTrp (Kα). There is no significant correlation (P > 0.05) between any of these constants and the constant for the incorporation of Trp into proteins. However, there is a highly significant correlation between KT5HT and Kα. These experiments suggest that α-MTrp is taken up and trapped in the brain by a process which correlates with the conversion of Trp to 5-HT, but not with the BBB transport of Trp or Trp incorporation into proteins. These correlations suggest that the statements made by Shoaf et al. (2000), regarding the imaging of the BBB transport, and Gharib et al. (1999), regarding the imaging of the Trp pool for incorporation into proteins, are not correct.
These examples suggest that this tracer is taken up and trapped in the brain tissue, which by no means implies that the tracer is metabolically converted into a metabolite during the process of trapping. Note that in our original paper we stated that k3* (min−1) “…does not need to represent a rate of α-MTrp hydroxylation…” (Diksic et al., 1990,1991). The data reported by us on the effect of different drugs known to influence the brain serotonergic system and, in some cases, known to influence brain serotonin synthesis in the same direction as the trapping, suggests that this tracer is likely taken up by the brain proportionally to brain serotonin synthesis (Nagahiro et al., 1990; Mück-Šeler et al., 1996; Mück-Šeler and Diksic, 1995,1996; Okazawa et al., 1999; Nishizawa et al., 1999; Yamane et al., 1999). Note that in some experiments, the trapping of the tracer was reduced in the cell bodies and increased in the terminals (Mück-Šeler et al., 1996). It would be very unlikely that the drugs known to act on the brain serotonergic system (for example, busperone, fluoxetine, fenfluramine, reserpine) would insert their actions through a control, and in some cases a differential control (different in the cell bodies and terminals), of the BBB transport of Trp. This would also suggest that the trapping is probably not cupeled with a conversion of labeled α-MTrp to a metabolite, which would be in agreement with our proposal on the use of this tracer. If these drugs would act by controlling the influx of Trp through the BBB, it would be a revolutionary discovery, which has not yet been proposed.
It should be noted that the experiments reported by Shoaf et al. (2000) were done under deep anesthesia. The type and the level of anesthesia, in addition to the fact that they were done in different species, might be, in part, responsible for why they found less than 1% of the α-[14C]MTrp metabolite in the region identified as the dorsal raphe, whereas Diksic et al. (1990) and Gharib et al. (1999) reported changes of approximately 40% in the rat dorsal raphe 3 hours after the tracer injection. The small metabolic conversion of labeled α-MTrp to α-methylserotonin (α-M5HT) has never been defined as a requirement for the α-MTrp model to be valid. A small conversion is most likely related to the fact that the concentration of the compound with a lower affinity for TPH (α-MTrp) is approximately one thousand times less than that of the competitor (Trp) with a higher affinity for TPH. This argument can also be illustrated, in the first approximation, by a situation in which two ligands are binding to the same receptor sites where the one having a thousand times lower concentration also has a lower affinity for the receptor. Additional points on this topic were discussed by us previously in a letter to the Editor (Diksic et al., 1999). Since, from the modeling point of view, the use of α-MTrp as a tracer does not need a metabolic change, it seems to us that imaging of the brain trapping of labeled α-MTrp and our interpretation of its relation to 5-HT synthesis is appropriate, at least in the first approximation. The conversion of the α-MTrp trapping constant via division with the lumped constant has been previously discussed by us (Vanier et al., 1995; Diksic et al., 1999). It is worth noting that Chugani and Muzik (2000) in their recent review also argue that brain trapping of α-MTrp represents an “index of 5-HT synthesis”, while we propose the method by which one can convert the index of 5-HT synthesis to 5-HT synthesis rates. Indeed, a full resolution of the biological meaning and/or significance of this trapping certainly requires additional experiments.