
Abstract
An unexpected decrease of extracellular space (ECS) tortuosity was recently reported in thick (1000 μm) ischemic slices using radiotracers. The current study shows that the tortuosity in thick slices from rat neocortex can increase or decrease depending on experimental conditions, whereas ECS volume fraction remains diminished to approximately 10%. Using diffusion of tetramethylammonium, it was found that tortuosity rose from a normoxic value of 1.66 to 1.99 in thick slices. However, tortuosity dropped to 1.54 when dextran (70,000 molecular weight) was added to the bathing medium. The current results show that dextran enhances diffusion in thick ischemic slices without increasing the size of the ECS.
Ischemic insult triggers a cascade of ionic and metabolic events leading to activation of multiple signal transduction pathways and results ultimately in severe neuronal dysfunction and cell death (Dirnagl et al., 1999). Many of these dramatic changes occur in the extracellular space (ECS), which shrinks and impedes diffusion of ions and molecules as a response to ischemic insult. Diffusion of substances through the ECS is affected by the volume available for movement of molecules, the hindrance imposed by cellular elements, and, possibly, the extracellular matrix. Available volume, measured as volume fraction, α, is equal to the proportion of the total tissue occupied by the ECS. The overall effect of diffusion barriers in the ECS is measured as the tortuosity, λ (Nicholson and Phillips, 1981). Some diffusing molecules are lost from the ECS; this process is characterized by an uptake parameter, k′ (s−1) (Nicholson and Phillips, 1981; Nicholson, 1992).
The three ECS parameters—α, λ, and k′—are known to be severely altered in in vitro models of ischemia and during anoxia in vivo (Nicholson and Syková, 1998). The general trend in these pathologies is that λ increases while α decreases. Unexpectedly, Patlak et al. (1998) reported a quite unusual finding in thick slices (1000 μm) that model the ischemic penumbra (Newman et al., 1988). Using several radiotracers, Patlak et al. (1998) found that in thick slices λ decreased lower than values in normal, nonischemic brain slices. This paradoxical discovery prompted us to examine the diffusion properties of the ECS in thick slices with the TMA+ (tetramethylammonium) method. This method measures α, λ, and k′ in a completely different way from that used by Patlak et al. (1998), and therefore provides an independent test of the former study with radiotracers.
In contrast to Patlak et al., (1998), we found that λ increased while α and k′ decreased in thick slices compared with normoxic 400 μm slices, which was also seen when slices were made anoxic (Pérez-Pinzón et al., 1995). We noted, however, that Patlak et al. (1998) had added 70 kDa dextran to the medium bathing their slices. When dextran was added to the slice bath, λ did indeed decrease, whereas α did not increase, thus confirming the paradoxical finding of Patlak et al. (1998) and providing new insight into the origin of the effect.
MATERIALS AND METHODS
Rat brain slices
Brain slices were prepared from adult Sprague–Dawley female rats (200 to 250 g) anesthetized with sodium pentobarbital (65 mg kg−1, IP). After removal, the brain was cooled with ice-cold artificial cerebrospinal fluid (ACSF). Coronal sections 1000-and 400-μm-thick were cut using a vibrating blade microtome (VT 1000 S; Leica Instrument GmbH, Nuβloch, Germany) and incubated at room temperature in ACSF using the following composition: 115 mmol/L−1 NaCl, 5 mmol/L−1 KCl, 35 mmol/L−1 NaHCO3, 1.25 mmol/L−1 NaH2PO4, 10 mmol/L−1 D-glucose, 1.3 mmol/L−1 MgCl2, and 1.5 mmol/L−1 CaCl2, with an osmolality of 301 mOsm. The ACSF was gassed with 95% O2:5% CO2 to buffer pH at 7.4. Tetramethylammonium chloride (0.5 mmol/L−1) was added to the ACSF to provide a calibration standard for diffusion measurements. In some experiments 70 kDa dextran at 3.1% (w/v) was added to the ACSF (#D1390; Sigma, St. Louis, MO, U.S.A.; average molecular weight of several lots was 69 to 77 kDa). The recordings were made in a submersion tissue chamber (model RC-27L; Warner Instrument, Hamden, CT, U.S.A.) perfused with ACSF at a flow rate of 2.0 mL min−1. Temperature was maintained at 34°C ± 1°C.
Ion selective microelectrodes and iontophoretic microelectrodes
Ion selective microelectrodes (ISMs) for measuring TMA+ were prepared from double-barreled theta glass (Nicholson, 1993). The ion-detecting barrel contained Corning exchanger 477317 (currently available as IE 190 from WPI, Sarasota, FL, U.S.A.) and was backfilled with 150 mmol/L−1 TMA+, whereas the reference barrel was filled with 150 mmol/L−1 NaCl. The slope and the interference of each ISM were obtained from calibration values fitted with the Nikolsky equation (Nicholson, 1993). Extracellular K+ concentrations of up to 60 mmol/L−1 typically occur in the ECS of ischemic tissue (Hansen, 1977), but this concentration had no effect on the slope or the interference of the TMA+-ISM. Iontophoretic micropipettes were also fabricated from theta-glass and filled with 150 mmol/L−1 TMA+. During measurements, the iontophoretic micropipettes had a positive 20 nA bias current continually applied to keep the transport number constant (Nicholson and Phillips, 1981). To make the diffusion measurements, a positive current pulse of 60 to 120 nA, lasting 50 seconds, was applied from a constant-current, high-impedance source.
Diffusion of TMA+
Each ISM and iontophoretic micropipette was held in a separate micromanipulator (MP-285; Sutter Instrument, Novato, CA, U.S.A.) at an angle of 31° from the surface of the agar gel or brain slice (the horizontal plane). The tips of the micropipettes were first positioned touching each other on the surface. From this starting point, defined as zero, the microelectrodes were moved apart horizontally then each was advanced a predetermined amount along its axis so as to bring the tips of the electrode to the center of the preparation (that is, 500-and 200-μm-deep for 1000 and 400 μm slices, respectively) with a final horizontal distance between the tips of approximately 100 μm.
Diffusion curves were recorded in dilute agar gel (Agar Noble, Difco, Detroit, MI, U.S.A.; 0.3% in 150 mmol/L−1 NaCl) or in cortex and were acquired using a high impedance, low leakage current, buffer amplifier and low-pass active filters connected to an A/D converter. After acquisition, an appropriate solution to the diffusion equation (Nicholson, 1993) was fitted to the data. From the agar diffusion curves, the fitting procedure extracted the transport number, n, of the iontophoretic micropipette and free diffusion coefficient, D (cm2s−1), whereas the apparent diffusion coefficient, D* (cm2s−1), volume fraction, α, and nonspecific uptake, k′ (s−1), were obtained from brain data. The tortuosity, λ, was then calculated as (D/D *)0.5.
Effect of dextran on calculations of D and λ
To determine whether dextran was likely to be in the center of the slices after typical incubation times, an appropriate diffusion equation (equation 4.17; Crank, 1975) was used. Based on λ = 2.25 reported for 70 kDa dextran in normoxic cortical slice, and Ddex = 3.8 × 10⁻⁷ cm2s−1 in dilute agarose (Nicholson and Tao, 1993), it was estimated that the dextran concentration in the center of a 400-μm slice would reach 95% of bath concentration within two hours. To evaluate any possible effect of dextran on the free diffusion coefficient of TMA+, D was measured in agar containing 3.1% 70 kDa dextran. At 34°C, D was decreased by the presence of the dextran from 1.24 × 10⁻⁵ cm2s−1 to 1.13 × 10⁻⁵ cm2s−1 (D1). For tortuosity computation, D1 was used (that is, λ =D1/ D*)0.5) in those instances where 400-μm-thick slices were incubated with dextran in the bath for at least two hours.
In ischemic tissue, the value of λ for use with 70 kDa dextran is not known, but it is probably greater than 2.25; therefore, for 1000-μm slices we chose λ = 3.125. Using this larger tortuosity, it was calculated that approximately 30% of the bath dextran concentration would have reached in the center of the slice after four hours. However, because the actual concentration of dextran in the thick slices is uncertain, D rather than D1 was used for tortuosity calculations. This conservative approach probably underestimates the decrease in tortuosity measured with TMA+ in thick slices in the presence of dextran.
Statistical analysis
One-way analysis of variance (ANOVA; SigmaStat, SPSS, San Rafael, CA, U.S.A.) was performed followed by pair-wise multiple comparisons between groups using Tukey test and Dunn's method for parametric and nonparametric ANOVA, respectively. Significance was accepted when P ≤ 0.001 for ANOVA and P < 0.05 for multiple comparisons. The effect of dextran on tortuosity of 400-μm and 1000-μm slices in time-course experiments was compared using the t-test.
RESULTS
Diffusion parameters in normal and thick slices
A typical diffusion curve in a normoxic 400-μm slice is shown in Fig. 1A. The analysis of such curves provided the data for the quantile plots shown in Fig. 2, which display the entire population of results. From these data the authors found that λ = 1.66 ± 0.05 (mean ± SD, n = 10), α = 0.25 ± 0.01, and uptake k′ was 0.012 ± 0.003 s−1. These results were consistent with several other studies on in vitro and in vivo preparations (Nicholson and Syková, 1998).
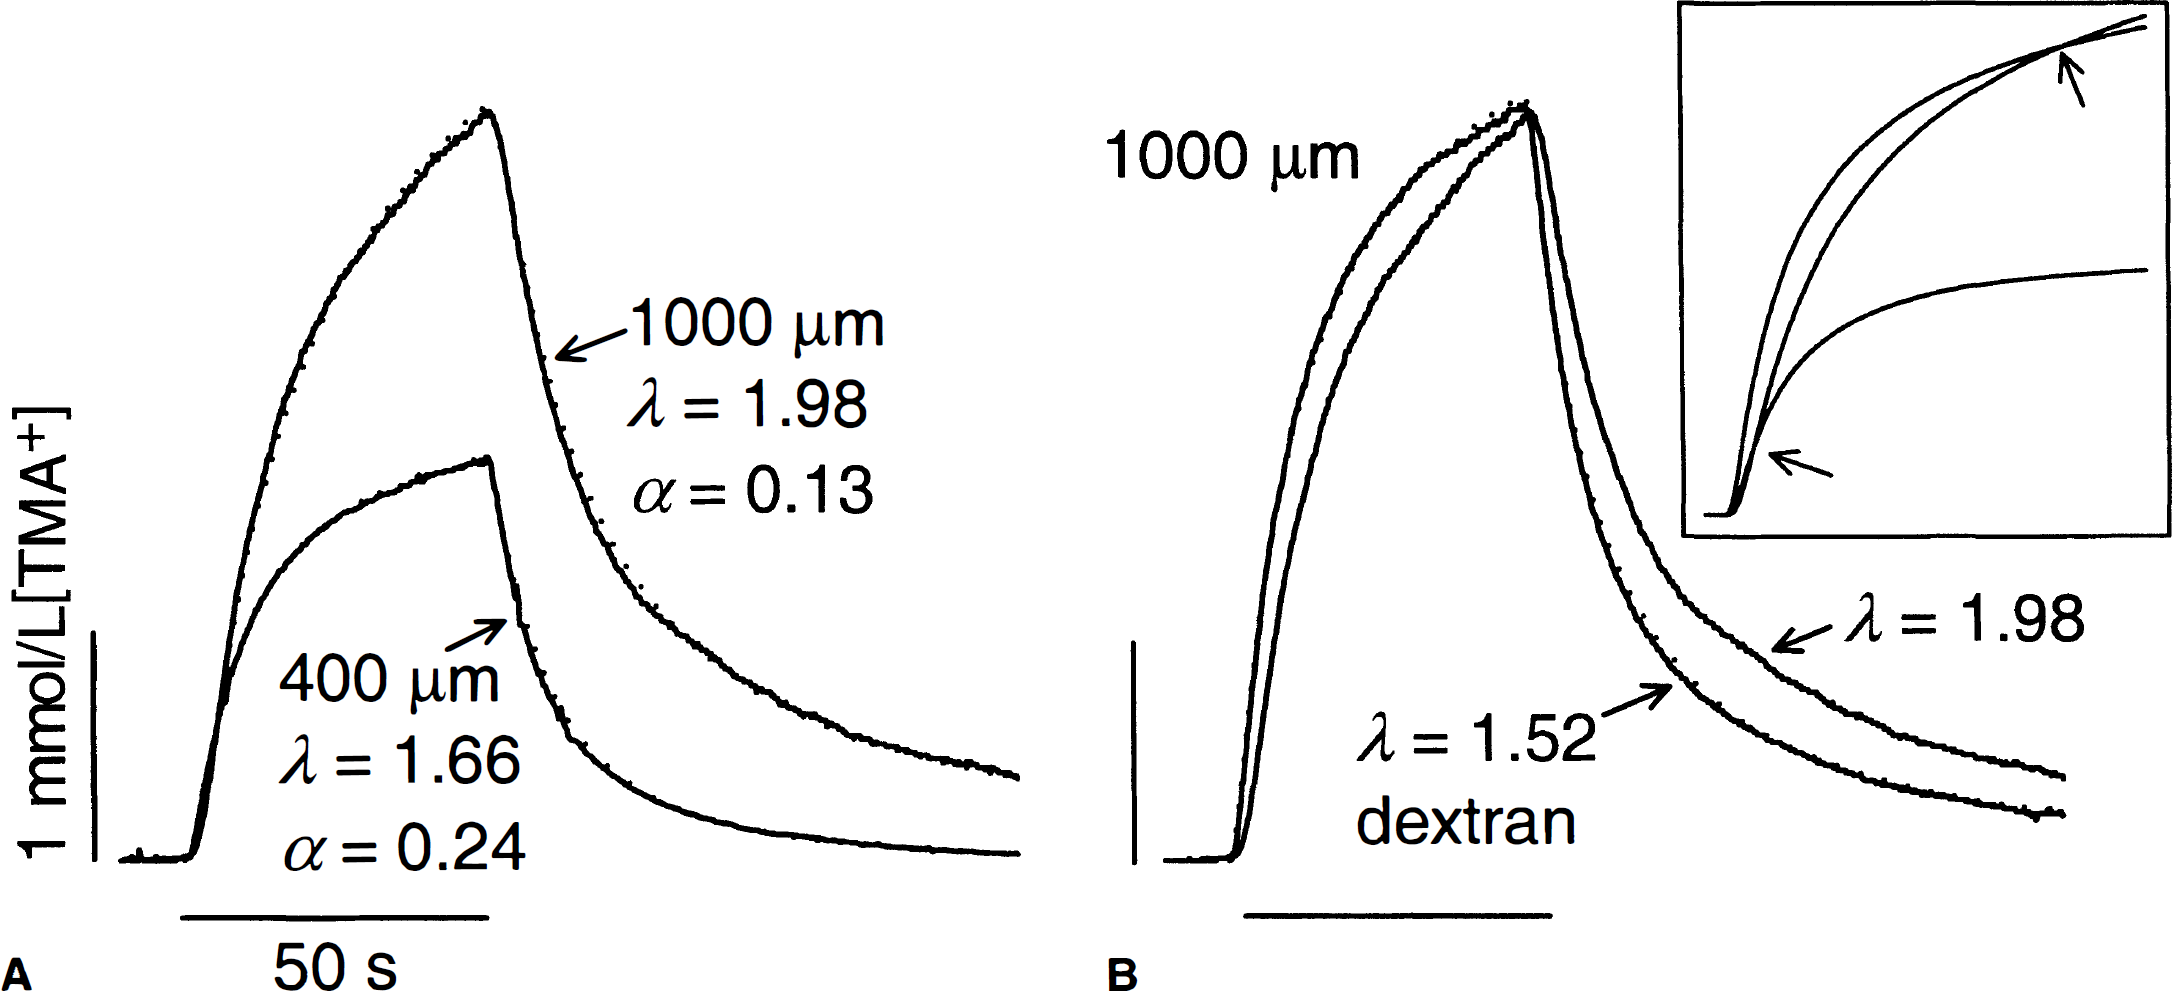
Tetramethylammonium (TMA+) diffusion curves in brain. TMA+ pulse (+80 or +120 nA) was applied from 10 to 60 seconds (horizontal bar) and the concentration of TMA+ was detected with an ion selective microelectrode (ISM) 100 μm away. Diffusion curves (solid line) are superimposed with appropriate theoretical curves (dotted line).
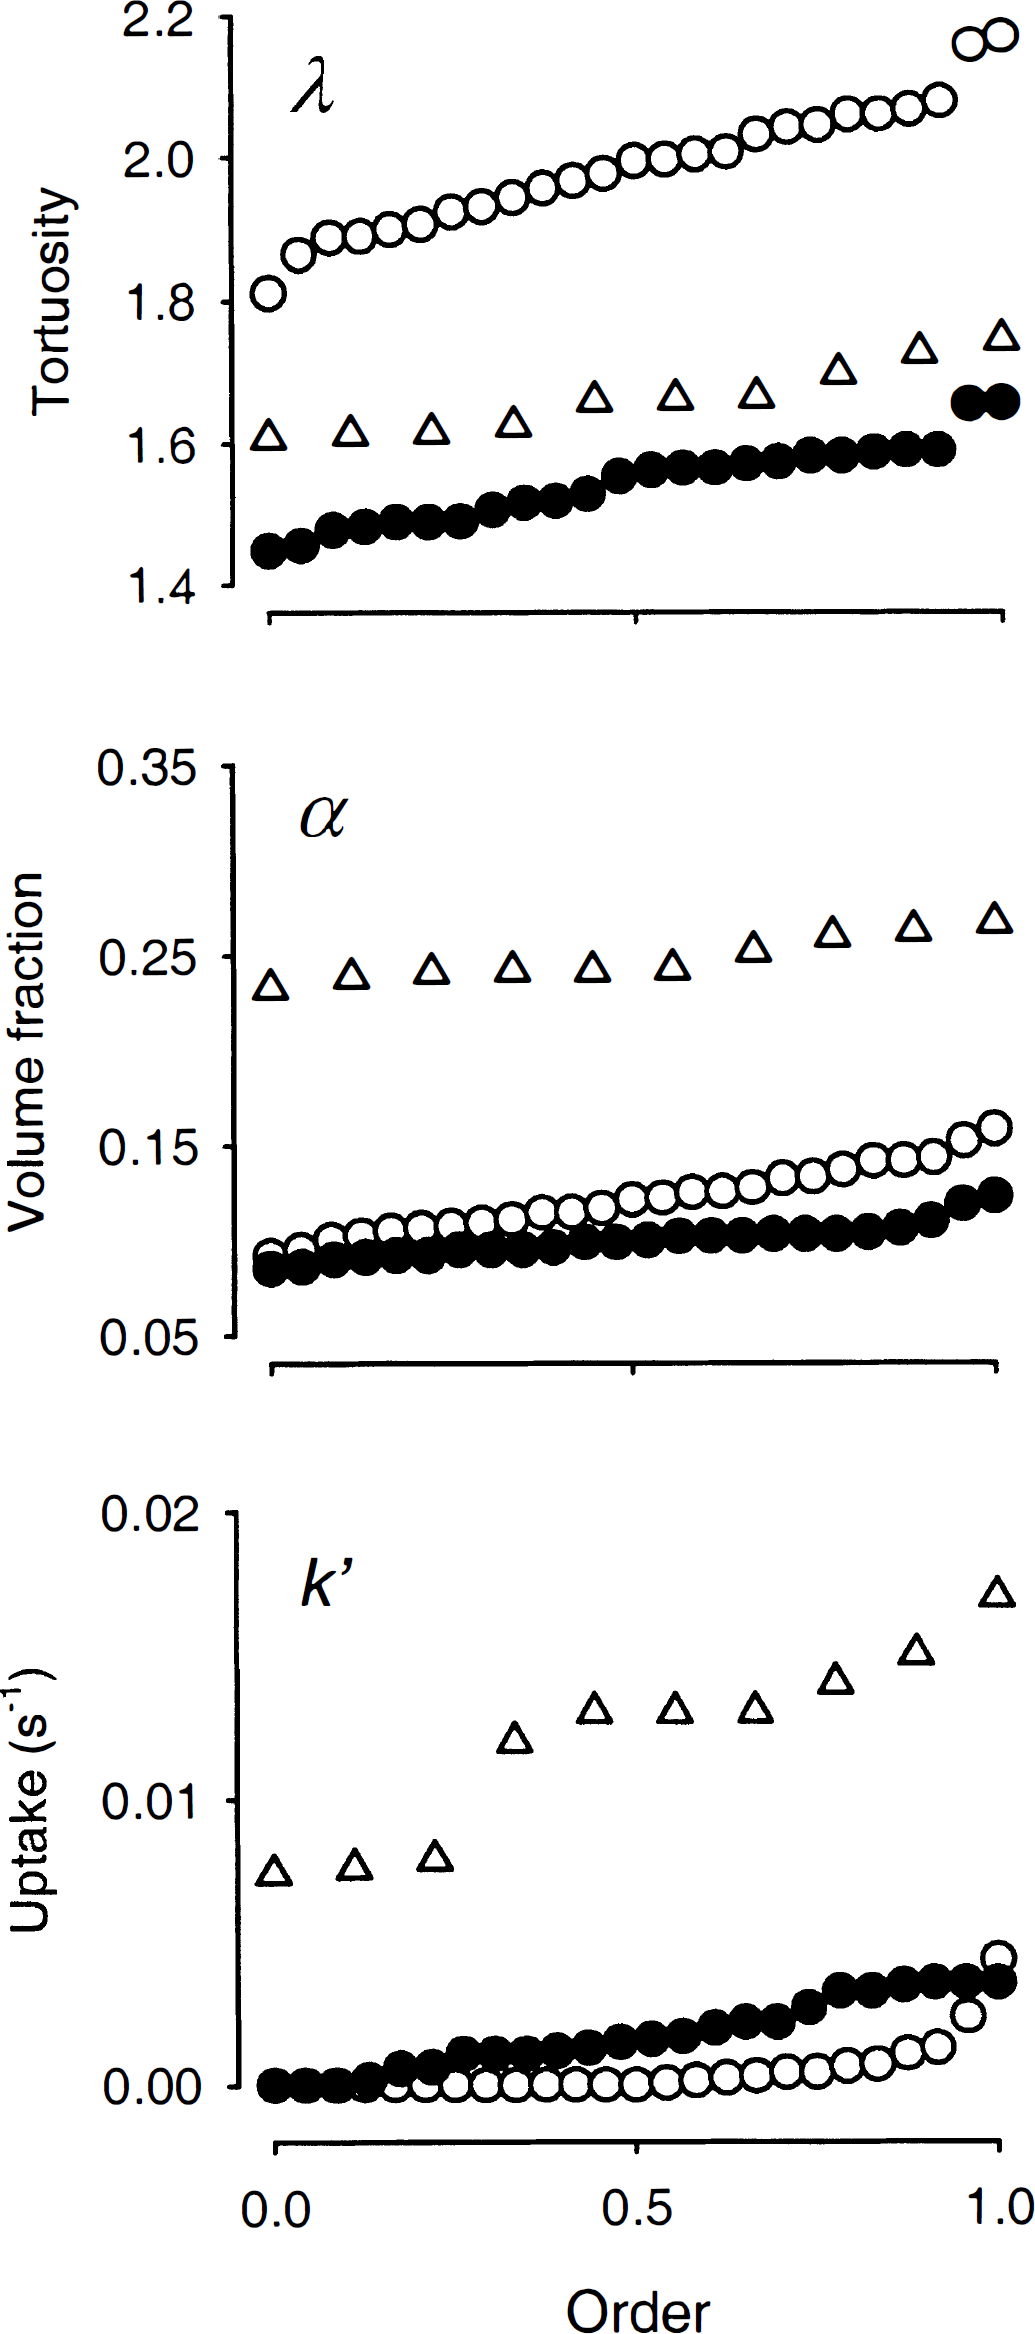
Quantile plots of λ
Diffusion measurements on 1000-μm slices revealed that, for a given iontophoresis current, the curves were always much greater in amplitude (Fig. 1A) than were curves generated in 400-μm slices. From such curves the authors determined λ= 1.99 ± 0.09 (n = 25), α = 0.12 ± 0.02, and k′ = 0.0005 ± 0.001 s−1 (Fig. 2). These values were similar to those recorded after terminal anoxia in the anesthetized rat (Syková et al., 1994). However, the current result disagreed with the findings of Patlak et al. (1998). Using several different radiotracers in thick slices of hippocampus, those investigators measured a tortuosity that was even smaller than the value seen in 400-μm normoxic slices. The current study was unable to reproduce the value of λ measured by Patlak et al. (1998) in thick slices until it was realized that Patlak and coworkers had routinely included 70 kDa dextran in their ACSF.
Effect of dextran on diffusion in thick slices
Fresh-cut thick slices were incubated in ACSF containing 70 kDa dextran. The same concentration of dextran was included in the ACSF that subsequently bathed the slices in the recording chamber. Diffusion curves then differed in shape from those measured in ACSF without dextran (Fig. 1B), and tortuosity was decreased to λ = 1.54 ± 0.06 (n = 24; Fig. 2). In contrast, volume fraction further significantly diminished to α = 0.10 ± 0.01 when dextran was present (Figs. 1 and 2). Uptake, measured as k′ = 0.0017 ± 0.0012 s−1, was larger than in thick slices lacking dextran (Figs. 1 and 2).
Dextran had no effect on tortuosity in normoxic slices where λ = 1.62 ± 0.05 (n = 12, not significantly different from 400-μm slices without dextran based on t-test), α = 0.21 ± 0.03, and k′ = 0.0089 ± 0.0056 s−1.
These results raised the issue of whether dextran could be effective in reversing the high tortuosity values seen in thick slices kept in dextran-free ACSF. To address this question, control measurements were obtained in slices incubated for at least two hours after the dissection and then dextran was added to the bath. In control slices bathed in dextran-free ACSF, λ = 1.90 ± 0.04 and α = 0.131 ± 0.017 (n = 7); these values remained stable through the first hour of incubation in dextran (Fig. 3). During the second hour of dextran exposure, tortuosity decreased to 1.76 (n = 2) and further declined to a plateau of λ = 1.53 ± 0.03 (n = 7, significantly different from controls, P ≤ 0.001, t-test) measured between 4 and 6 hours (Fig. 3). Volume fraction decreased to α = 0.117 ± 0.002 after 4 hours of dextran incubation. A nonlinear regression using a four-parameter Hill plot (Fig. 3) suggested an asymptotic value of 1.5 for λ.
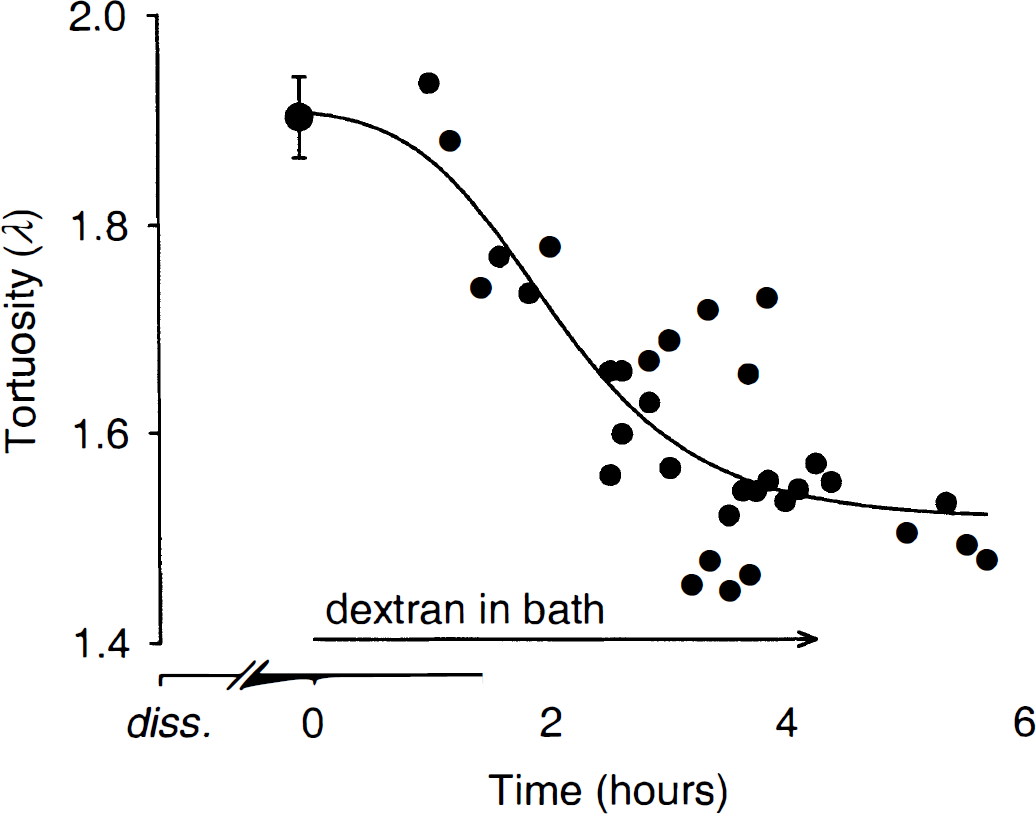
Time course of dextran effect on tortuosity in 1000-μm slices. All slices were kept in dextran-free ACSF for at least 2 hours after brain dissection (diss.) and slicing. A large symbol at time point 0 hours (mean ± SD, n = 7) represents control measurements before 70 kDa dextran application. Small symbols correspond to one record each obtained after the exposure to dextran. The curve represents the fit obtained with a Hill nonlinear regression λ = λ0 +atb/(cb +tb), where λ0 = 1.91;a = −0.41;b = 3.18; and c = 2.07. The asymptotic value of λ for large t is 1.5.
DISCUSSION
The thick slice model was introduced by Newman and coworkers (1988) as a new and more accessible model of the ischemic penumbra. This model has been extensively characterized biochemically but little was known about the diffusion properties until the study of Patlak et al. (1998) revealed the paradoxical findings that prompted the current work.
Our initial experiments using the TMA+ method in thick slices showed that tortuosity increased and volume fraction decreased, exactly as seen in many other studies using in vitro and in vivo ischemia in cortex, hippocampus, and spinal cord (Pérez-Pinzón et al., 1995; Lundbæ ck and Hansen, 1992; Syková et al., 1994). In fact, the large increase of tortuosity measured in thick slices very closely mimics the change observed during ischemia in vivo, confirming that thick slices are a useful in vitro model for ischemia.
Thus, the initial findings in the current study disagreed with the results obtained from thick slices using the radiotracer technique by Patlak et al. (1998). In those studies, the tortuosity measured with 14C-3-O-methylglucose (14C-3OMG) and 45Ca2+ decreased from 1.53 and 1.52, respectively, measured in normoxic 400-μm slices, to 1.15 and 1.21, respectively, in 1000-μm slices. Surprisingly, the same result was observed with the larger molecule, 14C-polyethylene glycol (14C-PEG, Mr 3,300). As seen for other macromolecules (Nicholson and Tao, 1993; Tao and Nicholson, 1996), Patlak et al. (1998) observed that the diffusion of 14C-PEG was slightly hindered in normoxic slices where λ = 1.88, but this value still dropped to 1.18 in thick slices. Patlak et al. (1998) concluded that ECS became less tortuous in 1000-μm slices.
Because the findings of Patlak et al. (1998) could not be replicated initially with the TMA+ method, the experimental design of the original experiments was examined more closely. It seemed unlikely that differences in the radiotracer and TMA+ techniques caused the discrepancy. Both methods have been used in numerous studies and arrived at similar values in normoxic and ischemic tissue (Fenstermacher and Kaye, 1988; Nicholson and Syková, 1998). A comparison of experimental protocols did reveal, however, that Patlak at el. (1998) included 70 kDa dextran in their preparation and incubation buffers. In preparing slices, decapitation and dissection inevitably produce ischemia and trauma. These insults are accompanied by cellular water gain that can be reduced by dextran and other high molecular weight compounds (Pappius and Elliot, 1956; Banay-Schwartz et al., 1974; Newman et al., 1995). For this reason, Patlak et al. (1998) routinely included 70 kDa dextran in their slice media.
We found that when 70 kDa dextran was included in their ACSF, λ did indeed fall to 1.54 in 1000-μm slices from its value without dextran, which was 1.99. Uptake (that is, k′) was also significantly larger with dextran, possibly reflecting increased loss of TMA+ in the superfusing ACSF because of decreased hindrance of the tissue.
It remained possible that the presence of dextran in the bath from the time of dissection may have prevented the tortuosity increase by mitigating structural changes caused by the initial ischemia and trauma of slicing. To test this possibility, thick slices were incubated in normal ACSF for varying periods before applying dextran. An identical decrease in tortuosity was observed when dextran was introduced to thick slices after a delay of at least two hours from the dissection. It took up to 4 hours for the drop in tortuosity (from 1.90 to 1.53) to occur, which was consistent with the idea that dextran had to diffuse into the slice. As mentioned in the Methods section, we had estimated that the concentration of 70 kDa dextran in the center of a thick slice might reach approximately 30% of bath concentration after 4 hours incubation. This was consistent with the need for prolonged incubation in dextran to decrease the tortuosity. Alternative mechanisms, not requiring the physical presence of dextran in the center of the slice, would probably allow the changes to develop much sooner. Therefore, we concluded that the effect of dextran on tortuosity was not related to the initial conditions of the slice.
It is commonly thought that a decrease in α accompanies, and possibly causes, an increase in λ during ischemia. However, the current data show that λ and α can change independently in ischemic tissue because λ dropped from 1.99 to 1.54, whereas α decreased from 0.12 to 0.10 when dextran was added to the bath. Other recent studies have shown the independent behavior of λ and α during X-irradiation (Syková et al., 1996) and osmotic stress (Križaj et al., 1996; Nicholson et al., 1998; Chen and Nicholson, 2000).
The mechanism responsible for reduction of tortuosity in thick slices is unclear. One conjecture, related to that given by Patlak et al. (1998), is the following: it is established that during ischemia brain cells swell and the volume fraction decreases by approximately 50%. This will bring about a reduction in width of the interstitial spaces of the brain. Although the width is often stated as 150 to 200 Å, the spaces almost certainly vary in size. If one assumes that some of the smaller channels form dead end pores, this would account for the increase in tortuosity that accompanies ischemia. The increase in λ, with a dead end pore, occurs because diffusing molecules spend more time in such structures than when the channels are open at both ends. Dextran (70 kDa), with a Stokes radius of 81 Å (Nicholson and Tao, 1993) could block the entrance to some of these pores, preventing molecules from being transiently trapped. This blockage would diminish α by a small amount, as is actually observed. To determine whether or not this is a viable explanation will require further studies with additional macromolecules to clarify the mechanism underlying the dextran-induced paradoxical decrease in tortuosity of ischemic brain tissue.
Footnotes
Acknowledgements
The authors thank Dr. Kevin C. Chen and Dr. Lian Tao for critical comments on the manuscript.