
Abstract
Water compartmentalization was studied in a thick-slice (1000 μm) model of ischemia by combining water-content measurements with extracellular diffusion analysis. Thick slices bathed in artificial cerebrospinal fluid continually gained water. Total tissue water content was increased by 67% after 6 hours of the incubation. Diffusion measurements using the tetramethylammonium method showed that the extracellular space, typically occupying 20% of brain tissue in vivo, was decreased to 10% at 30 minutes and 15% at 6 hours in both deep and superficial layers of thick slices. Quantification of water compartmentalization revealed that water moved initially from the extracellular space into the cells. Later, however, both compartments gained water. The initial cell swelling was accompanied by dramatic shifts in potassium. An initial rise of extracellular potassium to about 50 mmol/L was measured with a potassium-selective microelectrode positioned in the center of the thick slice; the concentration decreased slowly afterwards. Potassium content analysis revealed a 63% loss of tissue potassium within two hours of the incubation. In thick slices, ionic shifts, water redistribution, and a loss of synaptic transmission occur in both deep and superficial layers, indicating the spread of ischemic conditions even to areas with an unrestricted supply of nutrients.
During stroke, the brain is severely challenged by prolonged nutrient deprivation and the lack of substance removal resulting from the compromised circulation. The ionic and metabolic events triggered by an ischemic insult have been extensively studied to understand the individual components of this complex process and, ultimately, to design an effective treatment (Dirnagl et al., 1999). The introduction of in vitro animal models substantially accelerated research on ischemic brain injury, although the mechanisms of cell damage may not be identical to those occurring in vivo. Typically, the in vitro model employs 300- to 400-μm-thick brain slices, and ischemia is mimicked by withholding oxygen and glucose from the superfusing artificial cerebrospinal fluid (ACSF;Schurr and Rigor, 1990; Whittingham et al., 1984). The in vitro model allows control of both the duration of the ischemic insult and the recovery phase, and pharmacologic intervention is facilitated. It is important to note, however, that the ischemic insult experimentally induced in the conventional slice model is actually the second episode, the slice procedure itself being the first one (Somjen et al., 1987). Moreover, during the ischemic insult brain tissue continues to be bathed in ACSF containing physiologic concentrations of ions and a normal pH, though lacking oxygen and glucose. This allows the removal of ions and substances from the tissue to the ACSF flowing over the slice surfaces and keeps pH and ion concentrations on the tissue boundary at physiologic levels; in this respect, it fails to mimic real ischemia.
A thick-slice model of ischemia introduced by Newman et al. (1988, 1989, 1991) attempted to remedy the shortcomings of conventional in vitro models. In the Newman model, brain slices are cut at a 1000-μm thickness. Such a thickness substantially hinders the access of oxygen, buffers, and glucose from the superfusing ACSF to the center of the slice and restricts removal of ions and metabolites from the extracellular space (ECS). It has been found that Po2 drastically declines in the center of such a thick preparation to practically zero (Bingmann and Kolde, 1982). Thus the thick-slice model better approximates in vivo ischemia, where the tissue suffers from a combination of hypoxia, hypoglycemia, and, due to the compromised circulation, insufficient clearance of potentially neurotoxic substances.
The thick-slice model of ischemia has been extensively characterized biochemically and histologically (Newman et al., 1988, 1989, 1991; Patlak et al., 1998). In those studies, thick slices have been found to show an abnormal glucose metabolism and lactate accumulation, accompanied by morphologic changes typical for ischemia. Interestingly, the metabolic changes resemble the conditions found in stroke penumbra (Newman et al., 1988), an area forming the periphery of the ischemic brain tissue (Astrup et al., 1981). The parameters of the ECS, which are severely altered during anoxia in vivo (Lundbæck and Hansen, 1992; Syková et al., 1994; Voříšek and Syková, 1997), have also been measured in thick slices using radiotracers (Patlak et al., 1998) and the tetramethylammonium (TMA) method (Hrabětová and Nicholson, 2000). The size of the ECS, determined as the volume fraction (α) using the TMA method (Nicholson and Phillips, 1981; Nicholson 2001), decreases from a typically in vivo value of 20% (Nicholson and Syková 1998; Nicholson 2001) to 12% while the hindrance for the diffusing substances, referred to as tortuosity (λ), rises from a normoxic value of 1.60 to 1.99 in the center of a thick slice (Hrabětová and Nicholson, 2000). The decrease in α measured in thick slices reflects the enlargement of the volume of the cells at the expense of the ECS but does not quantify the intracellular and extracellular compartmentalization of water that underlies these volume changes.
This study combines water-and ion-content analysis with diffusion measurements to investigate the edema, cell swelling, and water compartmentalization in the thick-slice ischemia model. Water gain was measured in thick slices of rat forebrain during 6 hours of incubation in ACSF. To determine the intracellular and extracellular compartmentalization of water, water-content analysis was combined with the measurements of the ECS volume using the TMA method. This experimental approach, pioneered in the rat brain by Cserr et al. (1991), was previously used to study osmotically induced water redistribution in the turtle cerebellum (Krizaj et al., 1996). Water redistribution observed in thick slices was complemented by measurements of changes in extracellular potassium ([K+]e) using a potassium-selective microelectrode. These data were combined with the measurements of tissue potassium content to estimate the irreversible loss of potassium from cellular compartment of thick slices.
MATERIALS AND METHODS
Rat brain slices
Coronal brain slices were prepared from adult Sprague-Dawley female rats (200–250 g) as described previously (Rice and Nicholson, 1991; Pérez-Pinzón et al., 1995). Briefly, animals were anesthetized with sodium pentobarbital (65 mg kg−1 IP) and decapitated using a guillotine. The brain was extracted from the skull and cooled with ice-cold ACSF. Slices of thickness 1000 and 400 μm were cut using a vibrating-blade microtome (VT 1000 S; Leica Instrument GmbH, Nussloch, Germany) and incubated submerged in ACSF at room temperature or, in some experiments, used immediately. The composition of the ACSF was (in mmol/L): NaCl 115, KCl 5, NaHCO3 35, NaH2 PO4 1.25, d -glucose 10, MgCl2 1.3, CaCl2 1.5. The ACSF was gassed with 95% O2 /5% CO2 to buffer pH at 7.4. The osmolality of ACSF, typically 300 mOsm, was determined with a freezing point–depression osmometer (Osmette A #5002; Precision Systems Inc., Natick, MA, U.S.A.). In some experiments, 0.5 mmol/L tetramethylammonium (TMA) chloride was added to the ACSF to provide a calibration standard for diffusion measurements.
Recording chamber
The recordings were conducted in a submersion tissue chamber (volume 1 mL; model RC-27L; Warner Instrument Corp., Hamden, CT, U.S.A.). The brain slices were superfused with ACSF at a flow rate of 2.0 mL min−1. The temperature was maintained at 34 ± 1°C using an in-line heater (model SH-27A; Warner Instrument Corp.) in combination with a chamber heating system connected to a dual automatic temperature controller (model TC-344B; Warner Instrument Corp.). In some slices, a bipolar twisted wire electrode was placed in neocortex on the border of white matter and layer VI to evoke the field potentials. The responses to the stimuli (1–5 mA, 20–30 microseconds) were recorded in layer III using the reference barrel of the ion-selective microelectrode (ISM), and stored using a LabView (National Instruments Corp., Austin, TX, U.S.A.)-based program.
Ion selective microelectrodes and iontophoretic microelectrodes
ISMs sensitive to TMA+ were prepared as described previously (Nicholson, 1993). The micropipette was pulled from double-barreled theta glass (Warner Instrument Corp.). The ion-detecting barrel, containing a tetraphenylborate-based exchanger (Corning exchanger 477317; currently available as IE 190 from WPI, Sarasota, FL, U.S.A.) in the tip, was backfilled with a salt solution containing 150 mmol/L TMA+. The reference barrel was filled with 150 mmol/L NaCl. The DC potentials recorded from the reference barrel were continuously subtracted from the signal measured on the ion barrel (Nicholson, 1993) using a dual-channel microelectrode preamplifier (model IX2–700; Dagan Corp., Minneapolis, MN, U.S.A.). Ion-selective microelectrodes for detecting [K+]e were prepared in a similar way to those for TMA+. The tip of the ion-detecting barrel was filled with a valinomycin-based, potassium-selective cocktail (Potassium iontophore I-cocktail B, #60398; Fluka, Milwaukee, WI, U.S.A.) and backfilled with 150 mmol/L KCl. Each ISM was calibrated in a set of standard solutions in which the concentration of the ion of interest was increased by doubling its amount against background of 150 mmol/L NaCl (the “Fixed Interference Method,” Nicholson 1993). Calibration parameters were used to obtain the slope and the interference of the electrode by fitting the data to the Nikolsky equation (Nicholson, 1993). To control for the interference of the TMA+-ISM with high levels of [K+]e, typically observed in the ischemic tissue (Hansen, 1977), the TMA+-ISMs were calibrated in a set of standards containing increased amounts of KCl. Amounts of potassium up to 60 mmol/L had no effect on the slope and the interference of the TMA+-ISM.
Tetramethylammonium iontophoretic micropipettes were prepared from double-barreled theta glass filled with 150 mmol/L TMA+ chloride. A positive bias current of 20 nA was applied continually to keep the transport number of the iontophoretic micropipette constant (Nicholson and Phillips, 1981). For the diffusion measurements, a current pulse of 40 to 100 nA, lasting typically 50 seconds, was applied from a constant-current, high-impedance source (model Axoprobe-A1 Amplifier; Axon Instruments, Inc., Union City, CA, U.S.A.).
Diffusion of TMA+
The setup was built around an upright compound microscope (Olympus BX50WI; Olympus America, Melville, NY, U.S.A.) equipped with two micromanipulators (MP-285; Sutter Instrument Co., Novato, CA, U.S.A.) mounted on a Gibraltar platform (Burleigh Instruments, Fishers, NY, U.S.A.). The precision and the stability of manipulators allowed us to position ISM and iontophoretic microelectrodes separately and maintain the same intertip distance over several hours. The microelectrodes, held in the manipulators at the angle of 31° from the horizontal plane, were first placed at the surface of an agar block or a brain slice with their tips touching. From this common zero, they were moved apart horizontally, then each was advanced a predetermined distance along its axis so as to position the microelectrode in the agar or brain slice with a final horizontal distance of 100 μm between the tips. In 1000-μm slices, the diffusion measurements were performed in the center of the slice (at a depth of 500 μm below the upper surface of the slice) and in some slices also in the superficial layers (depth 150 or 200 μm). In 400-μm slices, measurements were made in the center of the slice (depth 200 μm).
Diffusion curves, recorded in dilute (0.3% in 150 mmol/L NaCl) agar gel (Agar Noble; Difco, Detroit, MI, U.S.A.) or in cortex, were amplified and low-pass (6 Hz) filtered using a CyberAmp 320 (Axon Instruments, Inc., Union City, CA, U.S.A.). The data were then acquired by an A/D converter (model PCI-MIO-16E-4; National Instruments Corp., Austin, TX, U.S.A.) installed in a PC and saved using the LabView-based program WANDA (K.C. Chen, unpublished). After acquisition, an appropriate solution to the diffusion equation (Nicholson, 1993) was fitted to the data using the Matlab (MathWorks, Natics, MA, U.S.A.)-based program WALTER (C. Nicholson, unpublished). From the agar diffusion curves, the fitting procedure extracted the transport number, nt, of the iontophoretic micropipette and the free diffusion coefficient, D (cm2 s−1), while the apparent diffusion coefficient, D*(cm2 s−1), volume fraction, α, and a nonspecific uptake, k′ (s−1), were determined from brain data. The tortuosity, λ, which is a measure of the hindrance imposed on the diffusing molecules by brain structure, was calculated as (D/D*)0.5 (Nicholson and Phillips, 1981; Nicholson 2001). The volume fraction, α, quantifies the volume of the ECS relative to the whole tissue volume. The nonspecific uptake, k′, represents the loss of the TMA+ from the ECS (Nicholson and Phillips, 1981; Nicholson, 1992; Nicholson 2001).
Water content and compartmentalization
Water content of the brain slices (1000 and 400 μm) was measured as previously described (Krizaj et al., 1996). Each slice was placed on a plastic spatula and the excess fluid carefully removed. Then the slice was put on a small piece of preweighed aluminum foil, weighed (wet weight, mt), and dried in an oven at 85°C overnight. Next day, the dried slice was weighed again (dry weight, dw, md). The water content (ɛ) of the slice was calculated as a tissue water weight per dry weight (ɛ = (mt −md)/md) and given as grams of water per gram of tissue dry weight (g H2O (g dw)−1). The changes in ɛ quantified the swelling and shrinking of the tissue.
The distribution of tissue water between the extracellular and intracellular compartments can be calculated from water content (ɛ) and volume fraction (α) measurements. Based on the equations given by Krizaj et al. (1996), the extracellular water was calculated as me/md= α (ɛ + 1) and intracellular water was calculated as mi/md= ɛ−αɛ−α.
Potassium content
Several slices (1000- or 400-μm thickness) were collected immediately after cutting and at 2, 4, and 6 hours of incubation. Collected slices were weighed in an Eppendorf tube containing 800 μl ACSF and homogenized. The [K+] of the homogenized sample was measured with a K+-ISM. Because the volume and [K+] of ECS and ACSF used for homogenization were known, [K+]tissue and [K+]i could be calculated. The validity of this method was verified using freshly cut slices to obtain [K+]i= 123 ± 9 mmol/L (mean ± SD, n = 4). This value agrees with intracellular levels of potassium measured with potassium-selective microelectrodes (Bührle and Sonnhof, 1983). Our method determines ion concentration within the cellular compartment of the tissue without distinguishing between neurons and glia, however.
RESULTS
Edema in thick slices
The swelling of 1000-μm slices was measured as a change in water content in the course of incubation and compared with the water gain observed in 400-μm slices. The water content of freshly cut 1000- and 400-μm slices was 4.07 ± 0.18 (mean ± SD, n = 14) and 4.37 ± 0.11 (n = 25) g H2O (g dw)−1, respectively. The small difference between water content of the slices of different thickness was probably due to the contribution of surface fluid, which has a larger effect in thinner slices. Pappius and Elliott (1956) reported a water content of 4.0 g H2O (g dw)−1 for 500-μm cortical slices cut in humidified chamber without moistening the tissue, whereas MacGregor at al. (2001) obtained a value of 4.23 g H2O (g dw)−1 for 400-μm coronal slices cut submerged in ACSF. Siklós et al. (1997) observed similar small differences in water content between unsliced and sliced hippocampal tissue of adult guinea pigs. Since our goal was not to measure the exact tissue water content but rather to observe the relative changes during the course of incubation, the data were normalized within each group to the aforementioned values of freshly cut slices set as 100% (Fig. 1).
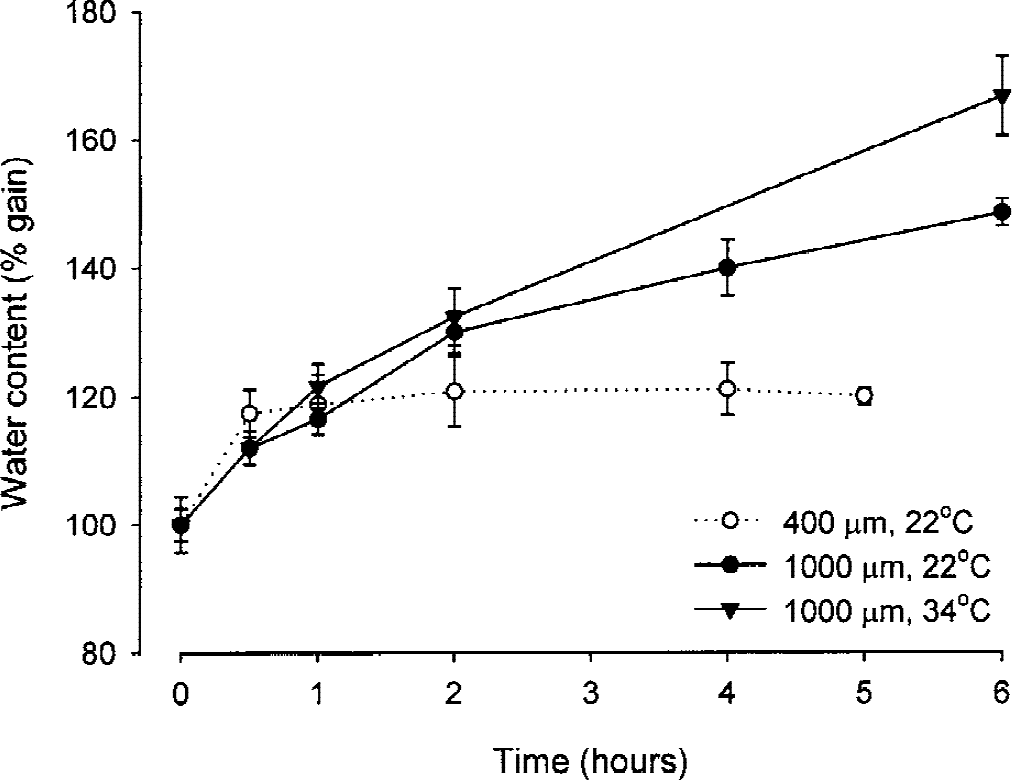
Water gain in rat brain slices. Thick slices (1000 μm) were incubated at 22°C (closed circles) and 34°C (closed triangles). For comparison, water gain in 400-μm thick slices (open circles) incubated at 22°C is also shown. Data (mean ± SD) are normalized to the value of freshly cut (0 hours) slices set at 100%.
During the first 30 minutes of incubation, both types of slices quickly gained water (Fig. 1). Then, the swelling of 400-μm slices slowed down and reached a plateau. Overall, the water content of 400-μm slices increased during the incubation at 22°C by 20% (i.e., from 4.37 ± 0.11 (n = 25) to 5.24 ± 0.07 (n = 15) g H2O (g dw)−1). When the incubation temperature was raised to 34°C, the water gain measured in 400-μm slices was slightly larger, reaching 24% and 28% at 2 and 4 hours of incubation, respectively. In contrast, 1000-μm slices continued to gain water in the course of incubation. This trend was further accentuated when the incubation temperature was raised to 34°C (Fig. 1); during 6 hours of incubation, the water content of 1000-μm slices increased by 67% (i.e., from 4.07 ± 0.18 (n = 14) to 6.79 ± 0.42 (n = 12) g H2O (g dw)−1).
Extracellular volume fraction, tortuosity and nonspecific uptake changes in thick slices
Immediately after the cutting, a thick slice was transferred to the recording chamber and superfused with ACSF. The TMA+-ISM and iontophoretic electrodes were quickly placed at a depth of 500 μm and the diffusion measurements were started as soon as the TMA+ signal stabilized. At the earliest time point measured, 30 minutes after slicing, α was decreased to 0.095 ± 0.007 (n = 6; Fig. 2, Table 1) compared with typical normoxic α of approximately 0.2 in vivo (Nicholson and Phillips, 1981; Lehmenkühler et al., 1993; Nicholson and Syková, 1998; Nicholson 2001). Then α steadily increased, reaching 0.149 ± 0.005 (n = 5; Fig. 2, Table 1) 6 hours after the dissection. In these slices, λ was increased to 1.79 ± 0.06 at 30 minutes compared with typical normoxic λ of approximately 1.6 in vivo (Nicholson and Phillips, 1981; Lehmenkühler et al., 1993; Nicholson and Syková, 1998; Nicholson 2001), and rose further to 1.96 ± 0.06 (n = 4) 1 hour after the dissection, where it stabilized (Table 1). At 30 minutes and 6 hours after the dissection, the nonspecific uptake was 0.5 ± 0.6 × 10⁻³ s−1 and 2.9 ± 2.2 × 10⁻³ s−1, respectively (Table 1).
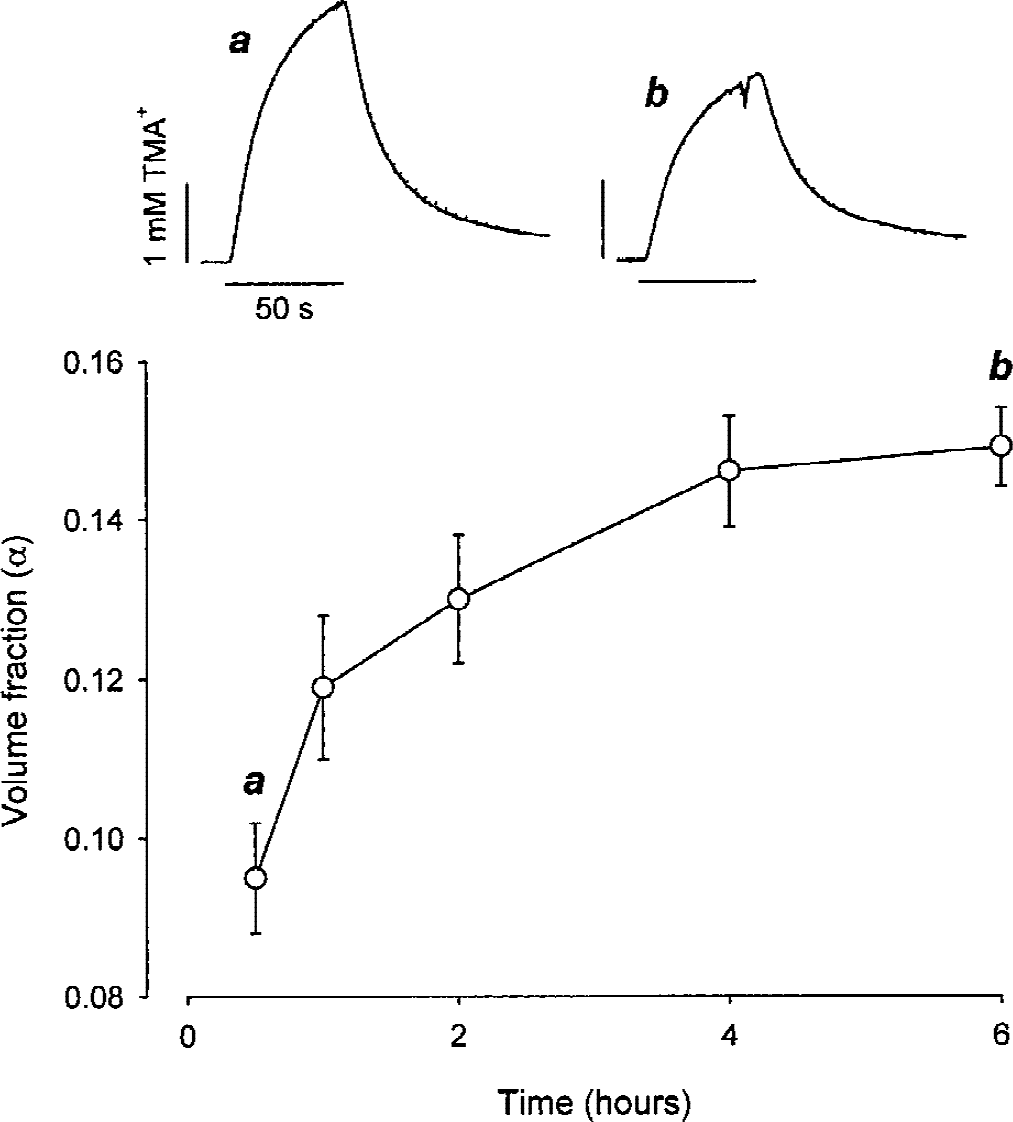
Extracellular volume fraction (α) in the center of neocortical thick slices during incubation. Top. Representative tetramethylammonium (TMA+) diffusion curves were obtained at 0.5 (a) and 6 (b) hours after dissection. Tetramethylammonium was iontophoresed (+60 nA) from 10 to 60 seconds (horizontal bar) and the concentration of TMA+ was detected with an ion-selective microelectrode (ISM) 100 μm away. Diffusion curves (solid line) are superimposed with the appropriate theoretical curves (dotted line). Diffusion parameters (a) α = 0.10, λ = 1.83, and k′ = 2.3 × 10⁻⁴ s−1 and (b) α = 0.16, λ= 1.96, and k′ = 6.9 × 10⁻⁷ s−1 were extracted using an iontophoretic transport number nt= 0.44, spacing r = 100 μm, and free diffusion coefficient for TMA+D = 1.24 × 10⁻⁵ cm2 s−1. Bottom. The average volume fraction measured at 0.5, 1, 2, 4, and 6 hours after the dissection at a depth of 500 μm. The symbols represent mean ± SD.
Extracellular volume fraction (α), tortuosity (λ), and nonspecific uptake (k′) of thick slices (1000 μm) during incubation measured with TMA method
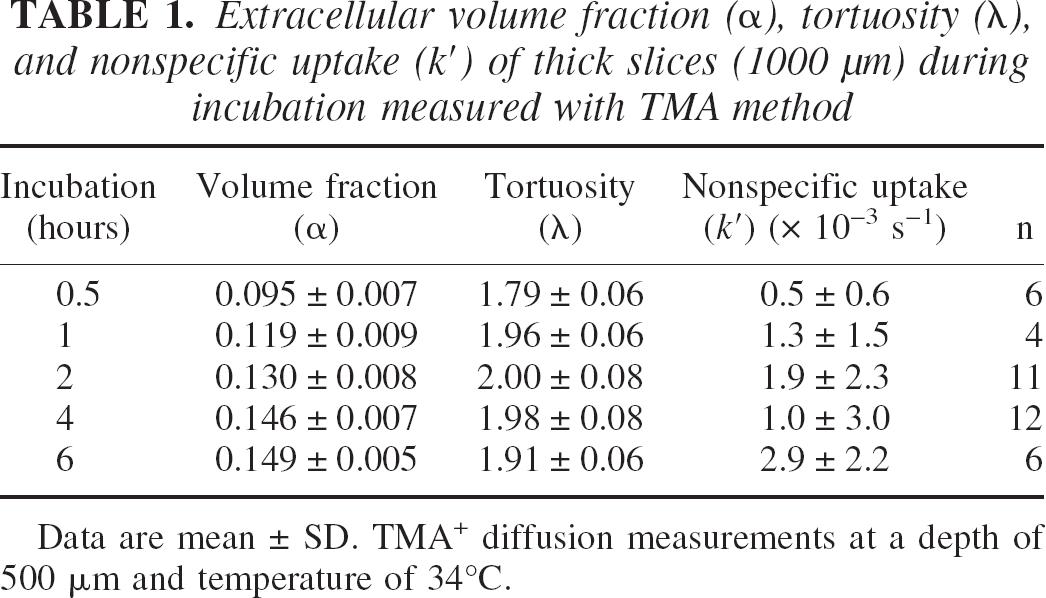
Data are mean ± SD. TMA+ diffusion measurements at a depth of 500 μm and temperature of 34°C.
Besides the data obtained at the center of the thick slices, additional measurements were made in more superficial layers at 200 or 150 μm below the upper surface. Unexpectedly, even in these superficial layers where the supply of the oxygen and glucose was not restricted by the distance from the flowing ACSF, the ECS parameters were altered in similar ways to those in the center of thick slices. Half an hour after the dissection, the ECS volume fraction shrank to 0.093 ± 0.004 (n = 5). Then α steadily increased reaching 0.131 ± 0.042 (n = 7, Fig. 3) and 0.154 ± 0.004 (n = 3) at 2 and 6 hours, respectively. The volume fraction measured in the superficial layers of the thick slices was significantly smaller than the α obtained in the center of 400-μm slices incubated for 2 hours after the dissection (α = 0.24 ± 0.01, n = 10;P < 0.001, t-test; Fig. 3). The tortuosity and nonspecific uptake did not change in the course of incubation. At 0.5, 2, and 6 hours, λ was 1.78 ± 0.04, 1.80 ± 0.11, and 1.83 ± 0.02, respectively, while k′ was 8.4 ± 1.8 × 10⁻³ s−1, 9.0 ± 2.6 × 10⁻³ s−1, and 7.4 ± 0.5 × 10⁻³ s−1, respectively. The tortuosity of superficial layers of thick slices was significantly larger than λ measured in 400-μm slices (1.65 ± 0.01, n = 10;P < 0.005, t-test). Thus, the close proximity to the superfusing ACSF failed to preserve normoxic ECS parameters in the superficial layers of thick slices. This conclusion is supported by the finding that the synaptic transmission was silenced in the superficial layers of thick slices. No field potentials were recorded in neocortex at a depth of 200 μm in 1000-μm slices, whereas stable responses were routinely evoked in 400-μm slices (Fig. 3B).
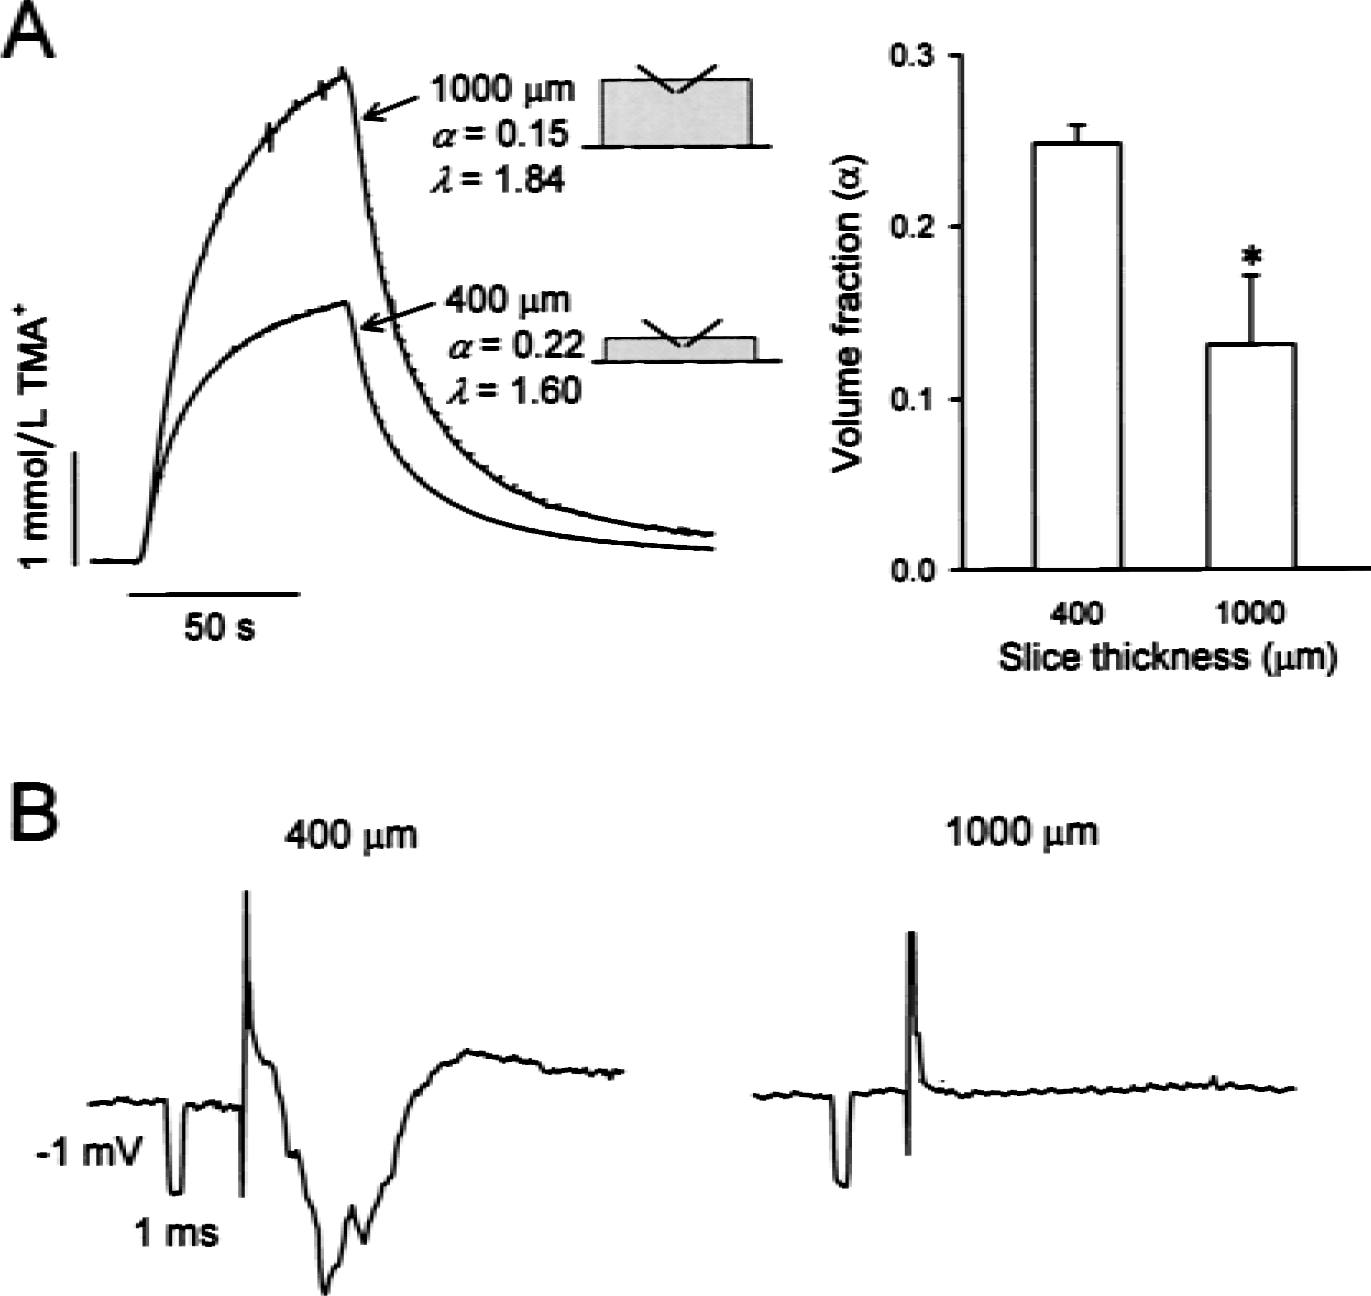
Extracellular volume fraction and field potentials in the superficial layers of neocortical slices.
Water compartmentalization
The water content method quantifies water gain by the tissue but does not determine how the accumulated water gets distributed between extracellular and intracellular compartments. To obtain the information about water compartmentalization, the relative size of one of those compartments has to be known; here the TMA method was used to map the changes of the ECS volume fraction, α, as described previously.
Since the ECS of thick slices was changed quite uniformly across the thickness of the preparation, the values of α measured in the center of thick slices over time were used to assess the compartmentalization of water. Although the tissue of thick slices was continually gaining water, water compartmentalization was found to alter during the course of incubation. Thirty minutes after dissection, the most profound changes occurred; the extracellular water decreased from 1.01 to 0.53 g H2O (g dw)−1 and intracellular water increased from 3.06 to 4.03 g H2O (g dw)−1 (Fig. 4). Thereafter, both intracellular and extracellular water continuously rose. Six hours after dissection, extracellular water was 1.16 g H2O (g dw)−1 and intracellular water was 5.63 g H2O (g dw)−1 (Fig. 4).
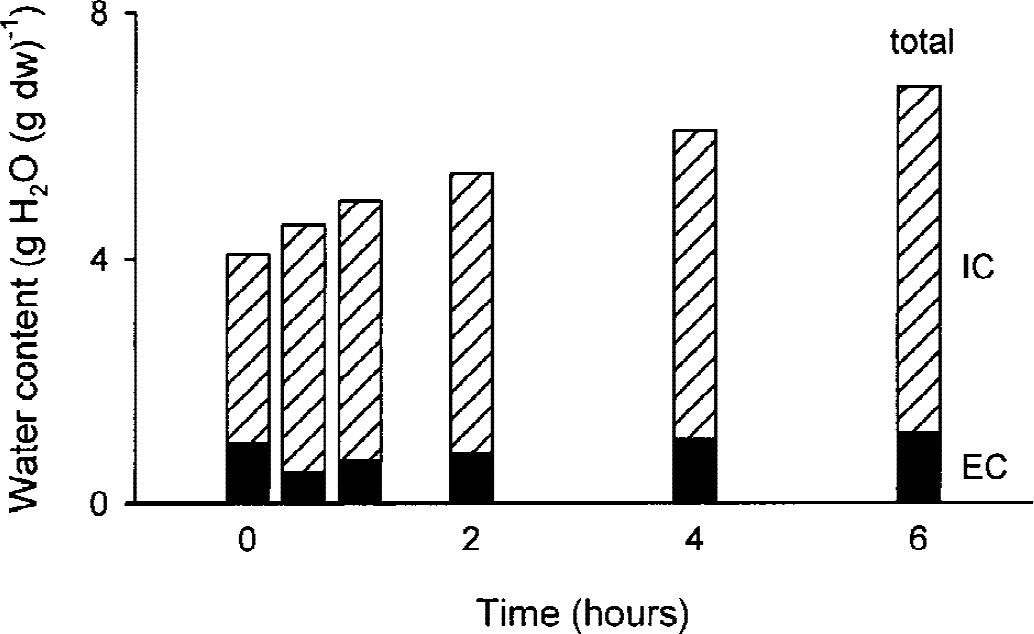
Compartmentalization of water in thick slices. Cumulative bar graph for extracellular (EC, filled bars) and intracellular (IC, hatched bars) compartments were obtained by applying water content (ɛ) and volume fraction (α) measurements (see text for details).
Potassium ion behavior in thick slice
The altered ECS parameters and the silencing of synaptic transmission in the superficial layers of thick slices, where the access of glucose and oxygen from the superfusing ACSF should have preserved the tissue, were a surprising finding. One possible explanation was that ions and metabolites released to the ECS in the ischemic core diffused towards the slice surfaces and spread ischemic damage to the layers supplied with oxygen and glucose. It is well established that the onset of ischemia leads to massive release of K+ into the ECS (Vyskočil et al., 1972; Hansen, 1977; Nicholson et al., 1977; Syková et al., 1994). It has been shown also that subjecting normoxic neuronal tissue to a high concentration of K+ induces depolarization and modification of ECS parameters, resulting in a decreased α and an increased λ (Syková et al., 1999).
To see how [K+]e behaved immediately after the cutting, a thick slice was transferred into the recording chamber and superfused with ACSF. A K+-ISM was placed at a depth of 500 μm in the cortex to measure the time-course of [K+]e changes. When the recording was started, [K+]e had reached 47 mmol/L (Fig. 5A) and the reference barrel of the K+-ISM measured a DC potential of −19 mV (Fig. 5A). This negative potential represents an anoxic depolarization similar to that seen during ischemia and terminal anoxia in vivo (Vyskočil et al., 1972; Hansen, 1977; Nicholson et al., 1977). Over time, both [K+]e and the DC potential slowly decreased. Ninety minutes after slicing, [K+]e reached 8 mmol/L and the DC potential was −5 mV (Fig. 5A).
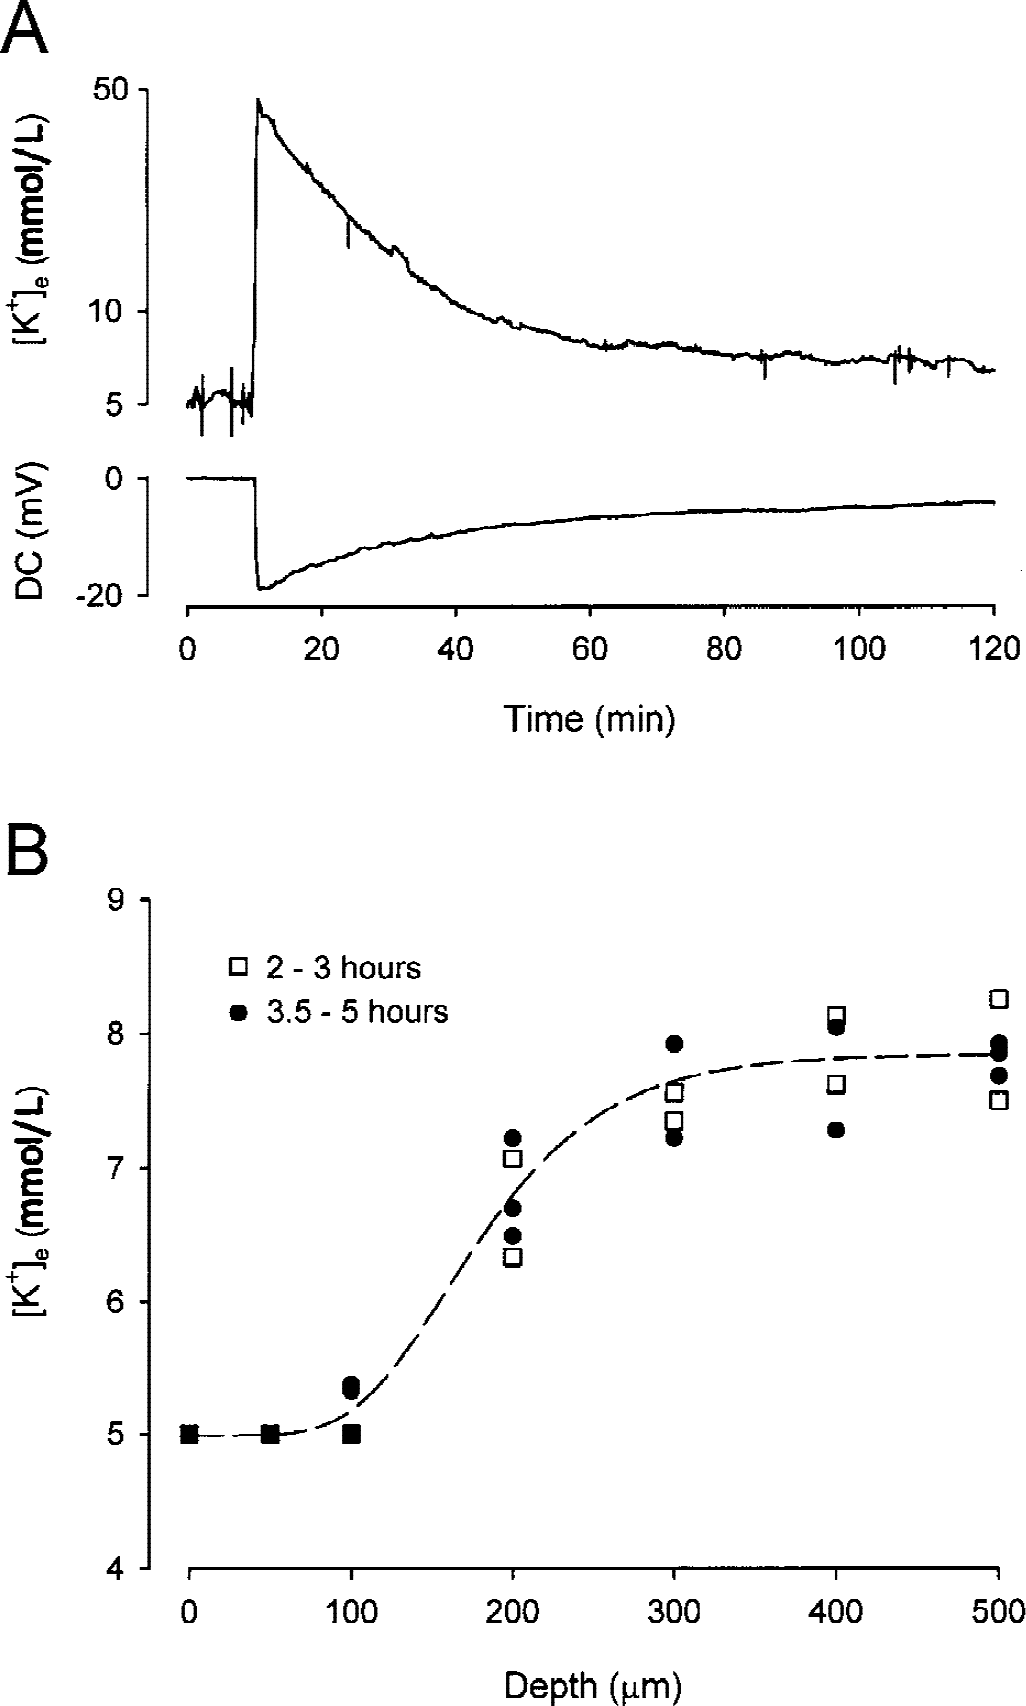
Extracellular [K+] and anoxic depolarization in thick slices.
To determine whether [K+]e increased in more superficial layers, the depth profile of [K+]e was measured in the thick slice. During first 5 hours after the dissection, [K+]e remained elevated to more than 7 mmol/L at depths of 200 to 500 μm below the slice surface (Fig. 5B). To test whether the potassium that was massively released during anoxic depolarization to ECS was cleared to the ACSF superfusing the tissue, the total content of potassium was measured in the thick slice at different times.
Loss of potassium ions by the tissue of thick slices
The total content of potassium in the tissue dramatically decreased in the course of incubation. During the first two hours, [K+]tissue decreased from 80 mmol/L to 30 mmol/L (n = 2) and remained at similar levels at the 4-and 6-hour time points (Fig. 6). Based on the measured values of α (Table 1) and [K+]e (Fig. 5), the estimated loss of potassium from the intracellular compartment was 65% within the first 2 hours after the onset of ischemia (Fig. 6). By contrast, 400-μm slices incubated for 2 hours under normoxic conditions lost only 19% of tissue potassium (data not shown).
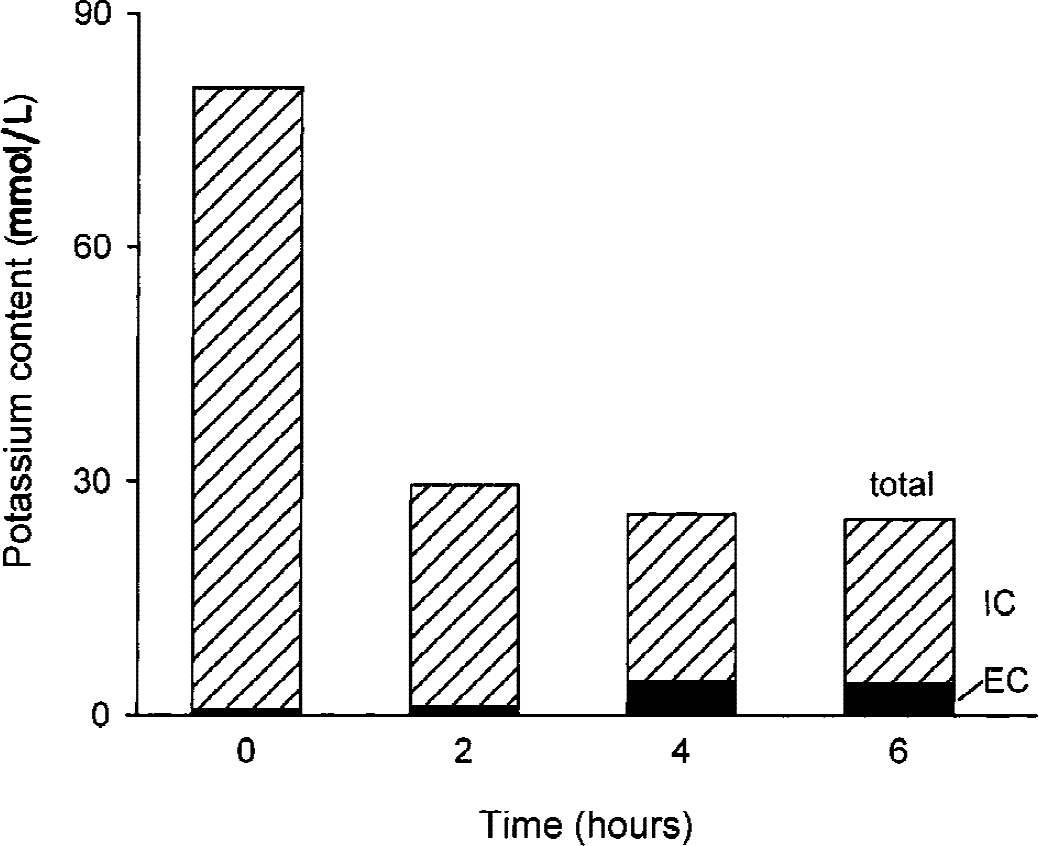
Potassium content of thick slices. The total content of potassium decreased over the time course of incubation, predominantly in the first 2 hours. Potassium content of extracellular (EC, filled bars) and intracellular (IC, hatched bars) compartments is shown.
DISCUSSION
Ischemic edema
Thick slices develop ischemic edema. The lower temperature of incubation decreased the total amount of water gained by the thick slices but did not alter the trend of continuous swelling during the incubation. Whereas the swelling of the brain slices is a long-known phenomenon, the direct connection between the swelling and the lack of oxygenation of the tissue was put forward by Franck et al. (1968). Franck et al. found that rat cortical slices, 400-μm thick, gained 52% of the initial fresh weight when incubated for 5 hours under anoxic conditions at 37°C.
The water gain measured in 400-μm slices in our experiments was substantially smaller than the swelling observed in 1000-μm slices. In addition, the increase in water content of 400-μm slices occurred mainly within the first 30 minutes of the incubation, whereas 1000-μm slices continued to gain water throughout the course of incubation. Our data on 400-μm slices are in agreement with several recent reports. Brahma et al. (2000) reported ɛ = 5.13 g H2O (g dw)−1 for 400-μm slices incubated for an hour at 24°C. MacGregor et al. (2001) found that water content of 4.23 g H2O (g dw)−1 measured in freshly cut 400-μm slices rose to 5.10 g H20 (g dw)−1 after 1 hour of incubation at room temperature (22–24°C). An initial swelling is thus typically observed in normoxic brain slices during the recovery period after the cutting and probably reflects the reaction of tissue to transient ischemia and trauma inevitably caused by the preparation. In contrast, the continuous water gain by 1000-μm slices during incubation reflects persisting ischemic conditions leading to irreversible damage in thick slices.
The mechanism of water uptake by slices has been intensively investigated. Multiple studies have implicated the involvement of glutamate excitotoxicity, oxidative stress, and acidosis in tissue edema developing in 400-μm slices as a result of cutting or during the incubation at physiological temperatures (Franck et al., 1968; Feig and Lipton, 1990; Richerson and Messer, 1995; Siklós et al., 1997; Brahma et al., 2000; MacGregor et al., 2001). The interplay of these factors is likely to underlie water gain observed in thick slices. Thick slices thus model in vitro ischemic edema and can be used in studies addressing its mechanism as well as in the studies using pharmacologic interventions to mitigate the development of edema.
Volume fraction and water compartmentalization in thick slices
In order to track down water movement and distribution between intracellular and extracellular compartments, water-content data were complemented by measurements of the extracellular volume fraction. As described in detail by Krizaj et al. (1996) these two parameters, water content, ɛ, and volume fraction, α, encapsulate the information about water compartmentalization in tissue. Using the TMA method to quantify α, it has been previously reported that volume fraction decreased to 0.12 in the center of thick slices (Hrabětová and Nicholson, 2000). In the present study, this result was extended by monitoring the ECS volume fraction at several time points after the dissection. We found that α shrank to 0.095 at the onset of ischemia in thick slices. During 6-hour incubation, α subsequently expanded to 0.15 but never reached the normoxic value. In contrast to volume fraction, extracellular tortuosity rose to 1.96 during the first hour of the incubation and then remained steady.
These diffusion measurements were made in the center of the preparation. However, to evaluate water compartmentalization, the values of α at different depths of thick slices have to be known. It was expected that more superficial layers would be preserved because they were close to superfusing ACSF containing oxygen and glucose. But the extracellular volume fraction and tortuosity of superficial layers resembled those occurring in the center of thick slices. This finding indicates that ions and metabolites released in the ischemic core spread ischemic conditions even to areas with an adequate supply of nutrients.
By combining water content analysis with measurements of α, the compartmentalization of gained water could be followed in the thick slices. The distribution of water between intracellular and extracellular compartments changed in the course of the incubation. The largest water redistribution occurred at the onset of ischemic insult and is likely to be caused by large movement of ions typically occurring at this stage of ischemia. The increase in α during the course of incubation was observed in our in vitro model but not in the in vivo model of ischemia described by Syková et al. (1994). In vivo, a persisting decrease of α was measured up to one hour after the onset of terminal anoxia (Syková et al., 1994; Voříšek and Syková, 1997). This difference in the behavior of α may reflect the fact that, in vivo, the spatial expansion of edematous ischemic tissue is restricted by the skull, but no such constraint is imposed on a slice.
ECS serves as a channel to spread ischemic conditions in brain tissue
The altered ECS parameters in the superficial layers of thick slices, where the access of glucose and oxygen from superfusing ACSF should preserve the tissue, were a surprising finding. This prompted examination of the possibility that ions and metabolites released to the ECS in the ischemic core could diffuse towards the slice surfaces and spread the ischemic damage.
The early event in ischemia is an anoxic depolarization resulting from an insufficient supply of metabolic substrates. During anoxic depolarization, potassium ions are released from the cells and accumulate in the ECS unless the substrates are restored. Extracellular K+ therefore can serve as a marker for the depolarized state of the tissue. When the time-course of the [K+]e changes was measured in thick slices, [K+]e was found to be substantially increased soon after dissection to approximately 50 mmol/L at a depth of 500 μm. This concentration is slightly smaller than the 60 to 70 mmol/L typically detected in the ischemic core in vivo (Vyskočil et al., 1972; Hansen, 1977; Nicholson et al., 1977; Syková et al., 1994). However, the value measured in thick slices is likely to be an underestimate of the peak value because some time inevitably elapsed from the animal sacrifice and slice cutting, which represents the onset of ischemia in the thick slice model. During the incubation, [K+]e slowly decreased, reaching 8 mmol/L two hours after dissection. Surprisingly, [K+]e was similarly elevated in the more superficial layers of the thick slices between 2 to 5 hours after dissection. Similar profiles of [K+]e were reported by Lipinski and Bingmann (1986) in 900-μm-thick hippocampal slices incubated in ACSF for ∼2 hours and related to the impaired O2 supply in the center of the slice. By contrast, no elevation of [K+]e was observed in slices thinner than 500 μm (Lipinski and Bingmann, 1986). In thick slices, the potassium ions released to the ECS at the onset of ischemia are not pumped back into the cells because of the permanently impaired metabolic state. Instead, potassium diffuses through the ECS towards the slice surfaces where it is cleared into the superfusing ACSF. This scenario was confirmed when the total content of potassium in thick slices was found to drop by 65% after 2 hours of incubation. A similar loss of potassium content in cortical slices during incubation in anoxic conditions was reported previously by Franck et al. (1968).
The trafficking of potassium ions towards the surface of thick slice has serious consequences for the superficial cell layers. It is thought that these cells depolarize, excitatory amino acids are massively released, the demand for glucose increases, and anaerobic metabolism leads to lactate accumulation (Dirnagl et al., 1999). This triggers a vicious chain of events leading to ischemic injury. It has been shown that the surface layers of thick slices demonstrate anaerobic metabolism and impaired transport (Newman et al., 1988, 1989, 1991). Our study complemented these findings by direct measurements of increased [K+]e, the loss of evoked field excitatory postsynaptic potentials, and permanently altered diffusion properties of ECS in the surface layers of the thick slice. Because the whole tissue bears the hallmarks of the ischemic condition, the thick-slice model might further benefit from incubation in a modified ACSF, the composition of which would mimic the extracellular fluid during ischemia (Bondarenko and Chesler, 2001a, 2001b).
Implications for focal ischemia in vivo
The behavior of [K+]e observed in thick slices and the spread of ischemic conditions towards the slice surface may mimic the propagation of ischemic injury into the surrounding, adequately perfused tissue during focal ischemia in vivo. Theoretically, it may be expected that ischemic and normoxic brain tissue can both exist in thick slices. The center of the slice, which is deprived of nutrients due to the large distance from the ACSF, represents the ischemic core. By contrast, more superficial layers of a thick slice, where the access of oxygen and glucose is less limited and the removal of metabolic waste products from the tissue occurs, could represent normoxic tissue. Our data show that this is not the case. The spread of ions and metabolites from the ischemic core towards the slice surfaces is more effective than the countering diffusion of glucose and oxygen from the slice surfaces to the inner core. By analogy, during the focal ischemia in vivo, the ECS may serve as a conduit for ions and metabolites accumulated in the ischemic core and spread ischemic conditions to the surrounding healthy brain tissue. Elevated potassium concentration in ECS in vivo leads, in addition to the harmful effects described above, to vasoconstriction (Kuschinsky and Wahl, 1978), which would further compromise the tissue. Thus during focal ischemic events, potassium ions, and possibly other metabolites, flooding the tissue outside the region with insufficient perfusion, should be able to spread ischemic injury in the brain.