
Abstract
Changes in the extracellular space diffusion parameters during ischemia are well known, but information about changes during the postischemic period is lacking. Extracellular volume fraction (α) and tortuosity (Λ) were determined in the rat somatosensory cortex using the real-time iontophoretic method; diffusion-weighted magnetic resonance imaging was used to determine the apparent diffusion coefficient of water. Transient ischemia was induced by bilateral common carotid artery clamping for 10 or 15 mins and concomitant ventilation with 6% O2 in N2. In both ischemia groups, a negative DC shift accompanied by increased potassium levels occurred after 1 to 2 mins of ischemia and recovered to preischemic values within 3 to 5 mins of reperfusion. During ischemia of 10 mins duration, α typically decreased to 0.07 ± 0.01, whereas Λ increased to 1.80 ± 0.02. In this group, normal values of α = 0.20 ± 0.01 and Λ = 1.55 ± 0.01 were registered within 5 to 10 mins of reperfusion. After 15 mins of ischemia, α increased within 40 to 50 mins of reperfusion to 0.29 ± 0.03 and remained at this level. Tortuosity (Λ) increased to 1.81 ± 0.02 during ischemia, recovered within 5 to 10 mins of reperfusion, and was increased to 1.62 ± 0.01 at the end of the experiment. The observed changes can affect the diffusion of ions, neurotransmitters, metabolic substances, and drugs in the nervous system.
Introduction
The extracellular space (ECS) represents the microenvironment of nerve cells and serves as an important communication channel (Nicholson, 1979; Syková, 1992). The movement of substances in this microenvironment by diffusion is essential for extrasynaptic or ‘volume’ transmission among neurons, axons, and glia (Fuxe and Agnati, 1991; Zoli et al, 1999; Nicholson and Syková, 1998; Syková, 2004). Diffusion in the ECS is also essential for the delivery of oxygen and glucose from the vascular system to brain cells (Nicholson, 2001). Normal brain function depends on a continuous supply of oxygen and glucose to maintain the extracellular/intracellular ionic distribution and to enable synaptic as well as extrasynaptic transmission. Even short periods of ischemia result in a loss of function and changes in the brain microenvironment. It has been repeatedly shown in vivo (Van Harreveld and Ochs, 1956; Hansen and Olsen, 1980; Rice and Nicholson, 1991; Lundbaek and Hansen, 1992; Katayama et al, 1992; Syková et al, 1994; Syková, 1997; Voříšek and Syková, 1997a, b) as well as in vitro (Ames and Nesbett, 1983; Pérez-Pinzón et al, 1995) that the ECS of the brain shrinks during global ischemia. This shrinkage is caused by the movement of water from the ECS into the cells, which is accompanied by rapid cellular swelling. The reason for this water movement is an influx of sodium and chloride ions across the cell membranes. The persistent increase of intracellular sodium chloride leads to a reversal of the sodium chloride gradient such that the intracellular sodium chloride concentration may exceed the extracellular levels (Hansen, 1985; Somjen, 2002). Additionally, the swelling of astrocytes under excitotoxic concentrations of glutamate in conjunction with potassium uptake is well known (Somjen, 2002; Kimelberg, 2005). The ECS of the brain decreases to 5% to 6% of the total tissue volume during anoxia (Voříšek and Syková, 1997a, b), which is equivalent to a reduction of 65% to 80% from preischemic values.
Diffusion of neuroactive substances in the ECS is influenced by the width of the extracellular clefts, presence of membranes, fine neuronal and glial processes, macromolecules of the extracellular matrix, charged molecules, and cellular uptake (Syková et al, 2000; Hrabetova and Nicholson, 2000; Syková, 2004). In contrast to a free medium, diffusion in the ECS can only be satisfactorily described by a modified version of Fick's law, if volume fraction, tortuosity, and nonspecific uptake are taken into account (Nicholson and Phillips, 1981; Nicholson, 1992). Volume fraction (α) is the proportion of the tissue volume occupied by the ECS, whereas tortuosity (Λ) describes the increased path length of diffusing molecules in a complex medium. The diffusion parameters of the ECS and their dynamic changes can be determined using real-time iontophoretic method. This method uses the iontophoretic application of tetramethylammonium (TMA+) and TMA+-selective microelectrodes to record concentration—time profiles of TMA+ in the ECS (Nicholson and Phillips, 1981). Diffusion-weighted magnetic resonance imaging (DW-MRI) is a noninvasive method to determine the apparent diffusion coefficient of water. It has been used to show a shift of water between the intra- and extracellular compartments after various types of brain injury in animals as well as in humans (Le Bihan and Basser, 1995).
The aim of the present study was to quantify the changes in ECS diffusion parameters during recovery from transient ischemia by TMA+ -diffusion and MRI measurements and to compare their time courses. The data were correlated with DC-potential recordings and measurements of extracellular potassium levels. To the best of our knowledge, this is the first evaluation of the diffusion parameters of the ECS during recovery from transient ischemia in a low cerebral blood flow model of bilateral carotid artery occlusion.
Materials and methods
Animal Preparation
Three-month-old male Wistar rats (300 to 350 g) were anesthetized by an intraperitoneal injection of urethane (1.5 g/kg body weight; Sigma-Aldrich Chemie GmbH, Steinheim, Germany), tracheotomized, relaxed with suxamethonium chloride (20 mg/kg per h; Lysthenon, NycoMED Pharma, Vienna, Austria), and ventilated mechanically with oxygen. Their body temperature was maintained at 37°C by a heating pad. Transient ischemia was induced by bilateral common carotid arterial clamping for 10 mins (n = 5) or 15 mins (n = 6), and by reducing the inspired oxygen concentration to 6% in 94% nitrogen. After releasing the clamps, the animals were ventilated with pure oxygen. The head of the rat was fixed in a stereotaxic holder, and the somatosensory neocortex was partially exposed by a burr hole that was 2 to 3 mm caudal from the bregma and 3 to 4 mm lateral from the midline. When the dura was removed, the surface of the brain was continuously bathed in a warm solution (36°C to 37°C) containing 1 mmol/L TMA, 150 mmol/L NaCl, and 3 mmol/L KCl. All measurements were done in the somatosensory cortex at a depth of 1,200 to 1,500 μm from the cortical surface (cortical layer V; Lehmenkühler et al, 1993). For DW-MRI measurements (n = 6 in each group), the animals were placed in a heated MR-compatible cradle and their heads fitted in a built-in head holder.
The experiments were performed in accordance with the European Communities Council Directive of 24 November 1986 (86/609/EEC). All efforts were made to minimize both the suffering and the number of animals used.
Measurement of Extracellular Space Diffusion Parameters
The ECS diffusion parameters were studied by real-time iontophoretic method, described in detail previously (Nicholson and Phillips, 1981; Lehmenkühler et al, 1993; Syková et al, 1994). Briefly, an extracellular marker that is restricted to the extracellular compartment is used, such as tetramethylammonium ions (TMA+, MW = 74.1 Da), to which cell membranes are relatively impermeable. TMA+ is administered into the ECS by iontophoresis, and the concentration of TMA+ measured in the ECS using a TMA+-ion-selective microelectrode (ISM) is inversely proportional to the ECS volume. Double-barreled TMA+-ISMs were prepared by a procedure described in detail previously (Syková, 1992). The tip of the ion-sensitive barrel was filled with a liquid ion exchanger (Corning 477317); the rest of the barrel was backfilled with 150 mmol/L TMA+ chloride. The reference barrel contained 150 mmol/L NaCl. The TMA+-ISMs were calibrated in 0.01, 0.03, 0.1, 0.3, 1.0, 3.0, and 10.0 mmol/L TMA+ in a background of 3 mmol/L KCl and 150 mmol/L NaCl. Calibration data were fitted to the Nikolsky equation (Nicholson and Phillips, 1981). The shank of the iontophoretic pipette was bent so that it could be aligned parallel to that of the ISM and was backfilled with 150 mmol/L TMA+ chloride. An electrode array was made by gluing a TMA+ -ISM to an iontophoretic micropipette with a tip separation of 100 to 200 μm. The iontophoresis parameters were +20 nA bias current (continuously applied to maintain a constant electrode transport number), with a +180 nA current step of 60 secs duration, to generate the diffusion curve. TMA+ was administered at regular intervals of 5 mins. Before tissue measurements, diffusion curves were first recorded in 0.3% agar (Difco, Detroit, MI, USA) dissolved in a solution containing 150 mmol/L NaCl, 3 mmol/L KCl, and 1 mmol/L TMAC1. In agar, α and Λ are by definition set to 1 and nonspecific uptake k′ to 0 (free-diffusion values). The diffusion curves were analyzed to obtain the electrode transport number (n) and free-TMA+ -diffusion coefficient (D) by curve-fitting, according to a diffusion equation using the VOLTORO program (Nicholson and Phillips, 1981). Diffusion curves were then recorded in the somatosensory cortex at depths of 1,200 to 1,500 μm. Knowing n and D, the values of α, Λ, and k′ can be obtained from the recorded diffusion curves as described by Nicholson and Phillips (1981).
Diffusion-Weighted Magnetic Resonance Imaging
The DW-MRI measurements were performed using an experimental MR spectrometer BIOSPEC 4.7 T system (Bruker, Ettlingen, Germany) equipped with a 200 mT/m gradient system (190 μs rise time) and a homemade head surface coil. We acquired a sequence of T2-weighted sagittal images to position coronal slices. For DW measurements, four coronal slices were selected (thickness = 1.0 mm, interslice distance = 1.5 mm, field of view = 3.2 times 3.2 cm2, matrix size = 256 times 128). Diffusion weighting serves to increase the contrast in T2-weighted images for water diffusion. The b-factor denotes the strength of diffusion weighting. Acquiring at least two DW images with different b-factors allows for the determination of the apparent diffusion coefficient of water (ADCw). The DW images from each slice were acquired using a stimulated echo sequence with the following parameters: b-factors = 75, 499, 1,235, and 1,731 secs/mm2, Δ = 30 ms, TE = 46 ms, TR = 1,200 ms. Diffusion weighting is accomplished by applying a gradient magnetic field; in our measurements the gradient pointed along the rostrocaudal direction, and, therefore, ADCw was measured in this direction. Maps of ADCw were calculated using the linear least-squares method and analyzed using ImageJ software (W. Rasband, NIH, USA). The evaluated regions of interest were positioned using a rat brain atlas (Paxinos and Watson, 1998) and T2-weighted images in both the left and right hemispheres. The minimal area of an individual region of interest was 2.5 mm2. In each animal, we analyzed four coronal slices from the interval between 0.1 mm frontal to bregma and 5.6 mm caudal to bregma. The resulting eight values of ADCw (two regions of interest per slice, four slices/rat) were averaged to obtain a single representative value for comparison to other rats. The reproducibility of the ADCw measurements was verified by means of five diffusion phantoms placed on the top of a rat's head. The phantoms were made from glass tubes (inner diameter = 2.3 mm, glass type: KS80; Rückl Glass, Nizbor, Czech Republic) filled with pure (99%) substances having different diffusion coefficients. The substances were 1-octanol, n-undecane (Sigma Aldrich, Steinheim, Germany), isopropyl alcohol, n-butanol, and tert-butanol (Penta, Prague, Czech Republic). The temperature of the phantoms was maintained at a constant 37°C. The average diffusion coefficient for each compound was determined at the same time as the experimental measurements of each group of rats and compared with the average diffusion coefficient of the same compound measured in conjunction with the measurements of the other groups of rats.
Measurement of DC Potentials and Extracellular K+ Concentrations
The registration of cortical DC potentials is a powerful method to monitor the dynamics of sensory and cognitive processing in the brain under normal conditions and in the course of central nervous system disorders. DC potentials from the cortical surface were recorded by microelectrodes filled with 150 mmol/L NaCl, placed in the cortex, and connected to a high impedance buffer amplifier with Ag/AgCl wires. The common reference electrode was positioned on the nasal bone (Lehmenkühler et al, 1999). The signal was amplified and transferred to a PC using a Lab Trax acquisition system (World Precision Instruments Inc., Sarasota, FL, USA). The extracellular potassium concentration was measured by double-barreled K+-sensitive microelectrodes, as described in detail elsewhere (Syková et al, 1994). Briefly, the tip of the K+-selective barrel of the microelectrode was filled with the liquid ion-exchanger Corning 477317 and back-filled with 0.5 mol/L KCl, whereas the reference barrel contained 150 mmol/L NaCl. Electrodes were calibrated in a sequence of solutions containing 2, 4, 8, 16, 32, and 64 mmol/L KCl, with a background of either 151, 149, 145, 137, 121, or 89 mmol/L NaCl to keep the ionic strength of the solution constant. The data were fitted to Nikolsky equation to determine the electrode slope and interference. Based on these electrode characteristics, the measured voltage was converted to extracellular concentrations.
Statistical Analysis
The results of the experiments are expressed as mean ± s.e.m. Statistical analysis of the differences within and between groups was performed using a two-tailed Mann-Whitney test (InStat; GraphPad Software, San Diego, CA, USA). Values of P < 0.05 were considered significant.
Results
Extracellular Diffusion Parameters
The ECS diffusion parameters were recorded in cortical layer IV or V (at depths of 1,200 to 1,500 μm) of the somatosensory cortex before and after 10 or 15 mins of ischemia. The mean values of extracellular volume fraction, α, and tortuosity, Λ, during normoxia were similar in both ischemia groups (α = 0.19 ± 0.01, Λ = 1.55 ± 0.01 and α = 0.19 ± 0.01, Λ = 1.55 ± 0.02) and comparable to the values found in previous in vivo studies (Nicholson and Phillips, 1981; Lehmenkühler et al, 1993; Voříŝek and Syková, 1997a, b ; Mazel et al, 2002). During ischemia, α decreased to 0.07 ± 0.01 in both groups, whereas Λ increased to 1.80 ± 0.02 and 1.81 ± 0.02 in the 10 and 15 mins ischemia groups, respectively. After releasing the clamps and reoxygenation in the rats subjected to 10 mins of ischemia, recovery to preischemic values of α = 0.21 ± 0.01 were found after 15 to 20 mins of reperfusion; the values then remained stable during the entire measurement period of 90 mins. After ischemia of 15 mins duration, α recovered within 10 to 15 mins of reperfusion, but then increased substantially within a further 30 to 40 mins up to 0.29 ± 0.03 and remained elevated during the postischemic measurement period of 90 mins. This indicates an ECS enlargement of 40% to 50% in the somatosensory cortex of rats subjected to longer (15 mins) ischemia. (see Figure 1, Table 1). The statistical difference between the pre- and postischemic values of α was extremely significant (0.19 ± 0.01 versus 0.29 ± 0.03, P < 0.001). Typical diffusion curves recorded before and 60 mins after ischemia of 10 or 15 mins are shown in Figure 2.
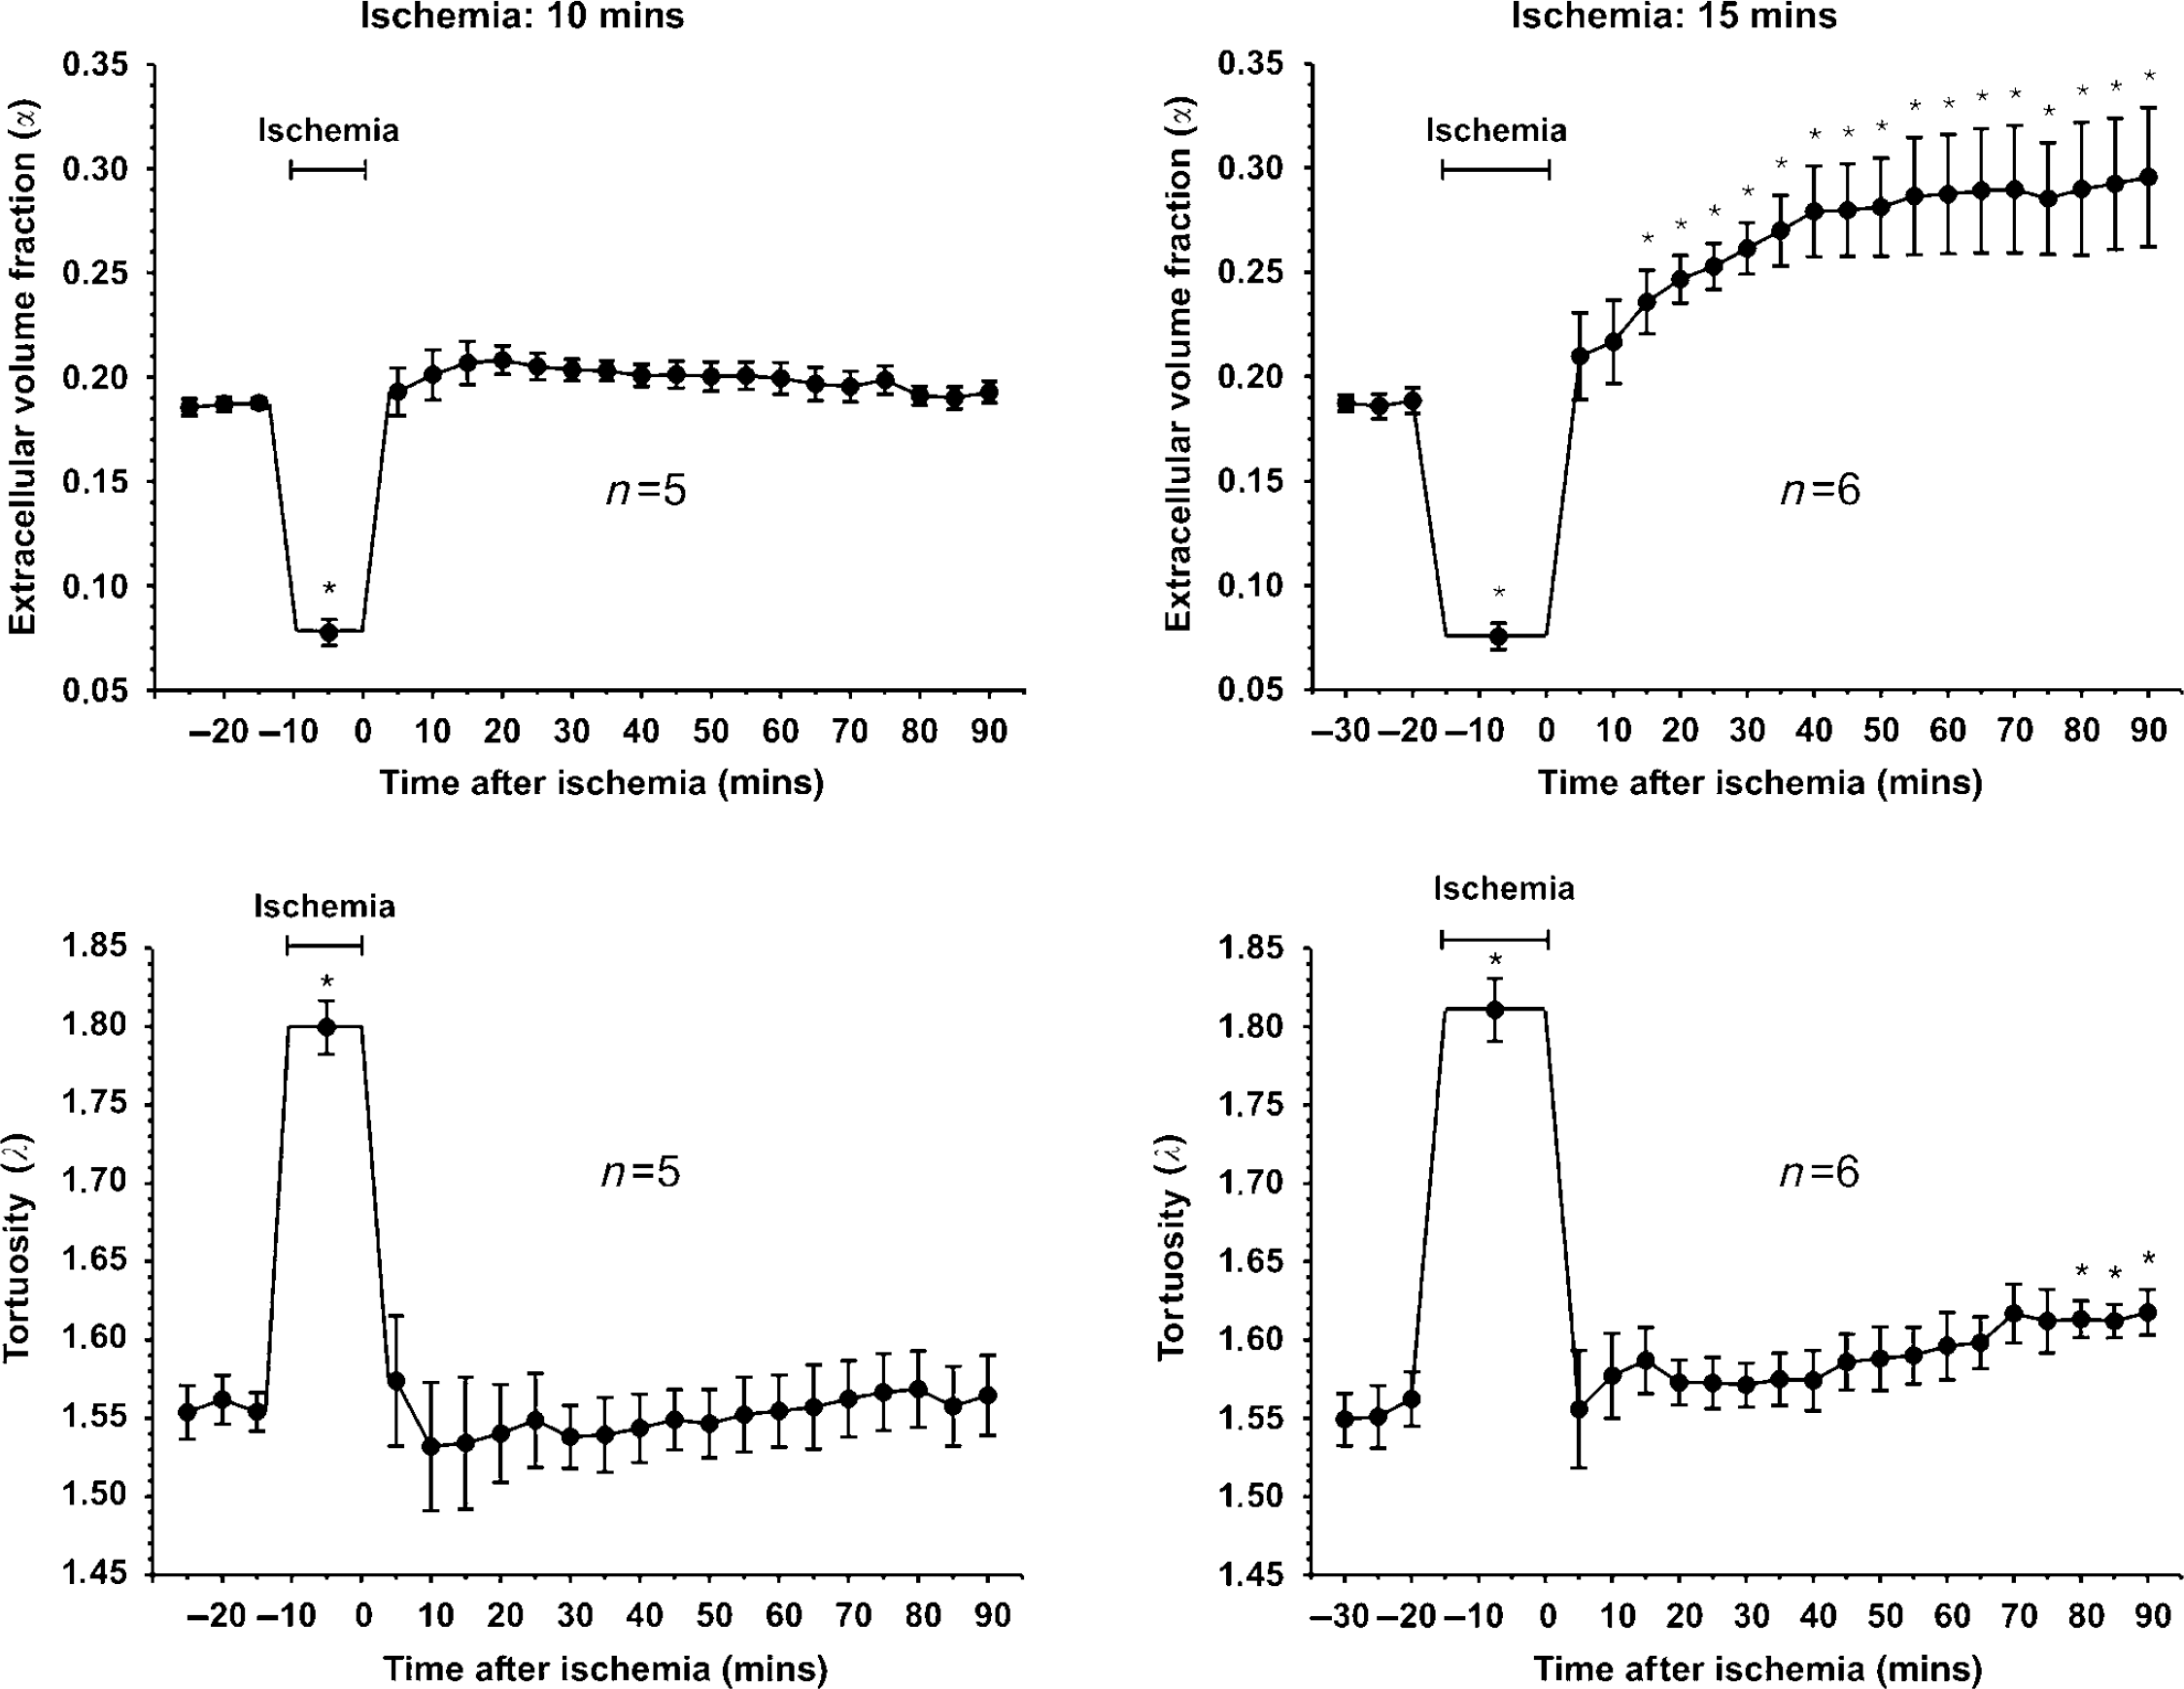
Time course of changes in the values of the extracellular space parameters (α, Λ) in the cortex of adult rats before, during, and after ischemia of 10 or 15 mins duration, calculated from TMA+ diffusion measurements. Data are shown as mean values ± s.e.m. and the number of animals as n. The duration of ischemia is marked by a time line. Upper graphs: average values of extracellular volume fraction (α). After 10 mins ischemia, a quick recovery of α occurs within 5 to 10 mins and the values remain stable at this level. In the group subjected to 15 mins ischemia, α increases extremely significantly above starting values after 40 mins of reperfusion (P < 0.001) and remains at this level until the end of the measurement period. *Postischemic values that are significantly different from preischemic values (P < 0.05). Lower graphs: the time courses of tortuosity (Λ) initially showed no difference between the two groups (P < 0.05). During ischemia, an elevated Λ recovered to the starting values within 5 mins and stayed at this level without any significant difference from preischemic values. In the group of 15 mins ischemia, Λ increased significantly at the end of the registration period.
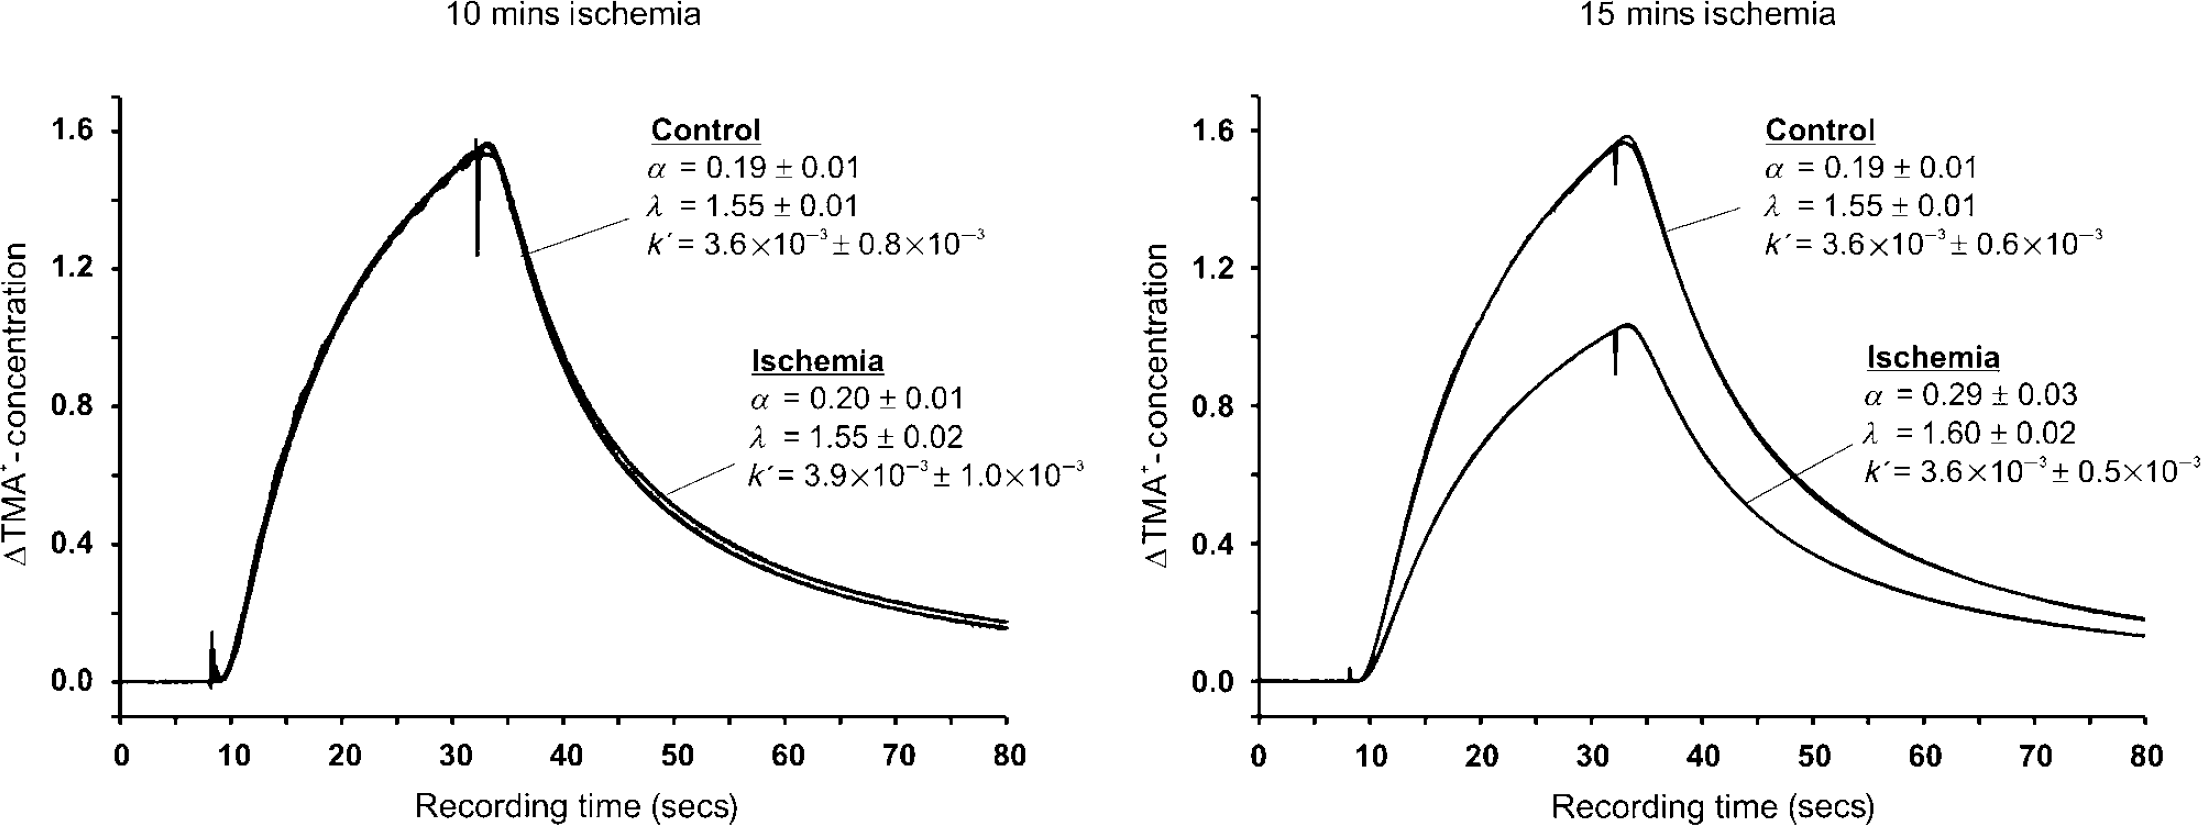
Example of recorded diffusion curves and superimposed theoretical curve fittings as time—concentration plots before (control) and 60 mins after ischemia (ischemia) of 10 or 15 mins duration. Total recording time was 80 secs for each diffusion curve. After 8 secs, the main bias was elevated for 24 secs to 120 nA to apply TMA+ by iontophoresis. Changes in the diffusion properties after ischemia compared with preischemic conditions were found only in the group subjected to 15 mins ischemia.
Values of extracellular volume fraction (α) and tortuosity (Λ) and nonspecific uptake (k′) before and after transient ischemia of 10 or 15 mins duration
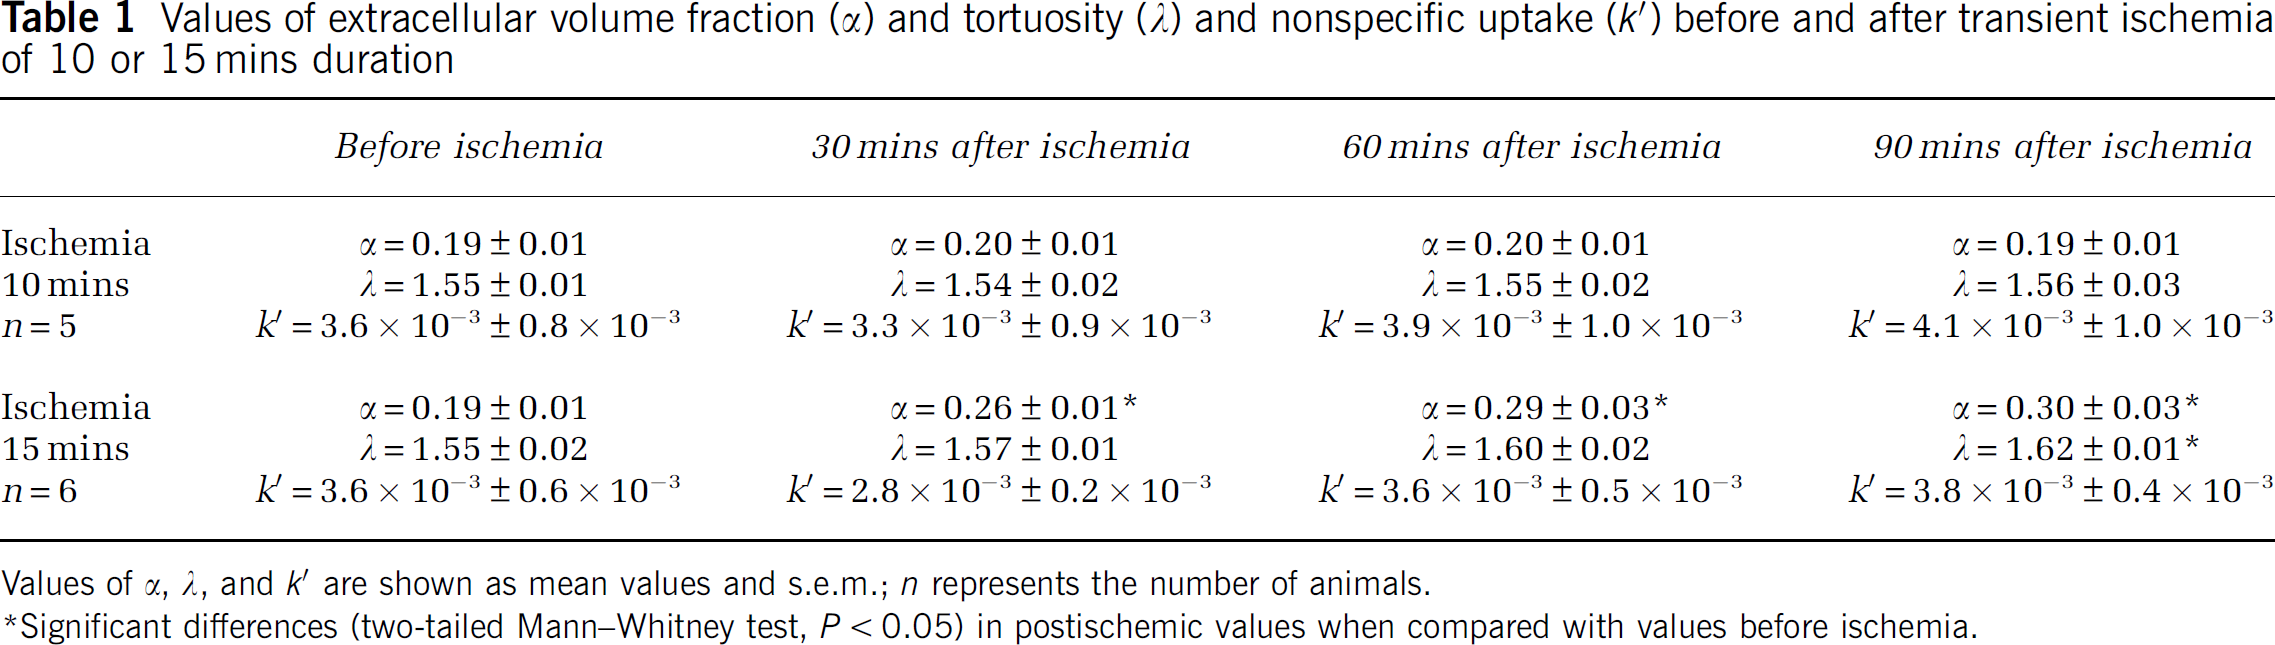
Values of α, Λ, and k′ are shown as mean values and s.e.m.; n represents the number of animals.
Significant differences (two-tailed Mann—Whitney test, P < 0.05) in postischemic values when compared with values before ischemia.
In both groups, preischemic values of Λ were observed after 5 to 10 mins of reperfusion (10 mins ischemia: Λ = 1.57 ± 0.04; 15 mins ischemia: Λ = 1.56 ± 0.04). In the group subjected to 10 mins ischemia, Λ remained stable at this level. In the group subjected to 15 mins ischemia, a marginally significant increase in Λ to 1.62 ± 0.01 was found at the end of our measurement period. The time course of Λ after ischemia in both groups is shown in Figure 1.
Magnetic Resonance Imaging Measurements
Diffusion-weighted MRI measurements of ADCw were performed bilaterally in the primary somatosensory cortex and showed similar preischemic values in both groups (597 ± 14 versus 594 ± 12 μm2/sec). In the group of 10 mins ischemia, no significant changes in ADCw in the postischemic period were found, compared with preischemic values. In the animals exposed to 15 mins ischemia, a statistically significant increase in ADCw to 665 ± 15 μm2/sec was observed 60 mins after ischemia. This elevated ADCw level remained until the end of the measurement period, 120 mins after ischemia (Table 2). Typical MRI images before and after ischemia are shown in Figure 3. As the carotid occlusion was performed outside the magnet, we did not measure ADCw values during ischemia. However, it is known from previous studies that global ischemia induces a rapid decrease in ADCw (Fisher et al, 1995; Van der Toorn et al, 1996).
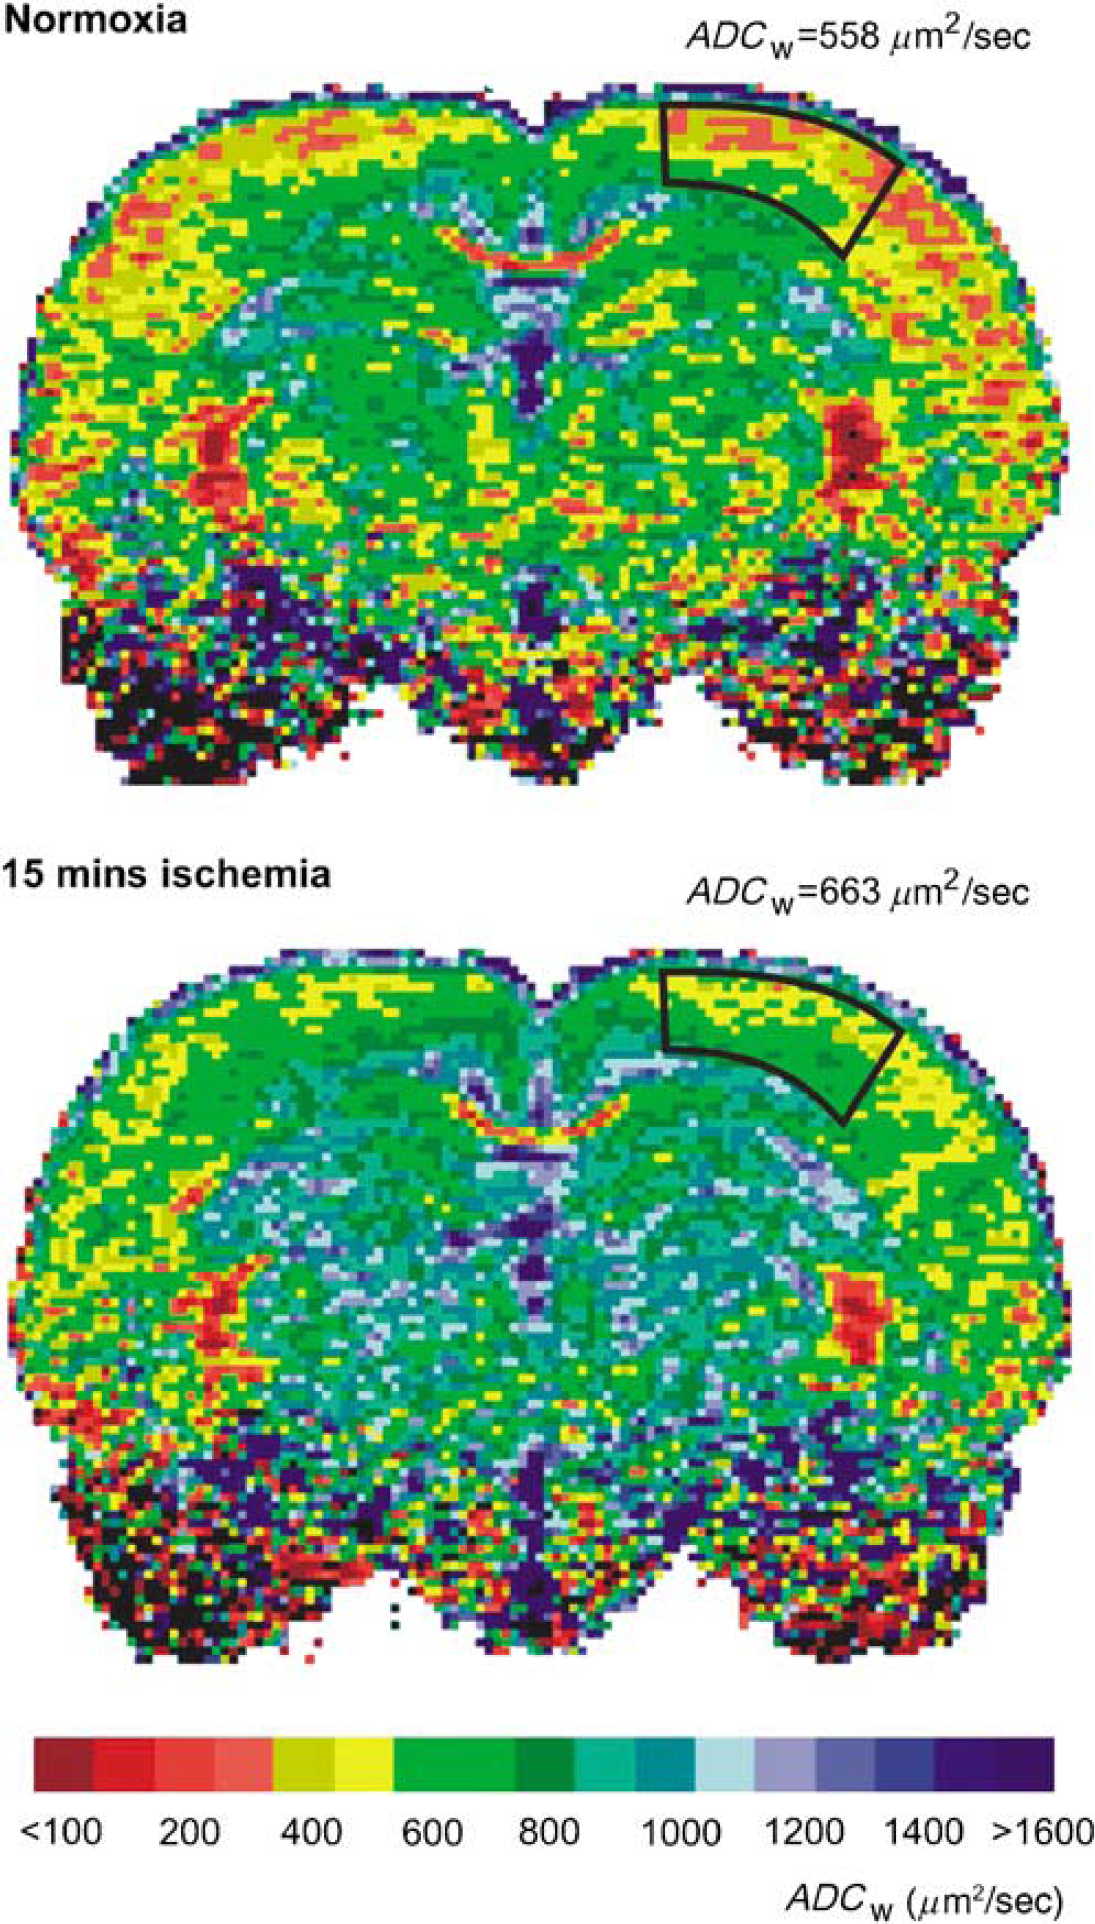
Typical ADCw maps of a control rat brain and of a rat brain 60 mins after ischemia of 15 mins duration. ADCw was analyzed bilaterally in the primary somatosensory cortex. The areas are outlined on the left part of the slices, and both images are from the same coronal plane. The scale at the bottom of the figure shows the relation between the intervals of ADCw values and the colors used for visualization.
The apparent diffusion coefficient of water (ADCw) before and after 10 or 15 mins of ischemia was determined by magnetic resonance imaging
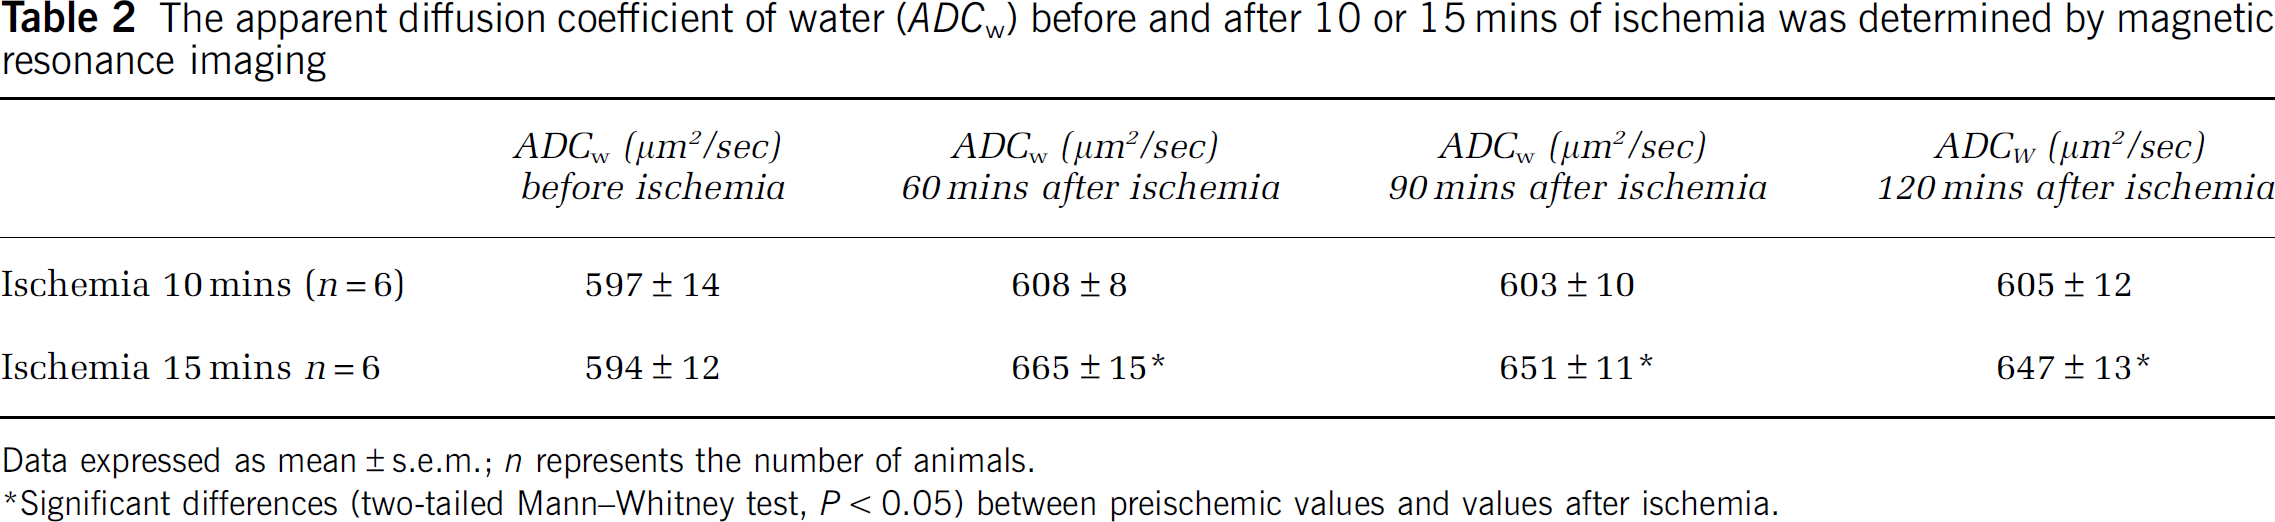
Data expressed as mean ± s.e.m.; n represents the number of animals.
Significant differences (two-tailed Mann—Whitney test, P < 0.05) between preischemic values and values after ischemia.
DC Potentials and Extracellular Potassium Concentrations
Before the induction of ischemia, extracellular potassium concentrations of 3 mmol/L were found in both groups. During 1 to 2 mins of ischemia, a rapid increase up to 70 mmol/L was registered, and the concentration remained stable at this level during the ischemic period in both 10 and 15 mins ischemia groups. After reoxygenation, the extracellular potassium concentrations decreased within 2 to 3 mins to preischemic levels of 3 mmol/L. The DC potential changed in a negative direction simultaneously with the increase in extracellular potassium, followed by a small positive change. During the ongoing ischemia the DC potential showed a slight increase. Immediately after reopening of the carotid arteries and ventilation with pure oxygen, the DC potential showed a sharp negative shift, and after the normalization of extracellular potassium concentrations, DC potentials recovered to preischemic levels. Typical measurements of extracellular potassium concentrations and DC potentials during ischemia of 10 and 15 mins duration are shown in Figure 4.
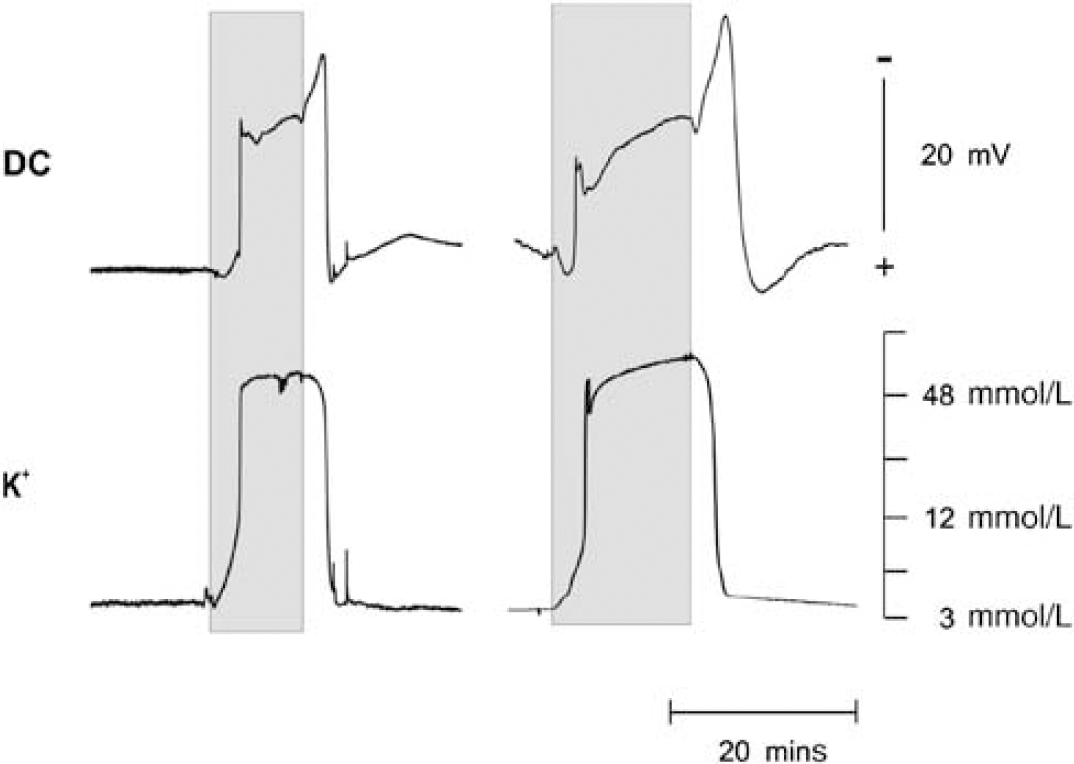
Time course of extracellular potassium concentrations and DC potentials during an ischemia of 10 mins (left side) or 15 mins (right side) duration. The duration of ischemia is marked by the shaded fields.
Discussion
Diffusion in the ECS is an important mode of communication between brain cells, and many acute pathologic processes in the CNS (i.e., hypoxia, ischemia, seizures, and hypoglycaemia), accompanied by cellular swelling, can affect the ADC of neuroactive substances. We have previously reported that ECS diffusion parameters are altered not only during transient focal hypoxia/ischemia, but also during recovery from this insult (Homola et al, 2006). Although a substantial amount of data obtained by DWI-MRI exist on extra- and intracellular diffusion in areas affected by an ischemic/hypoxic insult, the absolute values of the extracellular diffusion parameters measured in the brain cortex during recovery from hypoxia/ischemia have not been available. Up to now, the only values of the ECS diffusion parameters or values of ADCw obtained in the rat cortex under hypoxic/ischemic conditions have been reported from experiments using a terminal anoxia model (Van der Toorn et al, 1996; Lundbaek and Hansen, 1992; Syková et al, 1994). In our study, we have evaluated the changes in ECS diffusion parameters after transient global hypoxia/ischemia. These parameters were studied over the course of 90 mins after an ischemic/hypoxic insult and were correlated with changes in ADCw, DC potential, and extracellular potassium concentration.
Cellular swelling during cerebral ischemia has been described by several authors and is mainly a consequence of massive ionic fluxes across cell membranes, accompanied by the movement of water, and develops concomitantly with ionic shifts (McKnight and Leaf, 1977; Hansen and Olsen, 1980; Syková et al, 1994). The swelling occurs quickly after the interruption of the energy supply, but never before a rise in K+ and changes in pH (Syková et al, 1994). The dependence of ECS shrinkage because of cellular swelling on ionic changes was also seen in our experiments, and it was observed that a normalization of elevated K+ leads to a quick normalization of ECS volume and tortuosity. The recovery in extracellular potassium concentration and DC potential indicates a sufficient supply of oxygen and substrates after ischemia. During recovery from longer lasting global ischemia, a significant increase in the extracellular volume fraction α developed within 60 mins, probably caused by an increase in extracellular water content. Similar time courses of ECS volume and tortuosity changes were observed in the spinal cord during recovery from ischemia (Syková et al, 1994). The postischemic increase in α, which was observed in this study, was promoted by bilateral carotid occlusion and a reduction in cerebral blood flow. It has been shown that hypoxia of 30 mins duration without carotid occlusion lead to a small decrease in α, followed by rapid normalization during recovery (Zoremba et al, 2007). In contrast to these findings, hypoxia of 30 mins duration with unilateral carotid occlusion results in a decrease in α followed by an increase during recovery to about 20% above the original normoxic values (Homola et al, 2006). Based on the results from our study, together with the results from earlier studies, it could be suggested that in addition to the degree and duration of hypoxia, cerebral blood flow also influences the extent of damage. The increase in ECS volume fraction after reperfusion correlates well with changes in the ADC of brain water. In our study, the values of ADCw obtained 60 and 90 mins after reperfusion were significantly elevated, suggesting an increased amount of water in the ECS where ADCw was reported to be higher, compared with the intracellular compartment (Van Zijl et al, 1991). A correction of orientational dependence was not necessary because it is known from previous studies that there is no significant anisotropy in the cerebral cortex of the rat brain (Voříšek and Syková, 1997a, b ). In an earlier study, full recovery of the diffusion constant of brain water after 12 mins of incomplete global ischemia was found (Davis et al, 1994). The results are comparable to the results in our 10 mins ischemia group. In contrast to this earlier study, we also reduced the oxygen content to 6% and therefore a more severe ischemia resulted. These observations support the hypothesis that a certain level of ischemia severity has to be exceeded before cerebral edema develops.
It is well known that after ischemia, functional damage of the blood—brain barrier occurs (Betz et al, 1989; Qiao et al, 2001) and the hypoxic-ischemic insult initiates a series of events that lead to the disruption of tight junctions and increased permeability mediated by cytokines, vascular endothelial growth factor, and nitric oxide (Ballabh et al, 2004). Because of increased permeability, reperfusion may lead to an early postischemic increase in cerebral water content and to the formation of cortical edema of ‘vasogenic’ origin (Papadopoulos et al, 2005). These changes could also be caused by elevated postischemic tissue osmolarity (Gisselson et al, 1992) or postischemic shrinkage of nerve cells. It is evident that an ischemia of 10 mins duration is too short to initiate a cascade of events that lead to the disruption of the blood—brain barrier and the development of vasogenic edema. This hypothesis was supported by the different time courses of the DC potential recovery between the two groups. During ischemia, an increase in extracellular potassium levels up to 70 mmol/L was registered, whereas recovery in both groups was comparable within a few minutes. In comparing the DC potentials, a longer recovery period was necessary in animals subjected to an ischemia of 15 mins. These findings indicate that the cellular energy state is affected in the same way in both groups, but that the intercellular integrity because of neurotoxicity was more affected in the group subjected to longer ischemia. Additionally, the longer lasting extracellular potassium increase could have direct effects or modulate the influence of cytokines, vascular endothelial growth factor, and nitric oxide on the blood—brain barrier.
During reperfusion in the group with longer ischemia, the extracellular volume fraction increased within 40 to 50 mins and remained elevated by about 40% to 50% above the normoxic values, whereas the tortuosity was initially similar to preischemic values, increasing significantly at the end of our registration period. It could be expected that the increase in ECS volume would facilitate extracellular diffusion, but our results show a small increase in tortuosity, indicating a diffusion hindrance and an effect on volume transmission. One reason for this hindered diffusion could be released macromolecules and fixed surface charges, which affect free diffusion by charge-dependent bonding or by van der Waals forces. Increased viscosity impedes molecular movement and is affected by the size and nature of the diffusing molecules and results in their hydrodynamic interactions with macromolecules and fixed charges and the boundaries that define pore structures. The change in tortuosity, Λ, is influenced by many factors that cannot be presently separated. These factors might include membrane barriers, myelin sheaths, macromolecules, molecules with fixed negative surface charges, ECS size, and pore geometry. As a result, Λ could be changed if certain pathways through the ECS are either blocked off or opened up (Syková et al, 2000). Many studies have shown that Λ and α can change independently during the exposure of brain slices to dextran (Hrabetova and Nicholson, 2000), during X-irradiation (Syková et al, 1996), or during osmotic stress (Krizaj et al, 1996; Nicholson and Syková, 1998; Chen and Nicholson, 2000; Kume-Kick et al, 2002).
We have shown changes in the extracellular diffusion parameters that may affect the diffusion of various substances (ions, neurotransmitters, metabolites, and drugs) in the affected region. Our results show that after ischemia of 15 mins, and most likely after longer periods, the observed changes in the ECS diffusion parameters are not reversible during 90 mins of reperfusion and result in long-lasting and severe edema and perhaps permanent damage. Studies using longer ischemic and postischemic periods are needed to further clarify the crucial time point between reversible and irreversible effects induced by oxygen deficiency.