
Abstract
The ischemic penumbra is defined as tissue with flow within the thresholds for maintenance of function and of morphologic integrity. Penumbra tissue has the potential for recovery and therefore is the target for interventional therapy in acute ischemic stroke. The identification of the penumbra necessitates measuring flow reduced less than the functional threshold and differentiating between morphologic integrity and damage. This can be achieved by multitracer positron emission tomography (PET) and perfusion-weighted (PW) and diffusion-weighted magnetic resonance imaging (DW-MRI) in experimental models, in which the recovery of critically perfused tissue or its conversion to infarction was documented in repeat studies. Neuroimaging modalities applied in patients with acute ischemic stroke—multitracer PET, PW-and DW-MRI, single photon emission computed tomography (SPECT), perfusion, and Xe-enhanced computed tomography (CT)—often cannot reliably identify penumbra tissue: multitracer studies for the assessment of flow and irreversible metabolic damage usually cannot be performed in the clinical setting; CT and MRI do not reliably detect irreversible damage in the first hours after stroke, and even DW-MRI may be misleading in some cases; determinations of perfusion alone yield a poor estimate of the state of the tissue as long as the time course of changes is not known in individual cases. Therefore, the range of flow values in ischemic tissue found later, either within or outside the infarct, was rather broad. New tracers—for example, receptor ligands or hypoxia markers—might improve the identification of penumbra tissue in the future. Despite these methodologic limitations, the validity of the concept of the penumbra was proven in several therapeutic studies in which thrombolytic treatment reversed critical ischemia and decreased the volume of final infarcts. Such neuroimaging findings might serve as surrogate targets in the selection of other therapeutic strategies for large clinical trials.
Keywords
The ischemic penumbra was defined by Astrup et al. (1981) as brain tissue perfused at a level within the thresholds of functional impairment and morphologic integrity, which has the capacity to recover if perfusion is improved. Because tolerance of tissue to ischemic damage is dependent on residual flow and duration of flow disturbance (Heiss and Rosner, 1983), the ischemic penumbra is a dynamic process; it exists for a short period even in the center of ischemia, from which the conversion into irreversible necrosis propagates over time to the neighboring tissue. This also makes the time window of therapeutic opportunity variable and ill-defined; it is very short for the core of ischemia and may extend to several hours in the moderately ischemic surrounding tissue. The concept of the ischemic penumbra has been developed from animal experiments. Its transfer to the clinical situation requires the definition of three critical values that can usually not be assessed easily in the acute stages of ischemic stroke: (1) the flow threshold for functional impairment—to identify functionally impaired tissue; (2) the flow threshold for morphologic damage—to identify irreversibly damaged tissue; (3) the time period a tissue tolerates flow decreased to a certain value before it becomes irreversibly damaged—to predict recovery of function with reperfusion.
The ischemic cell damage involves a cascade of molecular and biochemical mechanisms (Siesjö, 1992; Pulsinelli, 1992; Choi, 1998) that usually cannot be assessed in stroke patients. Such processes might contribute to the propagation of ischemic damage beyond the primarily critically perfused area and might be responsible for delayed growing of infarcts (Barone and Feuerstein, 1999; Schulz et al., 1999; Dirnagl et al., 1999). The contribution of these delayed mechanisms to the extent of the final infarcts in human stroke is still controversial (Heiss et al., 1999).
EXPERIMENTAL BASIS OF THE ISCHEMIC PENUMBRA
Experiments in models of ischemia led to the definition of two thresholds: one for functional impairment and the other for morphologic damage, with the penumbra tissue perfused between these two values (Astrup et al., 1981).
The functional threshold was demonstrated in monkeys exposed to ischemia. A reduction in blood flow led to the gradual development of a neurologic deficit, progressing from mild pareses at a flow rate of 22 mL/100 g·min to complete paralysis at a rate of 8 mL/100 g·min (Jones et al., 1981). Concurrently, the electrocorticogram and evoked potentials vanished at a flow rate of 15 to 20 mL/100 g·min (Sharbrough et al., 1973; Branston et al., 1974) and the spontaneous activity of cortical neurons disappeared at approximately 18 mL/100 g·min (Heiss et al., 1976). There was a large variability in the functional threshold of individual neurons, indicating selective vulnerability (Heiss and Rosner, 1983).
Biochemical substrates and markers show similar threshold dependencies. However, the pattern is more complex and the threshold values fall within a broader range, suggesting a specific role of individual metabolites in the development of ischemic injury (Hossmann, 1994). With declining flow rates (from the normal cortical values of 60 to 100 mL/100 g·min, depending on species), protein synthesis is inhibited at approximately 55 mL/100 g·min, followed by the stimulation of anaerobic glycolysis at 35 mL/100 g·min, the release of neurotransmitters and the disturbance of energy metabolism at approximately 20 mL/100 g·min, and finally the terminal depolarization and concomitant potassium efflux at 6 to 15 mL/100 g·min.
Whereas neuronal function is impaired immediately after blood flow drops below the threshold, the development of irreversible morphologic damage is time dependent. Once morphologic damage becomes apparent, the initially reversible functional deficit develops into a persistent defect. Numerous studies have investigated the duration that brain tissue or individual cells can tolerate ischemia of a given intensity.
The interaction of severity and duration of ischemia in the development of irreversible cell damage was studied by simultaneous recordings of cortical neuronal activity and local blood flow in cats (Heiss and Rosner, 1983). The worst possible constellations of residual blood flow and duration of ischemia that still permit neuronal recovery are blood flow rates of approximately 0, 10, and 15 mL/100 g·min maintained for periods of 25, 40, and 80 minutes, respectively. Between 17 and 18 mL/100 g·min, the duration of tolerated ischemia tends to infinity, indicating that this flow state can lead to morphologic damage but only if maintained for very long periods of time.
Differences between species must be taken into consideration when experimental results are compared. In monkeys and cats, large infarcts develop with residual flow rates of 12 mL/100 g·min lasting for 2 to 3 hours (Jones et al., 1981; Marcoux et al., 1982) and individual cells may become necrotic at lower flow values after shorter periods of time (Pulsinelli et al., 1982). However, middle cerebral artery occlusion (MCAO) in rats induces selective neuronal necrosis in the caudate-putamen after only 15 minutes, localized infarcts in the caudate-putamen and selective neuronal necrosis in the neocortex after 30 minutes, and cortical infarcts after 60 minutes. With an occlusion time of 120 to 180 minutes, infarct size increases and reaches that found after permanent MCAO (Memezawa et al., 1992).
Penumbra tissue has suffered blood flow reduction to the point of electrophysiologic silence and transient, recurrent losses of membrane ion gradients and energy metabolites (Ginsberg and Pulsinelli, 1994). In such tissue, blood flow is decreased below the metabolic demand, but energy metabolism is maintained at a level allowing morphologic preservation of tissue. However, continuing ischemic stress, or additional energy demanding episodes, or both, will exhaust this limited capacity and transform penumbra into necrotic tissue.
Several factors were identified that contribute to the transversion of penumbra tissue into infarction in specific experimental models; in the ischemic core, the tissue depolarizes permanently within a few minutes. Waves of transient neuronal depolarizations resembling spreading depression are regularly seen in periinfarct tissue, especially in such animals as rats and gerbils. A significant correlation was detected between infarct volume and number of depolarizations in rats (Mies et al., 1993). Depolarization waves impaired metabolic reserve capacity, increased areas of irreversible damage in rats (Takano et al., 1996; Busch et al., 1996), and led to permanent depolarization in tissue surrounding the core of ischemia in cats (Saito et al., 1997). Spreading depression-like depolarizations have not yet been demonstrated in the penumbra of stroke patients, and their contribution to the propagation of human infarcts remains a matter of speculation. The other biochemical and molecular processes suspected as key factors in the propagation of ischemic damage in special experimental models still cannot be assessed in patients. The influx of Ca++ into cells, the release of excitatory amino acids, and the activation of receptors and receptor-operated ion channels are key mechanisms in the biochemical cascade leading to tissue damage (Siesjö, 1992; Choi, 1998). However, despite some methodologic advances in labeling Ca++ channels (Hakim and Hogan, 1991), their well-established effects in experimental models cannot be used for the imaging of ischemically compromised tissue in human stroke. The contribution of many other factors to immediate or delayed damage was well documented in specified experimental models (Barone and Feuerstein, 1999; Schulz et al., 1999; Dirnagl et al., 1999) and formed the basis for enthusiastic hopes for stroke therapy. However, their role in the development and propagation of human infarcts is not established, and all therapeutic interventions targeting these mechanisms were without clinical efficacy (Grotta, 1994; Lees, 1998; Dorman et al., 2000).
METHODS FOR IMAGING THE PENUMBRA IN HUMANS
The assessment of the three criteria relevant for imaging penumbra tissue in the clinical setting is extremely difficult, as most markers used in experimental studies necessitate invasive procedures and therefore cannot be determined in patients. Furthermore, most techniques used in clinical routine do not provide information on the viability of tissue early after stroke, and techniques that do allow assessment of several physiologic variables (for example, positron emission tomography (PET), single photon emission computed tomography (SPECT), Xe-enhanced X-ray computed tomography (Xe-CT), diffusion-and perfusion-weighted magnetic resonance imaging (DW-and PW-MRI), and magnetic resonance spectroscopy (MRS)) are logistically complex and not well suited for routine applications. In addition, clinical studies of the few accessible physiologic variables contributing to the complex process of ischemic tissue damage are restricted to incidental time points in the course of the disease. The complicated logistics involved in the regional determination of physiologic variables prevent their repeated evaluation early after an ischemic attack, which is when the fate of the patient is decided. Therefore, a gap exists between the results obtained at well-defined, but usually singular, time points in animal experiments and the findings collected incidentally in patients at various times after the onset of stroke. With PET and MRI, animal experiments can be performed in acute focal ischemia, and the regional changes in physiologic variables can be followed from a control before the vascular occlusion to the permanent defective state; these can then be related to histologic alterations. However, the interaction between experimental and clinical applications differed between the two methods. Only with recent advances in detector technology did it become feasible to study brains of (middle-sized) animals by PET. Therefore, PET results from experimental models were used to interpret findings from previous multitracer studies in patients with acute stroke and to test effects of therapeutic interventions. New signal sequences developed for advanced MRI were first tested in animal models. The promising results in focal ischemia (Moseley et al., 1990) led to the introduction of these procedures to the evaluation of patients with acute strokes.
POSITRON EMISSION TOMOGRAPHY
Experimental studies
Pathophysiologic changes occurring during the early period after focal ischemia can be followed by multitracer PET, which provides quantitative maps of several important physiologic variables—including regional cerebral blood flow (rCBF), regional cerebral blood volume (rCBV), regional cerebral metabolic rate of oxygen (rCMRO2), and regional cerebral metabolic rate of glucose (rCMRglc). With advanced PET equipment, changes in these physiologic variables were studied after occlusion of the middle cerebral artery (MCA) in baboons and cats. Tenjin et al. (1992) observed a severe reduction of CBF (<18 mL/100 g·min) and a significant increase of oxygen extraction fraction (OEF) 1 hour after occlusion in the core of ischemia, and a decrease in OEF 9 hours after occlusion. However, Pappata et al. (1993) reported that the decrease of CBF in the territory of the occluded vessel in baboons was not as severe (21% at 1 hour and 31% at 3 to 4 hours after occlusion). CMRO2 was variable and declined 3 to 4 hours after MCA occlusion, but was only moderately reduced in regions with maximal OEF, suggesting prolonged viability. Changes of CMRO2 occurred earlier and were more severe in the deep MCA territory than in the cortical regions, and follow-up studies after permanent MCAO (Touzani et al., 1995) show that mainly acutely misery perfused tissue within the deep MCA territory went on to infarction, whereas cortical regions were preserved. The infarcts in this model increased in size over several days. Infarction could be prevented when MCA was reopened at 6 hours (Young et al., 1996), and the volume of the final infarction was significantly smaller in temporary occlusion than in permanent occlusion (Touzani et al., 1997; Young et al., 1997). These experiments clearly demonstrated the existence of viable (penumbra) tissue for prolonged periods of hypo-(misery) perfusion. The window of opportunity for reperfusion in this model was much longer than in other monkey studies (Jones et al., 1981; Tenjin et al., 1992). This might be because of the rather moderate and delayed flow decrease achieved by MCAO in this experimental setup, which primarily affects the deep MCA territory and widely spares cortical areas.
In the cat, changes after MCAO are immediate and severe. Sequential studies of CBF, CMRO2, and CMRglc from a control before to the endpoint 24 hours after MCA occlusion (Heiss et al., 1994) recorded an immediate decrease of CBF within the MCA territory to < 30% of control upon arterial occlusion. CMRO2 was less diminished and was preserved at an intermediate level. Consequently, OEF was increased, indicating misery perfusion. This ischemic penumbra spread with time from the center to the borders of the MCA territory (Fig. 1). In most instances, the misery perfusion condition was followed by a marked decrease in OEF, reflecting progressive impairment of metabolism and suggesting transition to necrosis spreading from the core to the periphery of the ischemic territory. The infarcts were more or less complete 18 to 24 hours after MCAO. Occasionally, spontaneous collateral reperfusion resolved the penumbra condition and the morphologic integrity of the cortex was preserved.
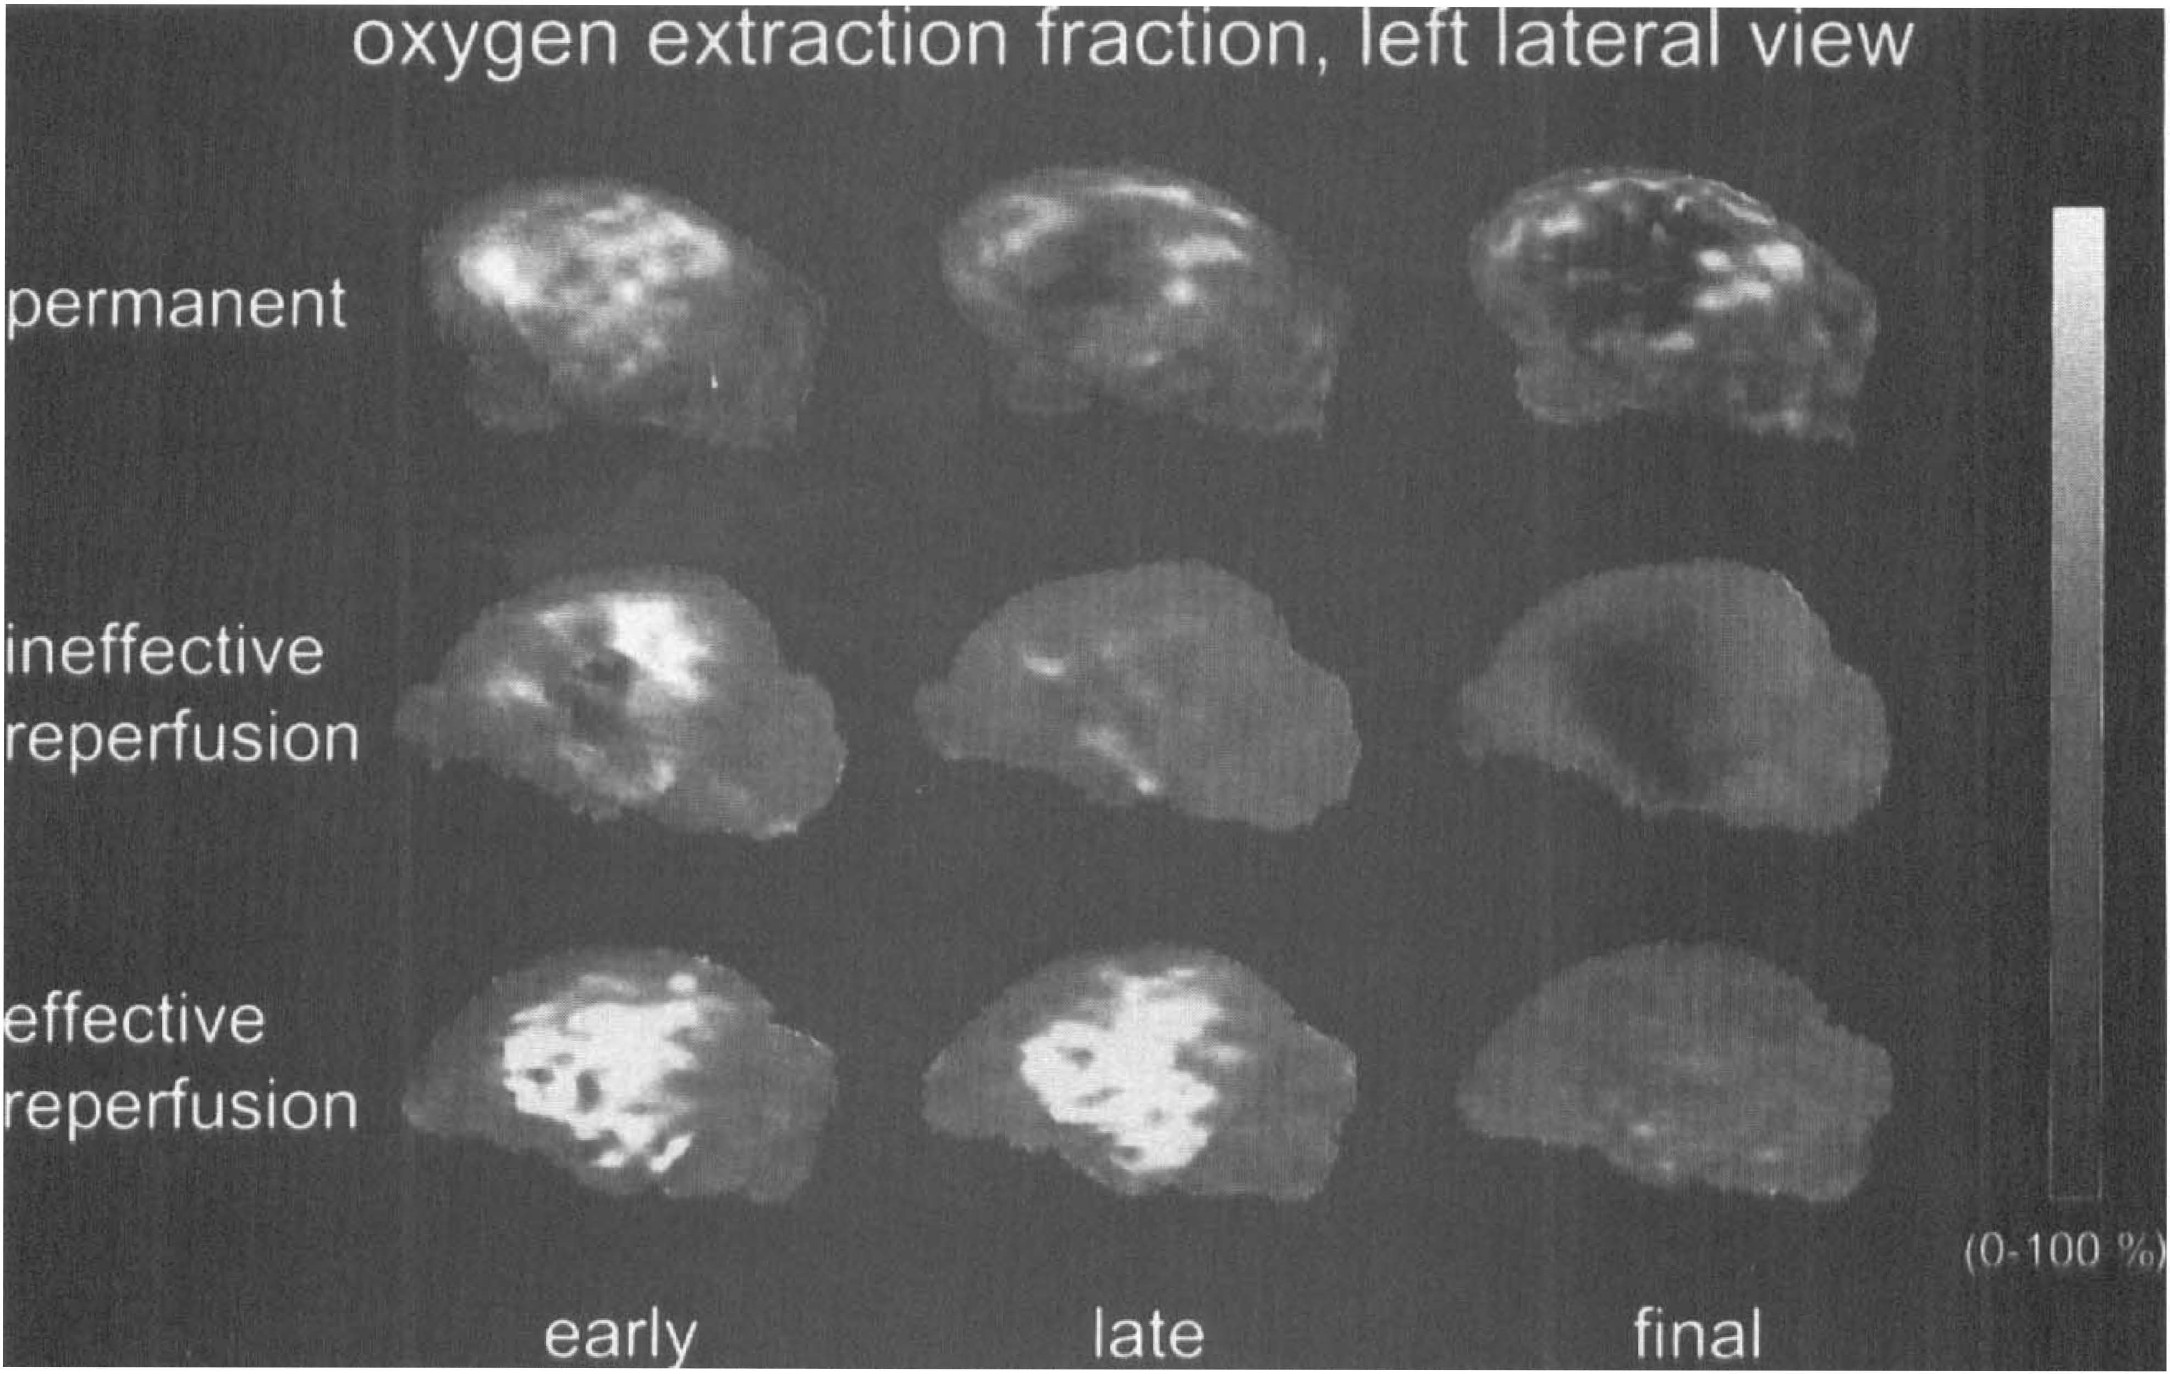
Reconstructed surface view of left hemispheric oxygen extraction fraction (OEF) in three cats after permanent or transient occlusion of the middle cerebral artery. Increased OEF indicates penumbra tissue, decreased OEF identifies irreversible tissue damage. Centrifugal conversion of penumbra into irreversible damage in permanent occlusion, reperfusion can only reverse penumbra and prevent damage as long as increased OEF indicates tissue viability.
Reversible MCAO was studied in cats by reopening the MCA after 30, 60, and 120 minutes (Heiss et al., 1997). All cats survived 30 minutes of MCAO without developing infarcts. During 60 minutes of MCAO, OEF remained elevated throughout the ischemic episode in animals surviving 24 hours of reperfusion, which was efficient in preventing large infarcts involving cortical areas (Fig. 1). In contrast, the initial OEF increase disappeared during 60 minutes of ischemia in those cats that died during the reperfusion period. Extended postischemic hyperperfusion accompanied large reductions in CMRO2 and rCMRglc, large infarcts developed, and intracranial pressure increased fatally. These results highlight the importance of the severity of the ischemia in relation to its duration for the further course after reperfusion (Heiss and Rosner, 1983). A comparison with clinical findings may be justified (Figs. 1 and 2). Permanent MCAO resembles the natural course after vascular occlusion, leading to large infarcts in most cases, with a chance of collateral reperfusion that may resolve the misery perfusion and improve the outcome. Reopening of the MCA resembles the (spontaneous) dissolution of vascular occlusions in transient ischemic attacks, spontaneous lysis of emboli within the tolerable time period, and therapeutic thrombolysis. In the cat experiments, reperfusion after 30 minutes of MCAO led to a short hyperperfusion period and to a fast normalization of flow and metabolism; this may be comparable to a transient ischemic attack. During longer lasting MCAOs, two patterns can be distinguished (Fig. 1): a decrease of the OEF during the MCAO reflects fast irreversible damage of tissue, whereas a persistence of elevated OEF indicates preserved viability of tissue over the ischemic period. Forced reperfusion by reopening the MCA cannot salvage irreversibly damaged tissue, but may cause additional damage by inducing edema through leaking vascular endothelium. In such cases, the infarcts are large and animals die early because of increased intracranial pressure. These courses resemble the deleterious outcome of thrombolytic therapy that is initiated too late, and thus can not prevent the development of large infarcts (Fig. 2), resulting in additional edema and secondary hemorrhagic transformation.
Ischemic stroke in middle cerebral artery territory.
Clinical studies
Positron emission tomography studies in patients with acute ischemic stroke were aimed at the identification of irreversibly damaged and ischemically compromised but viable tissue. In early studies by Kuhl et al. (1980), regions with decreased flow and preserved glucose consumption were observed in the first hours after the ictus, and this early mismatch served as an indicator of viable tissue in distinction to other flow–metabolism combinations—hypoperfusion–hypometabolism, hyperperfusion–hypometabolism—signaling permanent tissue destruction. Very early in its development, PET with 15oxygen tracers became the gold standard for the evaluation of pathophysiologic changes in early stroke (Baron et al., 1989). The quantitative measurement of CBF, CMRO2, OEF, and CBV permitted the independent assessment of perfusion and energy metabolism, and demonstrated the uncoupling of these usually closely related variables. However, this method is complex and requires multitracer application, therefore, its application in clinical routine is limited. The necessity of arterial blood sampling for quantitation further restricts its use whenever invasive procedures are prohibited (for example, in thrombolytic therapy).
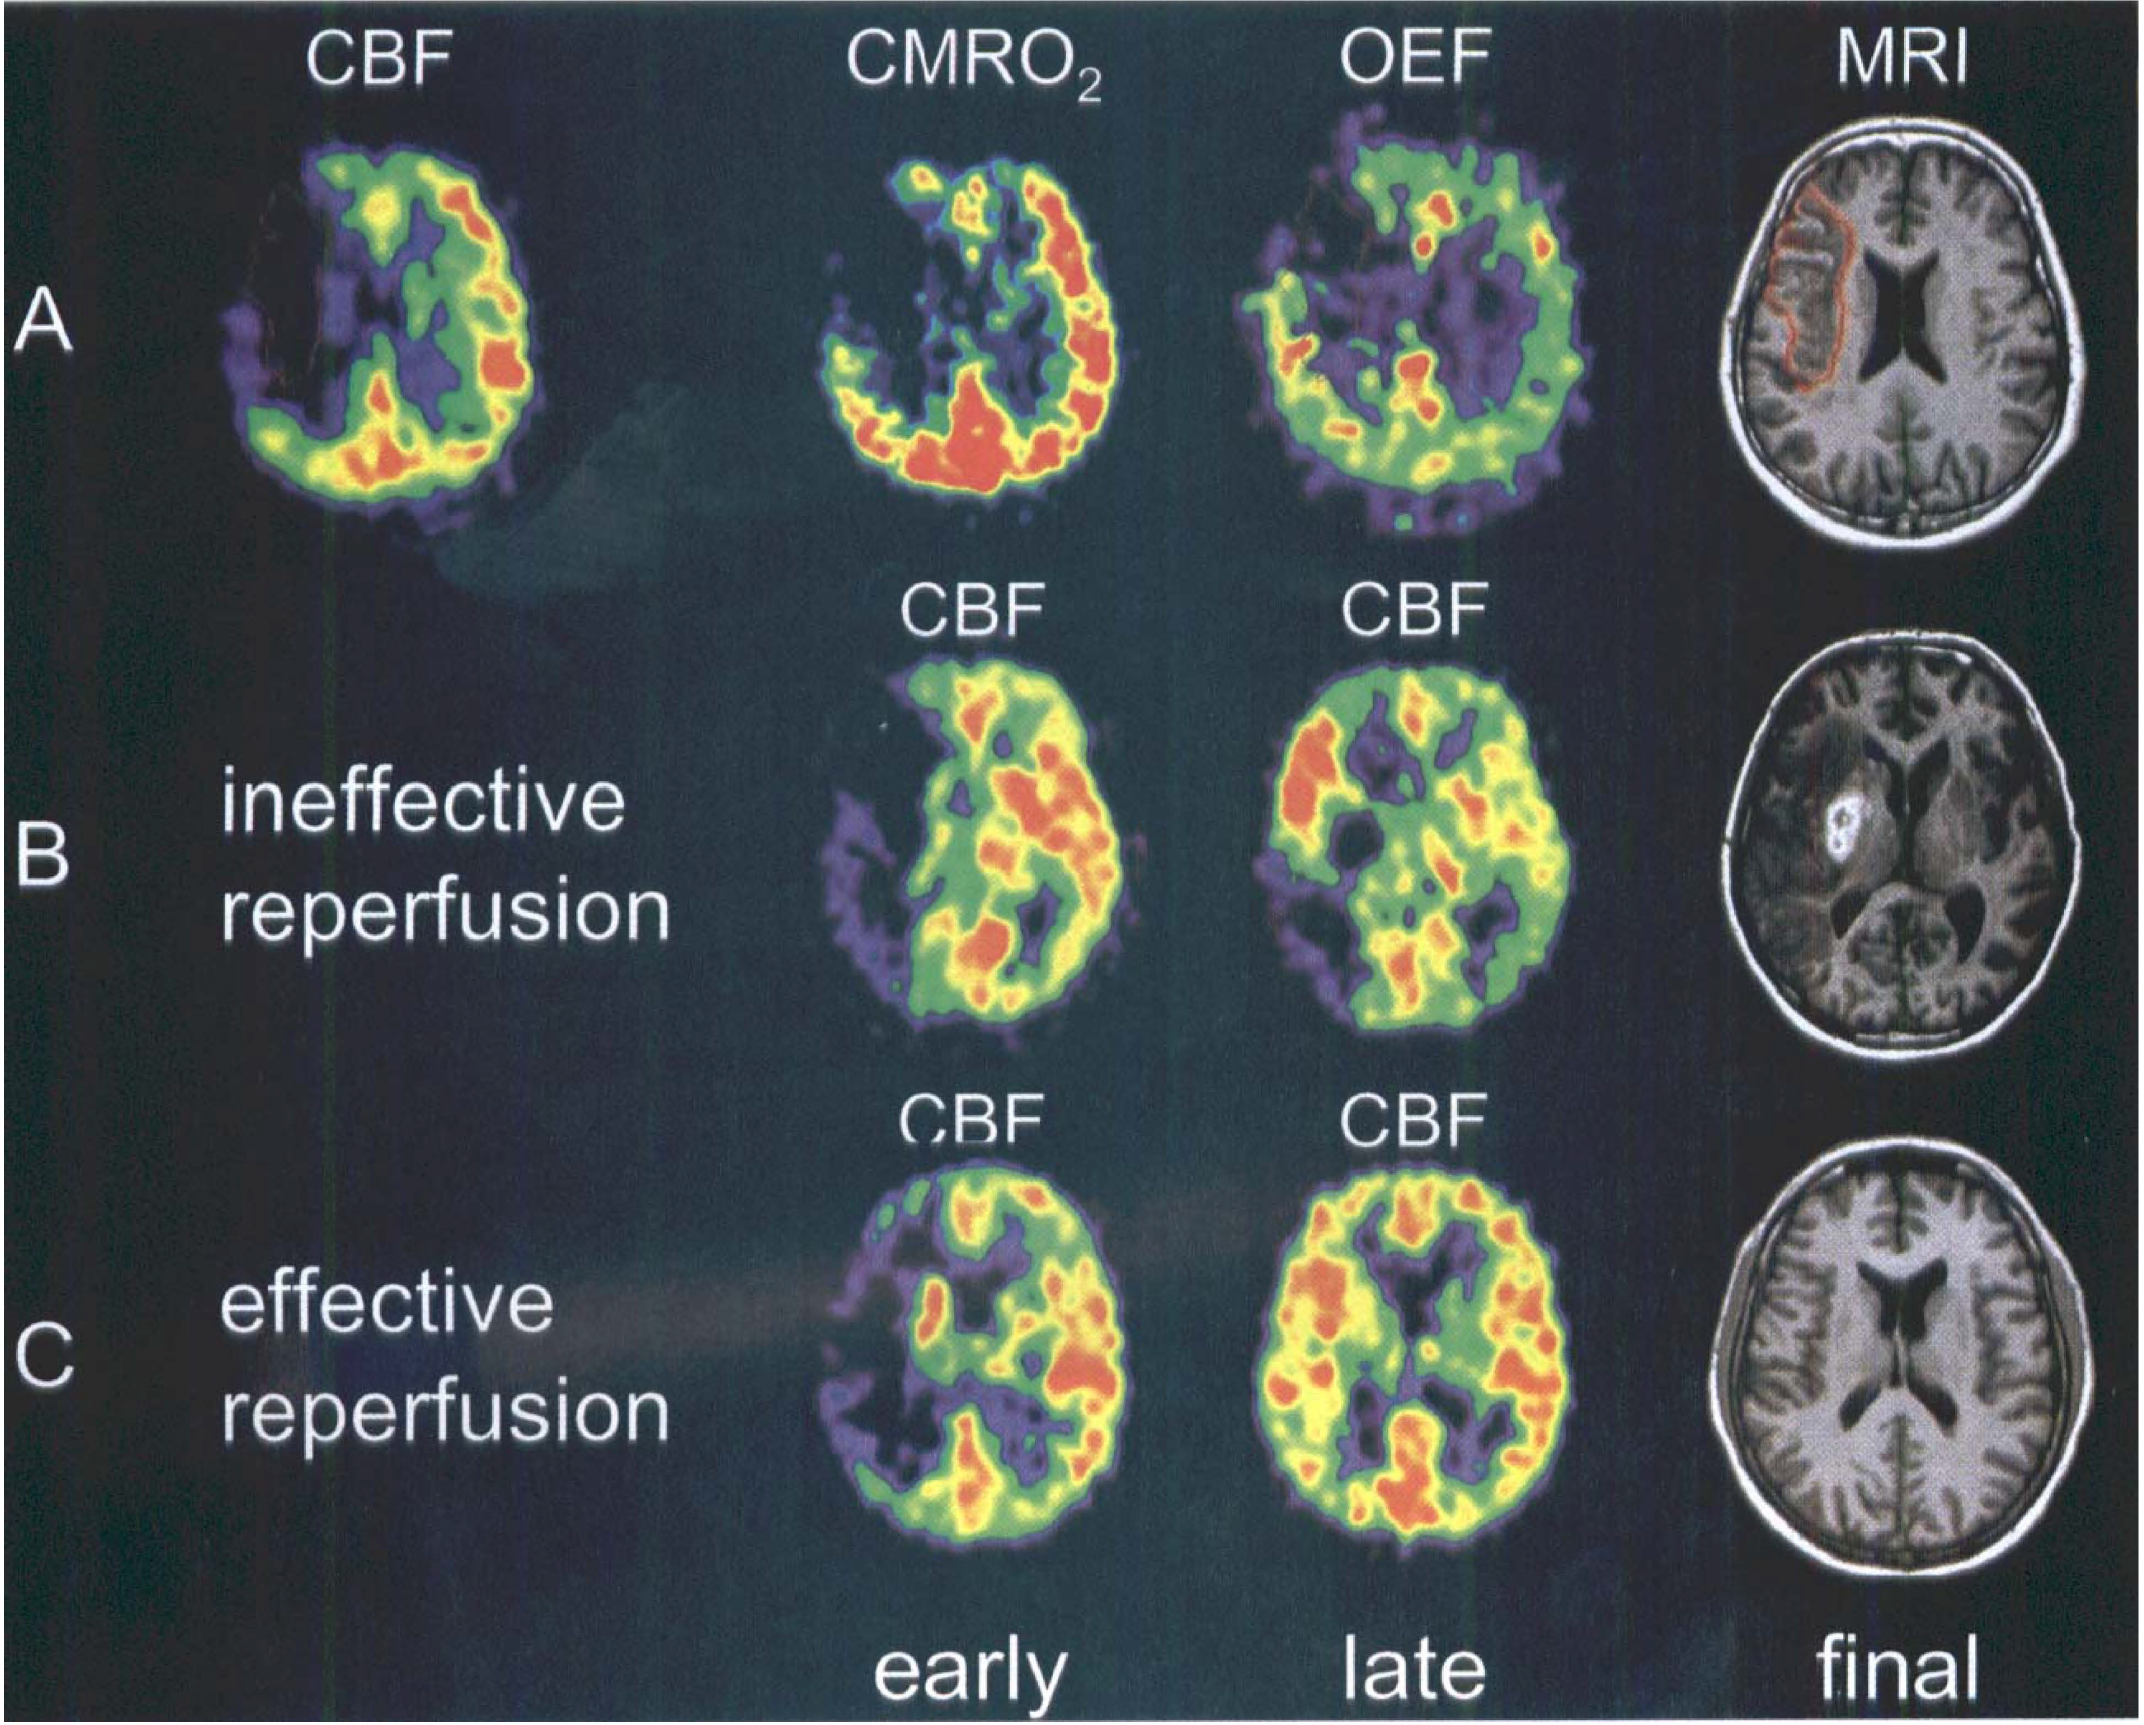
Several studies of usually a small number of patients provided data on flow and metabolic values predicting final infarction or suggesting viability at the time of measurement (performed at variable times 5 to 48 hours after the onset of symptoms). Tissue with rCBF less than 12 mL/100 g·min, or rCMRO2 less than 65 μmol/100 g·min, or both, at the time of measurement was usually found to be infarcted on late CTs (Baron et al., 1984; Powers et al., 1985). Relatively preserved CMRO2 was accepted as an indicator of maintained neuronal function in regions with severely reduced CBF (Fig. 2A). This pattern (coined misery perfusion by Baron et al. (1981)) served as a definition for the penumbra, which is characterized as the area of increased oxygen extraction fraction (up to 80% to 100% from the normal value approximately 40%) (Ackerman et al., 1981). Regions with CBF between 12 and 22 mL/100 g·min have an unstable metabolic situation. In these areas infarction will develop if low flow values persist, and they are therefore considered to be in the penumbra zone (Hakim et al., 1989). This upper threshold for the penumbra is also supported by the minimum CBF value determined in regions responsible for transient ischemic attacks (Powers et al., 1987). These PET studies permit the classification of three regions within the disturbed vascular territory: the core of ischemia usually turning into necrosis with a flow less than 12 mL/100 g·min; a penumbra region, with flow between 12 to 22 mL/100 g·min, of still viable tissue but with uncertain chances for infarction or recovery; and a hypoperfused area (> 22 mL/100 g·min) not primarily damaged by the lack of blood supply. It has to be kept in mind that the classification of tissue is changing with time; conversion into infarction and the penumbra is a dynamic process spreading from the core of ischemia to its border (Heiss and Graf, 1994; Baron, 1999). This concept implies that the extent of the penumbra, that is, of morphologically intact but functionally impaired tissue, depends on the time of measurement relative to the onset of ischemia: the volume is large, and the flow values are low (and less than the above mentioned threshold), if the penumbra is defined in the first hours of ischemia; and the volume is small if it is defined later. In most cases, penumbra tissue characterized by misery perfusion is therefore observed in large tissue compartments within the first hours. In some cases it was detected 16 hours (Marchal et al., 1996) and even up to 48 hours after the onset of stroke (Heiss et al., 1992). Only a few cases were reported in which misery perfusion persisted chronically (Yamauchi et al., 1996). In repeat multitracer PET studies in patients after acute ischemic stroke, it was demonstrated that most tissue compartments showing misery perfusion in the first measurement suffered progressive metabolic derangement and became necrotic during the following 2 weeks (Wise et al., 1983; Hakim et al., 1989; Heiss et al., 1992). Only in a few regions, or in special cases, with increased OEF and slightly impaired rCMRO2, was the metabolism preserved close to normal values and the tissue remained morphologically intact (Heiss et al., 1993; Furlan et al., 1996). These observations in early stroke prove that penumbra tissue affected by misery perfusion, but with CMRO2 still greater than the critical threshold, is viable and may recover if sufficient perfusion is reestablished within a critical time window.
The identification of flow and metabolic values predictive for ultimately infarcted versus noninfarcted penumbra tissue is still a matter of controversy (Baron, 1999). The values are highly dependent on the separation of cortex from white matter and suffer from variability and statistical inaccuracy of measurements at low tracer concentrations. As expected from these conditions, the results of meticulous analyses of PET data collected in a sample of patients studied 7 to 16 hours after acute stroke (Baron, 1999) cannot settle the argument conclusively. A large portion of the voxels fulfilling the criteria of misery perfusion (flow 10 to 22 mL/100 g·min, CMRO2 greater than the critical threshold of 60 μmol/100 g·min = 1.4 mL/100 g·min, OEF > 0.7) is included in the final cortical-subcortical infarcts, if spontaneous hyperperfusion does not occur. The latter is able to prevent structural lesions and leads to excellent clinical recovery (Marchal et al., 1996). This analysis sets the threshold of tissue that might infarct to a maximum of 22 mL/100 g·min. However, some penumbra voxels defined by the same criteria and correlated to the severity of neurologic symptoms at the time of measurement escaped infarction. In these instances, recovery was significantly correlated to the volume of noninfarcted penumbra tissue (Furlan et al., 1996), setting the flow threshold of tissue able to recover to a minimum of 7 mL/100 g·min. These careful analyses indicate that increased OEF is a poor predictor of tissue viability, and that isolated flow measurements at a single time point might be confusing as long as the pattern over time is not known. This broad range of flow values within penumbra tissue (Table 1) can also be deducted from an analysis of the upper and lower prediction flow limits for final infarctions (unpublished data): 95% of all regions with flow decreased to ≤ 4.8 mL/100 g·min at early measurement were included in the final infarct, whereas 95% of all regions with flow ≥ 14.1 mL/100 g·min were outside the final lesion. These findings stress the need for a marker of neuronal integrity that can identify irreversibly damaged tissue irrespective of the time elapsed since the vascular attack and irrespective of the variations in blood flow over time.
Flow thresholds in mL/100 g · min (% of reference) for irreversible damage and penumbra from functional neuroimaging studies in acute stroke
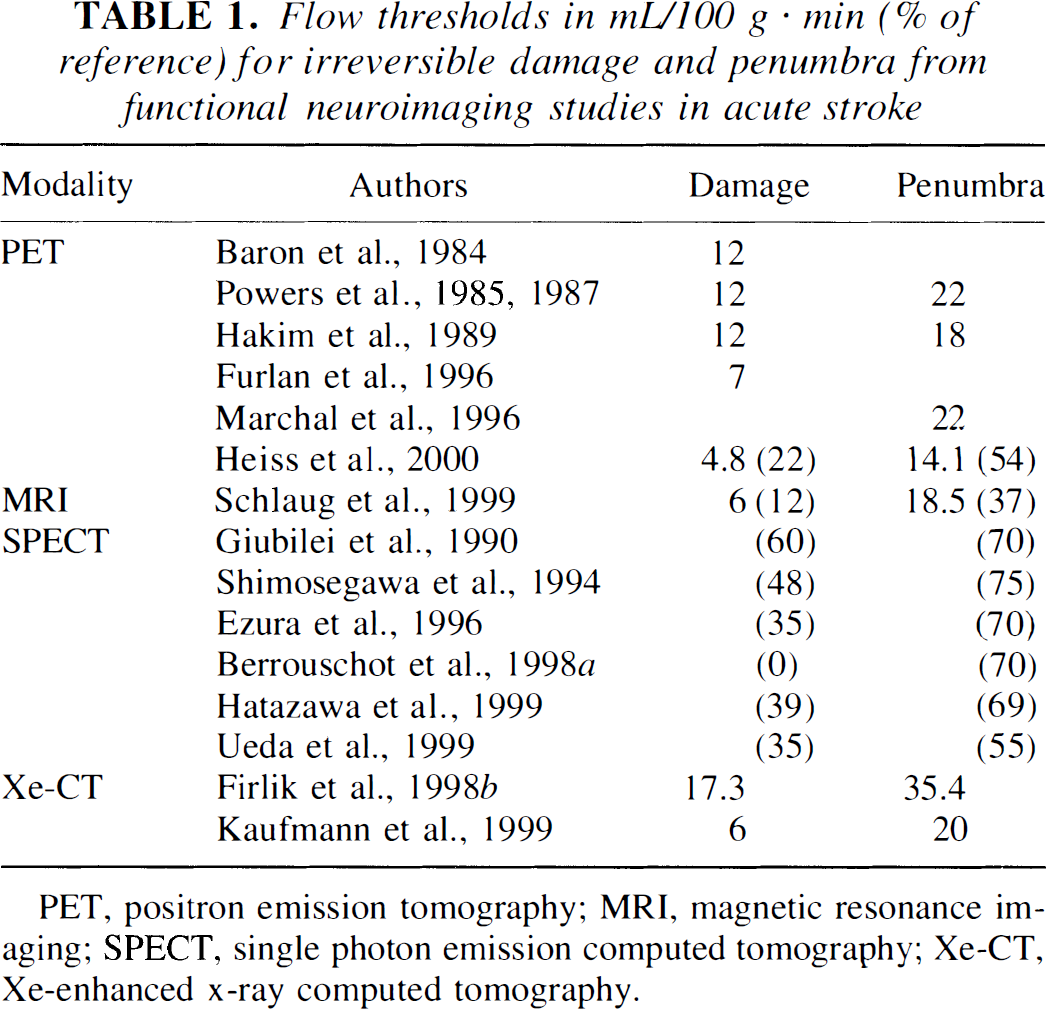
PET, positron emission tomography; MRI, magnetic resonance imaging; SPECT, single photon emission computed tomography; Xe-CT, Xe-enhanced x-ray computed tomography.
Central benzodiazepine receptor (BZR) ligands were suggested by Sette et al. (1993) as markers for neuronal integrity. They bind to the GABA receptors abundant in cerebral cortex that are sensitive to ischemic damage and therefore could identify early neuronal damage (Schwartz et al., 1992). To test the suitability of a BZR ligand for the detection of early irreversible ischemic damage, the development of defects in energy metabolism was compared with the defects of binding of 11C-flumazenil (FMZ) and the size of the infarcts determined 15 hours after transient MCAO in cats (Heiss et al., 1997). Irrespective of the level of reperfusion, defects in FMZ binding 2 to 3 hours after MCAO were closely related to areas with severely depressed oxygen consumption and predicted the size of the final infarcts, whereas preserved FMZ binding indicated intact cortex. Depressed glucose metabolism outside the areas of reduced FMZ binding (and outside the final infarcts) indicated functional inactivation. Additionally, FMZ distribution within 2 minutes after injection was highly correlated to flow and therefore can be used as a relative flow tracer yielding reliable perfusion images.
Labeled flumazenil was applied in 10 patients suffering from acute ischemic stroke within 3 to 16 hours of the onset of symptoms (Heiss et al., 1998a). The early changes in flow, oxygen consumption, and FMZ binding were compared with permanent disturbances of glucose metabolism and the size of the final infarcts determined on MRI or CT 12 to 22 days after the stroke. In all patients, cortical regions with reduced FMZ binding, usually within the larger areas with disturbed blood flow, predicted the final infarcts or, in one case, areas with severely depressed glucose metabolism indicative of marked neuronal loss. The predictive value of reduced FMZ binding was comparable to that of regional CMRO2 reduction < 60 μmol/100 g·min. In these areas, OEF could still be increased, limiting the usefulness of this variable as an indicator of viability. In contrast to studies with oxygen tracers, the use of the BZR ligand as a marker of neuronal integrity does not necessitate arterial blood sampling, is independent of the cooperation of patients, and has the advantage of superior image quality and the potential of SPECT application. However, studies are restricted to the cortex and require steady state conditions reached 30 to 40 minutes after injection.
By comparing various compartments of reduced flow to the size of the lesion, as established on MRI or CT 2 to 3 weeks after the stroke, the impact of the early critical ischemia and of the penumbra on the final infarct can be determined. In an analysis of flow within 3 hours of onset of symptoms in 10 patients (Heiss et al., 1999), critical hypoperfusion below the viability threshold (operationally set to ∼12 mL/100 g·min) accounted for the largest portion (70% on average) of the final infarct, whereas penumbral tissue (18%) and initially sufficiently perfused tissue (12%) were responsible for considerably smaller portions of the final infarct. In another sample of 10 patients studied 2 to 12 hours after the ischemic stroke, FMZ was reduced in 74% of the volume of the final infarct (34.8 cm3 of 45.8 cm3 on average). In this sample, 18% of the final infarct was still viable but hypoperfused at the time of the early PET study, whereas only 8% of the final infarct volume was sufficiently supplied. These results stress the eminent role of the early critical flow disturbance in the development of ischemic damage. Secondary and delayed pathobiochemical processes in borderline or initially sufficiently perfused regions contribute little to the final infarct.
Markers of hypoxic tissue were also tested with respect to their capacity to identify penumbral tissue. In animal models of focal ischemia, autoradiography with labeled nitroimidazole derivatives detected increased tracer uptake associated with areas of histologic damage and adjacent areas that appeared intact at follow-up (Mathias et al., 1987; Hoffman et al., 1987). Only animals with a clinical deficit showed increased trapping of this tracer. The nitroimidazole derivative misonidazole, labeled with 18fluor (F-MISO), was first used by Yeh et al. (1994) to image cerebral ischemia in humans and revealed increased uptake surrounding a zone of absent activity in 3 of 6 patients. This zone of high activity had disappeared when imaging was performed during the chronic phase, indicating that the hypoxic tissue had either infarcted or recovered. This pattern and time course was confirmed in a larger study by Read et al. (1998). In that study, in 9 cases F-MISO trapping was detected 6.25 to 42.5 hours after stroke onset, but was absent in later examinations. Tissue with increased F-MISO uptake was generally distributed over the periphery of the infarct, identified on the coregistered late CT, but extended into normal tissue adjacent to the infarct in a few cases. The amount of hypoxic tissue detected by F-MISO declined as a function of time after stroke onset. The proportions of hypoxic tissue that infarcted or survived varied between patients. After calibration on findings from PET studies with 15O tracers, F-MISO PET might serve as an alternative procedure to identify the penumbra. However, more data on the functional recovery of hypoxic tissue are needed. Because of the delay between tracer injection and imaging (more than 2 hours), the use of F-MISO will be precluded in the acute phase before therapeutic intervention.
As alternative markers of neuronal damage, divalent cobalt(Co)-isotopes were suggested. These ions might visualize changes in neuronal Ca++ metabolism and increased Ca++ influx into cells, a hallmark in the pathophysiologic cascade of ischemic damage that was demonstrated by the activation of Ca++ channels by 11C-nimodipine (Hakim and Hogan, 1991). Studies with 55Co-Cl2 showed accumulation primarily in the core and, to a lesser extent, in the periphery of acute and subacute infarcts, which increased over time up to 4 weeks and was related to the severity of neurologic defects (De Reuck et al., 1999). This accumulation occurred in areas with diminished oxygen metabolism, was only partially related to blood flow, and was inversely correlated to neurologic deficits (Stevens et al., 1999). Because the accumulation of Co develops slowly and was usually not evident in the first days after stroke, it might be more related to secondary damage by inflammatory processes than to early cell damage by perfusional and metabolic abnormalities.
MAGNETIC RESONANCE IMAGING
Of the clinically available imaging techniques, MRI has the highest spatial resolution for detecting lesions in the brain, and has therefore gained a prominent position in the diagnosis of focal cerebral disorders. Standard T1-and T2-weighted MRI, however, gives high false negative rates during the first day after the onset of ischemic symptoms (Bryan et al., 1991; Yuh et al., 1991). Therefore, several new technologies were introduced that provide additional information on pathophysiologic and functional alterations. These methods recently became a versatile tool with multiple applications in the clinical setting providing rapid results. Two functional MRI techniques are used to detect developing ischemic lesions within the first hours. Diffusion-weighted MRI provides physiologic information about the selfdiffusion of water, thereby detecting one of the first elements in the pathophysiologic cascade leading to ischemic injury; PW-MRI provides a relative measure of regional perfusion, usually by tracking the bolus of a gadolinium containing contrast agent. From the DW-MR images, the apparent diffusion coefficient of water (ADC) can be calculated as a comparative measure. Perfusion-weighted MRI can be converted into maps of relative cerebral blood volume (CBV), qualitative mean transit time (MTT), and relative CBF (Baird and Warach, 1998), but absolute quantitation of perfusion parameters (Remp et al., 1994) is still restricted.
Experimental studies
Diffusion-and perfusion-weighted imaging have been widely used to detect and quantify ischemia in experimental stroke models (van Bruggen et al., 1994; Hossmann and Hoehn-Berlage, 1995). Because experimental findings were recently reviewed in detail (Baird and Warach, 1998), they are summarized in this article only as far as they relate to the concept of the penumbra. Because the detection of ischemic stroke by DW-MRI within minutes after experimental vascular occlusion was first demonstrated (Moseley et al., 1990), this technique has evolved as an important tool for the identification of very early injury in patients and the quantitative assessment of the severity and volume of ischemically compromised tissue. In ischemia models involving small animals (for example, rats, gerbils, cats), DWI has been shown to be useful as an early diagnostic marker of ischemia. It can also provide quantitative data on a physiologic parameter (the ADC of water in tissue) and a volumetric analysis of the lesion. Apparent diffusion coefficient values derived from DWI measurements can quantify the severity of ischemic changes and also the time course in the development of irreversible damage.
Diffusion-weighted imaging shows the area of reduced diffusion as a hyperintense region, which follows the redistribution of water from the extracellular to intracellular space as a consequence of reduced adenosine-triphosphate-(ATP)ase activity (Mintorovitch et al., 1991). In the core of this area ATP remains depleted, indicating necrotic transformation because of severely reduced perfusion (Hoehn-Berlage et al., 1995). Because disturbances of the water-ionic homeostasis occur immediately with the disruption of perfusion, DWI is able to detect the initial disturbance in ischemia within 2.5 minutes after arterial occlusion (Moseley et al., 1990; Minematsu et al., 1992), and also shows the reversal of these alterations with early recovery. With this technique the progression of ischemic injury from areas of severe to those of moderate to mild flow reduction can be followed. The changes in DWI signals correlate with histologic defects and metabolic abnormalities as assessed by autoradiographic and chemical imaging procedures at follow-up (Hossmann and Hoehn-Berlage, 1995).
Apparent diffusion coefficient values change over the course of ischemia, and there is also a gradual decrease in values from the periphery to the core of an ischemic territory (Röther et al., 1996). The threshold for ATP depletion, calculated by matching ADC to rCBF, was approximately 18 mL/100 g·min. This is equal to 77% of control ADC and corresponds to previously described values. Tissue acidosis was observed in neighboring, less affected areas (Hoehn-Berlage et al., 1995).
Reperfusion after transient MCAO resulted in reversible signal changes in DWI; infarction only developed if the signal intensity ratio between ischemic and nonischemic tissue increased to greater than 1.46 during occlusion, even when it subsequently returned to near control (Mintorovitch et al., 1991). It was also shown that the hyperintensity in DWI is less marked after 1 hour than after 2 hours of MCAO (Minematsu et al., 1992), and that the region of restricted ADC enlarges over 24 hours, at which time the DWI lesion volume becomes equivalent in size to the final infarction measured histologically. Hyperintensity observed during the reperfusion period can predict the size of the final infarct. When ADC progressively decreased despite reperfusion a large infarction developed (Hasegawa et al., 1994), whereas ADC greater than a certain value predicted recovery. In addition, a relation was found between the quantitative change of diffusion, indicative of risk of injury, and the duration of this disturbance, both of which predicted demarcated tissue injury (Miyabe et al., 1996). These results indicate that DWI can be used to detect penumbra tissue.
With DWI techniques, the relation between the number of spreading depression-like depolarizations (detected as transient decreases in ADC) (Hasegawa et al., 1995) and infarct size (Mies et al., 1993) could be confirmed. The ADC-defined ischemic region increased over 15 minutes by 37% with single spreading depressions and by 40% with multiple spreading depressions; without spreading depressions an increase of only 14% was seen (Takano et al., 1996). Consequently, the final infarcts caused by MCAO in rats were significantly larger when spreading depressions occurred. Apparent diffusion coefficient abnormalities may be seen at the periphery of a lesion before ATP levels have completely disappeared (Hoehn-Berlage et al., 1995), suggesting that the outer rim of the DWI lesion may be part of the penumbra.
Some of the compromised tissue can be salvaged by neuroprotective drugs. The effect—a decrease of the DWI lesion size after drug application, or continued growth in the untreated group—can be predicted in sequential MR images. Antagonists of the N-methyl-d-aspartate receptor prevent spontaneously occurring and chemically elicited spreading depressions, thereby mitigating the extent of ATP depletion (26 versus 49% of the hemisphere, Busch et al., 1996), decrease infarct size (49 versus 66% of the hemisphere, Busch et al., 1996; 54 versus 217 mm3, Minematsu et al., 1993), and improve postischemic perfusion and clinical outcome (Minematsu et al., 1993).
Perfusion changes precede the development of lesions in DWI. The area of restricted diffusion progresses within the region of perfusion abnormality (Minematsu et al., 1992; Roussel et al., 1995) and can be reversed by early reperfusion (Davis et al., 1994). Decreased perfusion without DWI signal change has been reported in several studies (Quast et al., 1993; Pierce et al., 1997) and demonstrates that hypoperfused tissue may be greater than the threshold of morphologic damage. A clear classification of these tissue compartments according to severity of perfusion reduction is restricted by the relative character of flow determinations (Calamante et al., 1999).
Clinical studies
In acute ischemic stroke in humans, DW image lesions have been identified as early as 39 minutes (Yoneda et al., 1999), 75 minutes (Warach et al., 1995), and 100 minutes after onset (Gonzalez et al., 1997); reduced ADC seen as early as 105 minutes after onset (Warach et al., 1992) was interpreted as a marker of energy failure suggesting penumbra tissue (Warach et al., 1992; Le Bihan et al., 1992; Chien et al., 1992). Hyperintense DWI regions with decreased ADC identified ischemic lesions that subsequently developed infarction (Warach et al., 1995); a decrease of ADC always preceded the development of infarction. The ADC has been found to have a time course with two distinct phases (Warach et al., 1992; Schlaug et al., 1997; Lutsep et al., 1997). An initial decrease to 58.3% of control is followed by a slow increase and a return to normal values within 48 hours (Welch et al., 1995) to 4 to 10 days (Sorensen et al. 1996; Schlaug et al., 1997; Lutsep et al., 1997). This time dependent pattern permitted the discrimination of acute lesions adjacent to chronic infarcts (Warach et al., 1995; Marks et al., 1996). Together with T2-weighted images, the actual ADC changes yielded signatures that identify tissue that has a potential to recover, that was in progression to necrosis, or that was already irreversibly damaged (Welch et al., 1995). Diffusion lesions may be heterogeneous in the early stages of ischemia in man, and reduction of ADC may reflect cell swelling and extracellular edema and cell lysis. Early normalization of ADC (within 48 hours) was therefore more common in patients with early reperfusion (Schlaug et al., 1997) and may represent true normalization and tissue recovery. As in animal models, in which reversal of DWI lesions has been well demonstrated, a lesion in DWI is not identical to irreversible tissue damage. Regression of DWI lesion in the course of stroke was occasionally reported (Marks et al., 1996; Sorensen et al., 1996) and occurred in nearly half of those transient ischemic attacks patients in whom ischemic abnormalities were seen in the acute phase (Kidwell et al., 1999).
Perfusion weighted MRI by bolus tracking demonstrates regions of hemodynamic abnormality (Warach et al., 1992; Sorensen et al., 1996) and provides complementary information to DWI for the early detection and characterization of hyperacute ischemia. Under the assumption that DWI detects the permanent ischemic lesion, PWI and DWI can be applied in acute stroke to delineate the upper and lower boundaries of the volume at risk for eventual infarction, respectively (Sorensen et al., 1997). Under these conditions, the ischemic penumbra was operationally defined as tissue with normal diffusion, but reduced perfusion, around the core of diffusion abnormality. Thus, the regions defined as the ischemic penumbra were characterized by a mean 73% increase in MTT of the gadolinium bolus and a 29% increase in relative CBV. In the patients studied by Sorensen et al. (1999), the volumes of MTT and CBF abnormalities were larger than the volume of the CBV abnormality and the mean volume of the lesion on DWI. The final infarct volume was intermediate between the DWI and CBV and the MTT and CBF volumes. Reduced CBF in an area with normal CBV may suggest some residual perfusions through dilated collaterals and was repeatedly observed in the periinfarct tissue of acute and subacute stroke (Tsuchida et al., 1997). In patients studied acutely and followed into the subacute to chronic state of the ischemic stroke (Baird et al., 1997; Beaulieu et al., 1999), an increase of the ischemic lesion volumes over time was found. For all cases in which perfusion was measured with DWI, enlargement of ischemic lesions occurred when there was a larger perfusion defect (measured by the relative MTT), but not when the perfusion abnormality was equivalent to or smaller than the DWI lesion (Baird et al., 1997; Sorensen et al., 1996). In approximately 50% of patients, the acute DWI lesion was smaller than the final infarct volume measured on T2-weighted images after 7 days or later. In some patients, lesions enlarged beyond 24 hours, suggesting penumbra tissue for a period beyond the hyperacute phase. In repeat studies on the first day after stroke and 24 to 72 hours later, the extension of the diffusion lesion into the area with impaired perfusion was analyzed (Schlaug et al., 1999). Decrease of rCBF to 37% of the contralateral region and decrease of rCBV to 47% of contralateral region were used to identify penumbral tissue, whereas the ischemic core showed a more severe reduction in rCBF (12% of contralateral region) and rCBV (19% of contralateral region). The operationally defined values for penumbra and core (37% and 12% of contralateral region, respectively) may be translated into CBF values (18.5 and 6 mL/100 g·min, respectively) and correspond to the values obtained in quantitative PET studies (Table 1). The diffusion abnormality enlarged within 48 hours to 376.6% into the region of hypoperfusion in all of the patients, but did not reach the full volume of initial perfusion abnormality (59.2 mL versus 96.6 mL, on average). Initial rCBV and rCBF were shown to be significant predictors of penumbra and ischemic core in regression analysis, and therefore can help to identify potentially salvageable tissue early after stroke.
That the hypoperfused area represents functionally impaired but morphologically preserved tissue was exemplified in a recent study by Beaulieu et al. (1999). Despite the increase in DWI lesion volume during the initial week, the functional deficits, assessed by the National Institutes of Health Stroke Scale Score, improved in all patients who displayed enlargement of lesion volume but reduction of volume of perfusion deficit. This proves that subsequent improvements in perfusion could result in a decrease in NIHSS despite a concomitant growth in the final infarct. However, the measures for perfusion abnormalities obtained by MRI are qualitative and, therefore, do not necessarily reflect the severity of the perfusion deficits. Therefore, the area imaged on PW-MRI is a mixture among the compartments with critical flow reduced below the viability threshold, flow within the penumbra range, and oligemic flow reduced to a level sufficient for supply.
Despite the limitations that the upper limit of critical hypoperfusion cannot be reliably identified in PWI (Calamante et al., 1999) and that the value of ADC decrease indicating irreversible damage is still ill defined, the combination of diffusion-weighted and perfusion-weighted MRI has become the most rapid method to identify tissue at high risk of infarction (that is, the penumbra) and to provide valuable insight regarding neurologic and radiologic outcomes after acute ischemic stroke. With the spreading applicability of the advanced MRI techniques it can be expected that these methods will be introduced into routine clinical practice to ensure that staging and predicting the progression of ischemic damage become prerequisites for the management of individual stroke patients (Fisher and Albers, 1999).
SINGLE PHOTON EMISSION COMPUTED TOMOGRAPHY
Single photon emission computed tomography can assess perfusion in brain tissue and is available in many clinical departments managing patients with acute ischemic stroke. However, only when 133Xenon is used and the clearance of this inert gas is followed can rCBF be quantified (Lassen, 1995). The handling of the radioactive gas, the complexity of data analysis, and the rather coarse spatial resolution obtained with this tracer limits the routine application of this technique especially in acute ischemia. Other more commonly applied tracers use the bolus distribution principle for the assessment of regional perfusion, but rCBF values usually can not be quantified. The tracer most often used in acute ischemic stroke is 99mTechnetium-hexamethylpropylene-amino-oxime (HMPAO), which replaced 123I-N-isopropyl-p-iodoamphetamine (IMP) for perfusion studies. The newer tracer 99mTc-ethyl-cysteinate-dimer (ECD) reflects not only perfusion, but is also related to the metabolic status of the tissue, as the retention of ECD requires the presence of cytosolic esterase and therefore depends on the presence of some viable cells. With these tracers, SPECT can show the location, size, and extent of decreased or fully impeded CBF immediately after the onset of ischemia. The detection of the penumbra based on SPECT studies alone is difficult because the obtained values are relative perfusion measures standardized against contralateral or cerebellar regions, and because the functional and morphologic state of the tissue is only indirectly assessed. Despite these limitations, a considerable number of studies have demonstrated the predictive value of SPECT images for neurologic outcome in the acute and subacute stage of ischemic stroke. Several of these investigations were performed within 6 hours of onset of symptoms (Giubilei et al., 1990; Hanson et al., 1993; Berrouschot et al., 1998a, 1998b; Hatazawa et al., 1999; Shimosegawa et al., 1994; Baird et al., 1994; Ezura et al., 1996; Ryu et al., 1999) at a time when considerable volumes of hypoperfused but viable tissue can be expected. However, studies performed at a later time after the onset of symptoms also could identify different tissue compartments (Baird et al., 1996; Alexandrov et al., 1996; Laloux et al., 1995; Lees et al., 1995; Nakagawara et al., 1994; Karonen et al., 1999) and the SPECT results could help to predict neurologic development in addition to neurologic scores (Marchal et al., 2000).
It can be concluded from all of these studies that severely reduced tracer uptake over a large area is associated with poor outcome (Giubilei et al., 1990; Hanson et al., 1993; Laloux et al., 1995; Berrouschot et al., 1998b), whereas normal or increased uptake is predictive of good clinical outcome (Hanson et al., 1993; Berrouschot et al., 1998a; Marchal et al., 2000). The level of flow decrease that predicts extended infarction or hemorrhagic complications was estimated at different values and varied between a complete lack of ECD uptake (Berrouschot et al., 1998b) and a relative decrease of perfusion to 35% to 60% of the contralateral value (Shimosegawa et al., 1994; Giubilei et al., 1990; Hatazawa et al., 1999; Ezura et al., 1996; Sasaki et al., 1996; Ueda et al., 1999) (Table 1). The upper limit of penumbra tissue also varied among the studies. Patients with transient ischemic attacks had count rate densities of 70% of the respective contralateral ROIs (Berrouschot et al., 1998a), a value comparable to the previously described flow value in transient ischemic attacks (Hartmann, 1985). The threshold for moderately ischemic areas with a good chance of recovery also was determined in other studies at 70% of contralateral tracer uptake (Ezura et al., 1996; Ryu et al., 1999; Giubilei et al., 1990). More complicated evaluations used a graded scale of SPECT changes accounting for the severity of asymmetric isotope uptake and volume of tissue affected (Hanson et al., 1993), or a hypoperfusion score from the extent and severity of hypofixation of the tracer (Marchal et al., 2000) to come to a similar result based on statistical analysis. As a result of these analyses, tissue with a tracer uptake between 40% and 70% of the contralateral corresponding areas in the first 3 to 6 hours after the onset of symptoms can be considered to represent the penumbra (Table 1). An infarct often extends into this area (Hatazawa et al., 1999; Karonen et al., 1999) and therefore this region might be the target for interventional treatment strategies.
Similar to 11C-flumazenil for PET studies, 123I-Iomazenil can be used as a SPECT tracer for central benzodiazepine receptors. This ligand is a marker of neuronal integrity and its steady-state binding is independent of (re-)perfusion. Therefore, this tracer was efficiently used to detect neuronal loss and incomplete infarction in reperfused brain areas with irreversibly impaired function, even when CT did not show gross infarcts (Hatazawa et al., 1995; Nakagawara et al., 1997). This tracer still awaits its consequent application in SPECT studies in the first hours after ischemic stroke.
X-RAY COMPUTED TOMOGRAPHY
In the management of patients with acute ischemic stroke CT is the first and most important diagnostic step (Adams et al., 1994) to rule out other pathologies, such as intracranial hemorrhage, tumors, or inflammatory diseases, and to detect early hypodensity predicting a large infarct with poor clinical outcome (von Kummer et al., 1996; Toni et al., 1996; Fiorelli et al., 2000). Early signs of infarction—focal hypodensity, obscuration of the basal ganglia, focal brain swelling, and the hyperdense MCA sign—can be detected on CT within the first 6 hours in up to 50% of patients (von Kummer et al., 1996). Patients with early CT signs covering more than one-third of the MCA territory are believed to be at higher risk of hemorrhage after thrombolysis and therefore were excluded from the European Cooperative Acute Stroke Study study (Hacke et al., 1995; von Kummer et al., 1997). However, patients with early CT signs had a significantly larger area of critical hypoperfusion on PET than patients without early CT signs (Grond et al., 2000). This finding suggests that early CT signs indicate the “tip of the iceberg” in terms of tissue at risk of irreversible damage. Early CT signs, which correlate to poor outcome, should therefore not be used alone for early prognosis. However, some patients with early CT signs even had a favorable course, and several instances are reported in which early changes did not progress to later infarction (Gholkar et al., 1998). An overemphasized exclusion of patients with early CT signs from thrombolytic therapy therefore might reduce the chance for patients to benefit from reperfusion (Grotta, 2000) and may explain some of the differences between the results of different multicenter trials (NINDS, 1995;Hacke et al., 1998).
Scan time has shortened with the advent of helical CT scanners. This permits the tracking of an intravenously infused contrast bolus in the vascular bed and the identification of occlusions of major arteries by CT angiography (Hunter et al., 1998). By continuing to scan the entire brain after CT angiography, tissue perfusion can be assessed and regions distal to a vascular occlusion can be identified because they appear hypodense or hypoperfused relative to the rest of the brain. Although CT perfusion studies still require time consuming postprocessing, semiquantitative perfusion volume maps have been generated (Hunter et al., 1998) that are useful in the prediction of outcome after intraarterial thrombolysis (Segal et al., 1999; Koroshetz and Gonzalez, 1999). However, the correlation of the obtained regional perfusion measures to rCBF values determined by H215O PET is low and does not permit the definition of thresholds for irreversibly damaged and penumbra tissue.
Xenon enhanced computed tomography (Xe-CT) permits quantitative measurement of regional blood flow with a relatively high spatial resolution and reliable correlation to anatomic structures (Drayer et al., 1978; Meyer et al., 1979; Gur et al., 1982). Despite the availability of CT scanners in practically all institutions involved in management of stroke, the application of Xe-CT is restricted to only a few centers. This might be because of the difficulties in handling rather large amounts of stable Xenon gas and the anesthetic side effects of the used high gas concentrations (Yonas et al., 1981); the latter also affect the measured CBF values. Despite these limitations, stable Xe-CT was used to measure rCBF in reversible focal ischemia in baboons (Yonas et al., 1990). During vascular occlusion, CBF values between 1 and 10 mL/100 g·min were observed, which were followed by hyperemia up to 267% of preocclusion values after reopening the vessels. Despite this postischemic hyperemia, animals developed infarction of all cellular elements after 60 minutes occlusion, whereas 20 minutes occlusion resulted only in subtle and incomplete lesions. These experiments stress the reliability of Xe-CT measurements. The observed low CBF values might be related to methodologic differences to other techniques.
Most Xe-CT studies in stroke patients were performed in chronic vascular disease to test the perfusional reserve in patients with vascular occlusion, to identify the hemodynamic risk for recurrent stroke, and to select patients for revascularization surgery. Several studies were performed in stroke patients within 6 hours of onset of symptoms and demonstrated hypoperfused areas that extended beyond CT abnormalities or were found despite normal CT findings. In all patients with permanent neurologic defects, rCBF was decreased below 20 mL/100 g·min, and the severity of the flow reduction was related to angiographic findings. The mean CBF in the symptomatic MCA territory was 8.6 mL/100 g·min in patients who developed severe brain edema leading to brain herniation, compared with 18 mL/100 g·min in those who did not (Firlik et al., 1998a).
Mean CBF in regions of interest of the symptomatic vascular territories responsible for neurologic deficits that resolved was 35.4 mL/100 g·min, compared with 17.3 mL/100 g·min in patients with evolving stroke (Firlik et al., 1998b). A severely ischemic core with CBF 6 mL/100 g·min observed 1 to 6 hours after stroke onset corresponded to the cerebral tissue destined to infarction. This ischemic core was surrounded by a very narrow rim with flow values between 7 and 20 mL/100 g·min (Kaufmann et al., 1999). The thereby identified penumbra was comparable to that in PET studies despite the relative low CBF values measured by Xe-CT in the contralateral hemisphere (Table 1).
THERAPEUTIC STUDIES TARGETED AT THE PENUMBRA
Several treatment studies were designed to demonstrate effects on the penumbra and are based on surrogate aims assessed by functional imaging. In these studies, the duration of the existence of the penumbra defines the therapeutic window. An effect of the therapeutic intervention can therefore only be expected as long as penumbra tissue is present, and only to the extent of the amenable tissue compartments. Because the compartment of penumbra is rather small at the time of study (and initiation of therapy) (Heiss et al., 1999), the efficacy of treatment is limited. An additional, even smaller portion of the final infarct involves tissue that is not critically perfused early after the stroke, and damage to these areas might be because of secondary and delayed mechanisms or recurrent perfusional disturbance. These areas may represent the primary targets for neuroprotective, antiinflammatory, and antiapoptotic strategies (Schulz et al., 1999; Dirnagl et al., 1999; De Keyser et al., 1999), which still have not proven their clinical efficacy. The therapeutic window effective for these interventional strategies, however, might be different from that effective for reperfusion therapies (Baron et al., 1995).
Thrombolysis is still the only approved therapy of acute ischemic stroke (NINDS, 1995;Hacke et al., 1995, 1998; Furlan et al., 1999Herderscheê et al., 1991; Baird et al., 1994; Ezura et al., 1996; Ryu et al., 1999). Furthermore, severe hypoperfusion (< 35% isotope uptake of contralateral reference region or of cerebellum) predicted hemorrhagic complications (Ueda et al., 1994, 1999; Ezura et al., 1996) or evolution of severe edema and tentorial herniation (Herderscheê et al., 1991). When blood flow exceeded a critical value of 70% of the contralateral region, outcome was favorable without the development of infarction irrespective of the degree of recanalization (Ezura et al., 1996). A different perfusion range, at which recanalization achieved by intraarterial thrombolytic treatment within 3.5 to 7.25 hours of onset of stroke can save ischemic tissue, was semiquantitatively determined by Sasaki et al. (1996) using 99mTc-HMPAO-SPECT. Reperfusion significantly reduced the likelihood of infarction in those regions in which isotope uptake was decreased to values between 65% and 85% of the contralateral side, whereas it was without effect in areas with lower uptake before treatment. Regions with higher residual perfusion recovered, irrespective of the success of recanalization. Grotta and Alexandrov (1998) reported on the effect of systemic rt-PA on blood flow determined by HMPAO-SPECT in a small cohort selected from the NINDS study. In this double blind controlled study, significantly greater reperfusion occurred in the rt-PA-treated group than in the placebo group. All of these SPECT studies used a region of interest analysis, but coregistration of early perfusion to late morphologic images was not attempted. Therefore, the volumes of brain tissue rescued by reperfusion could not be determined. It was also beyond the scope of those studies to assess the extent of reperfusion after efficacious thrombolysis as opposed to treatment failure.
Coregistration of flow images assessed before and after systemic thrombolysis by H215O-PET with MRI obtained 3 weeks after the stroke in 12 patients could prove the efficacy of therapeutic strategies intended to protect tissue threatened by ischemia (Heiss et al., 1998b). Critically hypoperfused gray matter was operationally defined using a threshold of 50% uptake of contralateral hemispheric mean, which corresponded to 12 mL/100 g·min. The size of hypoperfused gray matter was identified on the initial PET scans and changes of perfusion in those areas were related to the clinical course (followed by the National Institutes of Health Stroke Scale) and to the volume of infarcted gray matter demarcated on MRI 3 weeks after the stroke (Figs. 2B and 2C). Full clinical recovery and no morphologic damage was obtained by reperfusion to small (less than 15 mL/100 g·min) severely hypoperfused gray matter regions, and infarct size developing in initially larger ischemic areas was smaller than expected from previous correlative PET and morphologic studies. Overall, only 22.7% of the gray matter initially perfused at rates below the conventional threshold of critical ischemia became necrotic. The percentage of initially ischemic voxels that became reperfused at almost normal levels clearly predicted the degree of clinical improvement achieved within 3 weeks. These sequential blood flow PET studies demonstrate that critically hypoperfused tissue can be preserved by early reperfusion induced by thrombolytic therapy.
The early detection of irreversibly damaged tissue within a critically perfused territory is more difficult. It requires different methods to identify independently tissue damage and hypoperfusion. The identification of damaged tissue is of utmost importance for the planning of therapeutic interventions because ischemic brain regions that are already irreversibly injured cannot benefit from reperfusion that might even be harmful under these circumstances. Bright DWI hyperintensity (a hazy, dull hyperintense signal on DWI that may be reversed by reperfusion (Marks et al., 1996; Kidwell et al., 1999)), T2 signal hyperintensity, and CT hypodensity identify regions that are damaged, and a potential for salvaging tissue at risk only exists as long as the extent of brain ischemia is significantly greater than the extent of injury. Therefore, the difference in the volume of abnormalities in PW and DW images has recently become a surrogate marker of efficacy in stroke trials (Fisher, 1997; Saver et al., 1999). Computed tomography-perfusion imaging (Segal et al., 1999) and Xe enhanced CT (Rubin et al., 1999) were also applied for prediction of outcome after thrombolysis, but a refinement of conventional CT for the reliable identification of irreversible tissue damage in the first hours after the onset of symptoms is required before these methods can be introduced into clinical routine (Koroshetz and Gonzales, 1999).
Two groups have reported results of serial DW and PW imaging in patients undergoing intravenous thrombolysis. Jansen et al. (1999) found inhibition of lesion growth in patients experiencing reperfusion compared with patients with persistent perfusion deficits. Marks et al. (1999) described normalization of PWI in 5 of 6 patients receiving rt-PA, but in only 1 of 6 patients in the control group. The ADC values for the early reperfusers were consistently higher in follow-up studies (3 to 6 hours to 5 to 7 days), and regions with elevated ADC were observed within the ischemic zones in 5 of 6 patients with early reperfusion. The study showed that ADC increases are tied closely to reperfusion, which is more frequently seen with IVrt-PA therapy.
The effect of intraarterial thrombolytic therapy within 6 hours of symptom onset was analyzed in 7 patients in whom pre-and postthrombolytic DWI and PWI studies were performed (Kidwell et al., 2000). With recanalization proven by angiography, the DWI lesion volume decreased from 23 cm3 at baseline to 10 cm3 early after lysis, and the ADC lesion volume decreased from 9 to 1 cm3. This study demonstrates that perfusion deficits can be resolved and DWI signatures of early ischemic injury can be reversed by prompt thrombolytic vessel recanalization. This means that the ischemic penumbra includes not only the region of diffusion–perfusion mismatch, but also portions of the region of initial diffusion abnormality.
These uncertainties of DW-MRI in the identification of irreversible damage in the first hours after an ischemic attack might be avoided in PET or SPECT studies using tracers that bind only to intact neurons, such as the central benzodiazepine ligands flumazenil and iomazenil. A recent study on 11 patients receiving intravenous rt-PA treatment within 3 hours of symptoms onset (Heiss et al., 2000) demonstrated hypoperfused areas in all patients, and critically disturbed regional blood flow in 8 patients. In 4 cases, distinct areas of decreased FMZ binding were detected. Substantial reperfusion was seen in most hypoperfused regions 24 hours after thrombolysis. Only the patients with abnormalities in cortical FMZ binding suffered permanent lesions in areas corresponding to their initial FMZ defects, whereas no morphologic defects were detected on late MRI or CT in the other patients, although blood flow was critically decreased in areas ranging in size up to 78 cm3 before thrombolysis. These findings suggest a possible use of receptor imaging as an early indicator of irreversibly damaged and of viable penumbra tissue. The application of this method, however, is limited by the complex logistics of PET studies, which might be overcome by SPECT and 123I-Iomazenil, by the restriction to cortical imaging, and by the time necessary for steady state assessment of receptor binding.
Functional neuroimaging can also be applied to demonstrate the effect of drugs interfering with biochemical or molecular disturbances associated with ischemic damage; the window of opportunity to interfere with these pathogenetic processes might be different from that for reperfusion strategies (Baron et al., 1995). Results of clinical trials with the Ca++ antagonist nimodipine were controversial and a beneficial outcome was only obtained when treatment was started within 12 hours after the onset of symptoms (Mohr et al., 1994). In a multitracer PET study (Hakim et al., 1989), nimodipine was found to be effective in reversing the decline in CMRO2 and increasing CBF in densely ischemic zones, whereas in the penumbra, CMRO2 was improved. For the small sample and with a time lag of up to 48 hours until initiation of treatment, the difference to the control group was not significant. rCMRglc in the cortex of the hemisphere surrounding the infarct improved significantly within the first 2 weeks after the stroke in patients treated with nimodipine (Heiss et al., 1990), and these patients reached a higher score in the Barthel Index after 6 months.
Propentofylline, an adenosine reuptake inhibitor that counteracts glutamate excitotoxicity, increased rCMRglc significantly in the infarct and in the ipsilateral gray matter. Changes in periinfarct regions with increased OEF differed significantly between treatment and control groups. At follow-up after 2 weeks, rCBF, rCMRO2, and rCMRglc were less impaired in the treated than in the placebo patients, and clinical recovery after 3 months was also better in the propentofylline-treated groups (Huber et al., 1993).
The value of the DWI lesion volume as a surrogate marker in stroke trials was tested in a subgroup of patients entered into a multicenter study of the effect of citicholine (Baird and Warach, 1998). A significantly greater decrease in lesion volume from week 1 to week 12 was observed in the citicholine group. Despite a significant correlation between lesion volumes and clinical outcome, no statistical difference between treated and placebo groups was found with respect to change of lesion volume or clinical outcome. Future trials may require larger sample sizes to demonstrate differences in effects on lesion volume and clinical outcome.
These few examples stress the role of neuroimaging studies to provide surrogate markers for phase 2 treatment trials in acute ischemic stroke. Such studies can improve the insight into the dependency of therapeutic effects on the pathophysiologic state of the tissue at a given time point after the onset of ischemia, and will help to understand the striking differences in the efficacy of antiischemic therapy between animal models and human stroke.