
Abstract
The coupling between cerebral metabolic rate of oxygen (CMRO2) and blood flow (CBF) in response to visual stimulation was evaluated by means of a model of oxygen delivery. The model predicted a nonlinear relationship between stimulus-evoked changes of oxygen consumption and blood flow. The magnitude of the CMRO2/CBF ratio index (IO2) was used to indicate the degree of flow-metabolism coupling prevailing in specific areas of the brain during physiological stimulation. Therefore, the index provided a measure of the blood oxygenation level dependent (BOLD) magnetic resonance contrast. To evaluate the changes of IO2 in response to visual stimulation, the model was applied to the effect of a changing flicker rate of a visual stimulus on the magnitudes of CBF, CMRO2, and oxygen diffusion capacity, in the human brain. Positron emission tomography (PET) was used to measure the CBF and the CMRO2 in 12 healthy volunteers who viewed a cross-hair (baseline) or a yellow-blue annular checkerboard reversing at frequencies of 1, 4, or 8 Hz. The magnitude of CBF in the primary visual cortex increased as a function of the checkerboard reversal rate and reached a maximum at the frequency of 8 Hz (z = 16.0), while the magnitude of CMRO2 reached a maximum at 4 Hz (z = 4.0). Therefore, the calculated IO2 was lower at 8 Hz than at 1 and 4 Hz, in contrast to the oxidative metabolic rate that reached its maximum at 4 Hz. The model explained the increase of oxygen consumption as the combined effect of increased blood flow and increased oxygen diffusion capacity in the region of visual activation.
Keywords
The mammalian brain consumes glucose and oxygen in approximate stoichiometric proportion. The two substrates are continuously supplied by the cerebral circulation such that the mechanism linking neuronal activity to the circulation is believed generally to constitute a flow-metabolism couple, said to satisfy the principle of Roy and Sherrington (1890). The principle is interpreted to mean that changes of cerebral blood flow (CBF) subserve a tight coupling between cellular energy requirements and the supplies of glucose and oxygen to the brain (Gjedde, 1997). Several studies revealed significant increases of cerebral metabolic rate of oxygen (CMRO2) in the striate cortex in response to visual stimulation (Marrett and Gjedde, 1997; Vafaee et al., 1998; Vafaee et al., 1999). However, other studies reported an unexpected mismatch between changes of CBF and CMRO2 during certain kinds of stimulation believed to represent functional activation of the human brain (Fox and Raichle, 1986; Fox et al., 1988; Fujita et al., 1992 and 1993; Ribeiro et al., 1993; Ohta et al., 1999; Fujita et al., 1999). The discrepancy between the responses of blood flow and oxygen consumption to different kinds of stimulation suggests a nonlinearly regulated mechanism underlying the flow-metabolism couple.
Oxygen transport from blood to brain tissue is significantly limited by the enormous capacity of oxygen binding by hemoglobin compared with oxygen's physical solubility in plasma water, and possibly by other factors as well, including a specific resistance to oxygen diffusion at the endothelium of brain capillaries (Gjedde et al., 1991; Kassissia et al., 1995). Because of the delayed oxygen transfer, we propose that increased blood flow is required to increase oxygen delivery in the absence of capillary recruitment. We formulated a model of the relationship between blood flow and oxygen delivery (Gjedde et al., 1991; Gjedde, 1997), according which, oxygen consumption depends on blood flow when the tension of oxygen in mitochondria is negligible compared with the average capillary tension. The mean oxygen tension in the capillary then drives the oxygen delivery to the tissue and, hence, the oxygen consumption. When the oxygen extraction declines, more oxygen can be consumed, because the elevated average capillary oxygen tension allows more oxygen to be driven into the tissue (Widén, 1991). A priori, the model assumes that there is little recruitment of capillaries capable of reducing the diffusion distance in the tissue or increasing the intrinsic permeability of the capillary endothelial wall (Kuschinsky and Paulson, 1992; Connett et al., 1985; Ohira and Tabata, 1992), both of which contribute to the magnitude of the oxygen diffusion capacity.
The purpose of the present study was to test the hypothesis that this model of oxygen delivery (in which it is assumed that the oxygen diffusion capacity is constant) correctly predicts the increase of blood flow required to increase oxygen consumption to the measured level in the absence of a change of oxygen diffusion capacity.
THEORY
At steady-state, the oxygen consumption is given by:

where J is the net oxygen consumption, F is the blood flow, E is the oxygen extraction fraction, and Ca is the arterial oxygen concentration. In the case of negligible mitochondrial oxygen tension, the oxygen consumption is also a function of the average capillary oxygen tension:

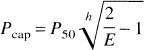
where L is the average oxygen diffusion capacity for the transport of oxygen between the capillary lumen and the mitochondria (in units of μmol/hg−1 · mm Hg−1 per min−1), and Pcap is the average capillary oxygen tension (mm Hg). The oxygen tension and hemoglobin saturation with oxygen are related by the Hill equation of the oxygen dissociation curve:
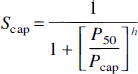
where P50 is the hemoglobin half-saturation oxygen tension and h is the Hill coefficient of the oxygen dissociation curve. The oxygen extraction fraction also defines the average capillary hemoglobin saturation with oxygen, assuming even escape of the oxygen along the capillary length:

where Scap is the mean capillary hemoglobin oxygen saturation. The solutions to the above relationships are:
and
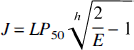
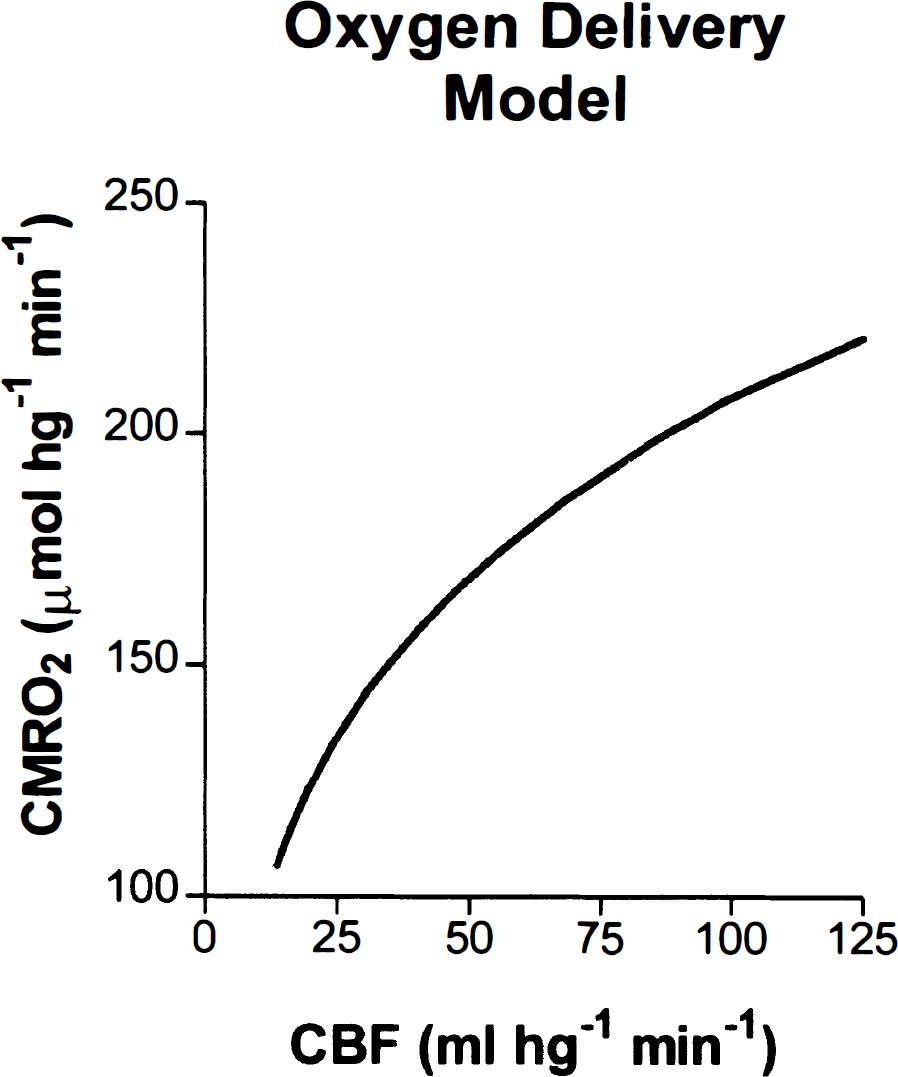
Because E is the ratio between J and FCa, Eqs. 1 and 6 together define a nonlinear relationship between J and F (Fig. 1) for typical values of Ca, L,P50, and h. Thus, when the mitochondrial oxygen tension is 0 at the far end of the diffusion path, L is determined from Eq. 6 when J and E are known. The nonlinear flow-metabolism couple predicted in Fig. 1 raises the question of the validity of this prediction during actual increases of oxygen consumption in human brain, i.e., the question of whether the increases of J (CMRO2) and F (CBF) obey Eq. 6.
Equation 6 enabled us to relate the oxidativity index (IO2), defined as the CMRO2/CBF ratio (J/F), to the oxygen extraction fraction. As an index of the oxidative breakdown of glucose prevailing in specific areas of the brain during physiological stimulation, this index, therefore, predicts the magnitude of the BOLD magnetic resonance contrast in cerebral capillaries and veins for a given stimulus (Ogawa et al., 1992; Kwong et al., 1992; Frahm et al., 1992; Bandettini et al., 1992). When F, L, and E are known, Eq. 6 shows that the IO2 depends on several factors in addition to F and E, including P50 and h that are themselves sensitive to other physiological influences. The goal of the present experiment was to test the validity of the prediction for changes of the oxygen consumption of visual cortex in healthy volunteers, elicited by visual stimuli with a changing flicker frequency of a yellow-blue contrast-reversing checkerboard.
MATERIALS AND METHODS
Twelve healthy volunteer subjects (6 men and 6 women; age range, 19 to 28 years; mean ± SD, 23 ± 3 years) gave informed written consent to the protocol approved by the Research Ethics Committee of the Montreal Neurological Institute and Hospital (Montreal, Quebec, Canada).
PET measurements
The PET studies were performed on the ECAT EXACT HR+ (CTI/Siemens, Knoxville, TN, U.S.A.) whole-body tomograph, operating in a three-dimensional acquisition mode, with a transverse resolution of 4.5 to 5.8 mm and an axial resolution of 4.9 to 8.8 mm (Adam et al., 1997). The images were reconstructed as 128 × 128 matrices of 2 mm × 2 mm pixels using filtered back-projection with an 8-mm Hanning filter (FWHM). Reconstructed images were corrected for random and scattered events, detector efficiency variations, and dead time. Three orbiting rod transmission sources, each containing approximately 5 mCi of 68Ge, were used for attenuation correction.
The subjects were positioned in the tomograph with their heads immobilized by means of a customized headholder (Vac-Lock; Med-Tech, Tulsa, OK, U.S.A.). A short indwelling catheter was placed into the left radial artery for blood sampling and blood gas examination. Arterial blood radioactivity was automatically sampled, corrected for delay and dispersion (Vafaee et al., 1996), and calibrated with respect to the tomograph using samples obtained manually during the last 60 seconds of each 3-minute scan. At the start of each CMRO2 scan, the subjects inhaled 20 mCi of 15O-O2 in a single breath, whereas at the start of each CBF scan, they were injected 20 mCi of H15/2O intravenously. The CMRO2 and CBF were calculated using the two-compartment, weighted integration method (Ohta et al., 1992, 1996). This method uses time-weighted integration to estimate three parameters, including the unidirectional clearance from blood to brain (K1), the fractional clearance of the distribution volume in brain (k2), the vascular volume correction (Vo) for distribution of the tracer, and estimates clearance of oxygen and water from blood to brain, respectively, with acceptable precision. However, a two-compartment model ignores the effect of the recirculating water from blood to brain. This model has been validated in different series of studies specifically to measure the CMRO2, where activation peaks are not as pronounced as CBF (Marrett and Gjedde, 1997; Vafaee et al., 1998; Fujita et al., 1999; Vafaee et al., 1999). Each subject also underwent a magnetic resonance imaging (MRI) examination on a Philips Gyroscan ACS (1.5 T; Philips Medical Systems, New Haven, CT, U.S.A.) superconducting magnet system for structural-functional (MRI-PET) correlation. The MRI scan was a T1-weighted, three-dimensional fast-field echo sequence consisting of 160 sagittal slices (256 × 256) of 1-mm thickness.
Stimulus conditions
The stimulus was generated with a Silicon Graphics workstation (SGI, Mountainview, CA, U.S.A.) and presented through a 21-inch NEC monitor (MultiSync XP21; NEC USA, Melville, NY, U.S.A.) with a synchronization range of 31 to 89 kHz horizontal, 55 to 160 Hz vertical, and a temporal resolution of 55 to 83 Hz. It consisted of a yellow-blue annular checkerboard with a diameter of approximately 17° of visual angle (for detailed explanation of the stimulus refer to Vafaee et al., 1999). In the baseline condition, the subjects were asked to fixate on a cross-hair in the center of the screen 30 seconds before the scan, and throughout the subsequent 3-minute scan. In three successive activation conditions, the subjects were shown a blue-yellow annular checkerboard reversing its contrast at frequencies of 1, 4, and 8 Hz. The order of baseline and stimulus presentation was randomized. Stimulation began 4 minutes before the start of the dynamic PET scan, and continued throughout the following 3-minute scan for a total of 7 minutes. There was a time gap of at least 15 minutes between each scan. Black drapes were used to create a dark environment around the screen.
Data analysis
MR images were transformed into stereotaxic coordinates (Talairach and Tournoux, 1988) by means of an automatic registration algorithm (Collins et al., 1994). The reconstructed PET images were co-registered with the subjects' MRI scans using an automatic registration program based on the Automatic Image Registration algorithm (Woods et al., 1992). For this purpose, the sum of the PET images across all frames was calculated for each scan. Then, the MRI image was aligned with the summed PET image. To correct for between-scan subject movements, PET-to-PET automatic registration was also performed (Woods et al., 1993). This method uses the first PET scan (summed across all frames) as the registration target for each subsequent summed PET scan. The global CMRO2 were determined for each subject by means of a binarized brain mask that filters out all extracerebral voxels. This mask was created by adjusting contrast threshold and manually editing the average MRI of 305 normal brains scanned at the Montreal Neurological Institute. The global CMRO2 for each subject was then determined by averaging the values of all intracerebral voxels. For the purpose of calculating the z statistic images, the reconstructed PET images were normalized for global CMRO2 and averaged across subjects. Mean subtracted image volumes (stimulation minus baseline) were obtained and converted to z statistic volumes by dividing each voxel by the mean standard deviation of the normalized subtraction image obtained by pooling the standard deviation (SD) across all intracerebral voxels. Significant focal changes of CMRO2 were identified by a method based on three-dimensional Gaussian random field theory (Worsley et al., 1996). Values equal to or exceeding a criterion of z = 3.5 were deemed statistically significant (P < 0.00046, two-tailed, uncorrected). Correcting for multiple comparison, a z-value of 3.5 yields a false positive rate of 0.26 in 70 resolution elements, each of which has dimensions 2.2 × 2.2 × 2.2 cm. This approximates the total volume of cortex scanned (2.2cm × 2.2cm × 2.2cm × 70 = 750cm3). The CMRO2 and CBF in primary visual cortex of each subject were also determined by manually drawn region of interests on PET images (registered on corresponding MR images) in Talairach space.
RESULTS
Average global CBF and CMRO2 values were determined for each subject. The average global CBF and CMRO2 values of the 12 subjects at the baseline and three stimulus frequencies are listed in Table 1. Analysis of variance revealed no significant effect of scanning condition on whole-brain CBF (F = 0.8; P > 0.5) or CMRO2 (F = 0.015; P > 0.5).
Average global CBF and CMRO2 values as a function of checkerboard contrast reversal rate measured in twelve subjects
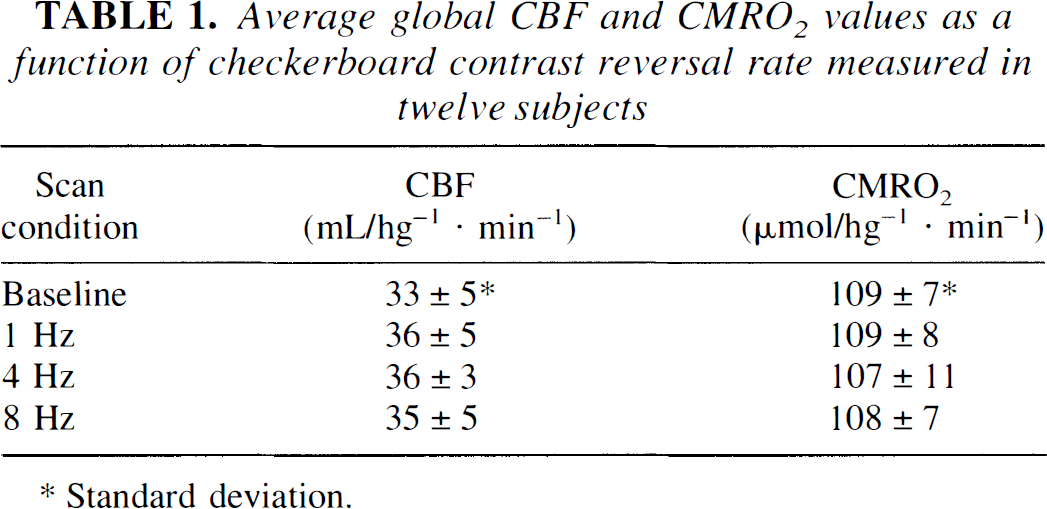
Standard deviation
In contrast, values of the regional CBF (rCBF) and regional CMRO2 (rCMRO2) in primary visual cortex (x = 10; y = −89; z = −3) varied with stimulus frequency (Table 2). The magnitude of CBF in the primary visual cortex increased in response to the stimulation and varied little among the three frequencies, though it did reach a maximum at 8 Hz (z = 16.0). The local changes are shown in Fig. 2, which presents the location and magnitude of the CBF increase at 8 Hz and the location and magnitude of the CMRO2 increase at 4 Hz.
CBF (mL/hg−1 · min−1), CMRO2 (μmol/hg−1 · min−1), E, Pcap (mm Hg), and L (μmol/hg−1 · min−1 · mm Hg−1) in visual cortex as a function of checkerboard contrast reversal rate.
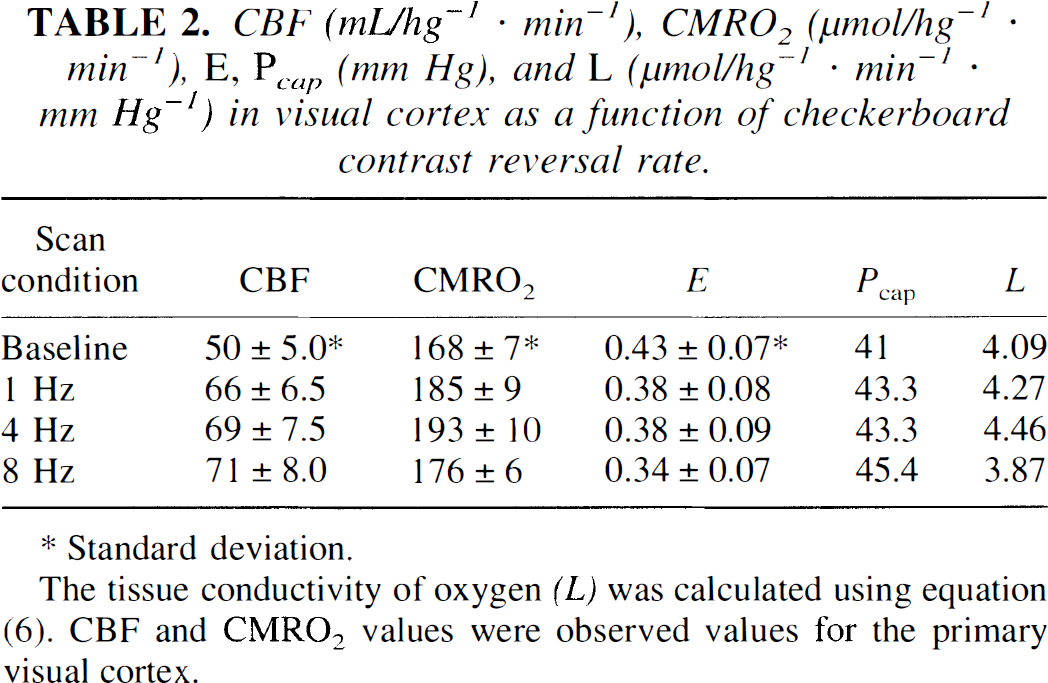
Standard deviation
The tissue conductivity of oxygen (L) was calculated using equation (6). CBF and CMRO2 values were observed values for the primary visual cortex.
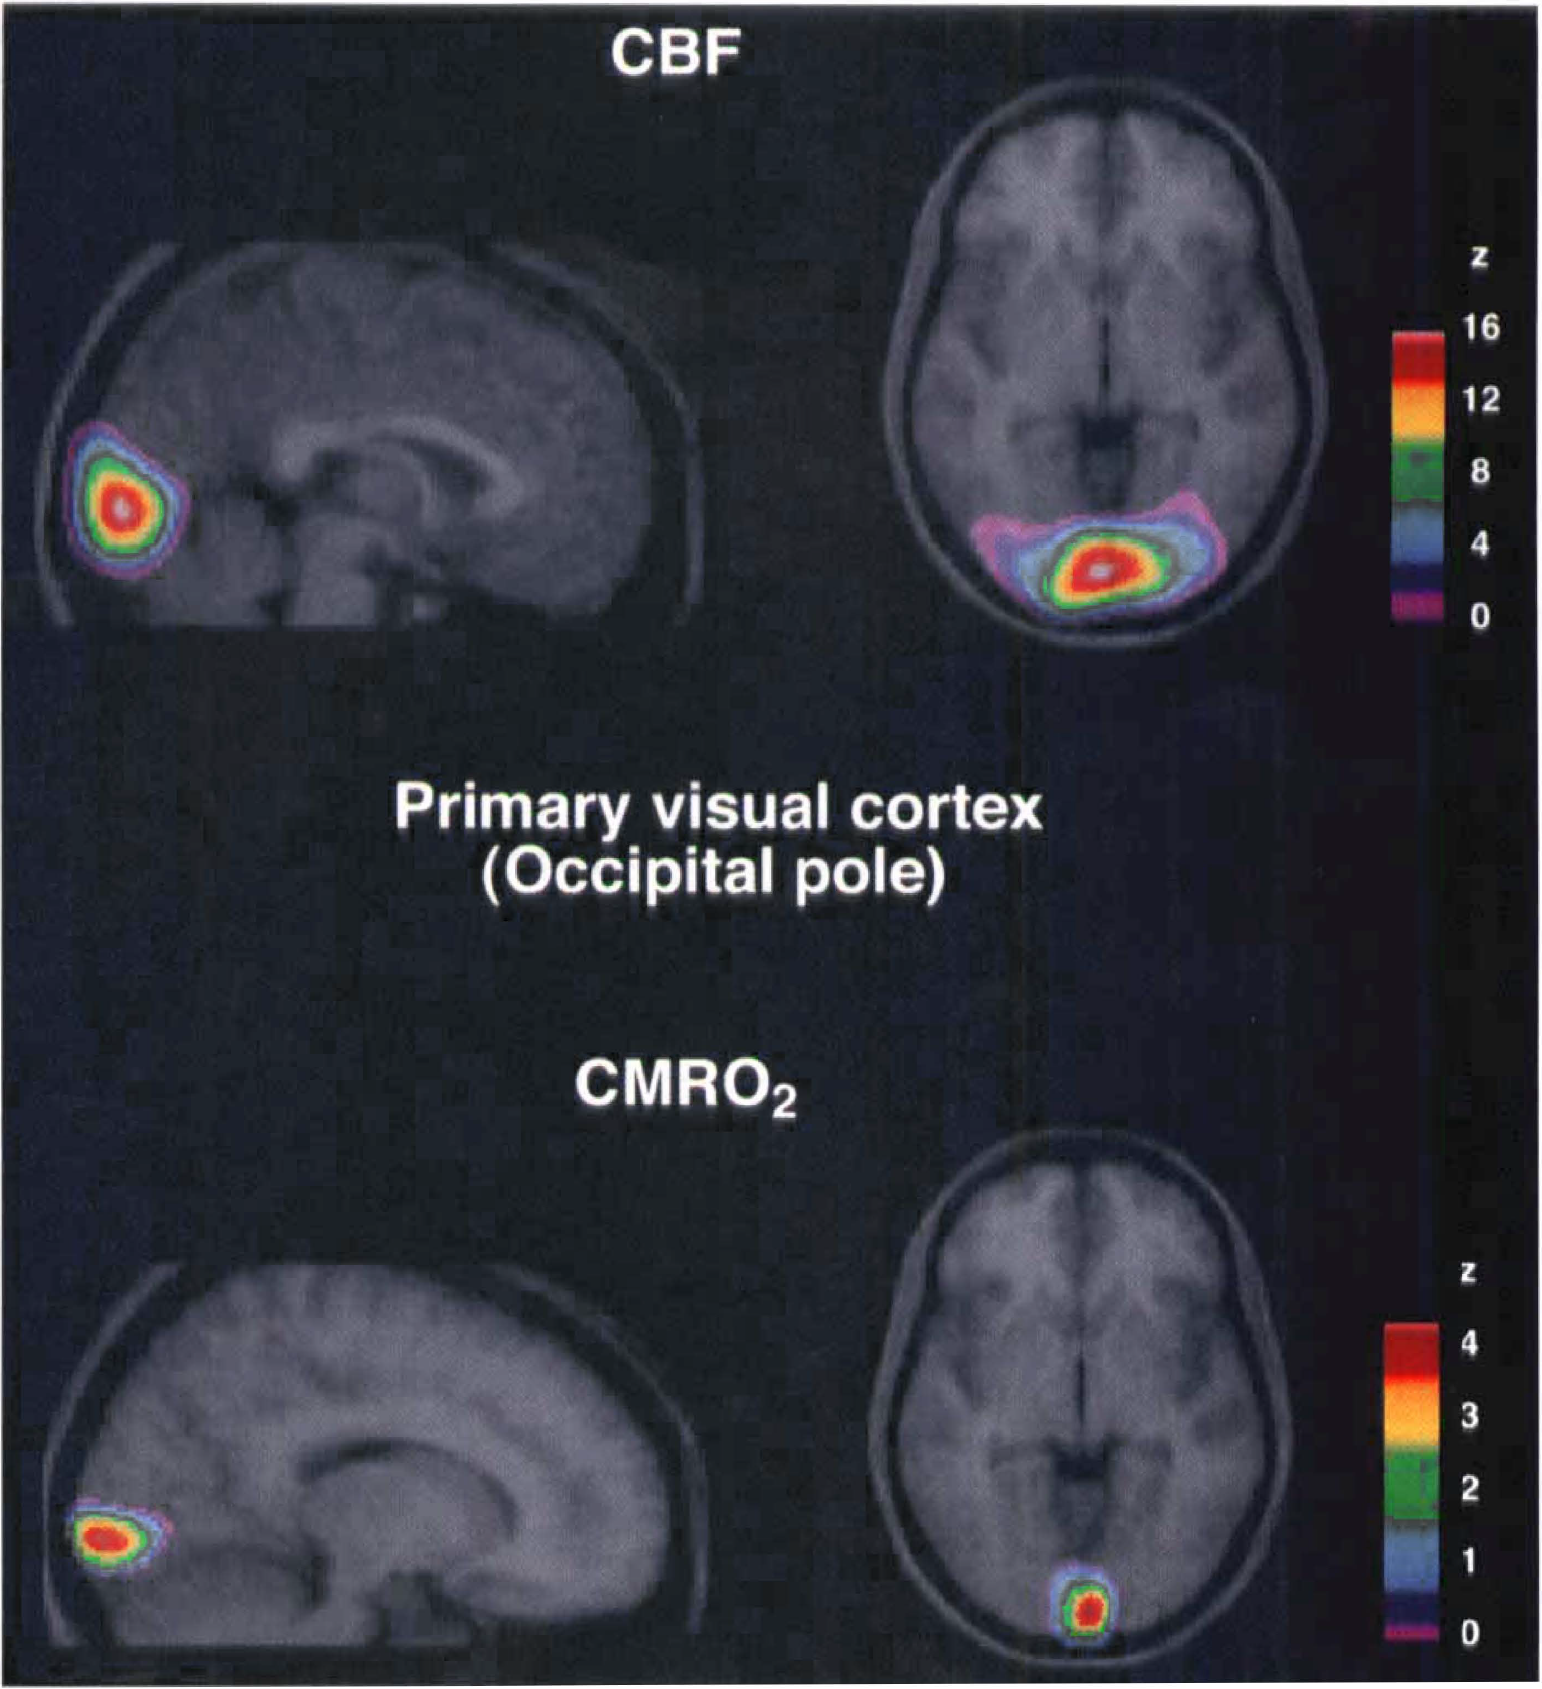
Averaged positron emission tomography (PET) subtraction images of cerebral blood flow (CBF) and cerebral metabolic rate of oxygen (CMRO2) superimposed upon averaged MR images. Subtraction of control images (n = 12) from activation images (n = 12) yielded the focal changes in CBF and CMRO2, shown as z-statistic images. Figure 1A shows the focal CBF changes in primary visual cortex (occipital pole) evoked by a stimulus frequency of 8 Hz which was the optimal stimulus for CBF. Figure 1B shows the CMRO2 changes in primary visual cortex (occipital pole) evoked by a stimulus frequency of 4 Hz which was the optimal stimulus for CMRO2.
In Fig. 3, the curve predicts the relationship between the blood flow and the oxygen consumption from Eqs. 1 and 6 for the baseline oxygen diffusion capacity of 4.09 μmol/hg−1 per min−1 · mm Hg−1, while the points show the actual measured oxygen consumption. The magnitude of the CMRO2 measured in primary visual cortex increased in response to the stimulus frequency until 4 Hz (z = 4.0), and then declined at 8 Hz (z = 2.0). One-factor analyses of variance of the rCBF and rCMRO2 values measured for the region of interest showed that the oxygen consumption varied significantly (P < 0.05) among the frequencies of 1, 4, and 8 Hz. As a consequence, the magnitude of the IO2, calculated from Eq. 6, was lower at 8 Hz than at 1 or 4 Hz. Figure 4 shows the fractional changes of all three measures at the three stimulation frequencies.
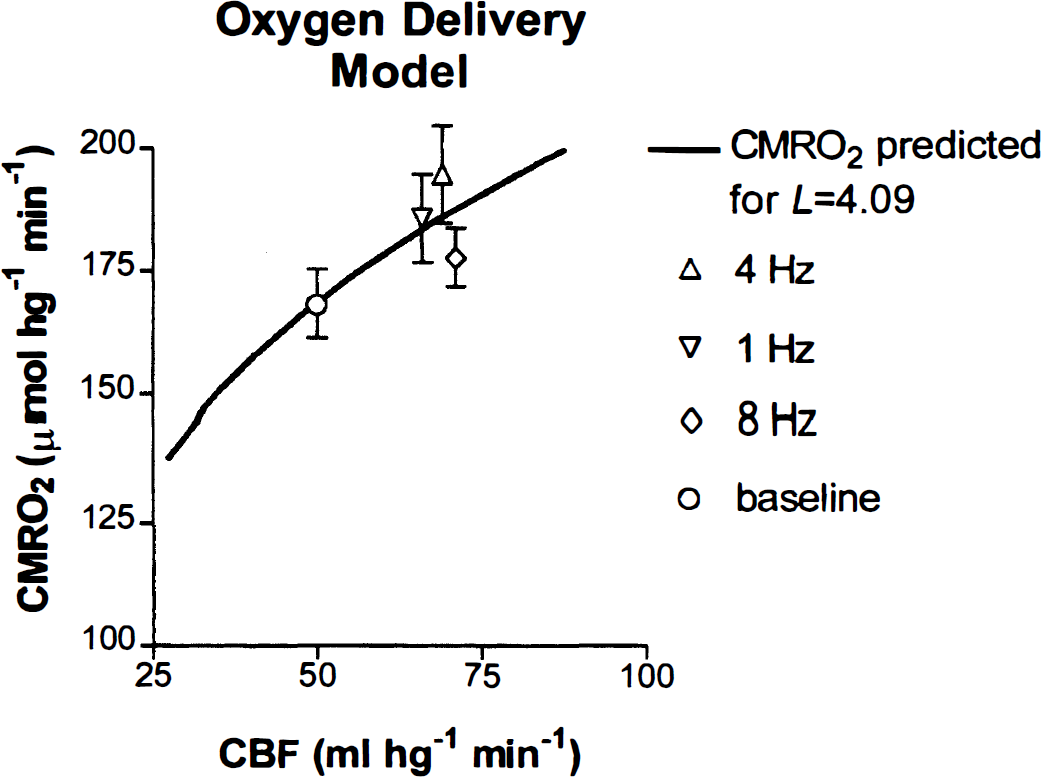
Relationship between predicted flow-metabolism couple (curve; see Fig. 1) and measured values of cerebral blood flow (CBF) and cerebral metabolic rate of oxygen (CMRO2) at baseline and three different frequencies of stimulation of visual cortex (points).
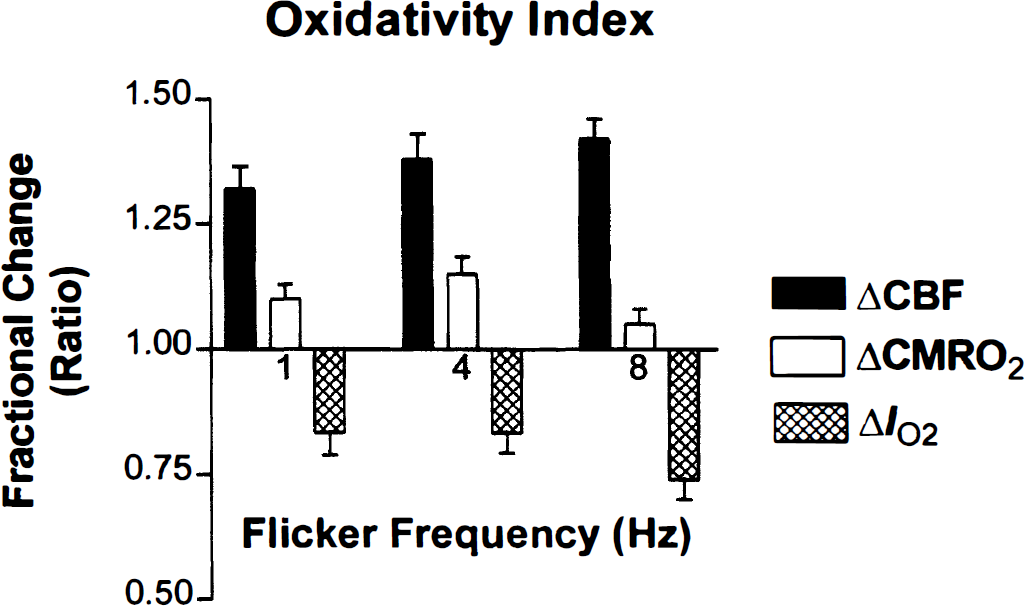
Percentage changes of cerebral blood flow (CBF), cerebral metabolic rate of oxygen (CMRO2), and IO2 calculated from Eq. 6, in primary visual cortex as a function of checkerboard contrast reversal rate. Note maximum IO2 change at 8 Hz.
The magnitude of L was calculated according to Eq. 6 for conditions at baseline, 1, 4, and 8 Hz. The calculated L increased at all frequencies relative to baseline, in apparent nonlinear proportion to the magnitude of the activated CMRO2 (Table 2). Figure 5 shows that each value of L corresponded to a different flow-metabolism tuning curve for each frequency. In Fig. 6, this increase of oxygen diffusion capacity is the independent variable, which adjusts the use of oxygen to the metabolic requirement generated by prevailing frequency of stimulation.
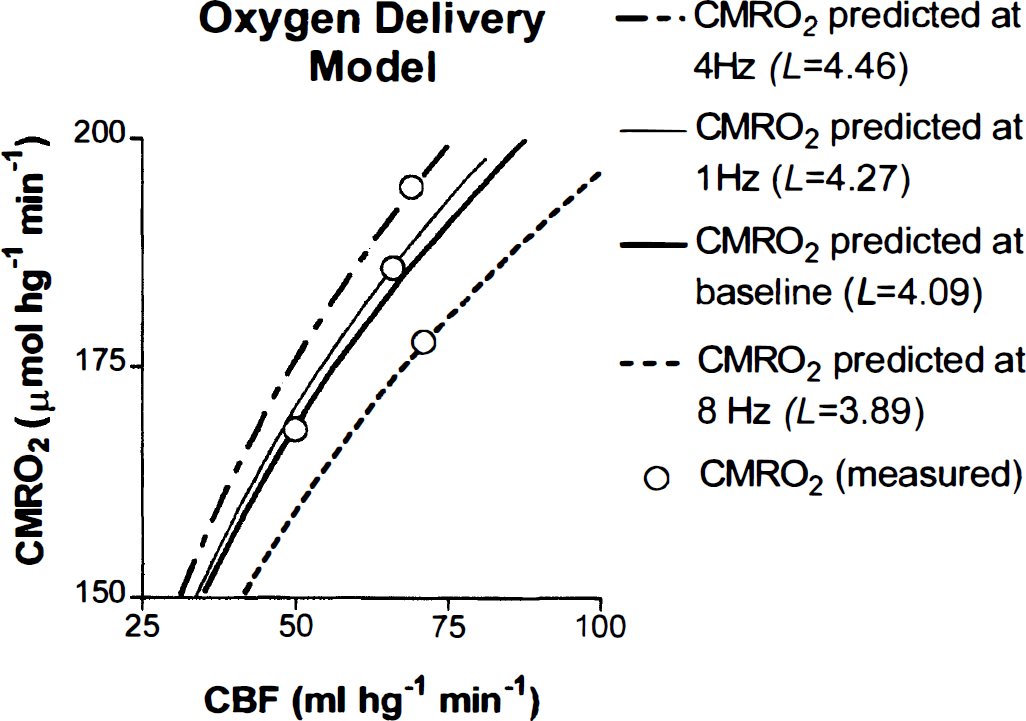
Predicted cerebral metabolic rate of oxygen (CMRO2) values for each frequency based on oxygen diffusion capacities L, calculated according to Eq. 6, determined for baseline and each frequency. Each value of L yielded a different flow-metabolism tuning curve for each frequency and baseline.
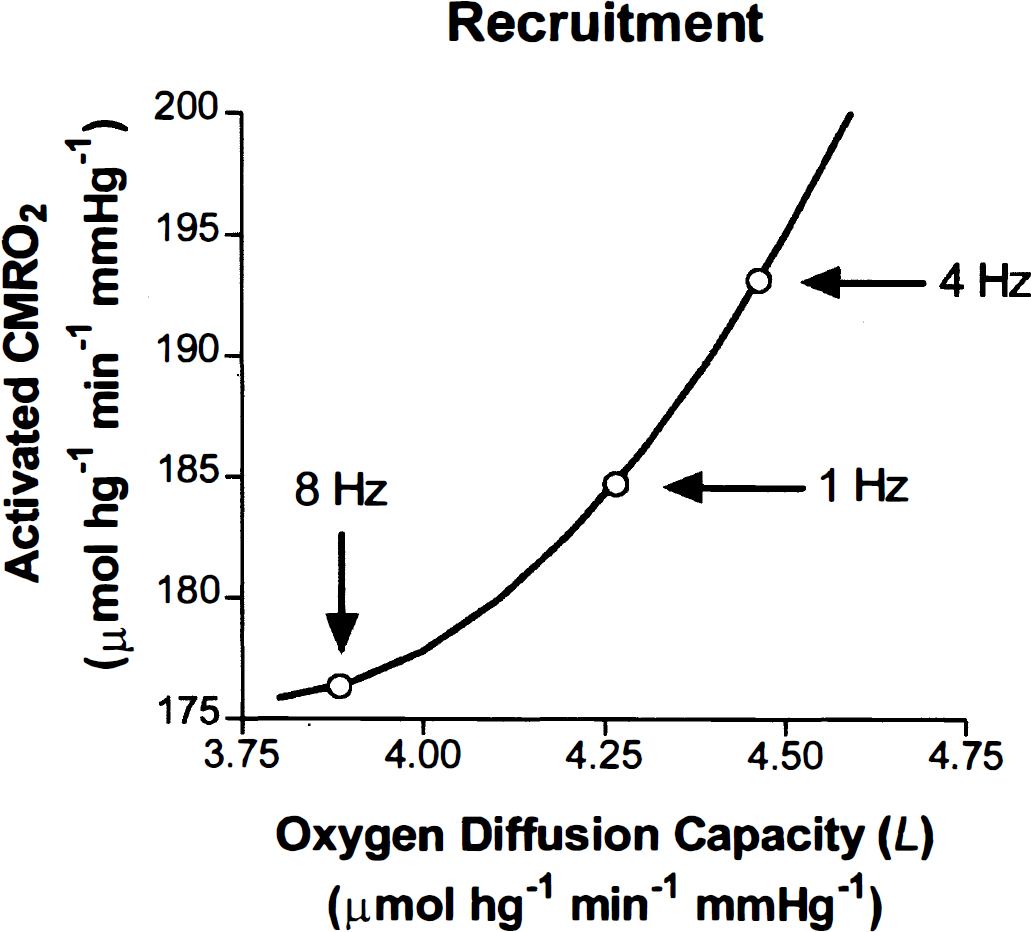
Hypothetical effect of changing oxygen diffusion capacity (L), calculated according to Eq. 6 on tissue cerebral metabolic rate of oxygen (CMRO2). The increase of oxygen diffusion capacity resulted in differential use of oxygen at different frequencies, predicting a role for capillary recruitment.
DISCUSSION
Van den Berg and Bruntink (1983) claimed that the rate of oxidative phosphorylation cannot keep pace instantaneously with the sevenfold increase of the rate of pyruvate production seen under the most extreme circumstances of glycolytic stimulation in the mammalian brain. According to this claim, pyruvate and, hence, lactate must both increase, at least until oxidative phosphorylation eventually matches the metabolic requirement of the tissue. In agreement with this claim, measurements of oxygen consumption made during brief sensory and visual stimulation of human cerebral cortex revealed little change of oxygen consumption (Fox and Raichle 1986; Seitz and Roland, 1992; Fox et al., 1988; Ribeiro et al., 1993). Yet, by mechanisms still unknown, blood flow increased markedly.
Gjedde (1997) formulated a model of blood-brain transfer of oxygen to account for the discrepant changes of oxygen consumption and blood flow during neuronal excitation. A somewhat different model was presented by Buxton and Frank (1997), who treated oxygen delivery to brain as a special case of the indicator dilution model of blood-brain transfer (Crone, 1963). Other studies show the relationship between CBF and CMRO2 by testing specific models of the supply of oxygen to brain tissue (Hyder et al., 1998; Hoge et al., 1999). These models make specific predictions regarding the relationship between oxygen consumption and blood flow. In general, the models express the claim that the mitochondrial oxygen tension is too low to allow increased oxygen consumption in the absence of increased oxygen diffusion capacity or increased capillary oxygen tension. In theory, circulatory changes could accomplish both. Increased blood flow would reduce the extraction fraction and elevate the capillary oxygen tension, whereas recruitment would increase the oxygen diffusion capacity and increase the extraction fraction (Krogh, 1919). To which degree these two mechanisms actually are involved in activation is not known but can be inferred from measurements of the extraction fractions. Increased blood flow in the absence of recruitment causes the oxygen extraction fraction to decline, whereas recruitment in the absence of increased blood flow causes it to increase. Both processes in equal proportions lead to no net change of the extraction fraction. The present study showed a decline of extraction fraction consistent with increased blood flow in excess of the oxygen consumption.
Stimulation frequency influences rCBF in visual cortex (Fox and Raichle, 1985) and in auditory and motor cortices (Price et al., 1992; Sadato et al., 1996). Recently, we confirmed the frequency-dependent change of the rCMRO2 in visual cortex by means of PET (Vafaee et al., 1999). The purpose of the present study was to test whether the response to stimulation involved an increase of blood flow alone as predicted by the blood-brain oxygen transfer model, or whether a change of the oxygen diffusion capacity occurred as well. For this purpose, we used the yellow-blue reversing checkerboard stimulus that has previously been shown to lead to a significant increase of rCMRO2 in primary visual cortex (Marrett and Gjedde, 1997; Vafaee et al., 1998). The results showed that the magnitude of rCMRO2 measured at 4 minutes of stimulation did not vary as a simple function of stimulus frequency. Unlike rCBF, which continued to increase until 8 Hz, in this study, rCMRO2 reached a peak at 4 Hz and declined at 8 Hz (Fig. 4).
Although the blood flow appeared to react primarily to the application of the stimulus, the changes of the oxygen diffusion capacity appeared to correlate with the oxygen consumption at the individual frequencies (Fig. 6). The combined changes indicated that the IO2 (and hence the BOLD magnetic resonance contrast) may not be a faithful index of neuronal work.
Thus, we concluded that elevation of oxidative metabolism in response to an adequate stimulus occurs by changes of both blood flow and oxygen diffusion capacity, though the blood flow change alone exceeded the change of oxidative metabolism. The model of oxygen delivery incorporates the claim that oxygen transfer to mitochondria in brain occurs in a barrier-limited fashion (Kassissia et al., 1995). When the mitochondrial oxygen tension is negligible at the far end of the diffusion path, the predicted relationship satisfies Eq. 6. It is overcome whenever blood flow increases sufficiently to increase the average oxygen tension in capillary blood. However, when the barrier to increased oxygen delivery is lifted by the increase of blood flow, it appears that the increased blood flow is accompanied by increased oxygen consumption only under some conditions. In the present study, the model showed that the additional changes of L, the index of recruitment, occurred in nonlinear proportion to the measured oxygen consumption.
To account for the relative changes of blood flow and oxygen diffusion capacity, we speculate that a second mechanism acted to adjust the diffusion capacity to augment the increase of CMRO2 initiated by the blood flow increase. This secondary mechanism seems to depend on the adequacy of the stimulus load. In this context, the term stimulus “load” refers to the sum of the stimulus effects on the system as a function of time and intensity, whereas the term “adequacy” of the stimulus classically refers to that stimulus to which the system responds optimally. The oxygen consumption curve (Fig. 3), drawn on the basis of the CBF tuning curve, predicts very small CMRO2 differences among the three frequencies. However, only at the frequency of 1 Hz was the magnitude of CMRO2 close to that predicted by the model. At 4 Hz, the CMRO2 exceeded the level predicted by the blood flow increase, whereas, at 8 Hz, it fell short of the level possible. Thus, although blood flow to the brain is increased, the stimulus appears to exert a local influence on the oxygen diffusion capacity. After the application of any stimulus, the blood flow change may, therefore, be viewed as a basic response. However, in addition, the diffusion capacity is adjusted locally to the specific stimulus. This hypothesis also explains why certain stimuli, such as a photic stimulus, tend to yield in a lower oxidativity index in visual cortex (e.g., Ribeiro et al., 1993).
Alternatively, the low stimulus “load” at 8 Hz may signify activation of other neurons supplied by a separate vascular bed with a lower capillary density and, hence, lower oxygen diffusibility, because an increase of capillary density augments the oxygen diffusion capacity by reducing the radius of the Krogh cylinder, thus increasing oxygen diffusibility (Krogh, 1919). This differential response suggests that capillary density and hence oxygen diffusibility may be coupled to the oxygen demand of specific populations of neurons.
We conclude that changes of blood flow are less specifically coupled to the stimulation of the visual cortex than are the changes of oxygen consumption. Under some circumstances, this discrepancy can cause the oxidativity index to be a poor index of the physiological stimulation of a sensory system.
Footnotes
Abbreviations used
Acknowledgements
The authors thank the cyclotron staff for providing the radioisotopes; the technicians for their assistance with the positron emission tomography (PET) experiments; Drs. Hidehiko Okazawa and Paul Cumming for their valuable comments and insights; and Mr. Peter Neelin for his helpful comments with regard to image analysis.