
Abstract
The use of near-infrared spectroscopy to measure noninvasively changes in the redox state of cerebral cytochrome oxidase in vivo is controversial. We therefore tested these measurements using a multiwavelength detector in the neonatal pig brain. Exchange transfusion with perfluorocarbons revealed that the spectrum of cytochrome oxidase in the near-infrared was identical in the neonatal pig, the adult rat, and in the purified enzyme. Under normoxic conditions, the neonatal pig brain contained 15 μmol/L deoxyhemoglobin, 29 μmol/L oxyhemoglobin, and 1.2 μmol/L oxidized cytochrome oxidase. The mitochondrial inhibitor cyanide was used to determine whether redox changes in cytochrome oxidase could be detected in the presence of the larger cerebral hemoglobin concentration. Addition of cyanide induced full reduction of cytochrome oxidase in both blooded and bloodless animals. In the blooded animals, subsequent anoxia caused large changes in hemoglobin oxygenation and concentration but did not affect the cytochrome oxidase near-infrared signal. Simultaneous blood oxygenation level-dependent magnetic resonance imaging measurements showed a good correlation with near-infrared measurements of deoxyhemoglobin concentration. Possible interference in the near-infrared measurements from light scattering changes was discounted by simultaneous measurements of the optical pathlength using the cerebral water absorbance as a standard chromophore. We conclude that, under these conditions, near-infrared spectroscopy can accurately measure changes in the cerebral cytochrome oxidase redox state.
Keywords
Near-infrared spectroscopy (NIRS) is a method that takes advantage of the relative transparency of tissue to wavelengths of light in the 700- to 1000-nm wavelength range to measure tissue properties noninvasively (Jöbsis, 1977). There are four primary chromophores that are detectable in this region: deoxyhemoglobin (Hb), oxyhemoglobin (HbO2), water, and the mitochondrial enzyme cytochrome oxidase. The main use of the technique in clinical and biomedical research has focused on the strong signals available from the hemoglobin chromophores and their relation to cerebral physiology and pathophysiology. These include measurements of CBF (Edwards et al., 1988), cerebral blood volume (Wyatt et al., 1990), imaging of hypoxic tissue (Vanhouten et al., 1996), functional imaging (Villringer et al., 1993), and detection of hematomas (Robertson et al., 1995). The technique is not restricted to the brain, however, and also has had success in measuring muscle metabolism (Jöbsis, 1977; Piantadosi et al., 1986) and myopathies (Chance and Bank, 1995). A review covers all of these aspects of NIRS (Chance et al., 1997).
Changes in hemoglobin oxygenation and concentration yield useful information about oxygen delivery and indirectly about mitochondrial oxygen metabolism. However, NIRS also directly measures mitochondrial function, since the enzyme that consumes oxygen, cytochrome c oxidase, has a strong absorbance in the near-infrared (NIR) (Boelens et al., 1982; Jöbsis, 1977) because of the presence of a unique Cu-Cu dimer, termed CuA, within its structure (Tsukihara et al., 1995). The dimer CuA has strong NIR charge transfer bands, and when an electron enters this site, the NIR absorbance is bleached. Therefore, NIR can detect changes in the redox state of this center, which in principal can reflect changes in intracellular oxygen concentration (Jöbsis, 1977) and the mitochondrial electron flux/energy state (Cooper et al., 1994).
However, there are significant problems in detecting this cytochrome oxidase NIR signal in the presence of the more highly concentrated hemoglobin. Therefore, since its inception in 1977 (Jöbsis, 1977), this field of research has been bedeviled by problems of data interpretation and questions as to whether the signals observed really arise from cytochrome oxidase or are artifacts of the algorithms used to deconvolute the optical density changes to chromophore concentration changes (Hazeki et al., 1987; Macnab and Gagnon, 1996; Matcher et al., 1995; Miyake et al., 1991; Piantadosi et al., 1993; Wray et al., 1988).
Our interest in this area has been rekindled by two recent findings: (1) in animal models, the cytochrome oxidase (not the hemoglobin changes) correlate with cerebral energy failure (Cooper and Springett, 1997; Inagaki and Tamura, 1993; Tsuji et al., 1996); and (2) in patients, there are several cases where this signal is more useful clinically than other noninvasive measurements, for instance, in monitoring the treatment of patent ductus arteriosus (Patel et al., 1995) or neurologic dysfunction during cardiac surgery in the adult (Nollert et al., 1995) and child (du Plessis et al., 1995).
We therefore set up a worst case scenario to test our ability to measure cytochrome oxidase noninvasively under extreme conditions. Using a neonatal animal (with only about half of the adult cytochrome oxidase content), we fixed the cytochrome oxidase redox state by using mitochondrial inhibitors that we knew would induce complete reduction of the CuA center. We then caused large changes in the hemoglobin oxygenation and concentration in an attempt to induce spurious changes in the cytochrome oxidase signal (Matcher et al., 1995). This attempt failed, and we are thus confident that, under these conditions, we can accurately measure changes in the cytochrome oxidase redox state noninvasively, and hence mitochondrial function and dysfunction in vivo.
METHODS
Animal preparation
All animal studies were performed under the appropriate UK Home office guidelines. Large white piglets were studied on the first day of life and prepared essentially as described previously (Lorek et al., 1994). After sedation with intramuscular midazolam (0.2 mg·kg−1) anesthesia was induced with 5% isoflurane and maintained with nitrous oxide, oxygen, and <1.5% isoflurane. An endotracheal tube was passed (later replaced by a tracheostomy), and a pressure-limited ventilator was set at a respiratory frequency of 10 to 20 breaths·min−1; the inspiratory time was 0.6 to 1.0 seconds, the peak inspiratory pressure was 1.0 to 1.5 kPa, and the positive end-expiratory pressure was 0.1 to 0.3 kPa. Arterial blood gases were routinely taken, and these parameters and the fraction of inspired oxygen (Fio2) were adjusted to provide a Pao2 of 8.0 to 13.0 kPa and a Paco2 of 4.5 to 6.5 kPa during the surgery. The umbilical vein and artery were cannulated with 3.5-mm outer diameter polyvinyl catheters. A 10% glucose solution that provided 0.4 to 0.6 mg·kg−1·h−1 morphine sulfate was infused at 3 to 6 mL·h−1 through the venous catheter. An infusion of 0.9% saline containing 1 U of heparin L−1 was provided at 1 to 2 mL·h−1 through the arterial catheter, which was attached to a straingauge blood pressure transducer. Heart rate was monitored using an ECG or from the pressure wave of the arterial transducer. Arterial saturation was monitored with a pulse oximeter and was above 95% throughout the preparation.
Before the NIRS study, the inspired gases were changed to Fio2 (99%) and isoflurane (1%). Compounds were injected intravenously into the umbilical catheter. Bolus injections of sodium cyanide were made intravenously (5 mg/kg from a 25-mg/mL stock solution in saline) followed by a 2-mL flush of saline. The Fio2 was reduced to zero by replacing inspired oxygen completely with nitrous oxide or nitrogen (while maintaining anesthesia with <1.5% isoflurane). The animals then were killed by increasing the isoflurane to 5% or by intravenous injection of sodium pentobarbital.
Perfluorocarbon perfusion
In one piglet, blood was replaced as an oxygen carrier by the fluorocarbon perfluorotributylamine (FC43, Green Cross Corp., Osaka, Japan). The Fio2 was increased to 0.99 throughout the exchange and subsequent studies. Over a 10-minute period, 30 mL of blood was removed from the umbilical artery while simultaneously replacing it with 45 mL of saline through the umbilical vein. This process was continued until the blood hemoglobin concentration dropped below 3 g/100 mL when the saline injection was replaced with 40 mL of the FC43 emulsion. At no time during the transfusion did the blood pressure drop below normal levels. Near-infrared spectroscopy of the brain was used to report on the extent of the transfusion, and the transfusion continued until no detectable changes in cerebral hemoglobin concentration could be measured. For a 1.5-kg piglet, this required a total volume of 290 mL of saline and 910 mL of FC43. For the adult rat, the fluorocarbon exchange and subsequent spectroscopy was performed as described previously (Wray et al., 1988).
Near-infrared spectroscopy
The piglets were placed in a custom-made pod inside the bore of a 7-T/20-cm bore magnet linked to a Biospec spectrometer (Bruker Instruments, Inc., Karlsruhe, Germany). The head was fixed in a stereotactic as described previously (Lorek et al., 1994). A 2.5-cm surface coil was positioned on the intact skull over the parietal lobes. Two end-on fiber optodes were placed directly on the head, just above and behind each eye. The angle of the optodes was approximately 90°, similar to NIRS studies on neonatal humans (Edwards et al., 1992). The skull was shaved, and the shaved skull, as well as the inside of the pod, were painted black to prevent scattered light from directly traveling from source to detector fiber. A multiwavelength light source and a charge-coupled device spectrometer system were used as described in detail elsewhere (Cope et al., 1989) to simultaneously measure optical density changes between 700 and 1000 nm. Briefly, the system uses a quartzhalogen light source, a commercial grating spectrograph, and a liquid nitrogen-cooled charge-coupled device detector to obtain continuous NIR spectra at 1.1-nm pixel size. For all of the experiments performed here, the monochromator entrance slit width was set at 110 μm, resulting in an effective resolution of 5 nm. Before each study, a spectrum was recorded in the absence of the light source, and in all cases this was indistinguishable from the dark count of the charge-coupled device. Although data can be obtained at 1 to 5 seconds' time resolution, the data were integrated over a 20-second period to improve the signal-to-noise ratio. The spectrum of a low-pressure neon discharge lamp was used to confirm the wavelength calibration of the spectrograph.
Second differential spectroscopy of the water peaks at 730 and 830 nm and the Hb peak at 760 nm was used to measure the mean optical pathlength and the absolute Hb concentration, respectively (Cooper et al., 1996) assuming a neonatal cerebral water content of 85%. The optical density changes were deconvoluted into changes in chromophore concentration (μmol·L·cm) by the method described previously (UCLn algorithm) using multiple (more than 100) wavelengths evenly spaced between 780 and 900 nm (Matcher et al., 1995). Briefly, this method converts optical density changes to chromophore concentration changes using multilinear regression fitting to the specific absorption coefficients of Hb, HbO2, and cytochrome oxidase. The values of these coefficients have been published for the hemoglobin species (Matcher et al., 1995) and cytochrome oxidase (Wray et al., 1988). Light of different NIR wavelengths travel different distances through tissue because of the wavelength-dependent effects of both light scattering and hemoglobin absorbance. Therefore, the optical pathlength of multiply scattered NIR light in vivo varies with the wavelength (Essenpreis et al., 1993). This distorts the shape of the in vivo spectra. To compensate for this effect, before the regression analysis, the in vitro spectra are multiplied by the appropriate differential pathlength factor at each wavelength (e.g., 1.0 at 780 nm and 0.81 at 900 nm). The values of these differential pathlength factors are obtained directly from previously published data (Essenpreis et al., 1993). The multilinear regression generates data with concentration units of micromoles per liter per centimeter (μmol·L·cm). Second differential spectroscopy of water features was used to measure the mean optical pathlength over the range 710 to 840 nm; this value then was used to convert from micromoles per liter per centimeter (μmol·L·cm) into micromoles per liter (μmol/L) chromophore concentration changes (Cooper et al., 1996). The purified spectra of cytochrome oxidase, cytochrome c, and cytochrome b in the NIR region were measured as described previously (Cope, 1991).
Magnetic resonance imaging
The 2.5-cm surface coil was used for both radiofrequency transmission of pulses and for signal detection. Before commencement of imaging, the magnet was shimmed to obtain a half-height linewidth of the water resonance of less than 36 Hz. The T2*-weighted magnetic resonance (MR) imaging was performed using a fast low-angle shot sequence sequence with an extended gradient echo time. Images were obtained with an echo time of 25 milliseconds (TR = 84 milliseconds, slice thickness = 4 mm, field of view = 6 cm, image matrix size = 256 × 128). After obtaining baseline images during normoxic conditions, simultaneous MR imaging and NIRS data were collected during the experimental time period.
RESULTS
Comparison of in vitro and in vivo spectra of mitochondrial cytochrome oxidase
Mitochondrial cytochrome oxidase has a distinct absorbance in the NIR. This signal is almost entirely due to the CuA center, as evidenced by its absence in bacterial cytochrome oxidases that lack the CuA metal center (Henning et al., 1995). The signal intensity decreases on reduction of this center, that is, as the copper goes from the CuII to CuI redox state. The in vitro reduced-minusoxidized spectrum is well characterized (Cooper et al., 1994; Wharton and Tzagoloff, 1964), but controversy exists over the in vivo spectrum, with some groups claiming that the enzyme's NIR spectrum is different in vivo (Inagaki and Tamura, 1993; Jöbsis-VanderVliet and Brazy, 1995 Piantadosi, 1993) whereas others find no change (Ferrari et al., 1995; Miyake et al., 1991; Wray et al., 1988). The in vivo spectra are obtained by reducing the Fio2 in a blood-free perfluorocarbon-perfused animal; it is assumed that changes in the NIR region are caused by the reduction of cytochrome oxidase CuA as electrons remain stuck on the enzyme in the absence of a high enough concentration of the oxidant, oxygen.
We were concerned about the variability of the data in the literature: to our knowledge there has been no reported spectrum of human cytochrome oxidase in the NIR region, and if cytochrome oxidase spectra really vary in vivo, then deconvolution algorithms extrapolated from rat brain data (as is usually the case) would be useless in humans. We also were worried about the relative paucity of cytochrome oxidase spectra from the neonatal brain, given that there is a large amount of neonatal clinical data reporting to measure cytochrome oxidase changes and the fact that it has been suggested that in the neonatal cat and dog the CuA NIR absorbance band is missing (Jöbsis-Vandervliet, 1991).
We therefore measured the NIR spectra (anoxic minus normoxic) in perfluorocarbon-perfused 1-day-old piglets and adult rats and compared these with the purified spectra of mitochondrial cytochromes (reduced minus oxidized) in the ratio known to exist in rat brain (Fig. 1A). Not only are the shapes of the neonatal pig and adult rat in vivo spectra indistinguishable, they are essentially identical to that of the in vitro cytochromes (over 97% of the absorbance change can be explained by the optical spectra of the purified species). Difference spectra (minus the purified species) reveal the possibility of a small additional feature in the data at 830 nm in the piglet in vivo. This corresponds to less than 3% of the total absorbance change. Both water and cytochrome c have absorbance changes in this region; this small change could arise either from slight changes in the optical pathlength during anoxia or from differences in the cytochrome c-cytochrome oxidase ratio between the piglet and rat brain. In practical terms (i.e., in the presence of the larger hemoglobin concentrations in the normal brain), such a small spectral feature could not be detected, and any difference of this magnitude would be irrelevant to the fitting algorithms employed.
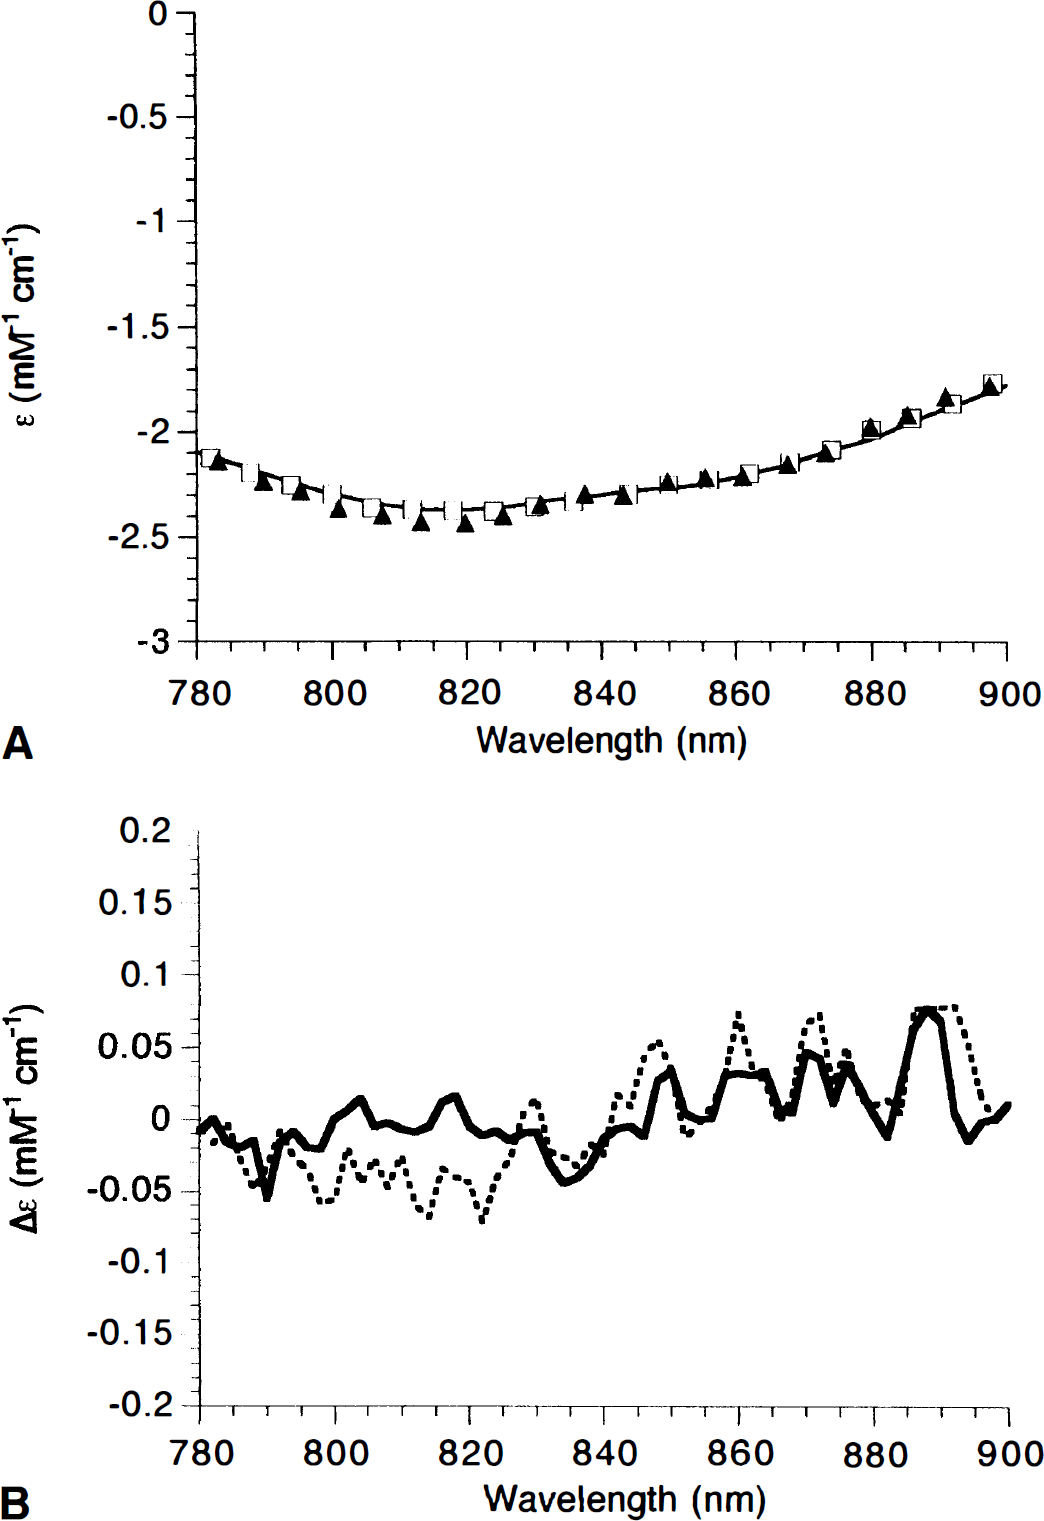
Comparison of cytochrome near-infrared (NIR) spectra from purified components, adult rat, and neonatal pig.
Notice that although a slightly better fit is obtained if, as in Fig. 1, cytochrome c and cytochrome b are included in the in vitro data, the spectrum of the purified cytochromes in the 780- to 900-nm region depicted here is dominated by cytochrome oxidase; cytochrome c becomes increasingly more important at shorter wavelengths because of its charge transfer band at 695 nm (Cooper et al., 1994).
The similarity in these spectra suggests that age and species differences do not affect the shape of the cytochrome oxidase spectrum unduly, although they relate to the total cytochrome oxidase content of the tissue under investigation, since the neonate is expected to contain less enzyme (Clark et al., 1994). This was confirmed by results showing that the amount of cytochrome oxidase reduction observed in the rat brain on anoxia was approximately double that of the neonatal pig (results not shown).
Testing algorithms for measuring redox state changes in cytochrome oxidase in vivo
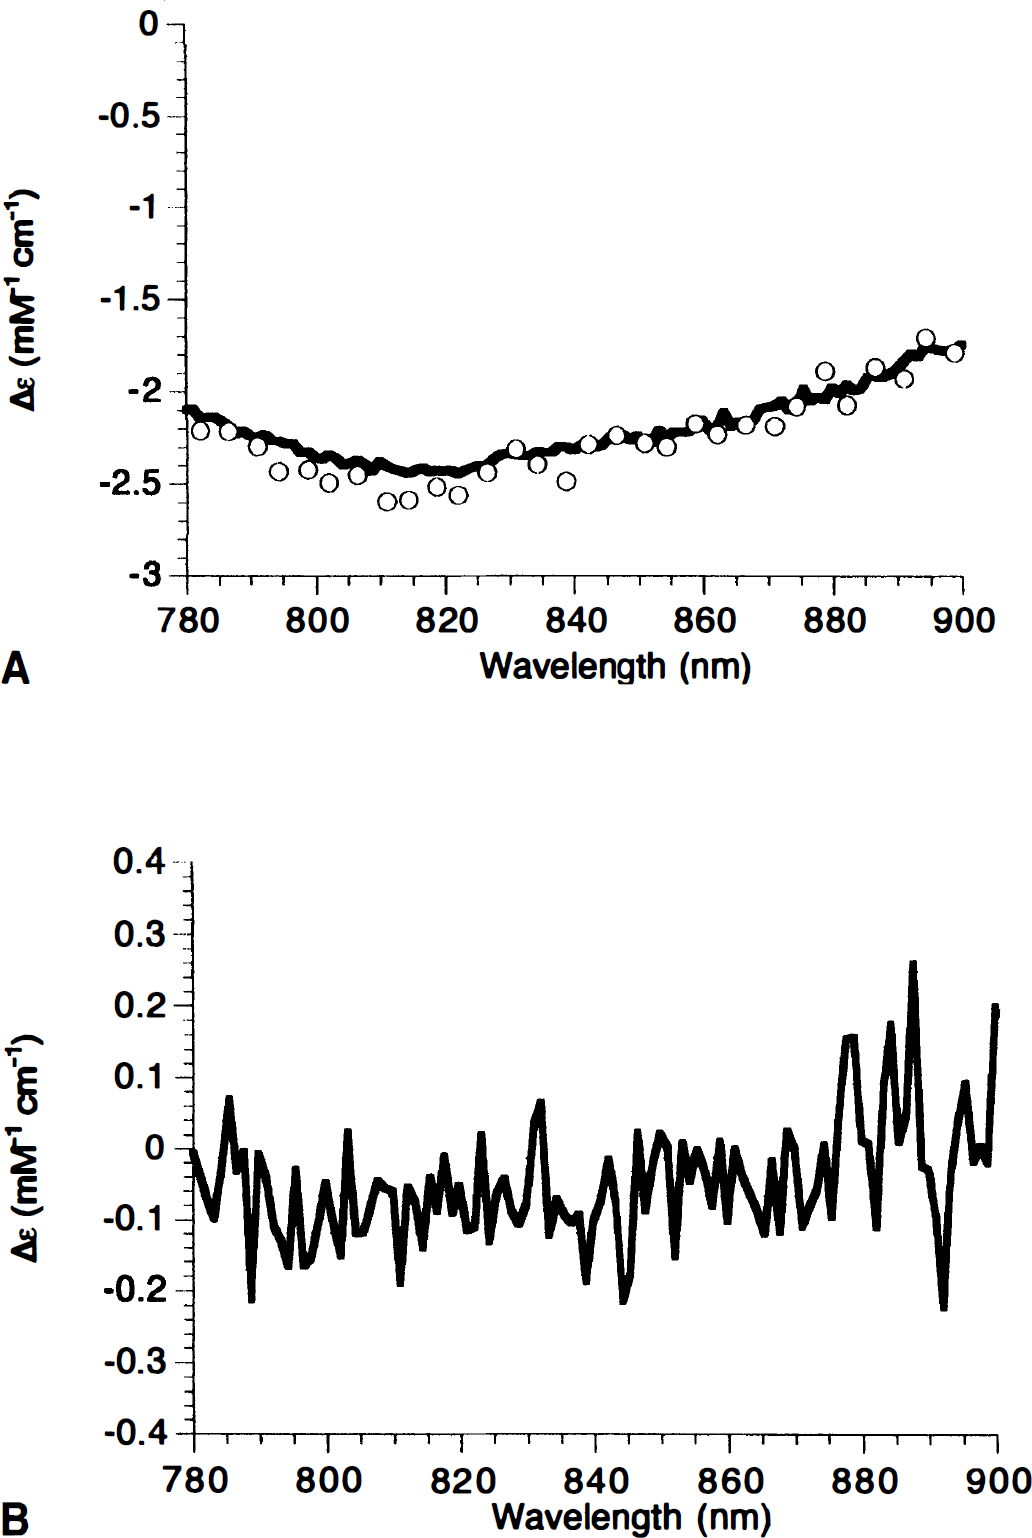
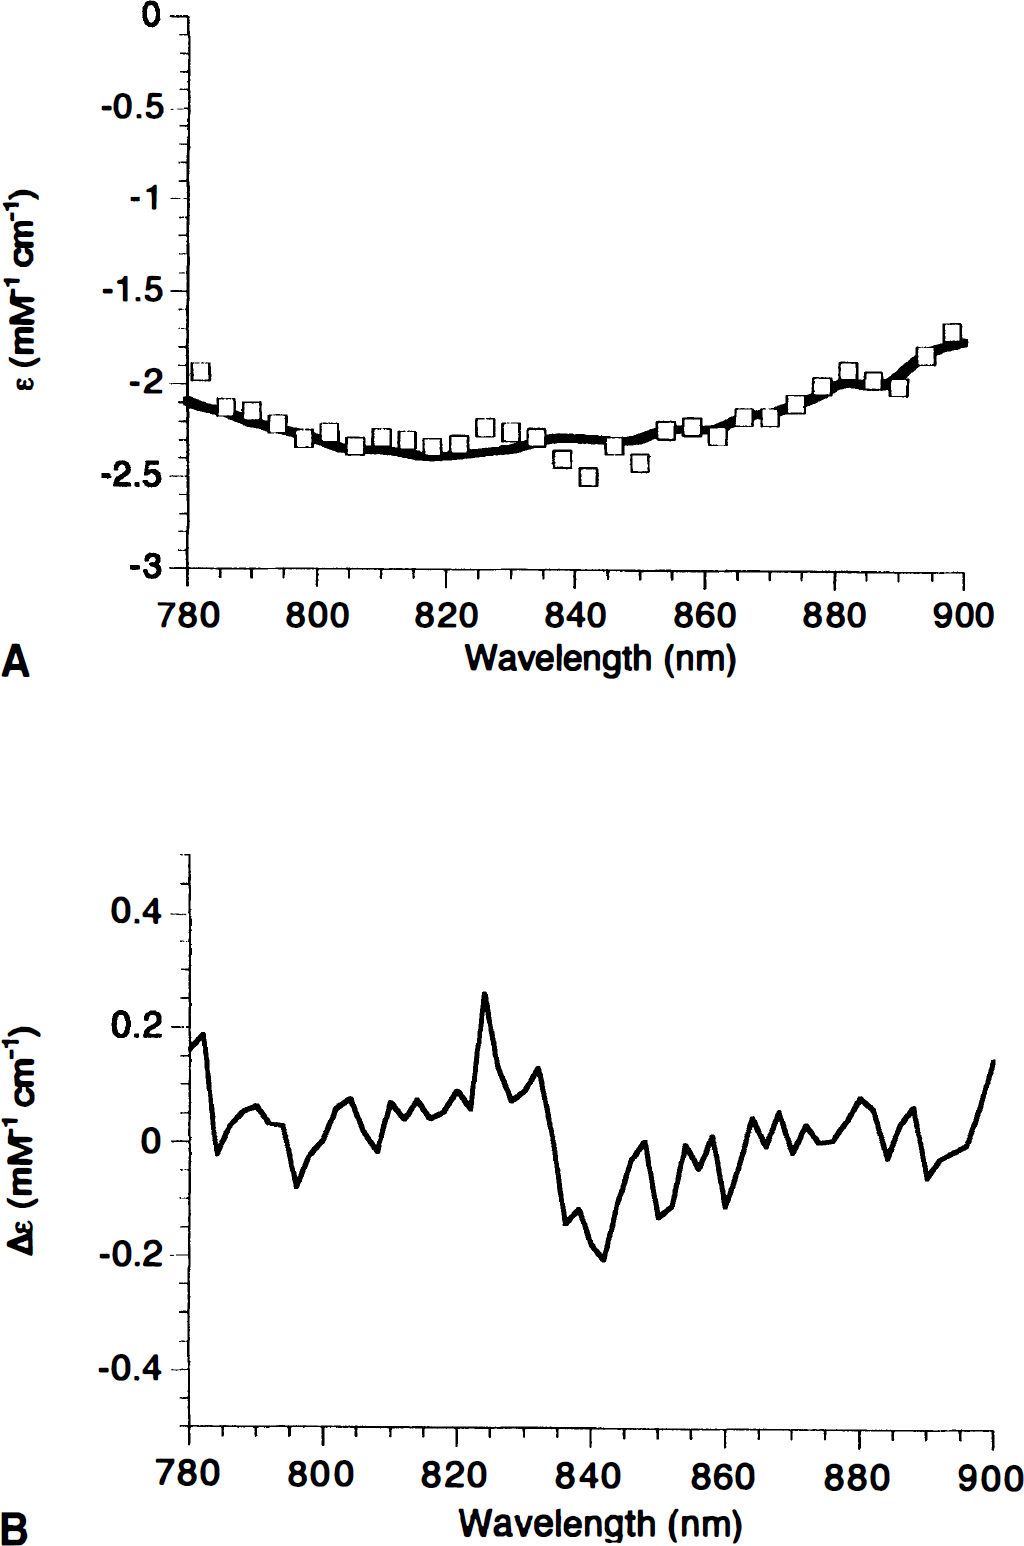
Although Fig. 1 shows that the NIR spectra of cytochrome oxidase is identical in different systems (as is that of HbO2 and Hb), it is still a nontrivial matter to measure changes in its redox state in vivo. We have developed an algorithm that fits the optical density changes collected simultaneously over a wide range of wavelengths to changes in the [HbO2], [Hb], and the redox state of cytochrome oxidase ([cyt]). This algorithm has some limitations in that it does not allow for changes of optical pathlength occurring during an experiment, either from a change in light scattering or a large change in the absorbance (when light is multiply scattered, the mean pathlength of the detected photons decreases with increasing chromophore absorbance, since fewer long pathlength photons can avoid being absorbed before reaching the detector). Modeling studies demonstrate that this might prove to be a problem during in vivo measurements (Cope et al., 1991), so we were keen to develop a test to determine the extent of this problem. To detect spurious changes in cytochrome oxidase redox state induced by an incorrect algorithm first requires that we know the cytochrome oxidase redox state in vivo. We therefore fixed this state as fully reduced by injecting cyanide into an anesthetized neonatal pig. This binds to heme a3 at the oxygen reduction site of cytochrome oxidase and prevents oxygen binding. Therefore, electrons cannot leave the enzyme, and it is expected that the CuA center will become completely reduced for the same reason as if Fio2 is reduced to zero. This was confirmed in the blood-free animal, where the spectrum after cyanide addition was identical to that after anoxia (Fig. 2A)-the difference between the two spectra being merely noise (Fig. 2B).
Comparison of cyanide and anoxia on the in vivo cytochrome NIR spectrum.
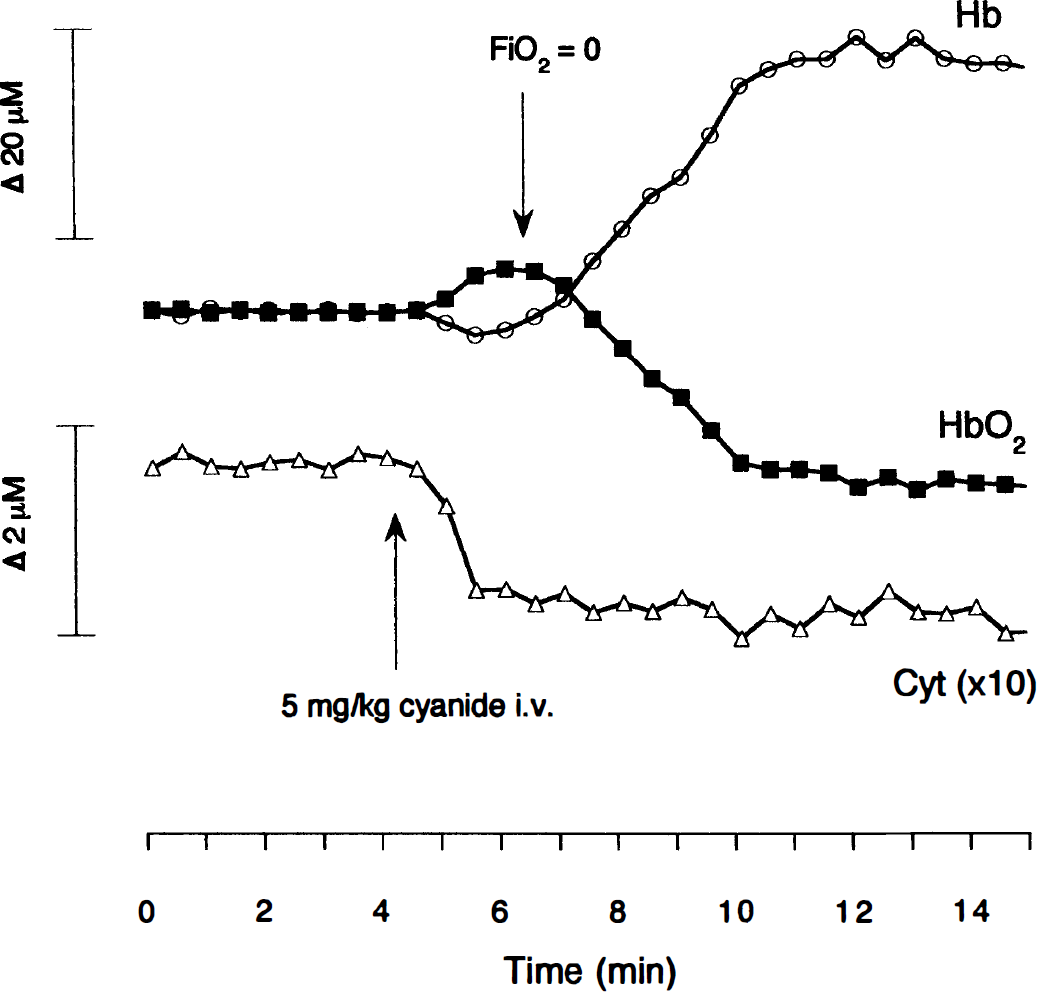
The use of cyanide in these studies is not intended to mimic a physiologic condition. Instead, it is intended to provide the maximum challenge to our cytochrome oxidase detection algorithm. One of the major challenges to any NIR algorithm is the problem of cross talk, that is, large changes in hemoglobin oxygenation or concentration appearing as spurious cytochrome oxidase concentration changes. This is possible because the cerebral cytochrome oxidase concentration is only about 5% of the hemo lobin concentration. The addition of cyanide provides this challenge because, at the correct dose, it results in the complete inhibition of electron flow through cytochrome oxidase at a site distal to the CuA center without compromising cerebral oxygenation. Thus, after cyanide addition, we see a reduction in the cytochrome oxidase CuA NIRS signal (Fig. 3). However, the heart and lungs still are circulating oxygenated blood, since there is no fall in the [HbO2]. Indeed, an increase is seen in [HbO2]. This is caused by a combination of increased vasodilation and a decrease in cerebral oxygen consumption. A small drop in [Hb] also is usually observed, presumably caused by the drop in the rate of oxygen extraction in the brain. This situation is stable as long as the heart is performing adequately. Although variable after the cyanide injection (sometimes increasing and sometimes decreasing), the mean arterial pressure never dropped low enough to compromise oxygen delivery. The stability of the heart relative to the brain in this model is as expected, given the larger amounts of cytochrome oxidase and the larger glycolytic capacity of the neonatal heart when compared with the brain. In any case, for this test, it is necessary to maintain the brain in the oxygenated state for only a few minutes. The Fio2 then is dropped to zero, causing the expected dramatic drop in [HbO2], rise in [Hb], and a further increase in the total hemoglobin concentration (the latter presumably as a by-product of a hypoxia-induced CBF increase). We now have our test of the cytochrome oxidase algorithm, since we have induced large changes in hemoglobin oxygenation and concentration under conditions where we do not expect to see a cytochrome oxidase redox state change (since full reduction has been induced by cyanide, anoxia cannot cause further reduction). Similar changes to those in Fig. 3 have been previously observed using reflectance spectroscopy to study changes in the visible absorption of hemoglobin and cytochrome oxidase in the adult rat brain (Piantadosi et al., 1983).
Comparison of cyanide and anoxia on the in vivo cytochrome redox state changes in the presence of hemoglobin. Near-infrared spectroscopy (NIRS) changes in oxyhemoglobin, deoxyhemoglobin, and cytochrome oxidase in the piglet brain. Cyanide addition and reduction of Fio2 from 0.99 to 0.0 were made at the indicated times. A drop in the cytochrome oxidase (Cyt) signal indicates reduction of the CuA center. Notice the 10× expanded scale for this signal.
The results from five animals undergoing this test are illustrated in Table 1. The most important finding is that cyanide induces a significant reduction of cytochrome oxidase. Anoxia, despite causing hemoglobin concentration changes over 40 times that of the cytochrome oxidase redox state, does not significantly further alter this signal. Therefore, we are confident that under these circumstances we have a robust algorithm for detecting changes in the cytochrome oxidase redox state.
Effect of cyanide and anoxia on NIRS parameters in the neonatal pig
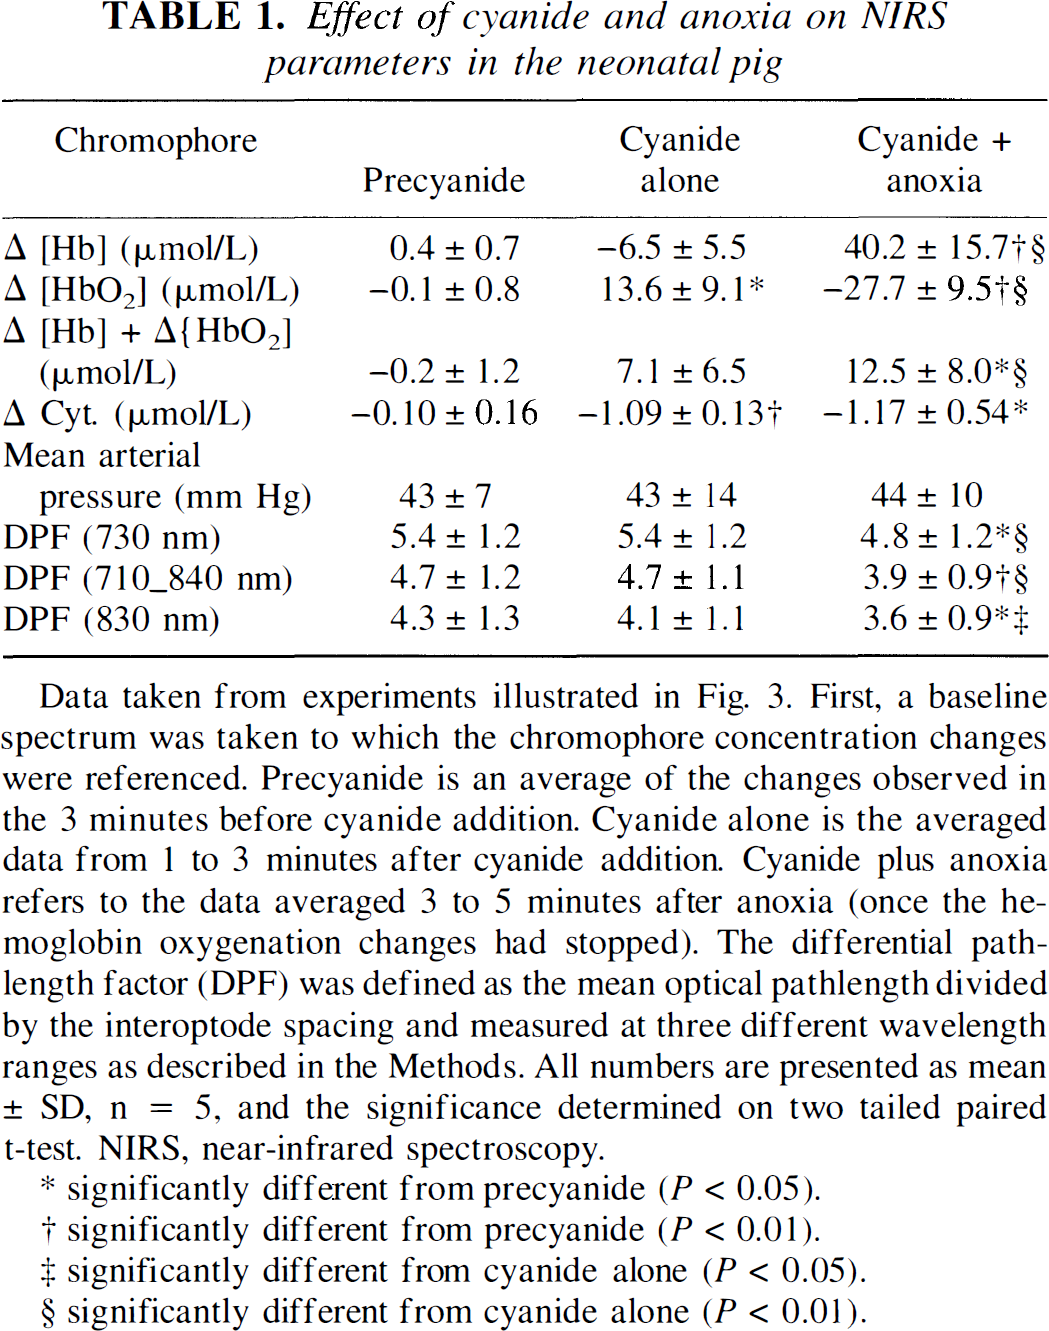
Data taken from experiments illustrated in Fig. 3. First, a baseline spectrum was taken to which the chromophore concentration changes were referenced. Precyanide is an average of the changes observed in the 3 minutes before cyanide addition. Cyanide alone is the averaged data from 1 to 3 minutes after cyanide addition. Cyanide plus anoxia refers to the data averaged 3 to 5 minutes after anoxia (once the hemoglobin oxygenation changes had stopped). The differential pathlength factor (DPF) was defined as the mean optical pathlength divided by the interoptode spacing and measured at three different wavelength ranges as described in the Methods. All numbers are presented as mean ± SD, n = 5, and the significance determined on two tailed paired t-test. NIRS, near-infrared spectroscopy.
significantly different from precyanide (P < 0.05).
significantly different from precyanide (P < 0.01).
significantly different from cyanide alone (P < 0.05).
significantly different from cyanide alone (P < 0.01).
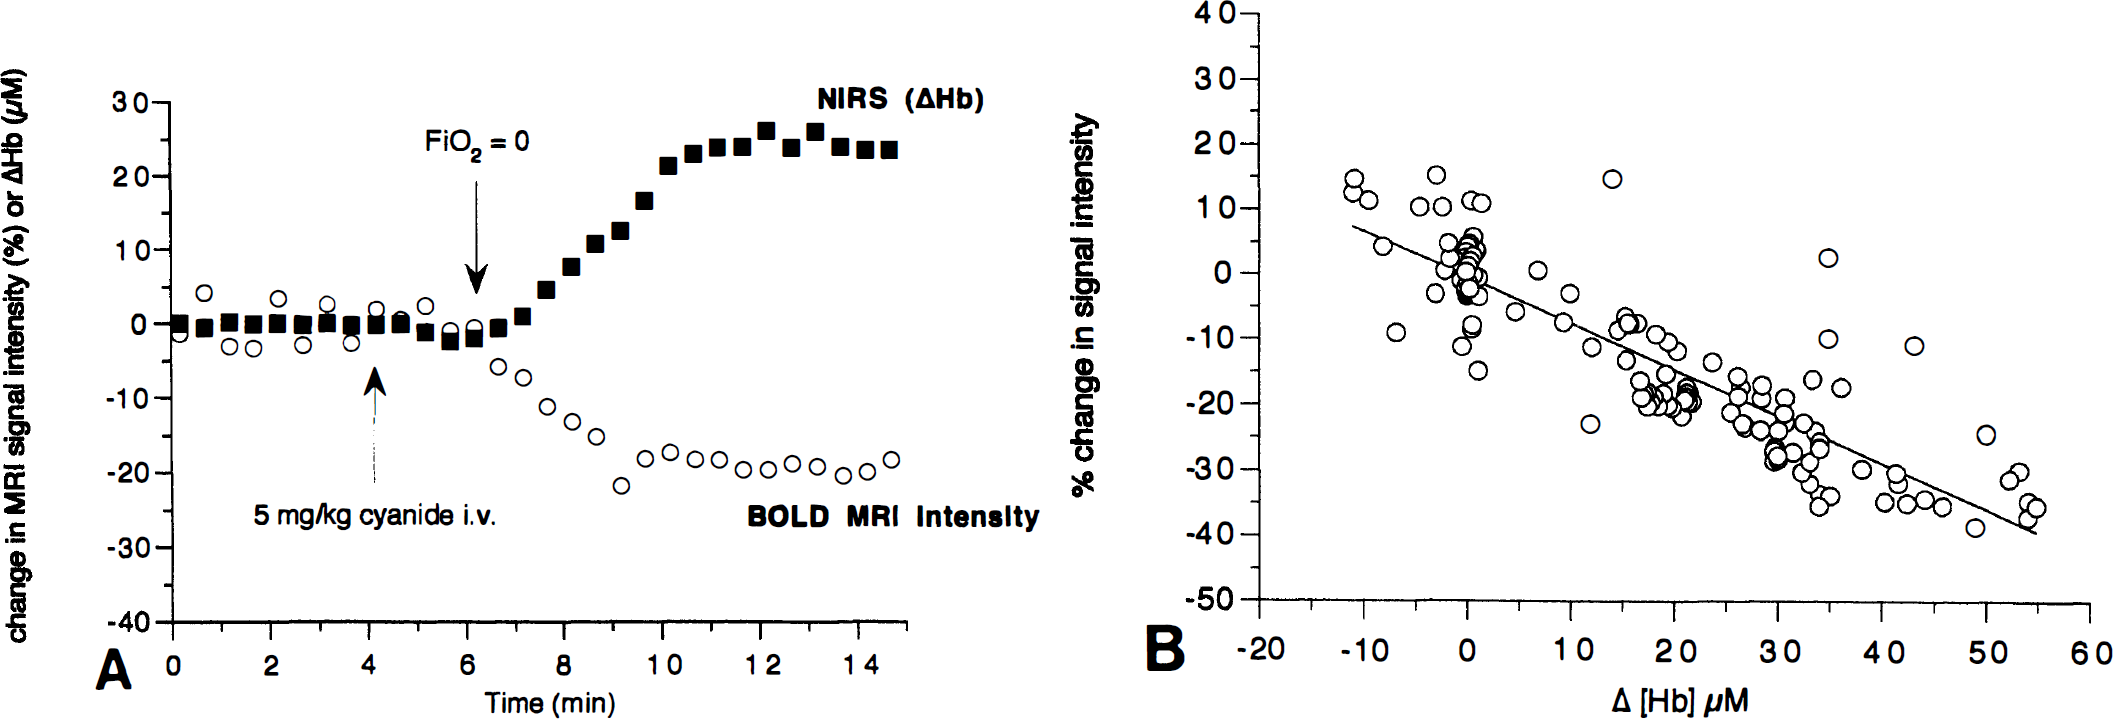
Near-infrared spectroscopy measures global changes in the brain. We confirmed that the procedure outlined earlier was indeed a global insult by performing simultaneous MR imaging measurements of the T2* relaxation rate, as used in blood oxygenation level-dependent (BOLD) MR imaging contrast techniques. Fig. 4A shows that as the Hb concentration rises, there is a simultaneous fall in the BOLD MR imaging signal intensity (averaged over the whole image). By plotting changes in the MR image intensity versus changes in [Hb] as measured by NIRS, we show a strong correlation between the global T2*-weighted (BOLD) signal and the NIRS-measured Hb concentration (Fig. 4B). This raises the possibility, as we have previously suggested (Punwani et al., 1997), that NIRS may be able to calibrate the BOLD MR image intensity changes into regional Hb concentration changes.
We were able to use BOLD MR imaging to determine if the insult was global or regional. Fig. 5 shows that the after cyanide addition, there is little contrast observed (consistent with the small effects on [Hb] observed by NIRS). However, after anoxia, there is a significant darkening throughout the image, which is consistent with the large global rise in [Hb] detected by NIRS.
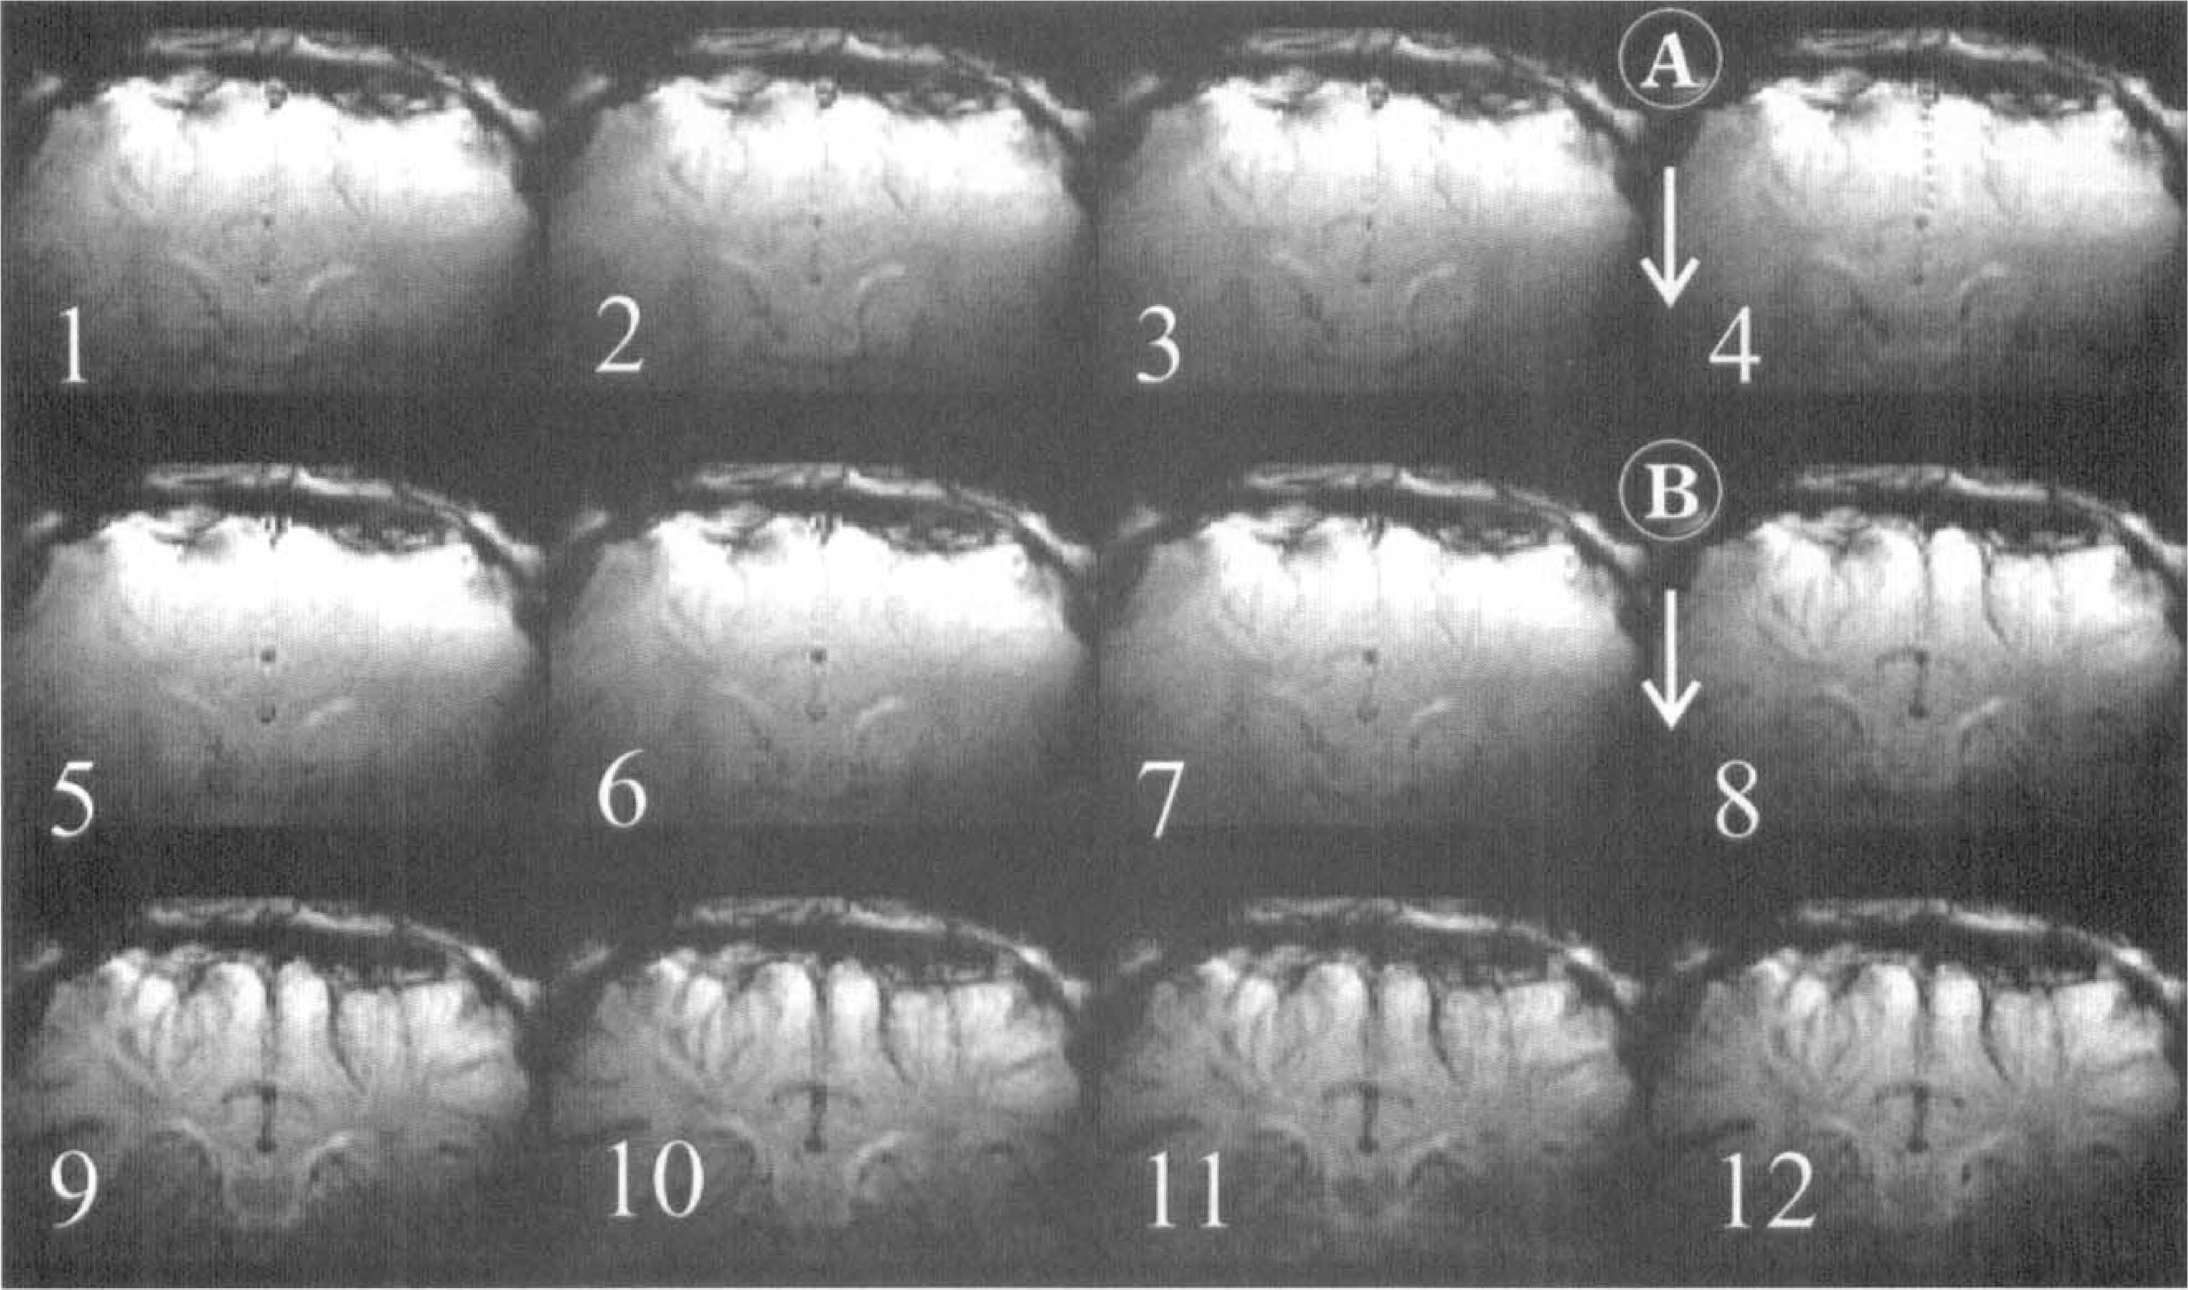
The BOLD MR imaging measurements of cerebral oxygenation after cyanide addition and anoxia in the neonatal pig brain. Magnetic resonance T2*-weighted (25-millisecond echo time) images from the neonatal pig brain. Images were acquired every minute and are numbered sequentially in the figure. At point A, between images 3 and 4, a 5-mg/kg NaCN bolus was administered to the animal intravenously. At point B, between images 7 and 8, the Fio2 was reduced from 0.99 to 0.0. The darker images that follow indicate an increased level of deoxyhemoglobin in the brain.
Are light scattering changes a problem for in vivo cytochrome oxidase redox state measurements?
The algorithms we use assume that optical density changes are associated only with chromophore concentration changes, not changes in light scattering. Clearly, large changes in scattering will therefore be interpreted as spurious changes in the chromophore concentration and, since cytochrome oxidase is present at the lowest concentration, this is likely to be most sensitive to this type of artifact. Fortunately, using multiwavelength detection gives us a handle on this, since an increase in light scattering yields an increase in the optical pathlength; the latter can be measured by analyzing the second differential of the water peaks, centered at 730 and 830 nm (Cooper et al., 1996; Matcher and Cooper, 1994). Table 1 shows that there is no significant change in the mean optical pathlength after cyanide addition. There are small, but significant, drops in the 730- and 830-nm pathlengths after anoxia. This change in pathlength does not necessarily imply a light scattering change, since a shorter pathlength at 730 nm is expected given the rise in cerebral [Hb], and a smaller drop at 830 nm given the rise in total cerebral hemoglobin (Cope et al., 1991).
We obtained further evidence for the lack of a large scattering change by injecting higher doses of cyanide to the anesthetized piglet (Fig. 6). In this case, consistent with the findings of Tamura (1992), after the initial rise in [HbO2] and fall in [Hb], there is a decrease in cerebral oxygenation associated with a large consistent fall in blood pressure. As expected throughout this procedure, the cytochrome oxidase signal remains at the same reduced level induced by the cyanide addition. As the HbO2 falls and the Hb rises, they reach a crossover point where there is no change in their values when compared with the precyanide injection. Therefore, if at this point the data are fitted to only the two hemoglobin chromophores, the remaining optical density changes should result from a combination of the cytochrome oxidase redox state change and any scattering changes. Fig. 7 shows that this spectrum is almost identical to that of the purified mitochondrial cytochromes alone, demonstrating that large changes in the cerebral energy state do not cause large changes in light scattering.
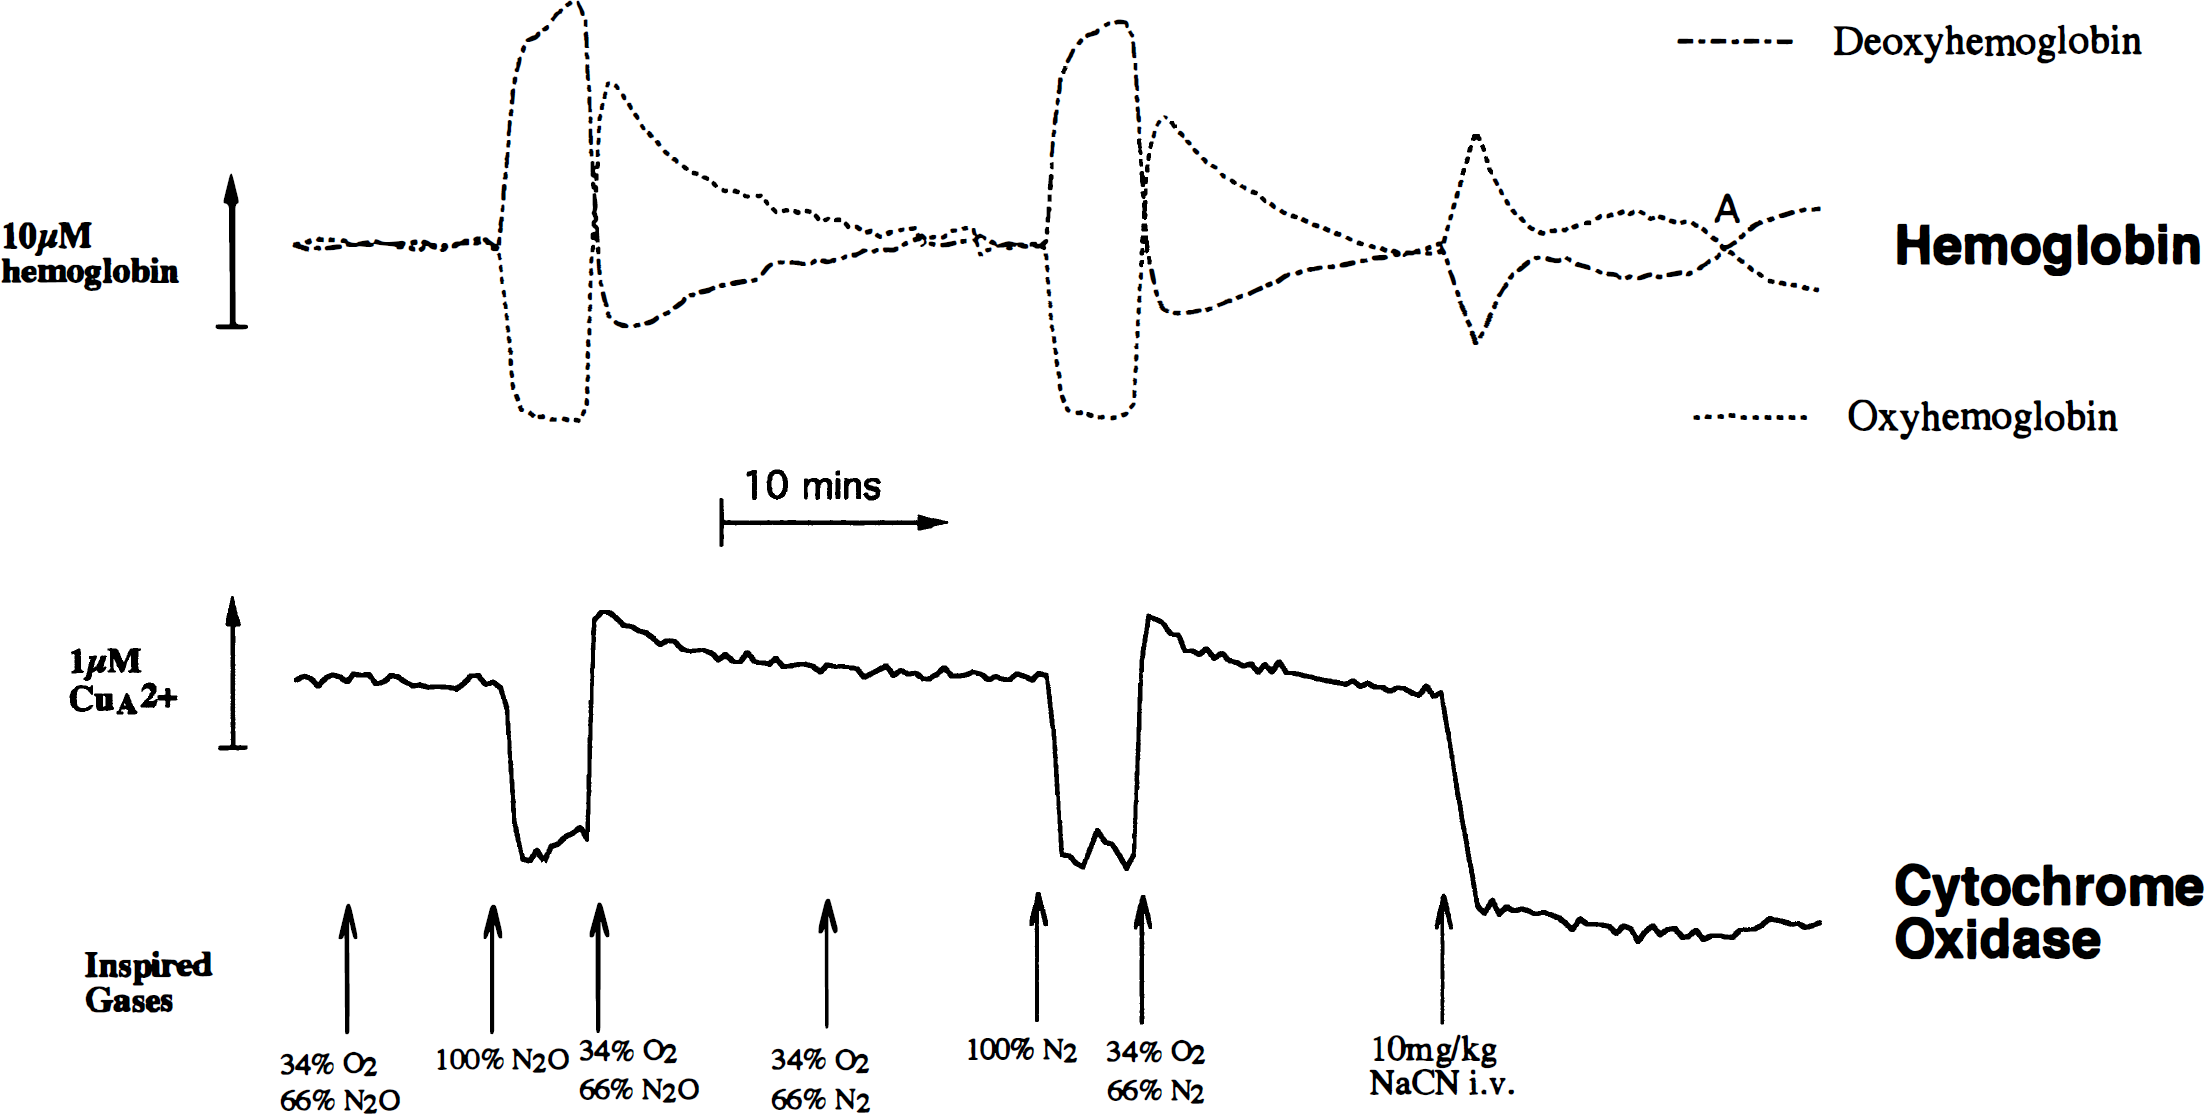
Comparison of anoxia followed by cyanide treatment on the in vivo cytochrome redox state changes in the presence of hemoglobin. Conditions are the same as in Fig. 3, except that in this case, anoxia was before cyanide treatment. At the points indicated by arrows, the indicated changes were made to the inspired gas mixture. An upward deflection represents an increase in hemoglobin concentration or CuA oxidation. Point A indicates a time when hemoglobin changes are minimal after cyanide addition.
The data in Fig. 6 also demonstrate that cytochrome oxidase comes to the same redox state, whether cyanide is injected before (Fig. 3) or after anoxia (Fig. 6). We were concerned about using N2O in the studies of cerebral cytochrome oxidase, since at high concentrations it has been reported to be a weak inhibitor of the enzyme (Einarsdottir and Caughey, 1988). However, Fig. 6 shows that the response to anoxia and the recovery from anoxia are identical, whether oxygen is replaced by nitrogen or N2O.
Measurement of absolute hemoglobin oxygenation by near-infrared spectroscopy
Whereas the primary purpose of this study was to determine the reliability of NIRS measures of the cytochrome oxidase redox state, the data from Fig. 3 also allow us to make some statements about the absolute hemoglobin oxygenation state in the neonatal brain. This is because reducing the Fio2 to zero ultimately drops the cerebral [HbO2] to zero; this is clear because on death, either induced by pentobarbitone injection or continued ventilation with 95% N2O/5% isoflurane, there is no further drop in the cerebral [HbO2] from the stable value illustrated in Fig. 3. Furthermore, anoxia studies in the absence of cyanide (unpublished observations) showed no significant increase in the extent of the [HbO2] drop; that is, the active pumping of deoxygenated blood around the brain is sufficient to drop the cerebral [HbO2] to zero, even with the reduced rate of cerebral oxygen consumption in the presence of cyanide.
Normally, NIRS measures only changes in [HbO2] and [Hb]. However, knowing a single [HbO2]-in this case, the zero point-allows us to back-calculate the absolute value of [HbO2] for any point in the study. When combined with the use of second differential spectroscopy (which allows us to measure the absolute [Hb]), we therefore can easily calculate absolute hemoglobin concentrations and oxygenation throughout the study period.
Table 2 illustrates these values for the neonatal pig. The absolute Hb concentration under normoxic conditions is identical to that of the neonatal human calculated previously (Cooper et al., 1996) and is evidence that the piglet is a good hemodynamic model for the neonatal human. The total hemoglobin concentration is lower than observed in adult rats by a similar method (Matcher and Cooper, 1994), which is consistent with the lower CBF in the neonatal brain (Altman et al., 1993). Finally, the mean cerebral hemoglobin saturation is closer to the typical venous rather than the arterial saturation-good evidence that, as in the human neonate (Cooper et al., 1996), NIRS detects predominantly capillary/venous blood in the piglet brain.
Absolute hemoglobin concentrations in the neonatal brain
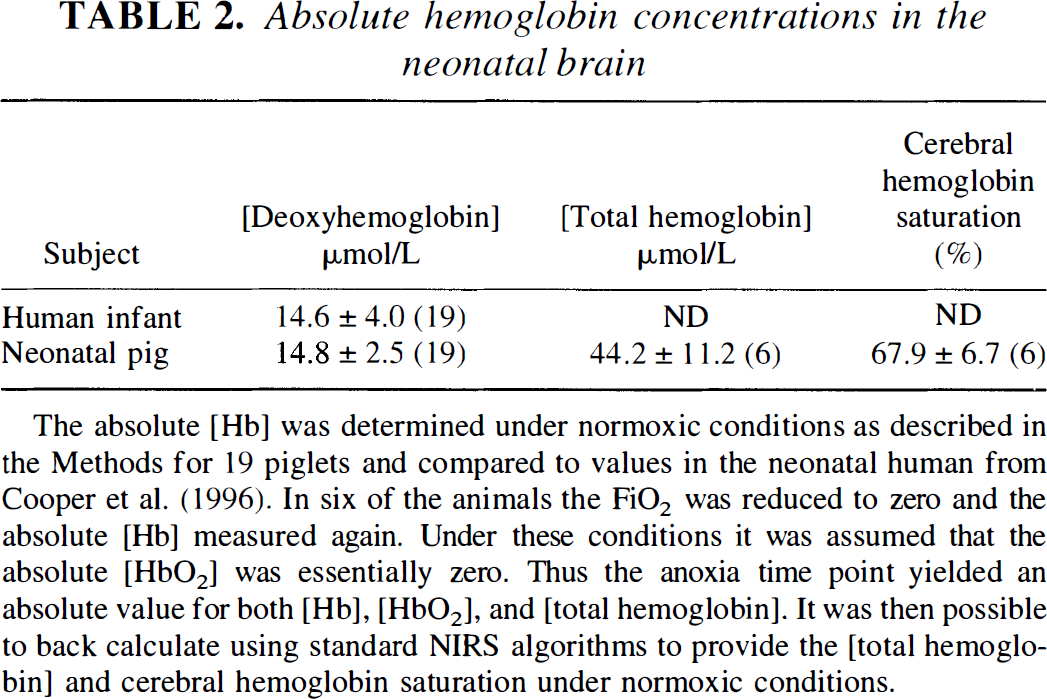
The absolute [Hb] was determined under normoxic conditions as described in the Methods for 19 piglets and compared to values in the neonatal human from Cooper et al. (1996). In six of the animals the FiO2 was reduced to zero and the absolute [Hb] measured again. Under these conditions it was assumed that the absolute [HbO2] was essentially zero. Thus the anoxia time point yielded an absolute value for both [Hb], [HbO2], and [total hemoglobin]. It was then possible to back calculate using standard NIRS algorithms to provide the [total hemoglobin] and cerebral hemoglobin saturation under normoxic conditions.
DISCUSSION
Comparison of in vitro and in vivo spectra of mitochondrial cytochrome oxidase
These studies on blooded and bloodless animals show no evidence for differences between the in vivo and in vitro spectrum of mitochondrial cytochrome oxidase in the NIR region, nor is there any evidence for differences between the neonatal and adult brain. The relative ease of detection of cytochrome oxidase in the neonatal pig brain also suggests that studies of this enzyme in the term human infant are not a priori unreasonable. We have no simple explanation for the different spectra reported in the literature. In the case of the adult cat brain, the authors admit the difficulty in removing all of the blood to generate a pure cytochrome oxidase spectrum (Ferrari et al., 1995; Miyake et al., 1991). With the adult rat brain, this is less of a problem. However, the optical setups and animal preparation have differed. Some authors (Hazeki and Tamura, 1988; Inagaki and Tamura, 1993) do not remove the temporal muscles (which are large in the rat and can lead to significant absorption by noncerebral chromophores, especially myoglobin). In cases where the temporal muscles have been removed, similar NIR spectra are obtained and these spectra are consistent with the known in vitro properties of the cytochromes (Miyake et al., 1991; Wray et al., 1988). A similar good agreement between in vitro and in vivo spectra is seen in the visible region (LaManna et al., 1987) where spectral distortions resulting from, for example, light scattering changes, might be expected to be larger. We conclude that the cytochrome oxidase spectrum itself is no limitation to the transferability of the NIR algorithms from the animal models in which they have been developed to other animal or human studies.
Testing algorithms for measuring redox state changes in cytochrome oxidase in vivo
We have developed a test for measuring the efficacy of NIR algorithms in vivo in the blood-perfused brain. This demonstrated that under the conditions of this study, changes in the cerebral cytochrome oxidase redox state induced by mitochondrial inhibitors could be monitored in the presence of a >10-fold hemoglobin excess. More importantly, these changes were not sensitive to large hemoglobin oxygenation and concentration changes.
We chose to use the mitochondrial inhibitor cyanide because this has been extensively used in animal models and previous studies have shown that at the doses used here, it causes complete reduction of cerebral cytochrome oxidase (Piantadosi and Sylvia, 1984; Piantadosi et al., 1983; Tamura, 1992). We confirmed this by studies in the blood-free brain. For the test described, the dose injected is critical, however, and had to be chosen carefully to induce full cytochrome oxidase reduction and yet allow the animal to maintain adequate cerebral perfusion for the necessary 2 to 3 minutes.
Are light scattering changes a problem for in vivo cytochrome oxidase redox state measurements?
We have therefore demonstrated that our algorithm is insensitive to hemoglobin concentration and oxygenation changes. However, by definition, it will be sensitive to light scattering changes, since one of the assumptions made is that all observed optical density changes are caused by changes in chromophore absorbance. Our approach to this problem has been to use second differential spectroscopy to measure the scattering changes through their effect on the optical pathlength. In the time course of the experiments, we found no significant optical pathlength changes attributable to large changes in light scattering. Thus, we are confident that our algorithms are functional under these conditions. Under conditions where there are significant light scattering changes, then, the algorithms need to be modified (Hoshi et al., 1997; Tamura, 1993).
Notice that although we find no evidence in these studies for optical pathlength changes large enough to interfere with our cytochrome oxidase measurements, this does not mean that some light scattering changes are not occurring. Our method is relatively insensitive to small changes in light scattering. More sensitive methods may be able to see such changes and, as has been suggested, accurate measurements of light scattering changes may be a useful, new tool in the NIRS armory, reporting on membrane depolarization and accompanying cell swelling (Chance et al., 1996; Gratton et al., 1995).
We believe that to be confident of NIRS measures of cytochrome oxidase, the following criteria must be met (Cooper and Springett, 1997): (1) the algorithm used for deconvolution should be consistent with the known optical properties of the biological tissue and chromophores measured; (2) there should be no large change in light scattering during the measurement, or if there is the algorithm should account for this; (3) the fitting technique should contain significantly more wavelengths than chromophores, and the residuals of the fit should be random; (4) the optical density change observed should be reasonable for the amount of cytochrome oxidase in the tissue; and (5) cytochrome oxidase variations observed should not, in general, be a simple function of hemoglobin oxygenation or concentration changes.
Of these five criteria, points 2 and 3 require the multiwavelength approach used here. Other advantages accrue from the use of multiple wavelengths. For example, we have shown that multiwavelength spectroscopy is significantly more robust than otherwise equivalent four-wavelength algorithms to spurious changes in cytochrome oxidase signals induced by the effect of large hemoglobin concentration changes on the optical properties of the brain (Matcher et al., 1995). Such deficiencies in four-wavelength algorithms may account for some of the anomalous oxidations observed in cytochrome oxidase redox state when Fio2 is lowered in other studies of the newborn pig (Tsuji et al., 1996). The wavelength range used also is crucial to the success of the algorithm. Below 780 nm, there is a large absorbance by Hb, and the absorption-induced pathlength changes are therefore much higher on deoxygenation. Fitting the data between 740 and 900 nm (rather than the more restricted 780 to 900 nm) resulted in spurious oxidations of cytochrome oxidase after anoxia in the presence of cyanide, and we advise against the use of these shorter wavelengths if possible.
Measurement of absolute hemoglobin oxygenation by near-infrared spectroscopy and magnetic resonance imaging
One final advantage of the multiwavelength approach adopted here is that it allows absolute measurements of cerebral Hb concentration. In animal studies, it is also possible to measure absolute cerebral oxyhemoglobin concentrations, provided that it is possible to reduce the Fio2 to zero at the end of the study. Thus, as well as improving the accuracy of cytochrome oxidase measurements, the multiwavelength approach provides a simple noninvasive measure of cerebral hemoglobin saturation and cerebral hemoglobin concentration. The latter is directly related to cerebral blood volume, a parameter not easy to measure by other methods. As we have shown, it is also, in principal, possible to calibrate BOLD MR imaging measurements using NIRS, potentially linking the advantages of the quantitation of NIRS to the regional measurements of MR imaging.
Relevance of cytochrome oxidase near-infrared spectroscopy measurements to the mechanism of hypoxic-ischemic brain damage
The use of inhibitors of cytochrome oxidase in this study can yield important information about the mechanism of hypoxic-ischemic brain damage. For example, neonatal hypoxia-ischemia leads to mitochondrial dysfunction and an increase in apoptotic cell death (Mehmet et al., 1994). However, NIRS of cerebral hemoglobin changes suggest that, if anything, oxygen delivery to mitochondria increases during this process (Cooper and Springett, 1997; Wyatt, 1993). We therefore believe that neonatal neuronal cell death is induced by a defect in mitochondrial oxygen use, not mitochondrial oxygen delivery. In an in vivo model of neonatal hypoxic-ischemic brain damage (Lorek et al., 1994), the cytochrome oxidase and hemoglobin NIRS signals behave similarly to the effect of cyanide reported in this paper; that is, there is an increase in blood volume and oxygenation and a reduction in cytochrome oxidase CuA (Cooper and Springett, 1997; Springett et al., 1997). This suggests that, after neonatal hypoxia-ischemia, there is an inhibitor of mitochondrial oxygen consumption present that, like cyanide, acts distal to CuA in the mitochondrial respiratory chain. Nitric oxide levels have been shown to rise after neonatal cerebral hypoxia-ischemia (Tan et al., 1996); we have previously shown, using rat brain nerve terminals, that even nanomolar concentrations of nitric oxide can completely inhibit cytochrome oxidase oxygen consumption at tissue oxygen tensions (Brown and Cooper, 1994). As is the case with cyanide, nitric oxide blocks the flow of electrons in cytochrome oxidase at a site subsequent to the CuA center and would be expected to cause a similar reduction in this center. Therefore, the pattern of NIRS chromophore concentration changes induced by a mitochondrial inhibitor in this study, coupled with our previous NIRS studies on the neonatal brain, is consistent with the hypothesis that nitric oxide may be acting to inhibit cytochrome oxidase in vivo.
CONCLUSION
We conclude that it is possible to measure cytochrome oxidase redox state changes in the brain noninvasively, even in the presence of much higher concentrations of hemoglobin. Deconvolution algorithms developed for the adult rat brain can be used effectively in the neonatal pig brain, demonstrating the feasibility of extending such studies to the human brain.