
Abstract
Slices from control C57, mdx, and mdx3cv mice were made hypoxic until both field excitatory postsynaptic potential (fEPSP) and presynaptic afferent volley (AV) disappeared (H1). After reoxygenation and recovery of fEPSP, a second and longer hypoxic test (H2) lasted 3 minutes beyond the time required to block AV. When slices were kept in 10 mmol/L glucose, H1 abolished AV 37 and 19% earlier in slices from mdx and mdx3cv mutants than in control slices (where H1 = 12 ± 4.6 minutes, mean ± SD). During H2 or when slices were kept in 4 mmol/L glucose, AV vanished even more quickly, but the times to block did not differ significantly between slices from controls and mutants. After reoxygenation, AV fully recovered in most slices. Rates of blockade of fEPSPs were comparable in all slices, and most fEPSPs recovered fully after H1. But even in the presence of 10 mmol/L glucose, the second hypoxia suppressed fEPSPs irreversibly in some slices: 2 of 10 from control, 3 of 7 from mdx, and 1 of 6 from mdx3cv mice. Most slices in 4 mmol/L glucose showed no recovery at all: six of seven from control, three of five from mdx, and four of five from mdx3cv mice. Thus, slices from mdx mice were more susceptible than other slices to irreversible hypoxic failure when slices were kept in 10 mmol/L glucose, but they were less susceptible than other slices when kept in 4 mmol/L glucose. In conclusion, the lack of full-length dystrophin (427 kDa) predisposes to quicker loss of nerve conduction in slices from mdx and mdx3cv mutants and improved posthypoxic recovery of fEPSPs in 4 mmol/L glucose in slices from mdx but not mdx3cv mutants, perhaps because the 70-kDa and other C-terminal isoforms are still present in mdx mice.
Mutant mdx mice, which lack the dystrophin (427-kDa) protein in muscle and brain, provide a model of Duchenne muscular dystrophy (Bulfield et al., 1984; Yoshioka et al., 1992; Karpati et al., 1997). Dystrophin is normally present in the brain (Hoffman et al., 1988; Uchino et al., 1996), in many cerebellar and cortical neurons (Lidov et al., 1990, 1993), including hippocampal ones (Jung et al., 1991). It appears to be concentrated at postsynaptic membranes (Lidov et al., 1990; Jung et al., 1991; Kamakura et al., 1994; though cf. Huard and Tremblay, 1992). Perhaps for that reason, synaptic transmission may be more fragile in mdx mice, as suggested by the report that in hippocampal slices, synaptic responses are more susceptible to irreversible hypoxic block (Mehler et al., 1992). In Duchenne muscular dystrophy patients, the lack of brain dystrophin has been linked to intellectual disturbance (Lenk et al., 1993; Uchino et al., 1996; Vaillend et al., 1995; though cf. Bushby et al., 1995); but neither spatial learning nor long-term potentiation is impaired in mdx mice (Sesay et al., 1996; Godfraind et al., 1997; Vaillend et al., 1998).
The absence of brain dystrophin is also associated with a reduction in pyramidal cell number and size as well as loss of their typical (triangular) shape (Sbriccoli et al., 1995). As a link between the cytoskeleton and the extracellular matrix (Fabbrizio et al., 1995; Ohlendieck, 1996; Matsumura et al., 1997), dystrophin may help to maintain the resistance of the cell membrane to mechanical stress (Menke and Jockusch, 1991). Ionic homeostasis in mdx mice is relatively labile (Dunn et al., 1995); thus, in cerebellar granules, calcium channel activity and free intracellular calcium are both abnormally high, indicating poor regulation of cellular calcium (Haws and Lansman, 1991; Hopf and Steinhardt, 1992).
We have reexamined and compared the sensitivity of CA1 synaptic transmission in response to hypoxia in slices from C57BL/10 control mice and from mdx and mdx3cv mutants (Cox et al., 1993). The brain of the latter lacks both the full-length dystrophin (427 kDa) and the 70-kDa isoform, a protein that is expressed in the brain and some other tissues (Danko et al., 1992; Cox et al., 1993). To obtain a more comprehensive view of synaptic and neuronal function, we recorded the effects of hypoxia on the presynaptic compound action potential (“afferent volley” or AV) as well as the synaptic responses (field excitatory postsynaptic potential or fEPSP). Hippocampal slices were taken at random from one of the three groups, wild-type C57 (control) mice, mdx mutants, or mdx3cv mutants (Table 1). Because dystrophy is associated with impaired brain metabolism (Tracey et al., 1996)-possibly including disturbed glycolysis (Vignos and Lefkowitz, 1959; Lilling and Beitner, 1991; Even et al., 1994; Mokhtarian and Even, 1996)-experiments were done on slices maintained in standard medium (containing 10 mmol/L glucose) and in medium containing only 4 mmol/L glucose, in which synaptic responses are more susceptible to irreversible effects of hypoxia (Schurr et al., 1987; Roberts and Sick, 1992; Zhu and Krnjević, 1998). A preliminary report of these results has appeared as an abstract (Godfraind et al., 1998).
Numbers of slices from mice of each type studied in ACSF containing 10 or 4 mmol/L glucose
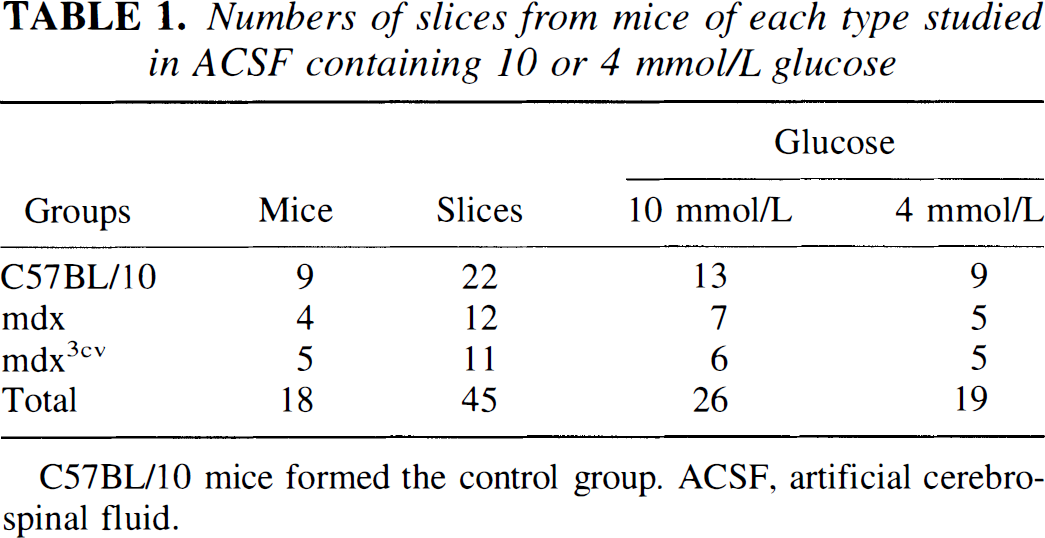
C57BL/10 mice formed the control group. ACSF, artificial cerebrospinal fluid.
METHODS
Adult mice were obtained from the following sources: wild-type (C57BL/10) and mdx strains mice locally from the UCL Muscle Physiology group; mdx3cv mutants from the Institut Gustave Roussy, Paris, France (courtesy of Dr. Thierry Ragot). Once a mouse was deeply anesthetized with ether, the brain was removed and placed in ice-cold saline. After dissecting out the hippocampus, 400- to 450-μm-thick slices were cut in a plane perpendicular to the long axis. They were stored for at least 60 minutes in a holding bath, at room temperature, in carbogenated (95% O2/5% CO2) artificial cerebrospinal fluid (ACSF) of the following composition (mmol/L): NaCl 124, KCl 3.0, CaCl2 2.0, MgCl2 2.0, NaH2PO4 1.2, NaHCO3 26, and
Stratum radiatum was stimulated by constant-current pulses via a bipolar tungsten electrode. The presynaptic AV and the fEPSP were recorded extracellularly with a glass pipette, the tip of which was broken back to 10 to 12 μm and filled with ACSF. Series of current pulses of different intensities (from a Neurolog module, Digitimer Ltd., Hertfordshire, U.K.) yielded data for AV versus stimulus intensity and EPSP versus AV (synaptic input-output) curves for control conditions and for recovery from hypoxia.
To induce hypoxia, the aerating mixture was replaced by 95% N2/5% CO2. The first hypoxic test (H1) lasted until the AV disappeared (after some 13 minutes; see Table 2). Typically, at least 20 minutes later, after recovery of both fEPSP and AV, a second more severe hypoxic test (H2) lasted until 3 minutes after the loss of the AV.
Time for disappearance of afferent volley during hypoxia
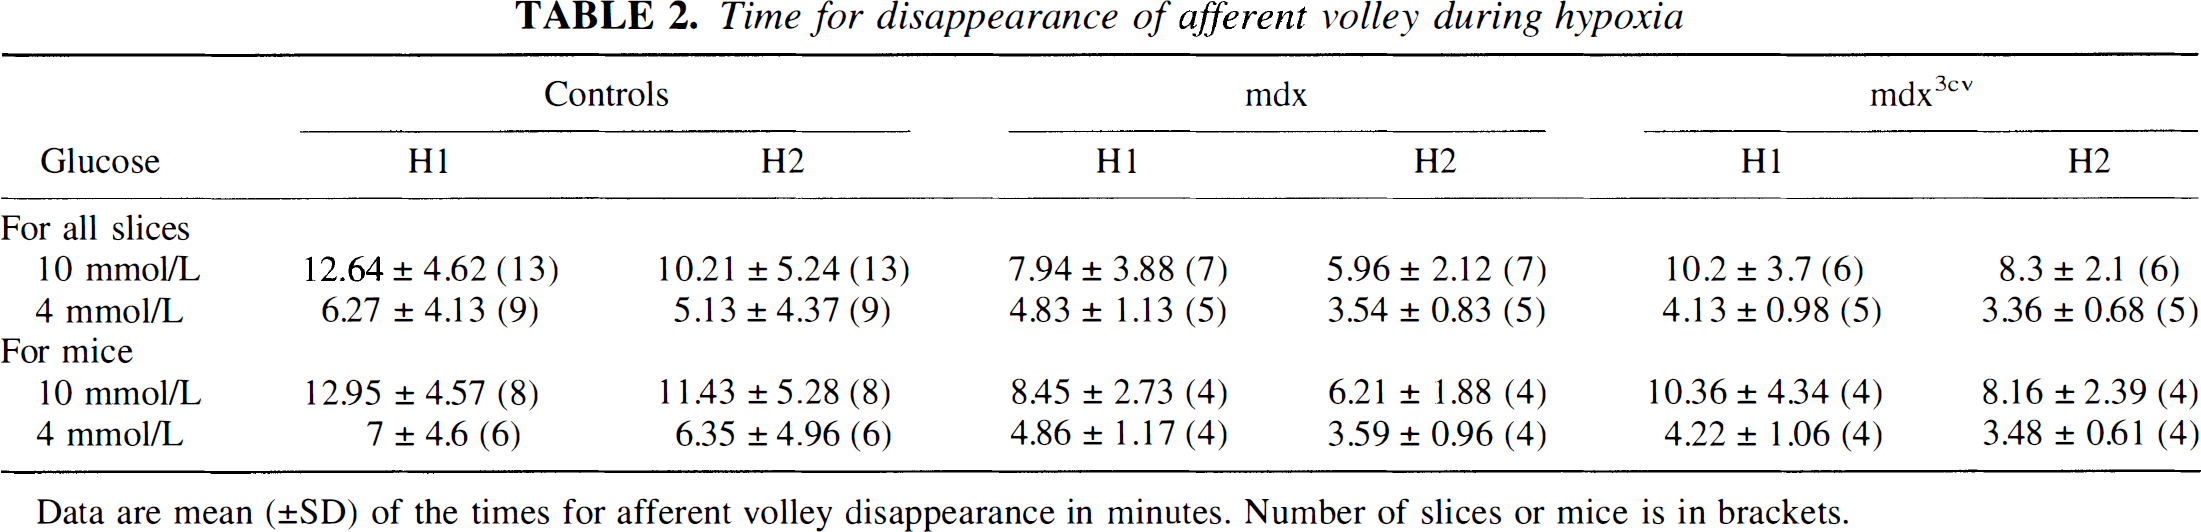
Data are mean (±SD) of the times for afferent volley disappearance in minutes. Number of slices or mice is in brackets.
Responses were digitized with a small computer interface CED1401 and analyzed with the SIGAVG program. The amplitudes of AVs and fEPSPs and the initial slope of the fEPSPs were measured with cursors.
Statistics
Times when AV disappeared during H1 and H2 were submitted to a two-way analysis of variance, followed by a Tukey or Student—Newman—Keuls posttest to locate significant differences between the groups. After correcting for small numbers according to a modified version of the Fisher test (Zar, 1984), we compared the proportions of fEPSPs recovering after H2 in different groups of slices (C57, mdx, and mdx3cv) kept in 10 or 4 mmol/L glucose-containing ACSF. If the χ2 test was positive, a Tukey-type posttest was run to locate the significant difference(s). A two-tailed Mann—Whitney test was used for inside-group comparisons.
RESULTS
Twenty-two slices were obtained from nine control (C57BL/10) mice, 12 were from four mdx mice, and 11 from five mdx3cv mutants. About half in each group was studied in 10 mmol/L glucose and half in 4 mmol/L glucose (see Table 1). In several experiments, more than one slice was studied from a given brain. The tables therefore present means calculated for all individual slices as well as means calculated for individual mice, taking only a single or mean value per mouse.
Slices in artificial cerebrospinal fluid containing 10 mmol/L glucose
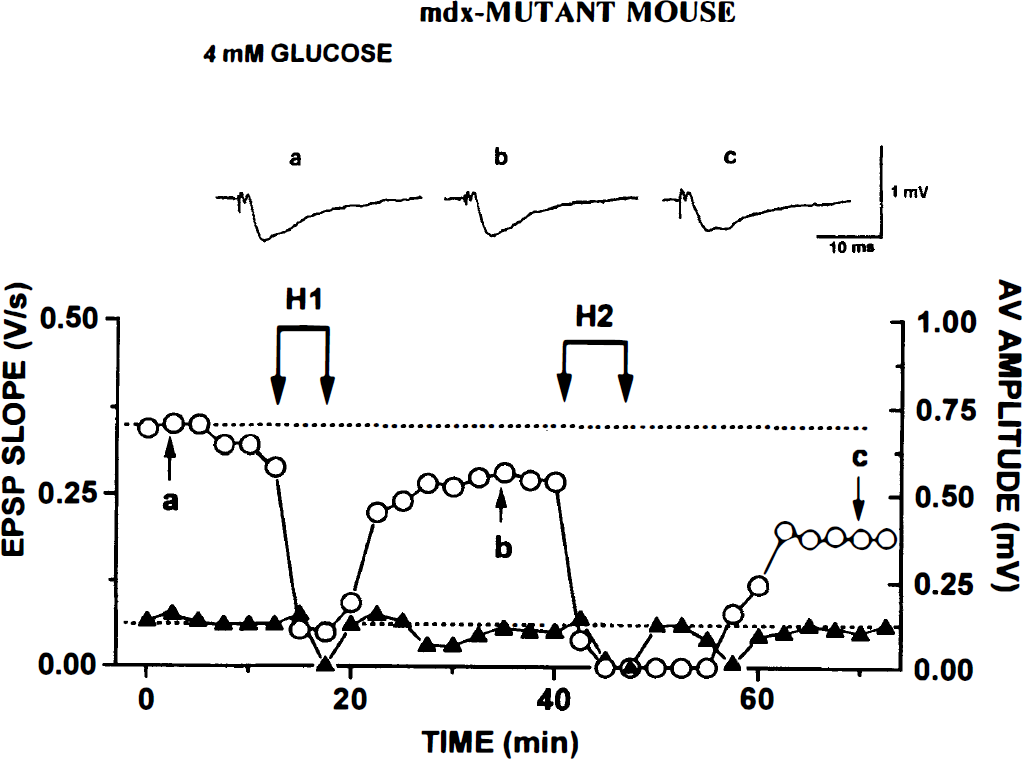
Control C57BL/10 mice. In Fig. 1 are data from a control slice. The three traces at the top show AVs and fEPSPs at points labeled in the graph: (a) during initial control run, (b) after recovery from H1, and (c) after recovery from H2. Each trace is the average of five consecutive responses evoked every 30 seconds. In the graph are plotted averaged values of AV amplitude (triangles, scale at right) and initial slopes of fEPSPs (circles, scale at left).
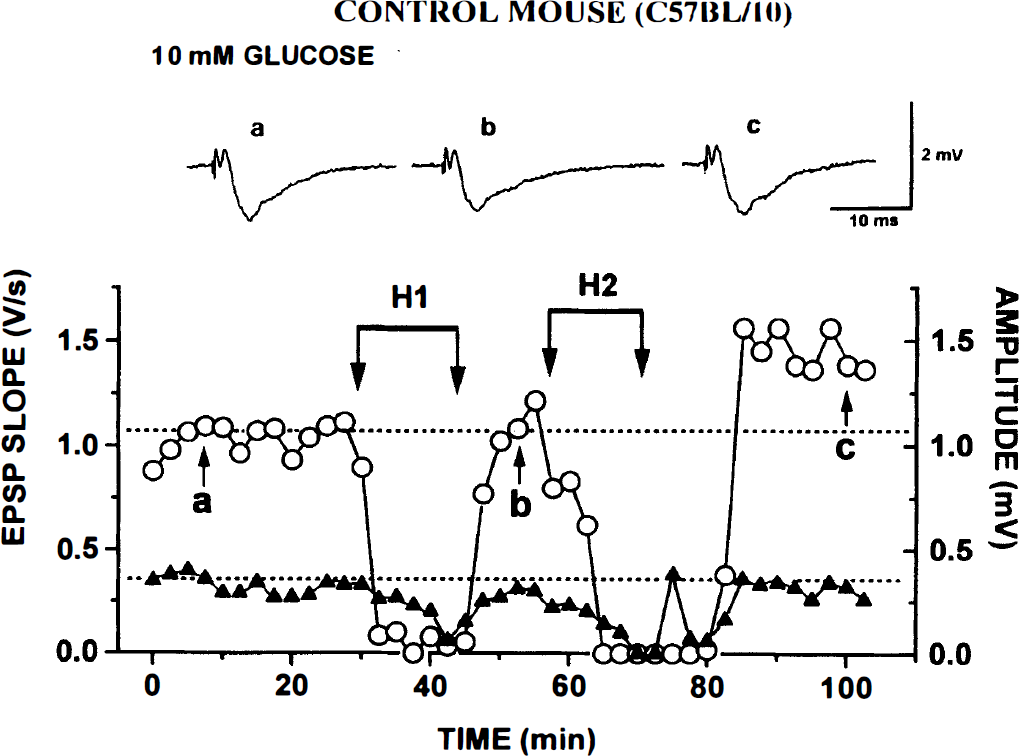
Repeated hypoxia (H1 and H2) causes reversible block of afferent volley (AV) and field excitatory postsynaptic potential (fEPSP) in control C57BL/10 hippocampal slice kept in 10 mmol/L glucose/artificial cerebrospinal fluid. Uppermost are three traces corresponding to points labeled in the graph below: during
Every slice was given two comparable hypoxic tests. Generally, fEPSPs started to diminish 60 to 90 seconds after switching to the N2/CO2 gas mixture and then disappeared. In the first series of experiments, in none of the hypoxic episodes was there a transient recovery of synaptic responses [“anoxic spike” (Schurr et al., 1986); “paradoxical recovery” (Sick et al., 1987); “hypoxic injury potential” (Fairchild et al., 1988)]. However, in the more recent experiments on slices from control mice, a “hypoxic injury potential” was evident in three of six slices in 10 mmol/L glucose and two of four in 4 mmol/L glucose.
In all control slices, fEPSPs recovered after H1; and even after H2, fEPSPs recovered in 8 of 10 slices (as in Fig. 1, where the fEPSP rebounded to a higher stable level). Mean H1 (the time when AV disappeared) was 12.6 ± 4.62 minutes (Table 2) for 13 control slices. After the return of O2, AV recovered within a few minutes. During H2, AV was usually lost somewhat earlier (at 10.2 ± 5.2 minutes) but fully recovered after reoxygenation (Fig. 1).
mdx mutants. Though fEPSPs started to diminish within 60 to 90 seconds of the onset of H1 and they vanished before AV, in all slices (seven of seven), there was virtually full recovery after the return of oxygen (Table 3). After H2, however, in three of seven slices, there was no recovery of fEPSPs (Fig. 2; see also Table 3). The AV disappeared earlier than in control slices, mean H1 being 37% shorter (see Table 2). After the return of O2, AV usually recovered fully within a few minutes. It vanished even faster during H2, but in most slices, it recovered within a few minutes of the end of H2.
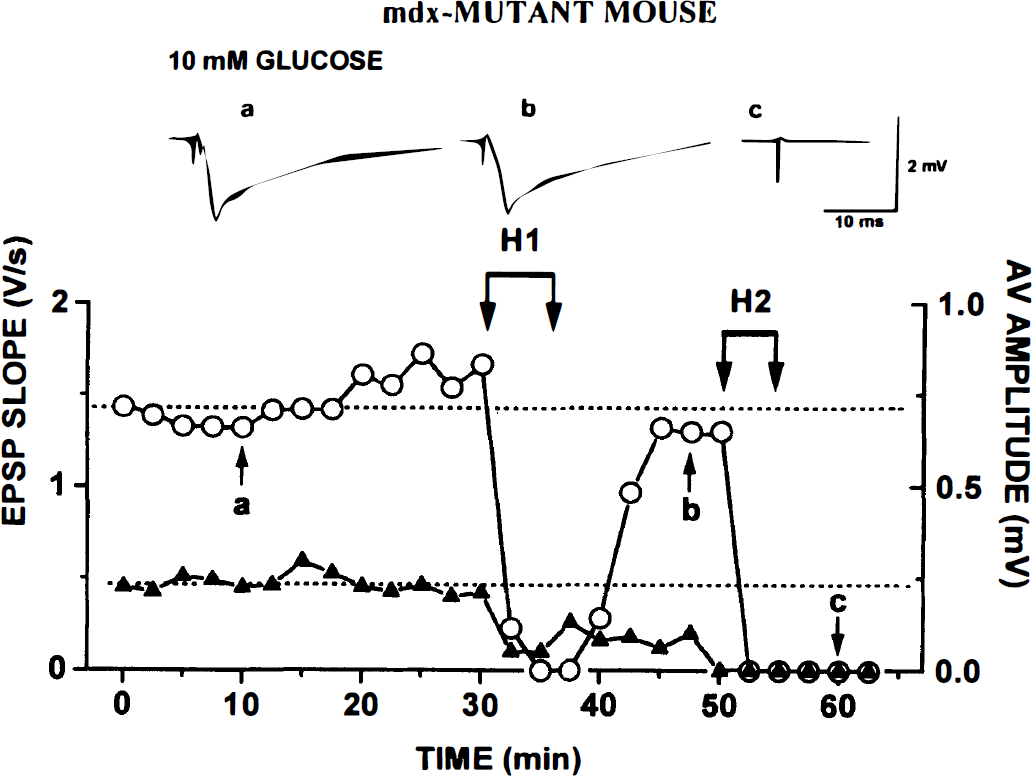
Repeated hypoxia (H1 and H2) leads to irreversible block of afferent volley (AV) and field excitatory postsynaptic potential (fEPSP) in slice from mdx mutant. Experimental protocol and labels are as described in legend to Fig. 1. Note only partial recovery of AV after H1 and failure to return after H2.
Recovery of synaptic transmission after hypoxia (%)
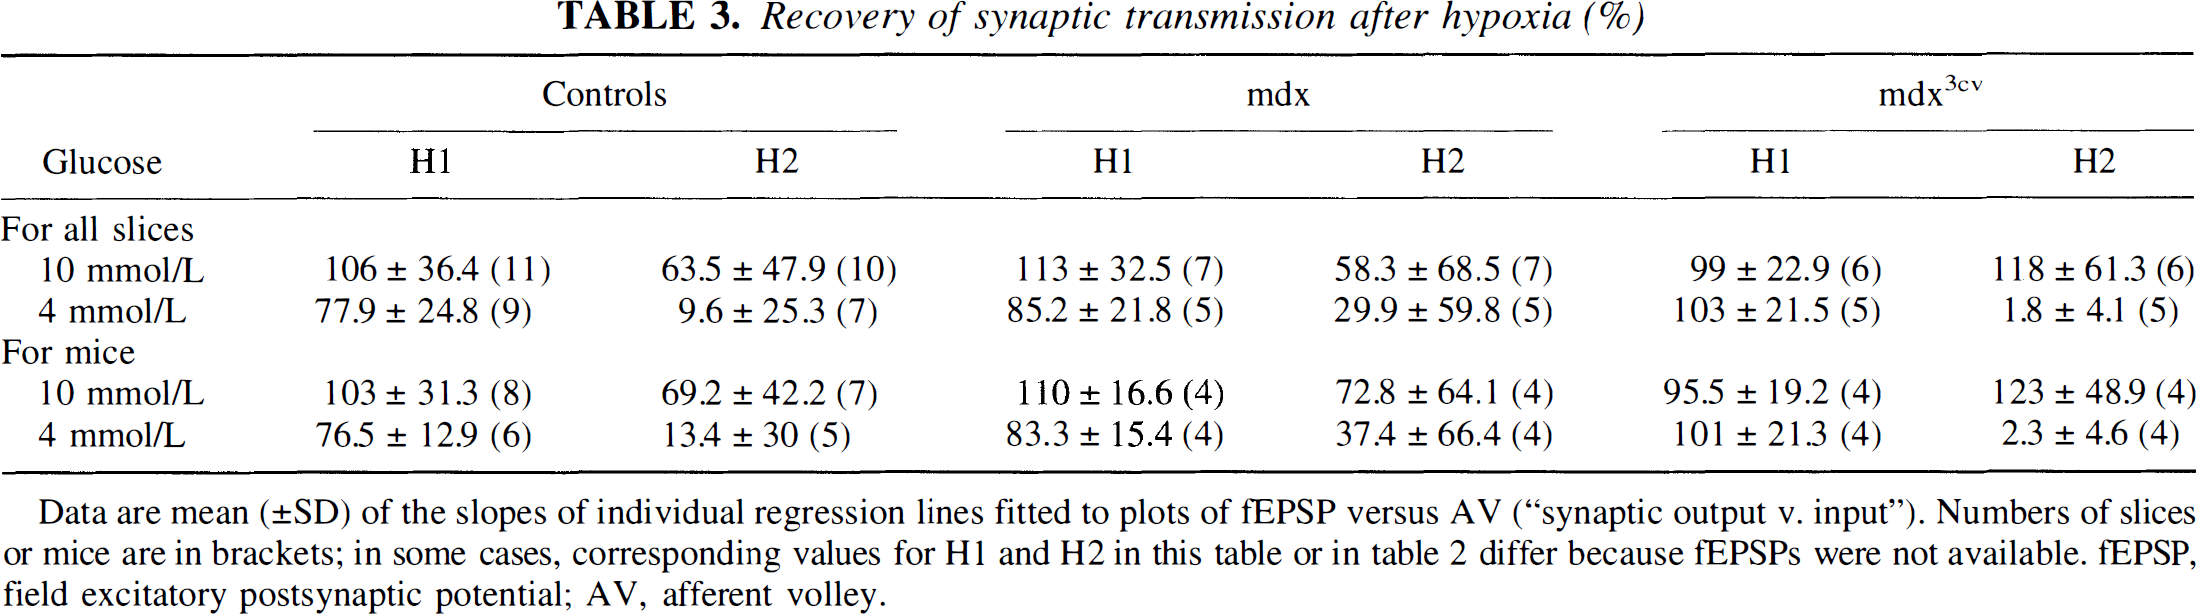
Data are mean (±SD) of the slopes of individual regression lines fitted to plots of fEPSP versus AV (“synaptic output v. input”). Numbers of slices or mice are in brackets; in some cases, corresponding values for H1 and H2 in this table or in Table 2 differ because fEPSPs were not available. fEPSP, field excitatory postsynaptic potential; AV, afferent volley.
mdx3cv mutants. Generally, the effects of hypoxia in these mutants were similar to those seen in control slices. The fEPSPs recovered in all six slices after H1 (Fig. 3) and in five of six after H2. Because AV disappeared early, H1 was 20% shorter than for control slices (Table 2), but AV recovered quickly after the return of O2. The loss of AV during H2 came somewhat earlier but again was largely reversible.
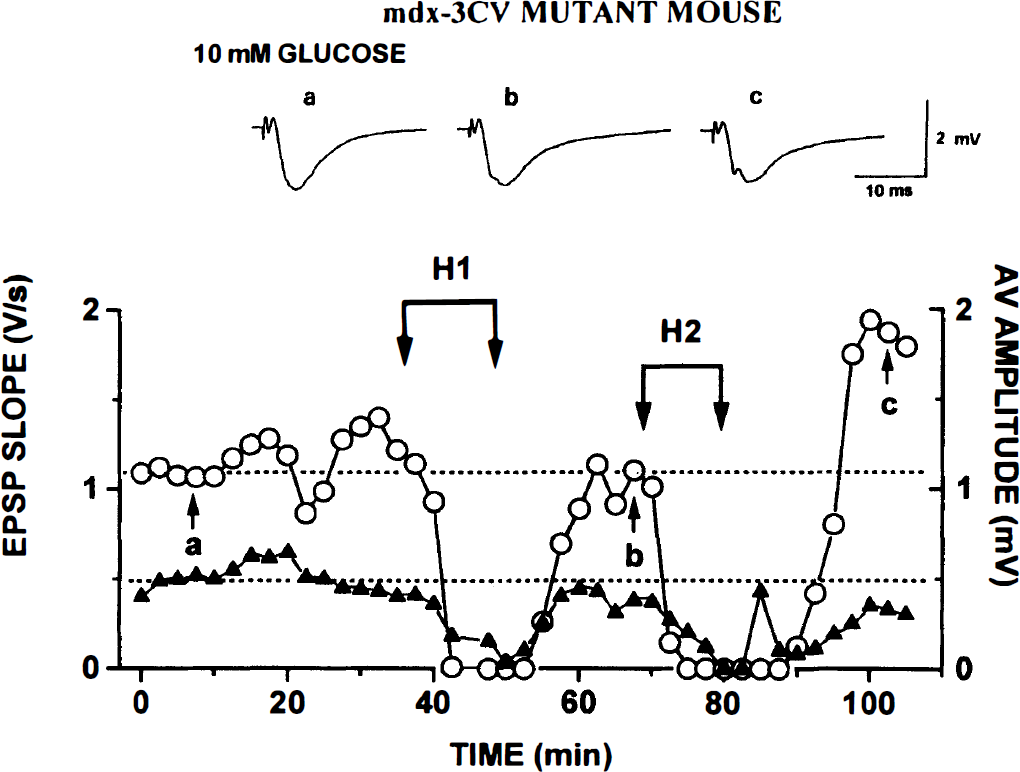
Repeated hypoxia (H1 and H2) causes reversible block of afferent volley (AV) and field excitatory postsynaptic potential (fEPSP) in slice from mdx3cv mutant. Experiment and labels are as described in legend to Fig. 1. As in the case of control slices (Fig. 1), both AV and fEPSP show substantial recovery or overshoot after H2.
Slices in artificial cerebrospinal fluid containing 4 mmol/L glucose
Control C57BL/10 mice. During the hypoxic tests, fEPSPs were blocked about as rapidly as in 10 mmol/L glucose ACSF. After H1, fEPSPs returned in all nine slices and recovery was almost complete (by ~80%; Table 3). After the second hypoxia (H2), however, nearly all fEPSPs failed to return (Fig. 4; Table 3). They recovered in only one of seven slices. In spite of the very early loss of AV, its recovery after H1 was rapid and complete (Fig. 4; Table 2). During H2, it vanished even sooner, and its recovery took >1 minute. The final amplitude sometimes showed a marked rebound (Fig. 4).
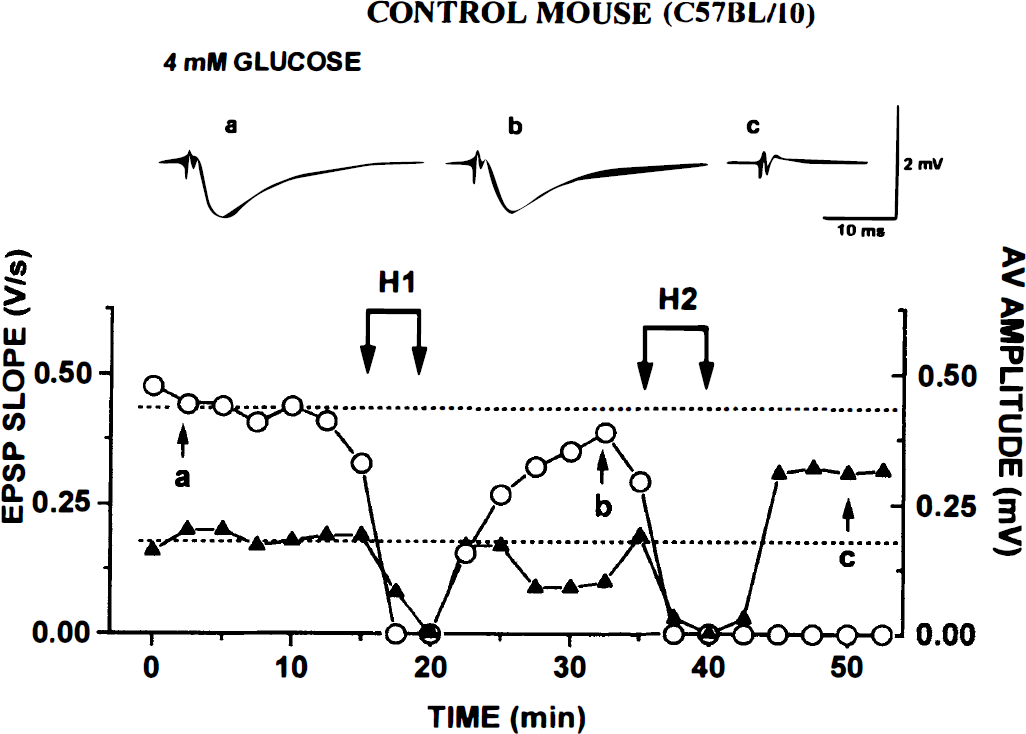
Repeated hypoxia (H1 and H2) causes irreversible block of field excitatory postsynaptic potential (fEPSP) but not afferent volley (AV) in control C57BL/10 slice kept in 4 mmol/L glucose. Otherwise, experimental protocol and labels are as described in legend to Fig. 1. Note fEPSP fails to recover after H2 in spite of recovery (and overshoot) of AV.
mdx mutants. The recovery of fEPSPs after H1 was virtually complete (Fig. 5; Table 3). More surprisingly, they recovered more often (in two of five slices) than in control slices (one of seven). The rapid loss of AV made H1 even shorter than for the controls (Table 2). After the end of H1 and H2, AV recovered both quickly and fully.
Repeated hypoxia (H1 and H2) does not cause irreversible block of field excitatory postsynaptic potential (fEPSP) in mdx slice kept in 4 mmol/L glucose. Otherwise, experimental protocol and labels are as described in legend to Fig. 1. Note substantial recovery of fEPSP after H2.
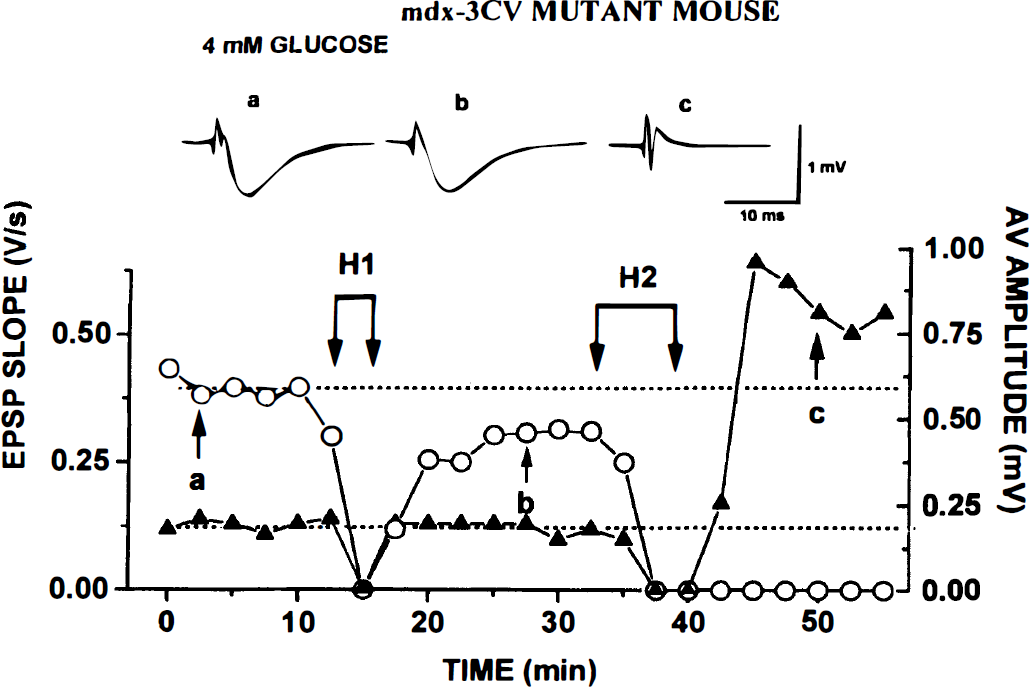
mdx3cv mutants. Again, these slices behaved very much like the controls. The fEPSPs vanished during H1 and then recovered in all five slices, and only one showed a partial return after H2 (Fig. 6; Table 3). During H1 and H2, AV disappeared early; it recovered within 1 to 2 minutes of the return of O2, sometimes showing a striking rebound in amplitude (Fig. 6).
Repeated hypoxia (H1 and H2) causes irreversible block of field excitatory postsynaptic potential (fEPSP) but not afferent volley (AV) in mdx3cv slice kept in 4 mmol/L glucose. Otherwise, experimental protocol and labels are as described in legend to Fig. 1. As in control slice in 4 mmol/L glucose (Fig. 4), fEPSP failed to recover after H2 in spite of recovery (and very large overshoot) of AV.
Overview of results and their statistical significance
Some trends were very consistent. Thus, for all types of slices or mice, the hypoxic block of AV (and, of course, EPSPs) occurred much earlier when the slices were kept in 4 mmol/L glucose. Of greater interest in the present context is the finding that hypoxic tests (both H1 and H2, in the presence of 10 or 4 mmol/L glucose) consistently blocked AV more rapidly in slices from mdx and mdx3cv mutants than in slices from control mice. Other features, such as the posthypoxic recovery of fEPSPs and differences between responses to H1 and H2, were more variable. To bring out significant differences, especially between slices from control mice and mutants, the data were submitted to a two-way analysis of variance.
Afferent volley blocking times in slices kept in 10 mmol/L glucose
As already stated, when compared with H1 for control slices (12.6 ± 4.6 minutes), H1 was shorter for slices from mutants: 8.0 ± 4.0 minutes (or 37% shorter) for mdx mice and 10.2 ± 3.7 minutes (or 19% shorter) for mdx3cv mice. During H2, AVs disappeared earlier than during H1 (Table 2).
According to the two-way analysis of variance (see Table 4), only one of the factors, the mouse type, is very significant (F =17.98, P =0.0076) for slices and significant (F =3.95, P =0.032) for mice. The factor hypoxia [which was significant in the first series of experiments (F = 9.47, P = 0.004)] is no longer significant (F =4.81, P =0.095), owing to more variable data from the additional C57 group. There is no significant interaction between factors (F =0.1, P =0.97). A Student—Newman—Keuls posttest failed to locate significant differences. If the C57, mdx, and mdx3cv groups are compared with a Mann-Whitney test, only H1 values for C57 and mdx slices may differ significantly (P =0.026 for all slices but 0.11 for mice).
Overview of two-way analysis of variance
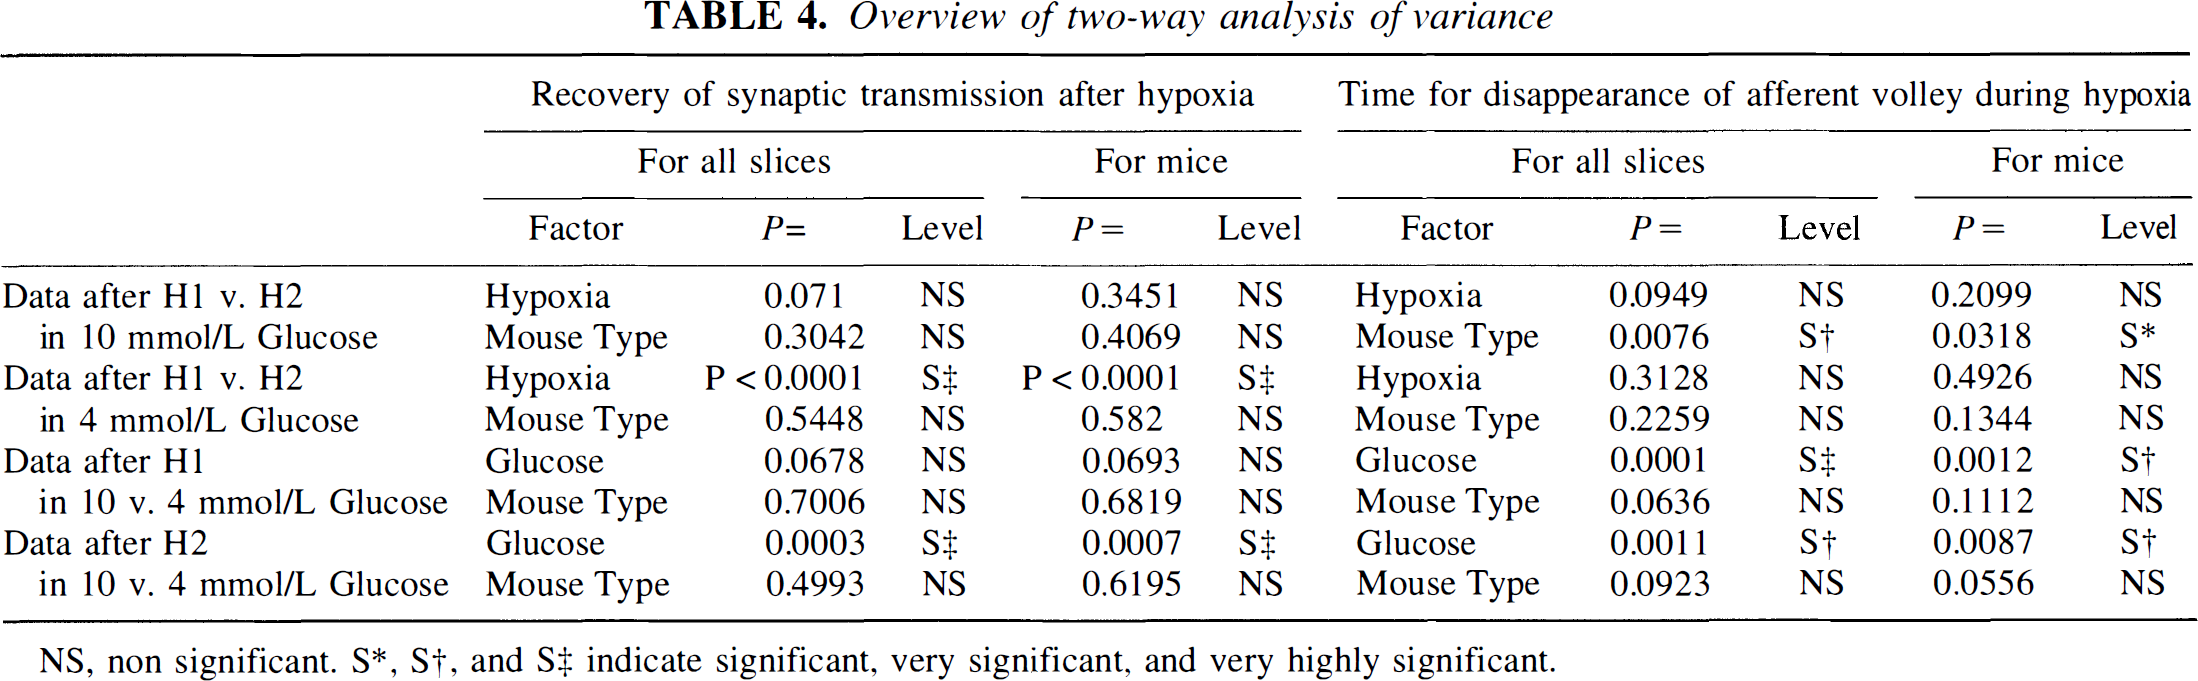
NS, non significant. S*, S†, and S‡ indicate significant, very significant, and very highly significant.
Afferent volley blocking times in slices kept in 4 mmol/L glucose
In all cases, hypoxia caused a much earlier block in 4 mmol/L than in recordings in 10 mmol/L glucose (as indicated in Table 2); but there was little difference between the various types of mice. These conclusions were confirmed by the two-way analysis of variance (Table 4).
In the global analysis, though values for H1 and H2 were consistently lower in slices from mutants, the difference was not large enough to be significant. The factors hypoxia and mouse type are both nonsignificant, and there is no significant interaction between these factors. On the other hand, for values of H1 or H2 obtained in 10 and 4 mmol/L glucose, the glucose factor is extremely significant: For H1, P =0.0001 for slices and 0.0012 for mice; and for H2, P =0.0011 for slices and 0.0087 for mice (see Table 4).
Recovery of field excitatory postsynaptic potentials in 10 versus 4 mmol/L glucose artificial cerebrospinal fluid
As can be seen in Table 3, fEPSPs behaved similarly in slices from control and mdx3cv mice. In the great majority of slices (8/10 controls and 5/6 mdx3cv mice), there was good recovery after both H1 and H2 in 10 mmol/L glucose as well as after H1 in 4 mmol/L glucose. By contrast, in most of the slices kept in 4 mmol/L glucose, there was no recovery at all. In slices from mdx mice, fEPSPs recovered well after H1 in either 10 or 4 mmol/L glucose; but after H2, only three of seven recovered in 10 mmol/L glucose-fewer than in the other types of slices. On the other hand, in 4 mmol/L glucose, the incidence of recovery after H2 was surprisingly similar (two of five) and notably higher than in controls (one of seven).
According to the two-way analysis of variance of the H1 and H2 data obtained in slices in 10 mmol/L glucose, the two factors hypoxia and mouse type appear nonsignificant (see Table 4). Thus, H1 data obtained in 10 and 4 mmol/L glucose are not significantly different for the three groups of mice. By contrast, for H1 versus H2 data in 4 mmol/L glucose, the factor hypoxia is very highly significant, both for slices and for mice (P < 0.0001; Table 4). A Tukey posttest was run to locate differences: The null hypothesis was rejected for H1 versus H2 populations from C57 and mdx3cv slices [critical q(0.05), 30, 6 = 4.302, and, respectively, calculated q = 5.728 and 7.559 for slices; critical q(0.05), 21, 6 < 4.445 and, respectively, calculated q = 4.8 and 6.43 for mice]. Whereas the null hypothesis was accepted for H1 versus H2 populations from mdx slices (calculated q = 4.131 for slices and 2.99 for mice), the percentage of recovery after H2 versus H1 in 4 mmol/L glucose was not as dramatically reduced for mdx slices as it was for C57 and mdx3cv slices. Similarly, analysis of the H2 data in 10 versus 4 mmol/L glucose showed glucose to be very significant (P = 0.0003 for slices and 0.0007 for mice; Table 4).
Intrafactor analysis (Mann-Whitney) of the control (C57) H2 data obtained in 10 and 4 mmol/L glucose confirmed a significant difference between these populations for slices (P = 0.025) as well as for mice (P =0.03). For H2 data from mdx3cv slices, the differences were very significant both for slices (P = 0.004) and for mice (P = 0.029). By contrast, the H2 data from mdx slices in 10 versus 4 mmol/L glucose were not statistically different: P = 0.66 for slices and 0.49 for mice. However, the difference in sensitivity between mdx slices, on the one hand, and control (C57) and mdx3cv slices, on the other, is further supported by the results of a modified Fisher test.
The proportions of slices in which fEPSPs recovered are very significantly different among the groups: by χ2, P < 0.025 (critical χ20.05,5 = 11.07; calculated χ2 = 11.911). According to a Tukey-type posttest, the control and mdx3cv slices in 10 mmol/L glucose are statistically very different from the control and mdx3cv slices in 4 mmol/L glucose (P < 0.001), whereas the recovery scores for mdx slices in 10 and 4 mmol/L glucose are not statistically different.
DISCUSSION
After cutting, slices from mice could not be kept indefinitely in 4 mmol/L glucose, even at room temperature. In this respect, they appear to be more dependent on glucose for their survival than slices from rats. Can this be explained by a lower glycogen content? Or are they truly more dependent on glycolysis? Are smaller nerve cells and fibers in murine brain leakier and therefore more dependent on Na-K pump activity? If the pump has a preference for ATP generated by glycolysis (Paul et al., 1979; Robacker and Lipton, 1983), nerve conduction and synaptic function in the mouse's brain may require a plentiful supply of glucose.
Differential effects of hypoxia on slices from mutants
Bearing in mind its postsynaptic localization (Lidov et al., 1990; Jung et al., 1991; Kamakura et al., 1994), one could expect the absence of brain dystrophin to result in some change in the sensitivity of synaptic transmission to hypoxia. Rather surprisingly, the slices from mutants showed more pronounced hypoxic effects on the presynaptic AV. They will be discussed first.
Afferent volley. The most interesting point was that H1 was very significantly shorter in slices from both mdx and mdx3cv mutants (in 10 mmol/L glucose), by 37 and 19%, respectively [see Table 2; confirmed by the highly significant mouse factor according to the analysis of variance: P = 0.0076 for slices and 0.032 for mice (Table 4)]. Thus, in some way, the absence of dystrophin appears to predispose mutants to earlier hypoxic block of the AV. The most likely explanation for the earlier failure of nerve conduction is excessive leakiness of nerve fibers and inadequate maintenance of ionic homeostasis by possibly impaired Na-K and Ca pump activity (Ozawa et al., 1976; Dunn et al., 1995; Franco and Lansman, 1990; Kargacin and Kargacin, 1996).
Repeating the hypoxic test led to earlier conduction block in all slices. However, because of greater variability in the additional experiments with control (C57) animals, this tendency was not significant (P =0.095 for slices and 0.21 for mice).
For all three groups of mice, values of H1 being markedly lower when slices were in 4 than in 10 mmol/L glucose, the glucose factor is very highly significant: P =0.0001 for slices and 0.0012 for mice (Table 4). But the reductions are greater for control and mdx3cv slices (by 50 and 59% respectively) than for slices from mdx mice (by 39%). A Student-Newman-Keuls posttest located significant differences for C57 and mdx3cv populations for mice after H1 (for slice data only). Thus, with regard to the hypoxic suppression of the AV, either repetition of the hypoxic test or exposure to 4 mmol/L glucose (or both) had a leveling effect, so that the greater susceptibility of slices from mutants evident in 10 mmol/L glucose was no longer detectable.
Synaptic transmission. Mean recoveries of fEPSPs after H1 were virtually identical for all slices kept in 10 mmol/L glucose. In this respect, our results differ from those of Mehler et al. (1992). These authors reported a very low mean recovery of CA1 fEPSPs (24%) after only 5 minutes of hypoxia and no recovery at all after a second hypoxic episode lasting 8 minutes (in mdx slices in the presence of 10 mmol/L glucose). In our experiments, only the lower incidence of recovery after H2 suggested some increased vulnerability of slices from mdx mice. Why the fEPSPs recorded by Mehler et al. (1992) were so much more sensitive is not clear. One would not expect the somewhat higher temperature in their experiments (34 to 35°C) to make such a difference, especially in view of the much longer durations of all our hypoxic tests. In most other respects (type of chamber, ACSF composition), the conditions in their experiments were similar, except that their slices included the entorhinal cortex; but this is not likely to have a prejudicial effect on synaptic transmission in CA1.
Our finding that, in all types of slices, a second period of hypoxia resulted in a more rapid and generally more poorly reversible block of responses [a similar trend is evident in the experiments of Mehler et al. (1992)] runs counter to previous reports that a preconditioning hypoxic episode protects hippocampal slices against the deleterious effect of prolonged hypoxia (Schurr et al., 1986; Perez-Pinzon et al., 1996). Two major points may account for the apparent disagreement. In the first place, the previous studies were done on slices from rats. Second, and perhaps more importantly, they recorded population spikes only: A posthypoxic increase in neuronal excitability-possibly caused by persistent disturbance of ionic gradients (Sick et al., 1987)-could counteract the changes in AV and EPSPs and thus significantly alter the time course of the observed events, the population spikes.
A curious feature was the higher incidence of fEPSP recoveries in slices from mdx mutants than in slices from control and mdx3cv mice. This suggests that mdx slices may be more resistant to damage by repeated energy deprivation-in other words, that protection by preconditoning is more effective-perhaps because of disturbed metabolism in mdx mice (Vignos and Lefkowitz, 1959; Mokhtarian and Even, 1996; Tracey et al., 1996). If this compensating mechanism operates at the linkage between membrane cytoskeleton and extracellular glycoproteins, for which the C-terminal 70-kDa isoform is crucial (Lederfein et al., 1992; Cox et al., 1993; Ohlendieck, 1996), it may be absent in slices from mdx3cv mice that lack the 70-kDa and other isoforms. Compensatory changes in glycolytic metabolism (Schurr et al., 1986) or adenosine's protective action (Perez-Pinzon et al., 1996) are not excluded.
CONCLUSION
In conclusion, the lack of full-length dystrophin seems to predispose hippocampal slices from mdx and mdx3cv mutants to quicker hypoxic block of function, caused by a reversible (glucose-insensitive) failure of presynaptic nerve conduction. By contrast, the finding that posthypoxic (glucose-sensitive) recovery of fEPSPs is selectively enhanced in slices from mdx mutants may indicate a beneficial effect of the dystrophin 70-kDa isoform, present in mdx but not mdx3cv mice.
Footnotes
Acknowledgments
The authors thank Dr. Thierry Ragot (Institut Gustave Roussy, Paris) for the supply of mdx3cv mice and Nicolas Deconinck for a histological control of muscle fibers from these mutants.