
Abstract
Cerebral blood flow (CBF) alterations after asphyxial cardiac arrest (CA) are not defined in developmental animal models or humans. We characterized regional and temporal changes in CBF from 5 to 150 mins after asphyxial CA of increasing duration (8.5, 9, 12 min) in postnatal day (PND) 17 rats using the noninvasive method of arterial spin-labeled magnetic resonance imaging (ASL-MRI). We also assessed blood-brain barrier (BBB) permeability, and evaluated the relationship between CBF and mean arterial pressure after resuscitation. After all durations of asphyxia CBF alterations were region dependent. After 8.5- and 9-min asphyxia, intense subcortical hyperemia at 5 min was followed by return of CBF to baseline values by 10 mins. After 12-min asphyxia, hyperemia was absent and hypoperfusion reached a nadir of 38% to 65% of baselines with the lowest values in the cortex. BBB was impermeable to gadoteridol 150 mins after CA. CBF in the 12-min CA group was blood pressure passive at 60 min assessed via infusion of epinephrine. ASL-MRI assessment of CBF after asphyxial Ca in PND 17 rats reveals marked duration and region-specific reperfusion patterns and identifies possible new therapeutic targets.
Introduction
Optimal recovery of cerebral blood flow (CBF) has been implicated as a critical factor in determining neuronal survival after asphyxial cardiac arrest (CA) in infants and children. CBF after CA is well described in adult animal models; however, there are limited data on CBF after pediatric asphyxial CA. In adult CA models, CBF after CA is phasic in nature, with global hyperemia present for 15 to 30 mins after the return of spontaneous circulation (ROSC) characterized by CBF two to three times higher than baseline, followed by delayed hypoperfusion that occurs after 15 to 30 mins and continues for several hours after ROSC (Kagstrom et al, 1983; Snyder et al, 1975).
Nontraumatic CA in pediatric victims is asphyxial in nature in a majority (90%) of patients (Young et al, 2004), and this is in contrast to predominantly ventricular fibrillation CA seen in adults. In asphyxial CA, a period of systemic hypoxemia, hypercapnea, acidosis, hypotension, and bradycardia precede CA (Fink et al, 2004). Few studies have characterized CBF after neonatal or pediatric global ischemia or hypoxia, and there is variability in reperfusion patterns reported: prolonged hypoxia (90 mins) without CA in neonatal lambs produced hyperemia followed by hypoperfusion (Rosenberg 1986); global cerebral ischemia via cerebrospinal fluid compression in newborn piglets produced hyperemia followed by hypoperfusion in all brain regions except for cortex, where hypoperfusion was present after ROSC (Leffler et al, 1989); cerebral ischemia combined with hypoxia (Rice-Vannucci model) in postnatal day (PND) 7 rats resulted in postresuscitation CBF that was not different than baseline at 30 mins, 4, and 24 h (Mujsce et al, 1990).
Arterial spin-labeled magnetic resonance imaging (ASL-MRI) allows serial assessment of regional CBF. This technique can be applied to small rodents (Foley et al, 2005) and is ideal for application to a clinically relevant pediatric asphyxial CA model (Fink et al, 2004). Accordingly, using ASL-MRI we report serial and regional CBF changes after pediatric asphyxial CA.
Methods
Studies were approved by the Institutional Animal Care and Use Committee at the University of Pittsburgh. An established pediatric asphyxial CA model developed in our center (Fink et al, 2004) was used. Mixed litter, mixed gender PND 16 to 18 Sprague—Dawley rats (30 to 45 g), n = 6 to 7 per group were used. The rats underwent the following durations of asphyxia: 8.5 mins (n = 7), 9 mins (n = 6), and 12 mins (n = 7). Sham-control rats (n = 6) underwent anesthesia and surgery without asphyxia or resuscitation. The experimental paradigm is depicted in Figure 1.
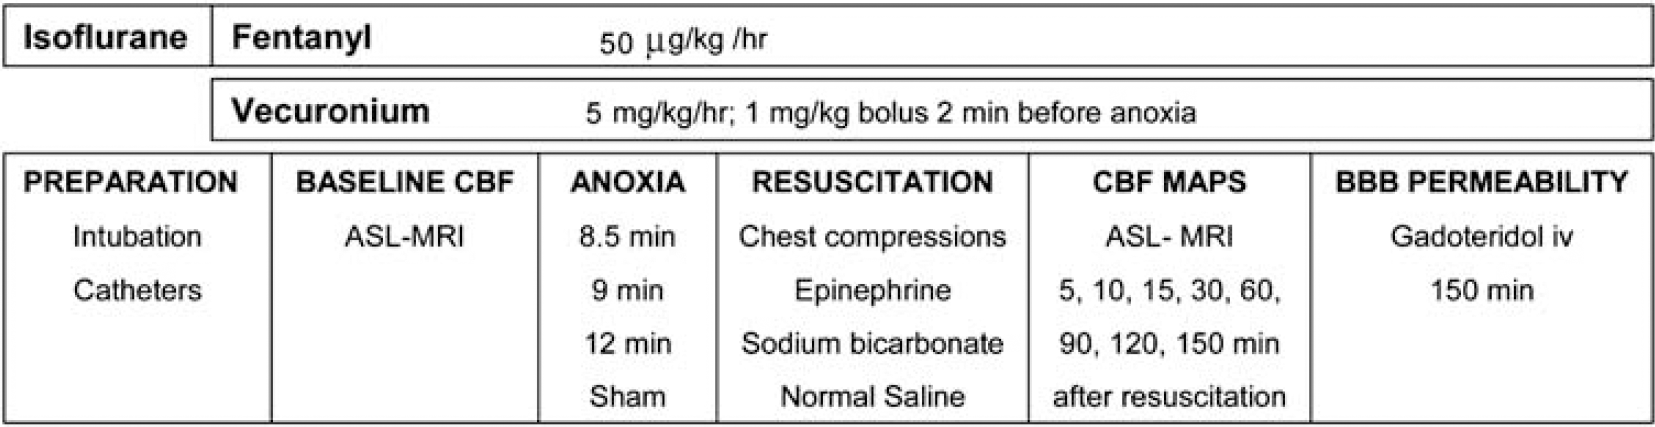
Graphic representation of the methods.
Anesthesia and Surgery
The rats were initially anesthetized with 3% isoflurane/50% N2O/balance oxygen in a Plexiglas chamber until unconscious and then the trachea was intubated with an 18-gauge angiocatheter. Mechanical ventilation was started and ventilatory rates and tidal volumes were adjusted to maintain PaCO2 35 to 45 mm Hg. Femoral arterial and venous catheters (PE 10) were inserted via cut down. Mean arterial pressure (MAP) and heart rate were continuously monitored. Rectal temperature was continuously monitored and maintained at 37°C via a heated water blanket during the surgery and via a warm air heating system (SA instruments, Stony Brook, NY, USA) during the MRI experiments. During surgery, anesthesia was obtained by ventilation with 2.5% isoflurane/50% N2O/balance oxygen. Intravenous (iv) analgesia and paralysis were started after catheter insertion, using a fentanyl infusion at 50 μg/kg/h and vecuronium infusion 5 mg/kg/h. Fentanyl infusion dosing was based on the work of Statler et al (2000). A 30-min period of isoflurane washout was performed before baseline CBF measurements to reduce the confounding effects of inhaled anesthetics on CBF (Hendrich et al, 2001). Baseline ASL-MRI was obtained. Arterial blood gas measurements were obtained at the time of arterial catheter insertion, immediately before baseline CBF measurement, after CA and at the end of the experiment and the ventilatory rates and tidal volumes were adjusted to a target of PaCO2 of 35 to 45 mm Hg.
Asphyxial Insult
A bolus of vecuronium (1 mg/kg, iv) was administered 2 mins before asphyxia to prevent gasping (Manole et al, 2006). The FiO2 was reduced to 0.21 (room air) for 1min before asphyxia to avoid hyperoxygenation. The tracheal tube was disconnected from the ventilator for 8.5, 9, or 12 mins. Resuscitation was started by reconnecting the ventilator at a FiO2 of 1.0. Epinephrine 0.005 mg/kg and sodium bicarbonate 1 mEq/kg were administered iv, followed by manual chest compressions until ROSC. After ROSC, anesthesia and neuromuscular blockade were restarted. A FiO2 of 1.0 was maintained until 15 mins after ROSC, and decreased to 0.4 for the remainder of the experiment.
Magnetic Resonance Image Acquisition and Data Analysis
Arterial spin-labeled magnetic resonance imaging perfusion maps were obtained at baseline and at 5, 10, 15, 30, 60, 90, 120, and 150 mins after ROSC from CA. MR studies were performed on a 7-Tesla, 21 cm-bore Bruker Biospec system equipped with a 12 cm-diameter shielded gradient insert and a 72 mm volume radio frequency coil. Data were acquired for T2-weighted images, perfusion images (Detre et al, 1992), spin-lattice relaxation time maps of tissue water (T1obs) (Hendrich et al, 1999), and spin-labeling efficiency measurements within the carotid arteries (Zhang et al, 1993). T2-weighted spin-echo images were acquired with the following parameters: field of view = 3 cm, slice thickness = 1 mm, interslice distance = 2 mm, TR/TE = 2500/40 ms, NA = 2, five slices, and matrix = 128 × 70. Perfusion images were acquired using ASL (Detre et al, 1992) with continuous flow-induced adiabatic inversion for 2 secs with a constant-amplitude radio frequency pulse in the presence of a 1 G/cm field gradient along the head—foot axis of the animal. The labeling pulse for the inversion plane was positioned ± 2 cm from the perfusion detection plane. The parameters were: matrix = 64 × 40, zero-filled to 64 × 64; TR = 2000 ms; su mmation of three echoes; TE = 10, 20, and 30 ms; and NA = 2. Spin-labeling efficiency was determined from intensities within the carotid arteries with the use of gradient-echo images (Zhang et al, 1993). Images were acquired 1 cm posterior to the plane selected for perfusion detection, with spin labeling applied at ± 10 mm. The perfusion-encoding parameters were the same as those mentioned above, and included a 45° flip angle, eight averages, TR/TE = 100/9.6 ms, and matrix = 256 × 256. The spin-lattice relaxation time of tissue water (T1obs; Hendrich et al, 1999) was measured from a series of spin-echo images acquired with variable TR (TR = 8000, 4300, 2300, 1200, 650, 350, 185, and 100 ms). Other parameters are as follows: TE = 9 ms, two averages, and matrix = 64 × 40.
Image Analysis: All image processing was performed with the Bruker ParaVision 3.0.2 image analysis software. Regions of interest were defined in the left and right hemispheres guided by assignments from a rat brain atlas and included the cortex, hippocampus, thalamus, and amygdala/piriform cortex. Pixel-by-pixel maps of (MC - ML) × M−1C were generated from the perfusion data (where MC is the magnetization intensity from the control image, and ML is the magnetization intensity from the labeled image). T1obs maps were generated from the series of variable TR images by a three-parameter nonlinear fit to, M(TR) = M0 (1-A exp(−TR/T1obs)), where M(TR) is the signal intensity for each TR value, M0 is the signal intensity at equilibrium, and A is the saturation correction factor. Regional CBF was calculated from the formula CBF = γ × (T1obs × 2α)-1 × (MC-ML) × M−1C, where α is the blood-brain partition coefficient of water (Herscovitch and Raichle 1985), assuming a spatially constant value of 0.9 mL/g, and α is the spin-labeling efficiency measured in the carotids. Perfusion maps during CA were obtained to determine the intrinsic error in the measurement of CBF in our study. For these experiments, T1obs was measured during CA and we assume an α-coefficient of 0.7. With the limitations of the above assumptions, CBF during CA is 9 to 10 ml per 100 g/min, which is within the established error range of 10 ml per 100 g/min for ASL as previously reported.
Relationship Between Blood Pressure and CBF
A separate group of rats (n = 4) underwent 12 mins of asphyxia followed by epinephrine infusion. Epinephrine was started at 1 μg/kg/min 1 h after ROSC and was titrated until MAP returned to baseline. To exclude a direct effect of epinephrine-induced increases in MAP on CBF in PND 17 rats, a group of sham-operated animals (n = 3) were given epinephrine to increase MAP > 10 mm Hg above baseline. CBF maps pre and postinfusion of epinephrine were compared.
Assessment of the BBB
To assess blood-brain barrier (BBB) permeability, we used an established technique via MRI using the paramagnetic contrast agent gadoteridol (Gd-HP-DO3A). We infused 0.2 mg/kg gadoteridol iv via the femoral catheter 150 mins after ROSC. Before and 30 mins after infusing gadoteridol, we obtained T1-weighted images (TR = 600 ms, TE = 15 ms, field of view = 3 cm, 256 × 256 matrix, and NA = 2). BBB permeability was assessed by subtracting pre and postinfusion images. This method is sensitive to detect BBB permeability early after brain injury (Hendrich et al, 1997).
Statistical Analysis
Data were analyzed with the statistical package SPSS version 15. Data were expressed as mean ± s.e.m. A P < 0.05 was considered significant. We used one-way analysis of variance with Tukey's post hoc test to compare the weight, baseline CBF, time to CA, and duration of CA. We used repeated measures analysis of variance to compare MAP, PaCO2, PaO2, pH, and CBF values for the four groups at each time point and to determine the differences within each group over time.
Results
Physiological Data
Body weight was similar among groups. CA occurred 2.9 ± 0.18 mins after the start of asphyxia, with no difference between groups (Table 1). MAP, PaCO2, PaO2, and pH at baseline and after ROSC are shown in Table 2. At 5 mins after ROSC, MAP was increased compared with baseline in the 8.5mins group, and was decreased compared with baseline in the 12 mins group. Beyond 15 mins after ROSC, all three asphyxia groups had MAP values less than baseline, with no difference between groups. PaCO2 values did not differ between groups at baseline, 30 and 90 mins post-ROSC. PaCO2 values at 150mins were decreased in the 12-min group compared with the 8.5- or 9-min group. PaO2 was decreased in the 12 mins group at 15 mins post-ROSC, and returned to baseline values afterward. pH values were decreased after ROSC in the sham groups compared with asphyxia groups and at 15 mins post-ROSC compared with baseline in the 12 min asphyxial group.
Baseline Weight, time to CA and duration of CA for the four groups of rats
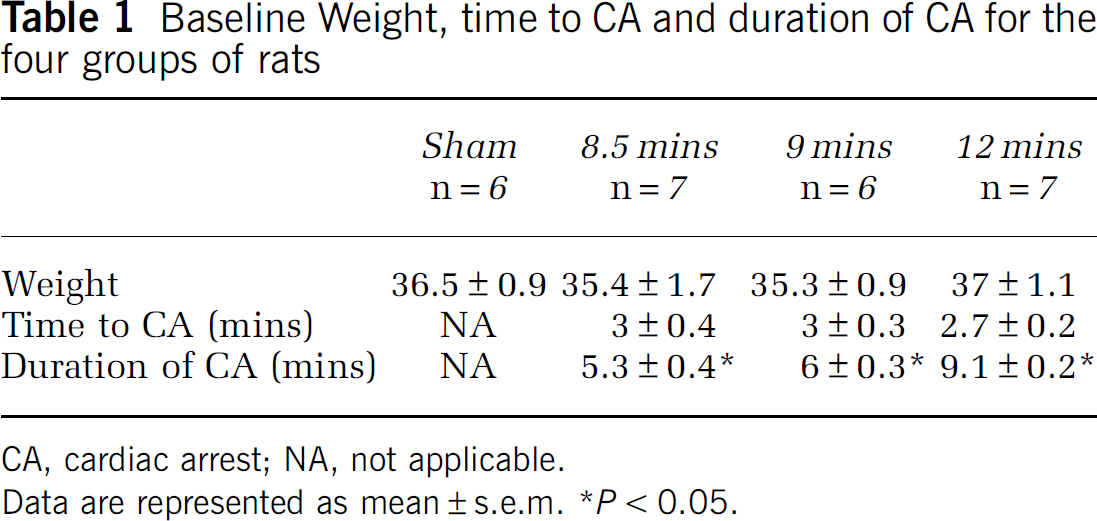
CA, cardiac arrest; NA, not applicable.
Data are represented as mean ± s.e.m. *P < 0.05.
Physiological variables at baseline and after resuscitation in the four groups of rats
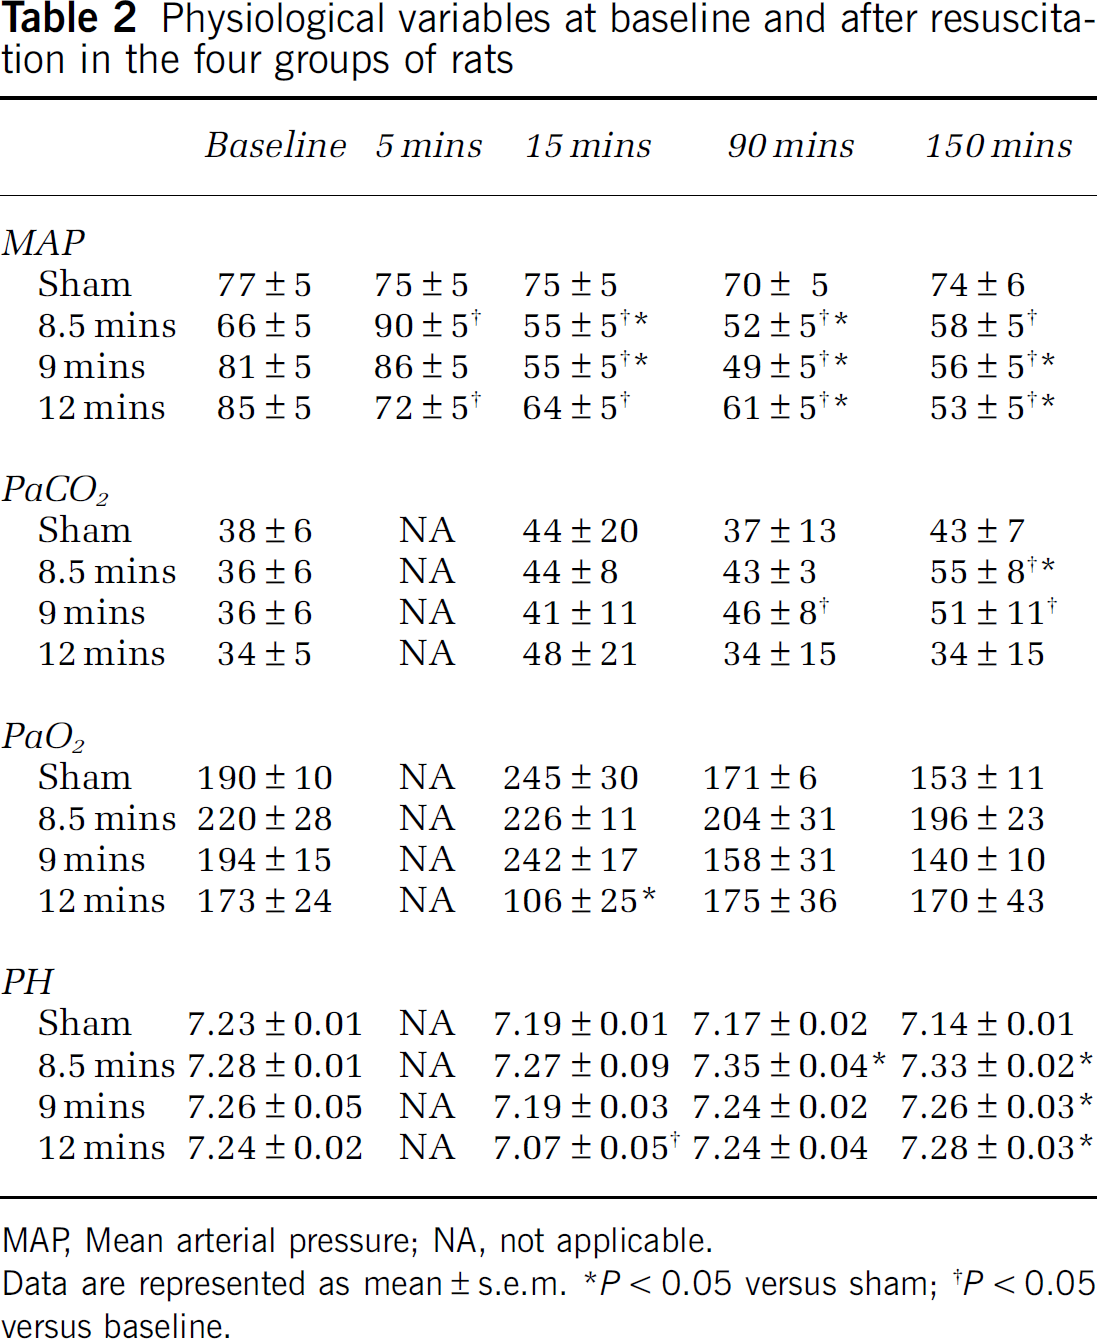
MAP, Mean arterial pressure; NA, not applicable.
Data are represented as mean ± s.e.m.
P < 0.05 versus sham
P < 0.05 versus baseline.
Regional CBF after Asphyxial CA
Baseline global hemispheric CBF was 198 ± 11 ml per 100 g/min. Baseline CBF was heterogeneous in the five brain structures: thalamus 252 ± 17 ml per 100 g/min, hippocampus 215 ± 14 ml per 100 g/min, cortex 199 ± 11 ml per 100 g/min, and amygdala 152 ± 8 ml per 100 g/min. There were no gross differences in CBF between male and female rats, at baseline or after CA. Figure 2 illustrates regional CBF at the 9 time points studied in one representative animal from each group.
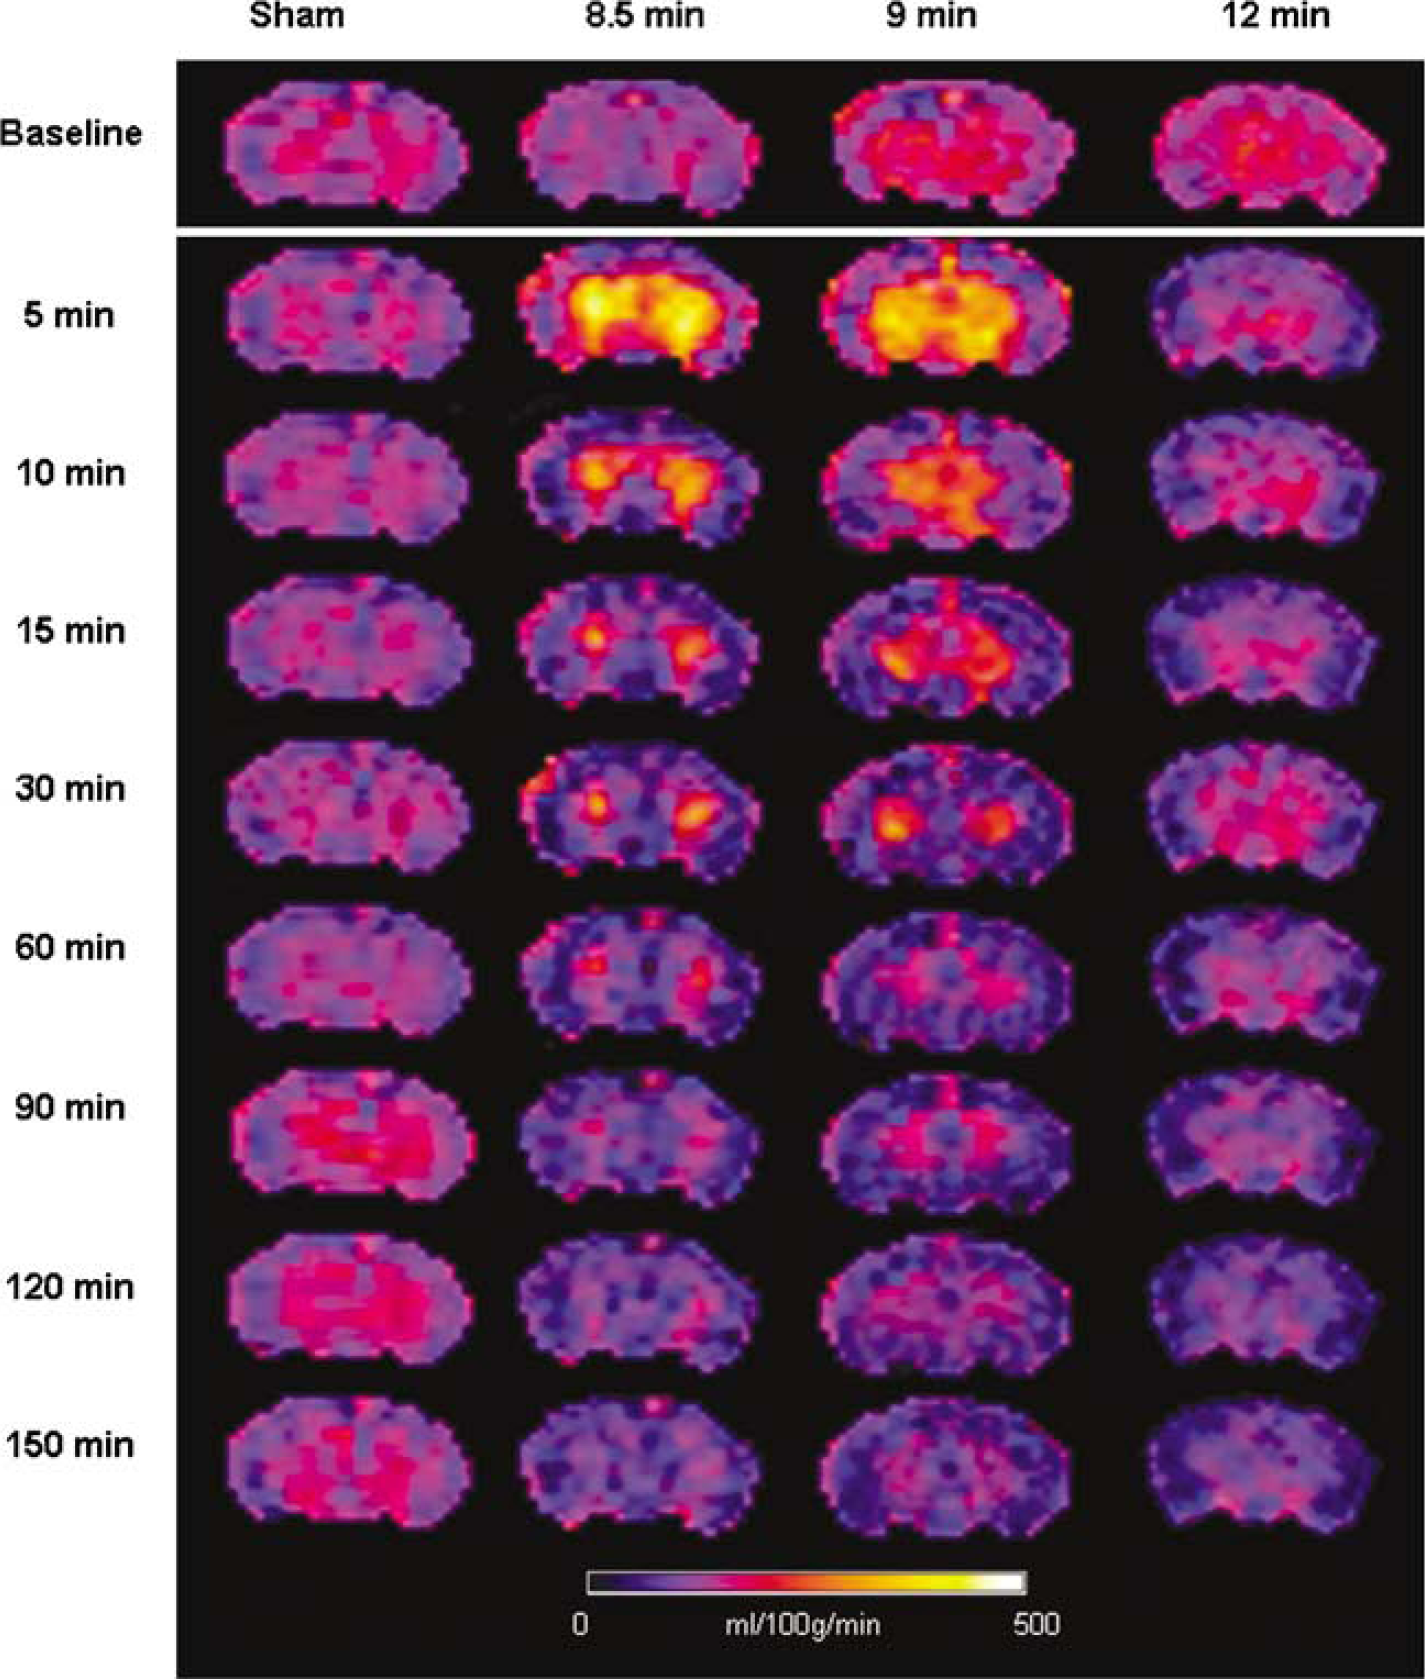
Cerebral blood flow maps for one representative animal in each group. Notice early hyperemia after 8.5 and 9 min asphyxia and hypoperfusion with absence of early hyperemia after 12 mins asphyxia.
Hemispheric CBF (Figure 3A) displayed early hyperemia in the 8.5 mins asphyxia group at 5 mins after ROSC (153% of baseline, P < 0.05) and subsequently returned to baseline values for the remaining period of monitoring. In the 9 mins asphyxia group, hemispheric CBF displayed early hyperemia at 5 mins after ROSC (143% of baseline, P < 0.05), after which CBF decreased and was less than baseline at 60 and 120 mins after ROSC. In the 12 mins asphyxia group, early hyperemia was absent, and hemispheric CBF was less than baseline after ROSC and reached a nadir of 58% baseline at 150 mins.
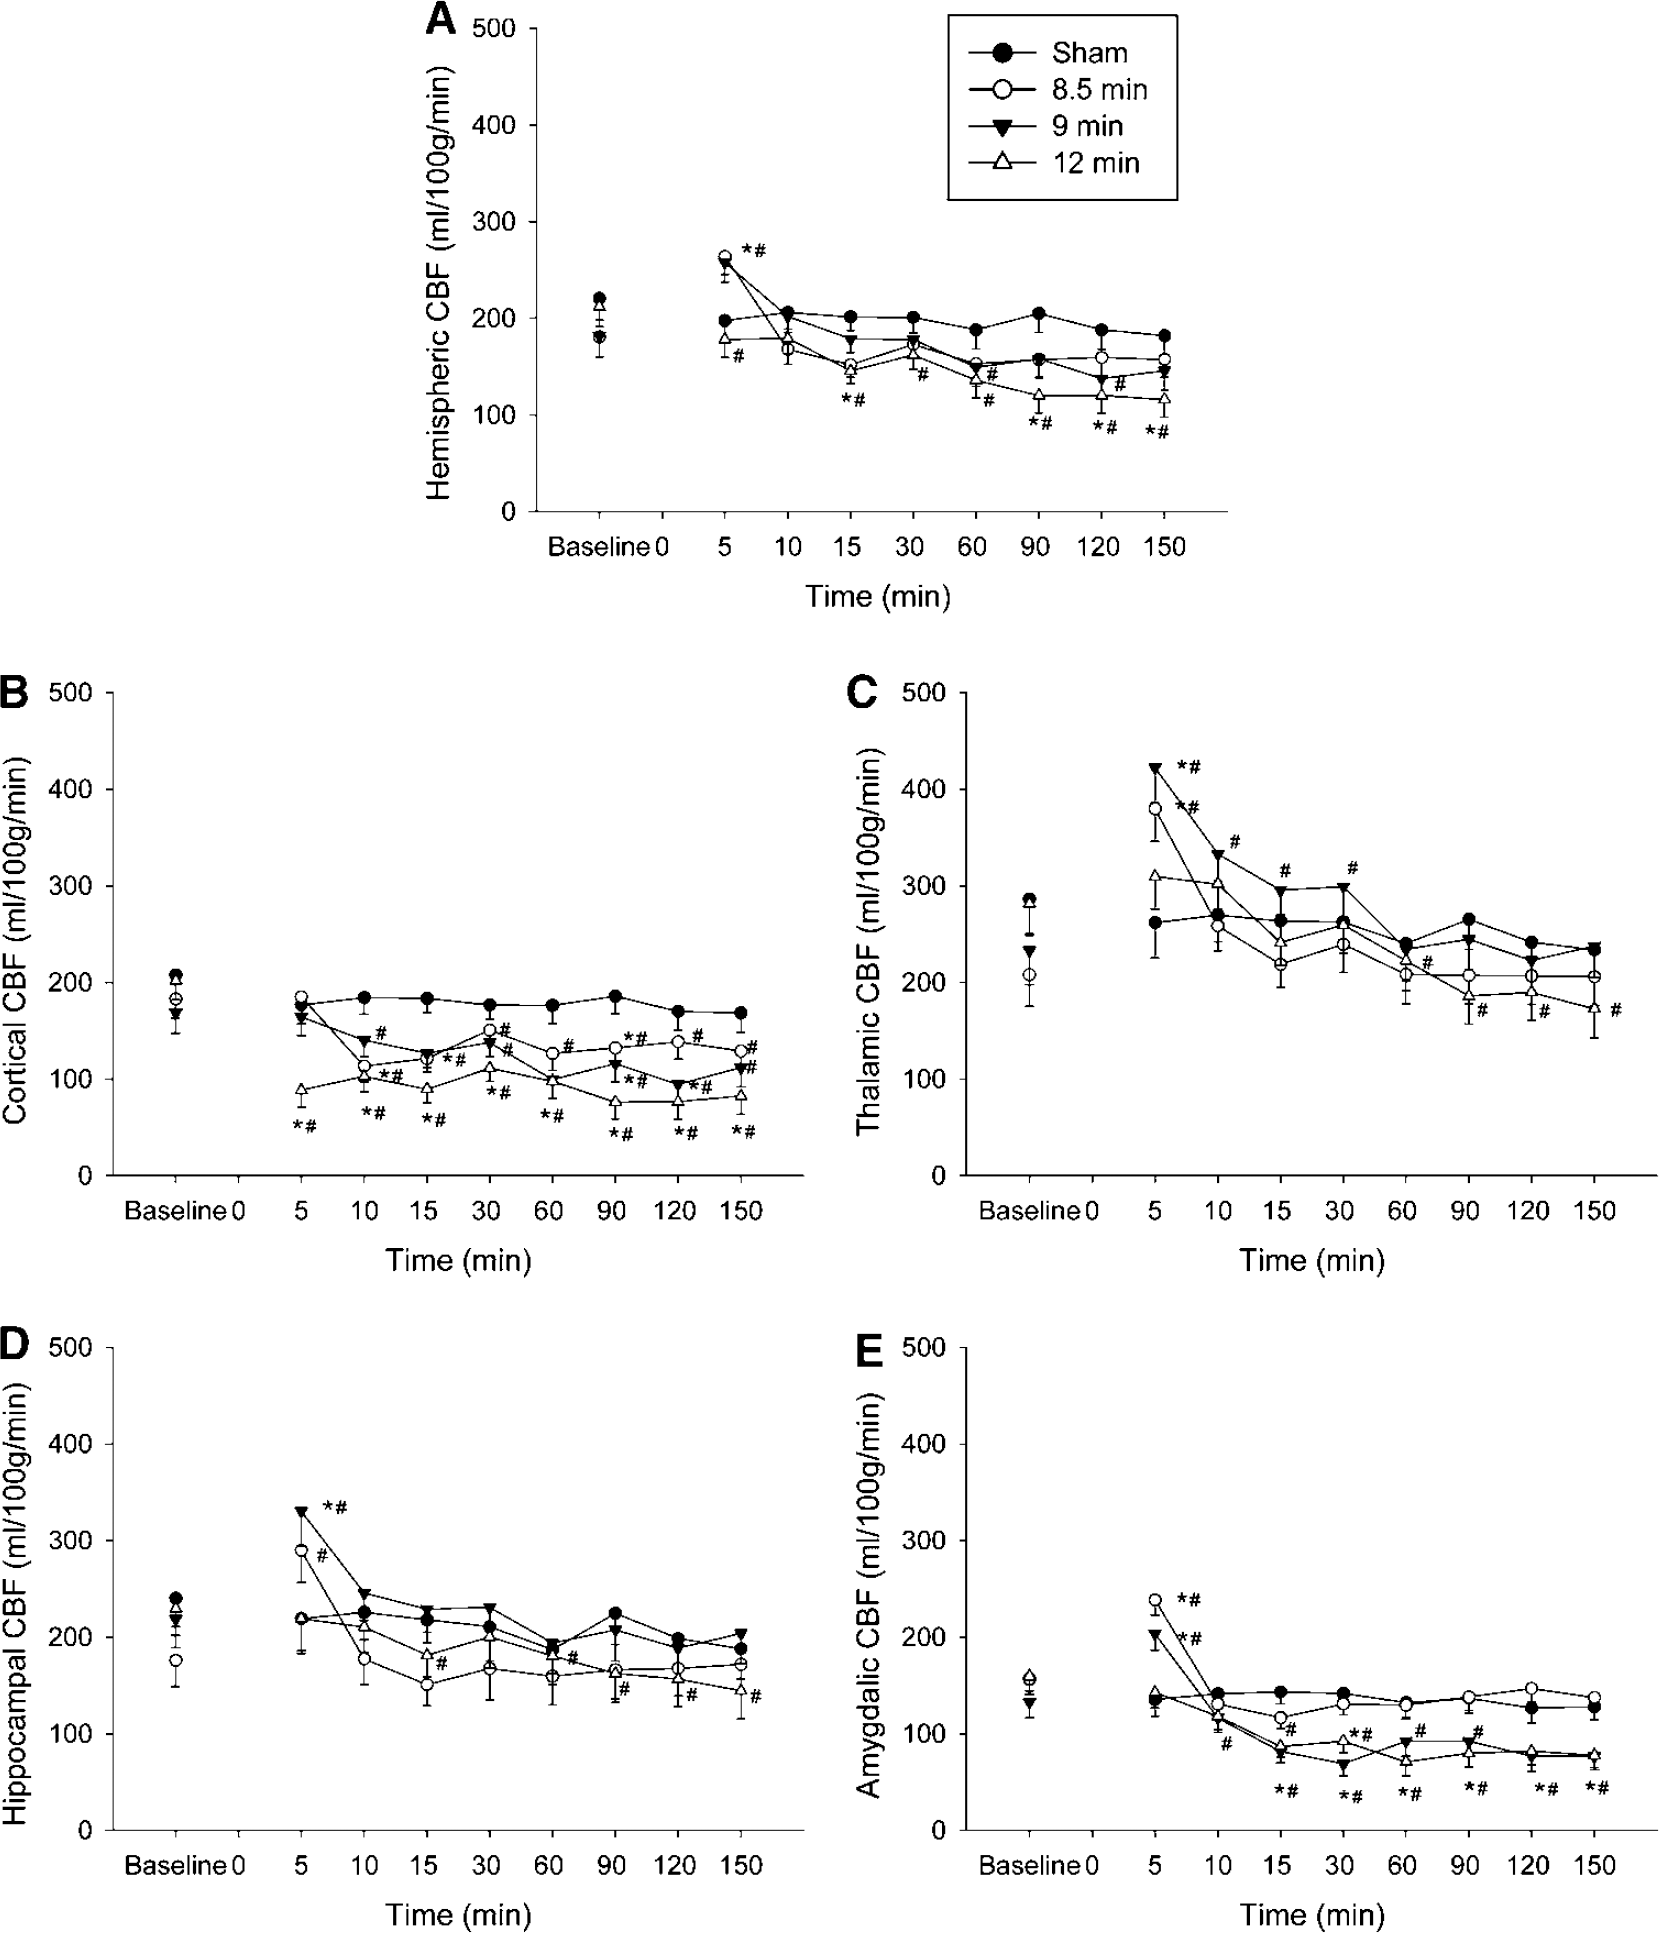
Global hemispheric and regional cerebral blood flow (CBF) at baseline and after return of spontaneous circulation (ROSC). Time zero represents time of ROSC for the asphyxia groups. (
Cortical CBF (Figure 3B) did not exhibit early hyperemia after asphyxia. Hypoperfusion was present from 10 to 150 mins after ROSC in the 8.5 and 9 min asphyxia groups (nadir of 63% and 52% of baseline, respectively) and 5 to 150 mins after ROSC in the 12 mins asphyxia groups (nadir of 38% of baseline).
Thalamic CBF (Figure 3C) displayed early hyperemia in the 8.5 and 9 min asphyxia groups at 5 mins after ROSC (204% and 188% of baseline, respectively, P < 0.05), and subsequently decreased to baseline values 10 and 60 min after ROSC, respectively. In the 12 mins, asphyxia group initial hyperemia was not observed and thalamic CBF displayed hypoperfusion from 60 mins after ROSC, reaching a nadir of 62% baseline at 150 mins.
Hippocampal CBF (Figure 3D) was higher than baseline at 5 mins after ROSC in the 8.5 and 9 min groups (153% and 165% of baseline respectively, P < 0.05). CBF was not different than baseline from 10 mins after ROSC. In the 12 mins asphyxia group, early hyperemia was not seen, and hippocampal CBF displayed hypoperfusion 15 mins after ROSC, with a nadir of 65% of baseline at 150 mins.
Cerebral blood flow in the amygdala (Figure 3E) displayed early hyperemia in the 8.5 and 9 min groups at 5 mins after ROSC (152% and 158% of baseline, P < 0.05). CBF decreased toward baseline after 5 mins and was less than baseline in the 8.5 mins group at two time points (15 and 60 mins). In the 9mins group, hypoperfusion was present and persistent from 10 mins after ROSC reaching a nadir of 53% of baseline at 30 mins. In the 12 mins group, early hyperemia was not seen, and hypoperfusion was present and persistent from 10 mins, reaching a nadir of 47% of baseline at 60 mins after ROSC.
Relationship between MAP and CBF
Mean arterial pressure was statistically significant albeit modestly decreased compared with baseline starting 15 mins after ROSC in all three groups (Table 2). We assessed the response of CBF to increasing MAP in a separate group of animals undergoing 12 mins asphyxia by measuring CBF 60 mins after ROSC, before and after increasing MAP to baseline values via iv epinephrine infusion (dose range 5 to 30 μg/kg/min) (Dewachter et al, 2007). Figure 4 illustrates CBF before and after correction of MAP to baseline values in each of the four animals studied. After administration of epinephrine CBF increased compared with preinfusion and baseline levels in all regions of interest (P < 0.01). Thus, it appears that CBF is blood pressure passive after resuscitation from 12 mins asphyxial CA. Epinephrine infusion in sham animals increased MAP by 10 to 25 mmHg and did not change global and regional CBF (hemispheric CBF 224 ± 13 at baseline versus 209 ± 35ml per 100 g/min postepinephrine), suggesting that epinephrine-induced increases in MAP alone do not affect CBF in PND 17 rats not subjected to asphyxia.
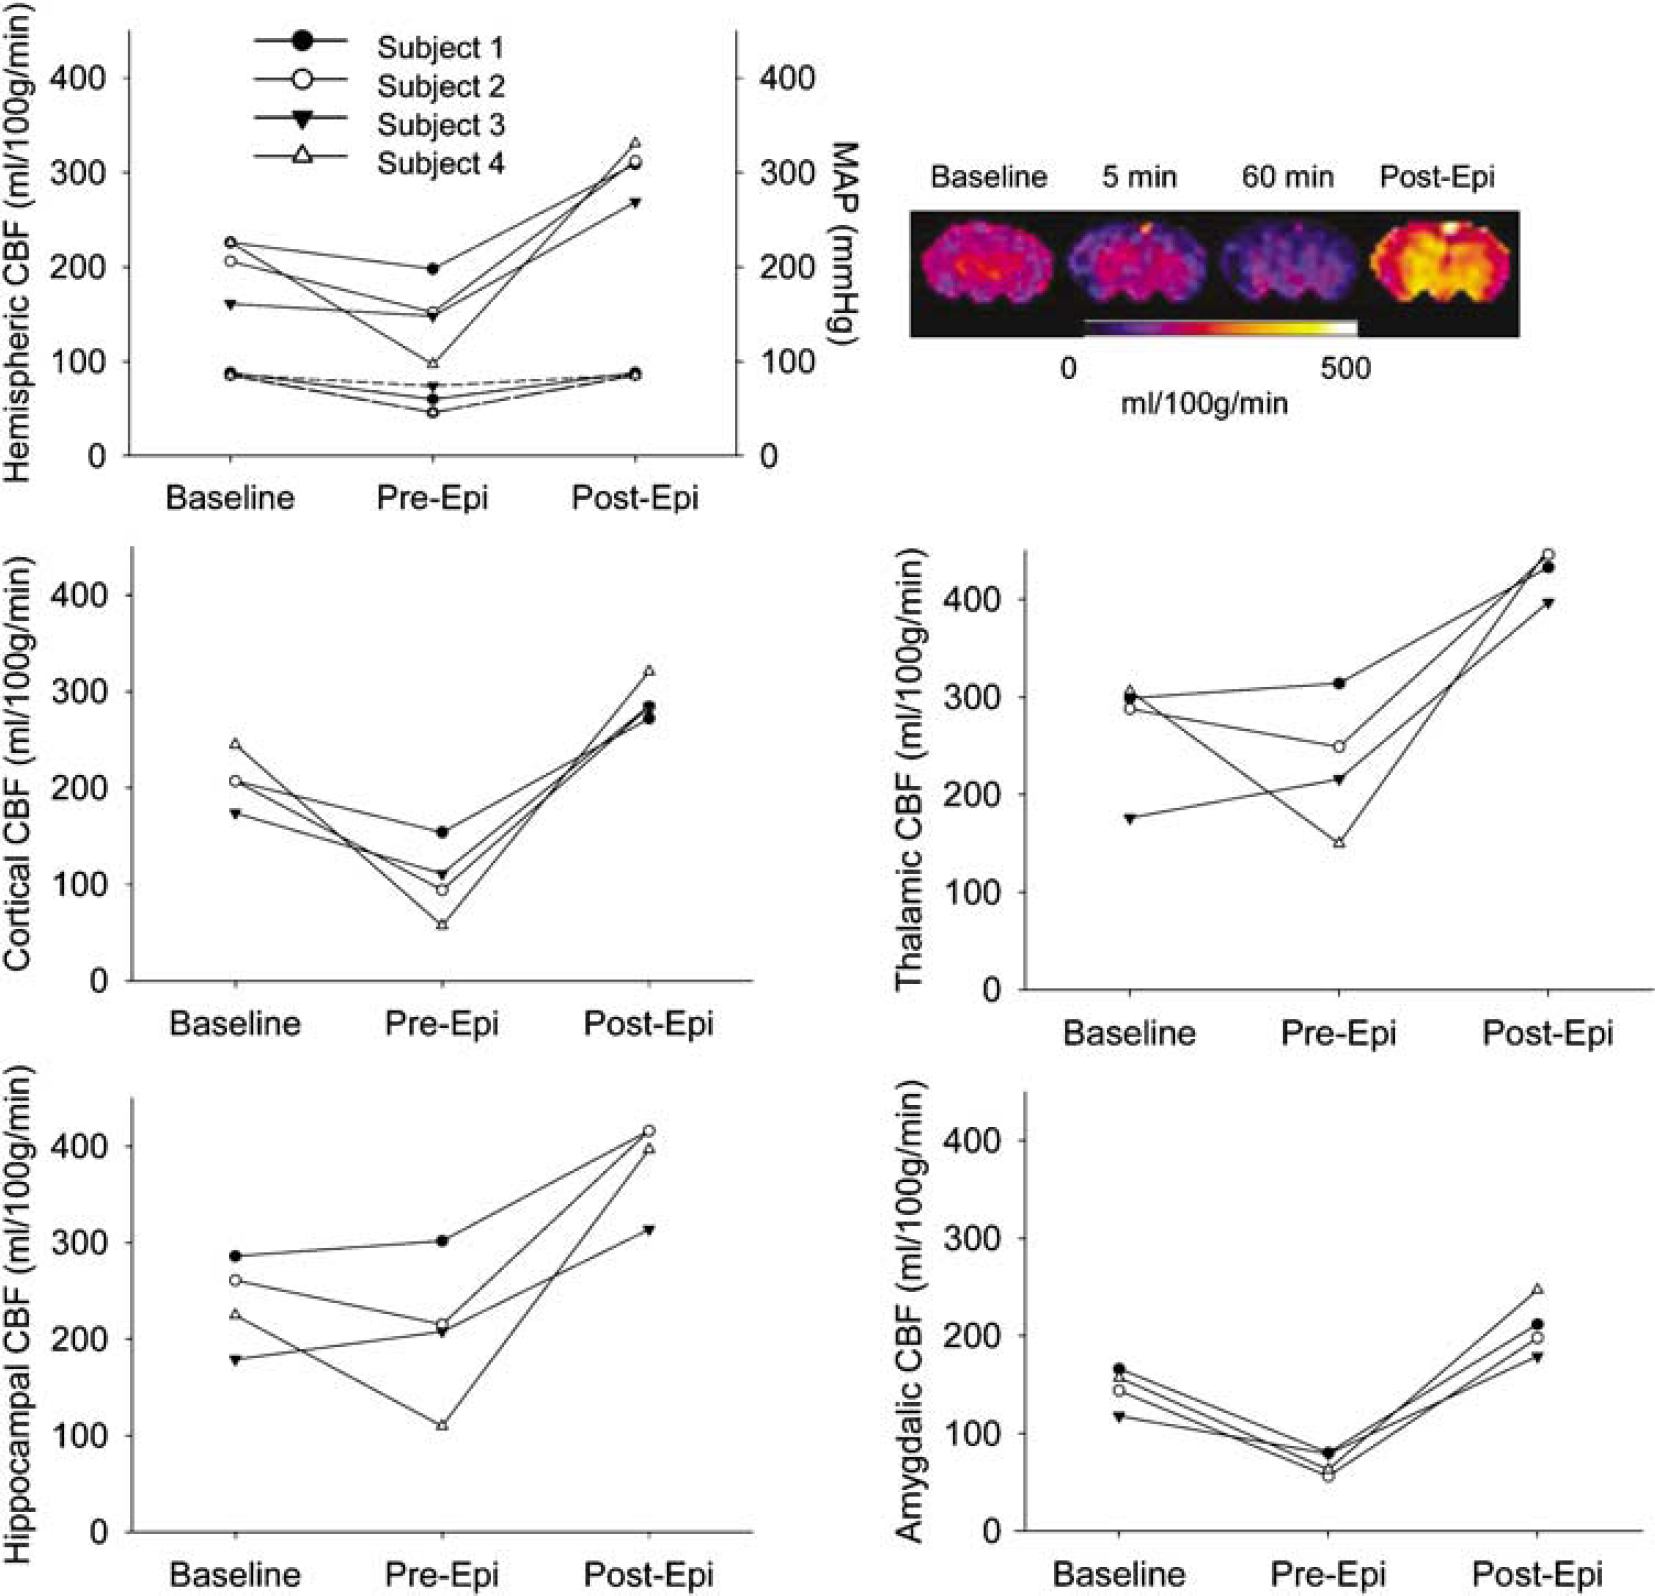
Relationship between mean arterial pressure (MAP) and cerebral blood flow (CBF). CBF and MAP at baseline and after cardiac arrest, before infusion of epinephrine (pre-Epi) and after infusion of epinephrine (post-Epi). CBF color map for one representative animal at baseline and after cardiac arrest, before (1 h) and after epinephrine infusion. Upper portion of the hemispheric CBF graph represents CBF, whereas the lower portion represents MAP for each subject.
Assessment of BBB Permeability
At 150 mins after ROSC, there was no difference between the signal produced pre and postinfusion of gadoteridol, indicating that there was no BBB permeability to this tracer in the four groups of rats 150 to 180mins after asphyxial CA. Figure 5 illustrates T1-weighted images of a representative rat from each group before and 30 mins after infusion of gadoteridol.
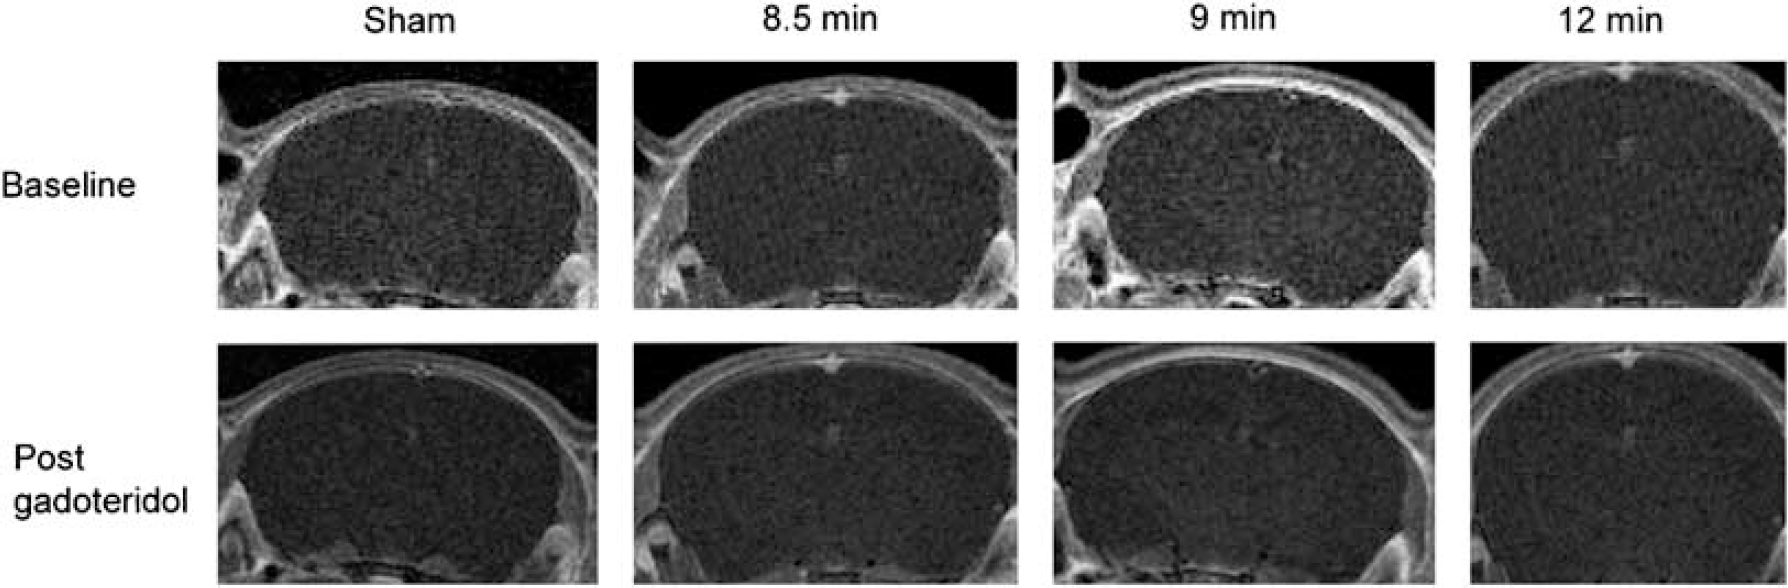
Blood-brain barrier function after CA. There is no difference in the signal obtained before and after administration of gadoteridol, in all groups studied.
Discussion
To our knowledge this is the first study that defines serial and regional CBF after pediatric asphyxial CA in immature rats. To summarize, regional post-CA CBF ranges from hyperemia in the thalamus to hypoperfusion in the cortex and progressively longer asphyxia durations lead to prominent immediate or delayed hypoperfusion without a hyperemic phase.
Previous studies in experimental models examining reperfusion patterns after increasing durations of CA or global cerebral ischemia have produced variable results. This is likely secondary to model differences. Some studies found no difference between the magnitudes of hypoperfusion with increasing duration of ischemia (Michenfelder and Milde, 1990), whereas others found more intense hyperemia with short insults (Liachenko et al, 2001) or more intense hypoperfusion with longer insults (Singh et al, 1992). We showed that increasing duration of CA produces a progressive reduction of perfusion at 15 to 30 mins after resuscitation. Mechanisms that lead to postischemic hypoperfusion remain controversial. Delayed hypoperfusion may be because of impaired endothelial control of CBF (Hossmann 1997; Ten and Pinsky, 2002) or to decreased metabolic demand (Michenfelder and Milde, 1990). Lee et al (1989) showed that CBF during cardiopulmonary resuscitation was inversely proportional to the duration of CA before cardiopulmonary resuscitation, ranging from 30% of baseline CBF for a 1 min CA to zero for a 9 mins CA. Results of our study combined with these earlier observations of progressive decrease in CBF during cardiopulmonary resuscitation with longer CA durations raise the hypothesis that vascular stasis during longer CA durations leads to progressively more extensive no-reflow in a time-dependent fashion. Likewise, there may be regional differences in no-reflow between brain areas; based on our data, cortical areas could have more extensive no-reflow versus other regions of the brain.
A prominent finding of our study is the absence of hyperemia and the predominance of hypoperfusion in the cortex. Most studies show early cortical hyperemia after CA (Liachenko et al, 2001; Mortberg et al, 2007). However, there was absence of hyperemia in the cortex in pig and rat global ischemia models produced by CSF compression (Kagstrom et al, 1983; Leffler et al, 1989). Likewise, in a study of short durations of asphyxia in newborn piglets, asphyxial episodes of 1 to 3 mins without CA caused a 25% decrease of CBF in the cortex, whereas hippocampus, thalamus, and cerebellum showed increases of CBF. Cortical hypoperfusion was postulated to be caused by sympathetic-mediated vasoconstriction (Goplerud et al, 1989). Alternatively sympathetic receptor activation may result in cortical hypoperfusion, secondary to greater density of adrenergic nerve endings in cortical versus subcortical vessels (Edvinsson 1975; Neubauer and Edelman, 1984). Other possible mechanisms mediating cortical hypoperfusion are: decreased NO production, increased superoxide production, or decreased metabolism (Liu et al, 2003; Wainwright et al, 2007).
The BBB was not permeable to the small molecule gadoteridol 3 h after resuscitation in our model. Schleien et al (1991) reported that cardiopulmonary resuscitation does not disrupt the BBB in adult and immature animals. BBB permeability in pigs was first noted at 4 h after ventricular fibrillation (Schleien et al, 1991). We are unaware of any studies assessing the permeability of BBB after asphyxial CA in animals or humans.
In our model, MAP was decreased after asphyxial CA versus baseline in all groups. This is consistent with other studies where CA of significant duration was induced, and it is consistent with the clinical course of humans (Mortberg et al, 2007). We infused epinephrine to test the response to normalizing blood pressure in the 12 mins asphyxia group. CBF increased to levels above baseline, indicating that CBF after asphyxial CA of 12 mins in our model is blood pressure passive. Blood pressure autoregulation of CBF after CA is impaired in comatose patients (Nishizawa and Kudoh, 1996) and it is either absent or right-shifted early after CA (Sundgreen et al, 2001). In a dog model of global ischemia, blood pressure autoregulation was attenuated (Christopherson et al, 1993). We realize that we are testing blood pressure autoregulation in a setting of moderate postresuscitation hypotension. However, MAP in our animals ranged from 53% to 86% of baseline MAP and is unlikely to be below the decrease limit of autoregulation.
We measured CBF with ASL-MRI because it allows serial determinations of regional CBF. This noninvasive imaging modality uses endogenous water as a freely diffusible tracer to measure CBF. It can be applied to small animals such as immature rats (Qiao et al, 2004) and provides quantitative maps of CBF. ASL-MRI has a resolution of 450 mm that was critical to our study. This method was used in a cardioplegic CA model in adult rats by Liachenko et al (2001) and in ventricular fibrillation CA in cats (Krep et al, 2003). To our knowledge, this is the first report of measuring CBF after CA with the ASL-MRI method in an immature animal. Our model is clinically relevant for the study of pediatric resuscitation and uses rats at PND 17, a time of active synaptogenesis, analogous to 2- to 4-year-old human brain development (Harris et al, 1992). It represents the age in rats with the highest level of normal CBF (Nehlig et al, 1989).
There are challenges related to an experiment in the MRI setting on a small animal. The experimental setup includes long arterial and venous catheters and ventilator tubing that must reach equipment placed outside of the magnetic field. In a small animal, blood sampling is also limited. Some of our PaCO2 values were outside of physiological range. PaCO2 was significantly decreased at 150 mins in the 12 mins versus 8.5 and 9 min groups. This increases the possibility that lower CBF in 12 mins group is because of cerebral vasoconstriction in response to lower PaCO2. However, there was no significant difference between PaCO2 values at 90 mins between the three groups, whereas CBF was similar at 90 and 150 mins. This argues against, but does not completely rule out an effect of PaCO2 between groups. After ROSC shams had lower pH versus the asphyxial groups, likely because of the fact that bicarbonate was not given to the shams. However, pH or CBF were not different versus baseline in this group.
Although early hyperemia is regarded as beneficial and hypoperfusion as detrimental (Safar et al, 1996; Sterz et al, 1992), the optimal reperfusion pattern after CA is unknown (Cerchiari et al, 1987). Our results suggest important differences in reperfusion patterns with increasing duration of CA and a need for time-sensitive or CBF-directed therapeutic approaches. It is not entirely known whether cerebral perfusion after ROSC is coupled to cerebral metabolism. Further studies are needed to also determine regional cerebral metabolism after ROSC from CA in our model and to determine the relevance of different levels of hyperemia and hypoperfusion to neuropathologic outcome.
In conclusion, our study defines CBF after resuscitation from three increasing durations of CA in immature rats. Postresuscitation CBF is insult duration dependent, shorter insults result in hyperemia and resolution of baseline CBF, whereas longer insults result in hypoperfusion without hyperemia. There is marked regional variability of CBF, with hypoperfusion of the cortex and hyperemia of the thalamus. Postresuscitation CBF appears blood pressure passive. Future studies are needed to define the relationship between the CBF, metabolism, histology, and outcome after asphyxial CA in the developing brain.
Footnotes
The authors state no conflict of interest.