
Abstract
Hypoglycemia can cause brain dysfunction, brain injury, and death. The present study seeks to broaden current information regarding mechanisms of hypoglycemic brain injury by investigating a novel etiology. The cat's high resistance to brain injury from hypoglycemia suggested that additional influences such as respiratory depression might play a facilitating role. Three groups of cats were exposed to fasting and insulin-induced hypoglycemia (HG; n = 6), euglycemic respiratory depression (RD; n = 5), and combined hypoglycemic respiratory depression (HG/RD; n = 10). The HG animals were maintained at < 1.5 mmol (mean 1 mmol) serum glucose concentration for 2 to 6.6 hours. The respiratory depression was associated with Pao2 and Paco2 values of ~50 mm Hg for 1 hour and of ~35 and ~75 mm Hg, respectively, for the second hour. Magnetic resonance diffusion-weighted imaging estimated brain energy state before, during, and after hypoglycemia. The hypoglycemic respiratory depression exposures were terminated either to euglycemia (n = 4) or to hyperglycemia (n = 6). Brain injury was assessed after 5 to 7 days of survival. Cats exposed to hypoglycemia alone maintained unchanged diffusion coefficients; that is, they lacked evidence of brain energy failure and all six remained brain-intact. Only 1 of 5 euglycemic RD but 10 of 10 HG/RD cats developed brain damage (HG and RD vs. HG/RD, P < 0.01). This difference in brain injury rates suggests injury potentiation by hypoglycemia and respiratory depression acting together. Three injury patterns emerged, including activation of microglia, selective neuronal necrosis, and laminar cortical necrosis. Widespread activation of microglia suggesting damage to neuronal cell processes affected all damaged brains. Selective neuronal necrosis affecting the cerebral cortex, hippocampus, and basal ganglia was observed in all but one case. Instances of laminar cortical necrosis were limited to cats exposed to hypoglycemic respiratory depression treated with hyperglycemia. Thus, treatment with hyperglycemia compared with euglycemia after hypoglycemic respiratory depression exposures significantly increased the brain injury scores (24 ± 6 vs. 13 ± 2 points; P < 0.05). This new experimental hypoglycemia model's contribution lies in recognizing additional factors that critically define the occurrence of hypoglycemic brain injury.
Keywords
Marked hypoglycemia represents a life-threatening medical emergency that may be caused by a range of endocrinologie, metabolic, and hepatic diseases and by toxic exposures to insulin, antidiabetic drugs, and salicylates (Surtees and Leonard, 1989; Selzer, 1989). Hypoglycemia is the most frequent acute complication of insulin-dependent diabetes mellitus, causing symptoms ranging from autonomic responses to seizures and coma (Soltesz, 1993; Davis et al., 1997). Cognitive tasks are performed variably in the presence of hypoglycemia, but performance of more complex tasks deteriorates when glycemia declines to ~3 mmol (Heller and MacDonald, 1996). Fasting commonly precipitates hypoglycemic coma in the presence of drug toxicity and in diabetics treated with insulin (Selzer, 1989; Davis et al., 1997).
Fortunately, brain injury from hypoglycemia occurs relatively infrequently in humans. Thus, among 1,307 patients experiencing drug-induced hypoglycemic coma, whereas 8% died, only 2% developed neurological sequelae (Selzer, 1989). The literature references only isolated cases of hypoglycemic encephalopathy, but large series are absent (Kalimo and Olsson, 1980; Auer et al., 1989), suggesting an infrequent occurrence of hypoglycemic brain damage. Even so, exposure to hypoglycemia should be avoided for several reasons. Infants experiencing hypoglycemia have an increased rate of impaired neurological development (Lucas et al., 1988; Rovet et al., 1987; Bergada et al., 1989). Young diabetic patients suffer a high death rate of 1/800/year due to hypoglycemic episodes (Borch-Johnson and Helweg-Larsen, 1993). Furthermore, the incidences of cerebral cortical atrophy and of cognitive declines are higher in type 1 diabetic patients who experience severe hypoglycemic episodes (Wredling et al., 1990; Deary et al., 1993; Perros et al., 1997). The finding that closely controlling the blood glucose levels in type 1 diabetic patients reduces microvascular complications (DCCT Research Group, 1993), though at the price of increasing the occurrence of severe hypoglycemic episodes (Deary et al., 1993; Lincoln et al., 1996), implies a difficult risk assessment that is predicated on knowledge of hypoglycemic brain injury mechanisms.
Siesjö, Auer, and colleagues have contributed importantly to the understanding of the brain physiology and pathology of hypoglycemia using a rat model (Auer and Siesjö, 1993). Rats exposed to severe hypoglycemia without respiratory or circulatory disturbances showed marked reductions of brain energy state and damage to brain that correlates with the duration of exposure. These experiments demonstrate that hypoglycemia on its own can damage the brain. Though valuable, the relevance of this rat model of hypoglycemia to human hypoglycemic brain injury has limitations. For example, in infants, damage to the brain occurs at moderate levels of hypoglycemia that are higher than those required experimentally (Lucas et al., 1988). Contrarily, the human brain often seems remarkably resistant to hypoglycemic injury and damage develops unpredictably, though with an especially high prevalence in infants and young children (Rovet et al., 1987; Bergada et al., 1989; Lucas et al., 1988). Also, seizures are closely associated with human hypoglycemia (Davis et al., 1997), although they are absent in the rat model of hypoglycemia. The present model seeks to broaden current understanding of hypoglycemic brain injury mechanisms and to afford explanations for clinical facts evading explanation by previous models.
To test our finding that respiratory depression during exposure to hypoglycemia enhances brain injury, we exposed three groups of cats to marked hypoglycemia with maintained cardiorespiratory functions (HG group), to respiratory depression in the presence of normal serum glucose concentration (RD group), and to respiratory depression in the presence of hypoglycemia (HG/RD group). Further, as our earlier findings suggest that after exposure to marked hypoglycemia brain injury may be influenced by the level of glycemia achieved during the restoration of blood glucose levels (de Courten-Myers et al., 1992), we tested whether treatment to hyperglycemic overshoots affects brain injury.
METHODS
Animal groups
Animal care and handling followed the guidelines of the National Institutes of Health publication no. 85-23 (rev. 1985). The institutional animal care and use committee had approved the research protocols. We exposed three groups of conditioned adult cats of either sex (>2 kg of body weight) to marked hypoglycemia, during which the vital signs were maintained normal and stable (HG group); to euglycemic respiratory depression (RD group); and to hypoglycemic respiratory depression (HG/RD group). Glycemia levels of < 1.5 mmol were defined as marked hypoglycemia. The HG group consisted of six cats exposed to escalating durations of marked hypoglycemia with their cardiovascular and respiratory status remaining in the normal range. The RD group encompassed five cats exposed to 2 hours of euglycemic respiratory depression (asphyxia); the severity of the respiratory depression was moderate during the first hour and marked during the second hour when it regularly induced arterial hypotension. The third group (HG/RD), comprising 10 cats, was exposed to 3 hours of hypoglycemia; during the first hour, normal cardiorespiratory functions were maintained, whereas during the subsequent 2 hours, the same respiratory depression exposure was induced as in the RD group. The cats of this latter HG/RD group were randomly assigned to two treatment groups: four cats in which the HG/ RD exposure was terminated to euglycemic levels and six cats in which the exposure was terminated to markedly hyperglycemic levels.
All cats received intensive postprocedural care so that their brains could be examined after 5 to 7 days, permitting brain pathological damage to develop and be unequivocally present on histology.
Anesthesia and surgical preparation
Pentobarbital (Nembutal) anesthesia permitted the prolonged anesthesia required for up to 12 hours of animal experimental exposure and postprocedural treatment. Anesthesia was induced with pentobarbital (35 mg/kg of body weight) injected intraperitoneally. Anesthesia was maintained thereafter with 2 mg/kg/h additional intravenous injections, until discontinued after exposure to hypoglycemia and/or respiratory depression and the blood respiratory gases and serum glucose concentration returned to a normal range and the intravascular monitoring catheters were removed. This is the same anesthetic regimen we have used in other experimental studies requiring extended periods of anesthesia (de Courten-Myers et al., 1994). Clinically, barbiturates are widely used to manage elevated intracranial pressures that prove refractory to conventional methods of treatment, and they often are used over prolonged periods (Woster and LeBlanc, 1990). A thermistor probe, inserted in the rectum, served to continuously record core body temperature.
After the animal achieved a surgical level of anesthesia, we inserted polyethylene catheters aseptically into blood vessels for monitoring. Femoral artery and vein catheters were introduced through an inguinal cutdown. The catheter tips were threaded forward to reach the thoracic aorta and inferior vena cava. The intraarterial catheter permitted withdrawal of blood samples and recording of pulsatile or mean arterial blood pressure. Heart rate was derived from the pulsatile pressure waveform, and all cardiovascular parameters were continuously recorded. The intravenous catheter permitted infusion of anesthesia, insulin, paralyzing agent, and saline and glucose solutions. The animals were ventilated with a pediatric respirator following a tracheotomy and insertion of a cuffed endotracheal tube. The electroencephalogram (EEG) was recorded in seven animals that were not studied with magnetic resonance imaging (MRI) techniques (three subjected to hypoglycemia alone and four to combined hypoglycemic respiratory depression). Subcutaneous electrodes placed symmetrically over the frontoparietal cortex and a nasal reference electrode served for the continuous EEG recordings.
Fasting and hypoglycemia
Regular insulin (3 U/kg intravenously) was injected to induce marked hypoglycemia in the cats that had been food deprived for 48 hours before study. The animals also had received a priming dose of 1.5 U/kg intramuscularly 12 hours before study. Marked hypoglycemia (<1.5 mmol serum glucose concentration; normal = 5 to 6 mmol) developed within ~1 hour after the insulin injection, and hypoglycemic levels were maintained with additional 0.3 U/kg intravenous doses. The duration of hypoglycemia was varied from 2 to 6.6 hours among the HG group and was fixed at 3 hours for the HG/RD group exposed to combined hypoglycemia and respiratory depression. Serum glucose concentrations were determined enzymatically using a Beckman Glucose Analyzer II with calibrations before each measurement.
The animals of the RD and HG/RD groups also were food deprived for 48 hours before exposure to render them comparable with the animals of the HG group and to limit the hyperglycemic response to the stress of RD. Exposure to respiratory depression markedly increases the cats' glycemia levels (up to 50 mmol) when they have been normally fed (de Courten-Myers et al., 1985). Thus, all three animal groups (HG, RD, and HG/RD groups) were similarly fasted prior to study.
Physiologic monitoring
The arterial blood pressure, heart rate, and core temperature of all animals were continuously monitored on a multichannel polygraph before, during, and after according to the conditions of the experiment. The EEG was monitored only in those animals that did not undergo MR studies. Arterial blood respiratory gases, pH, and serum glucose concentrations were measured at 30-minute intervals or as needed. Core temperature was maintained in the normal range for cats (38.5 ± 0.5°C) using a thermostatically controlled water blanket.
Respirator
During hypoglycemia, respiratory depression, hypoglycemic respiratory depression, and recovery, all cats were mechanically ventilated to maintain their blood gases within physiologic limits or the experimentally prescribed limits by adjusting the respirator settings. The respiratory gas values of respiratory depression, simulating those that may occur during marked hypoglycemia, were induced for 2 hours in the cats of the RD and HG/RD groups by reducing the respirator rate and ventilation volume. For the first hour, we induced a moderate degree of asphyxia (Paco2 and Pao2 ~ 50 mm Hg). Thereafter, the respirator settings were further changed so as to lead to a more marked asphyxia (Paco2 ~ 75 mm Hg and Pao2 ~ 35 mm Hg) for the second and final hour. Exposure to the marked asphyxia depressed the animal's cardiovascular performance, causing several (usually three) hypotensive episodes with mean arterial blood pressure reductions below 60 mm Hg. The cardiovascular performances of all animals were closely monitored, and episodes of hypotension were terminated within 1 to 2 minutes by temporarily increasing the ventilator rate and stroke volume.
Magnetic resonance imaging
To determine the onset of brain energy failure, sequential diffusion-weighted imaging (DWI) was carried out at 30-minute intervals from three regions of interest in six studies (three each in the HG and the HG/RD groups). Diffusion-weighted imaging is recognized as a sensitive method of assessing energy failure by measuring the apparent diffusion coefficient (ADC) of water, which depends principally on the extent of “free,” that is, extracellular water (Busza et al., 1992; Hossmann et al., 1994). During brain energy failure, the cessation of ionic pumping causes “free” water to move from the extra- to the intracellular compartments, where it is bound principally to proteins accompanied by a marked decline in the brain ADC.
Because of the sensitivity of the DWI to motion artifact, all animals' heads were positioned securely within the head coil and magnet with the aid of a custom-designed cat headholder. The anesthetized and ventilated animals also were paralyzed with vercuronium bromide (Norcuron; 0.10 mg/kg intravenously) initially supplemented by 0.01 mg/kg intravenously every 30 minutes for the duration of the MR studies.
The DWI measurements were performed on a 3.0 T Bruker Biospec 30/60 MR scanner (Bruker Instruments, Karlsruhe, Germany) equipped with an actively shielded 30-cm gradient. A custom-designed 16-column birdcage radiofrequency coil was built to accommodate the animal's head and timed to the 125-MHz MR frequency. The regions of interest were projected on coronal slices of T2-weighted images: The midthalamic slice served for the placement of two superolateral regions of interest containing cerebral cortex, white matter, and hippocampus, and a centrally located region of interest was positioned over the thalamus/upper brainstem.
Four spin echo diffusion-weighted scans were acquired with different diffusion b values to a maximum b of 9,390.5 s/cm2, a relaxation time of 2,000 ms, and a slice thickness of 3 mm. The ADCs were calculated by exponential line fit to each image pixel as a function of the b value. Alterations within each region of interest are reported as percentage changes relative to a standard containing gadolinium-doped water placed in the cat's ear (Kimmich and Hoepfel, 1987).
Treatment to eu- and hyperglycemia
The hypoglycemia of the HG group cats was terminated by infusion of 3.3 mL/kg glucose solutions over 10 minutes. The HG group received infusions of 10% dextrose in water. The animals of the HG/RD group were divided randomly into two subgroups. The six cats treated to hyperglycemia received 30% dextrose in water, and the four cats treated to euglycemia (or to minimal degrees of hyperglycemia) received a solution containing 1 part 50% dextrose in water and 4 parts 25% mannitol. The addition of mannitol to the infusate of the latter group ensured the two groups were infused with solutions of the same osmolality in spite of a threefold difference in glucose content. The levels of glycemia achieved were maintained for 2 hours with additional rate-adjusted infusions of 10% glucose solutions. All animals also received 30 mL/kg isotonic saline throughout the day of exposure.
Postoperative care
All animals were intensively monitored for at least 2 hours after termination of the experimental conditions. After they resumed adequate spontaneous breathing and were in stable cardiovascular conditions, monitoring catheters were removed except for the venous line and incisions were sutured. When they had awakened from anesthesia, they were transferred to a temperature-controlled intensive care unit until they recovered fully. Glycemia continued to be monitored until stable normoglycemia was restored, and the venous catheter was usually removed the next morning. Fluid (30 to 40 mL/kg/day) was administered first intravenously and then subcutaneously or per os until the animals resumed feeding on their own and could stand and walk. Hand feeding was started on the first postoperative day and continued as long as necessary. Nalbuphine hydrochloride (Nubain; 1 mg/kg) was administered three times per day for 3 days to control pain postoperatively. All animals were allowed to survive for 5 to 7 days (except for a single cat that died on the third postoperative day) to permit definitive pathologic changes to take place in the brain. All animals that died during exposure or within the first 2 days following exposure (one in the HG, one in the RD, and six in the HG/RD groups) were excluded from this study. All animals used in the study were killed under deep pentobarbital anesthesia (60 mg/ kg intraperitoneally), and their brains were fixed by in situ vascular perfusion using 10% buffered formalin. The brains, after removal, were postfixed for 2 weeks in 10% formalin.
Brain pathologic examination
The formalin-fixed brains were examined for focal lesions and for evidence of brain edema. The entire brain was sliced into six standard coronal sections: level I through the anterior frontal lobes, level II through the anterior basal ganglia/ posterior frontal lobes, level III through the midthalamus/ anterior hippocampus, level IV through the posterior hippocampus/parietal lobe, level V through the upper brainstem/ cerebellum, and level VI through the lower brainstem/ cerebellum. The brain slices then were embedded in paraffin for preparation of whole-mount hematoxylin and eosin-stained histologic slides. Select areas were studied using immunohistochemical techniques to demonstrate glial fibrillary acidic protein, a marker for reactive astrocytic gliosis.
The types and extent of brain damage were assessed semiquantitatively with the examiner blinded as to the individual animal's exposure type. The three types of brain injury observed included laminar cortical necrosis, selective neuronal necrosis, and activation of microglia, as illustrated in Fig. 1. In addition to recording the mere presence or absence of brain damage, we used a simple scoring system to semiquantitatively assess the extent of brain injury. The score was composed of the sum of points assigned for each of the three injury types and level with the right and left cerebral hemisphere scored separately on levels II, III, and IV. One point was assigned each for the presence of activation of microglia and for selective neuronal necrosis. Two points were assigned to the occurrence of laminar cortical necrosis, as this change represents a more marked type of injury, as can be seen in Fig. 1.
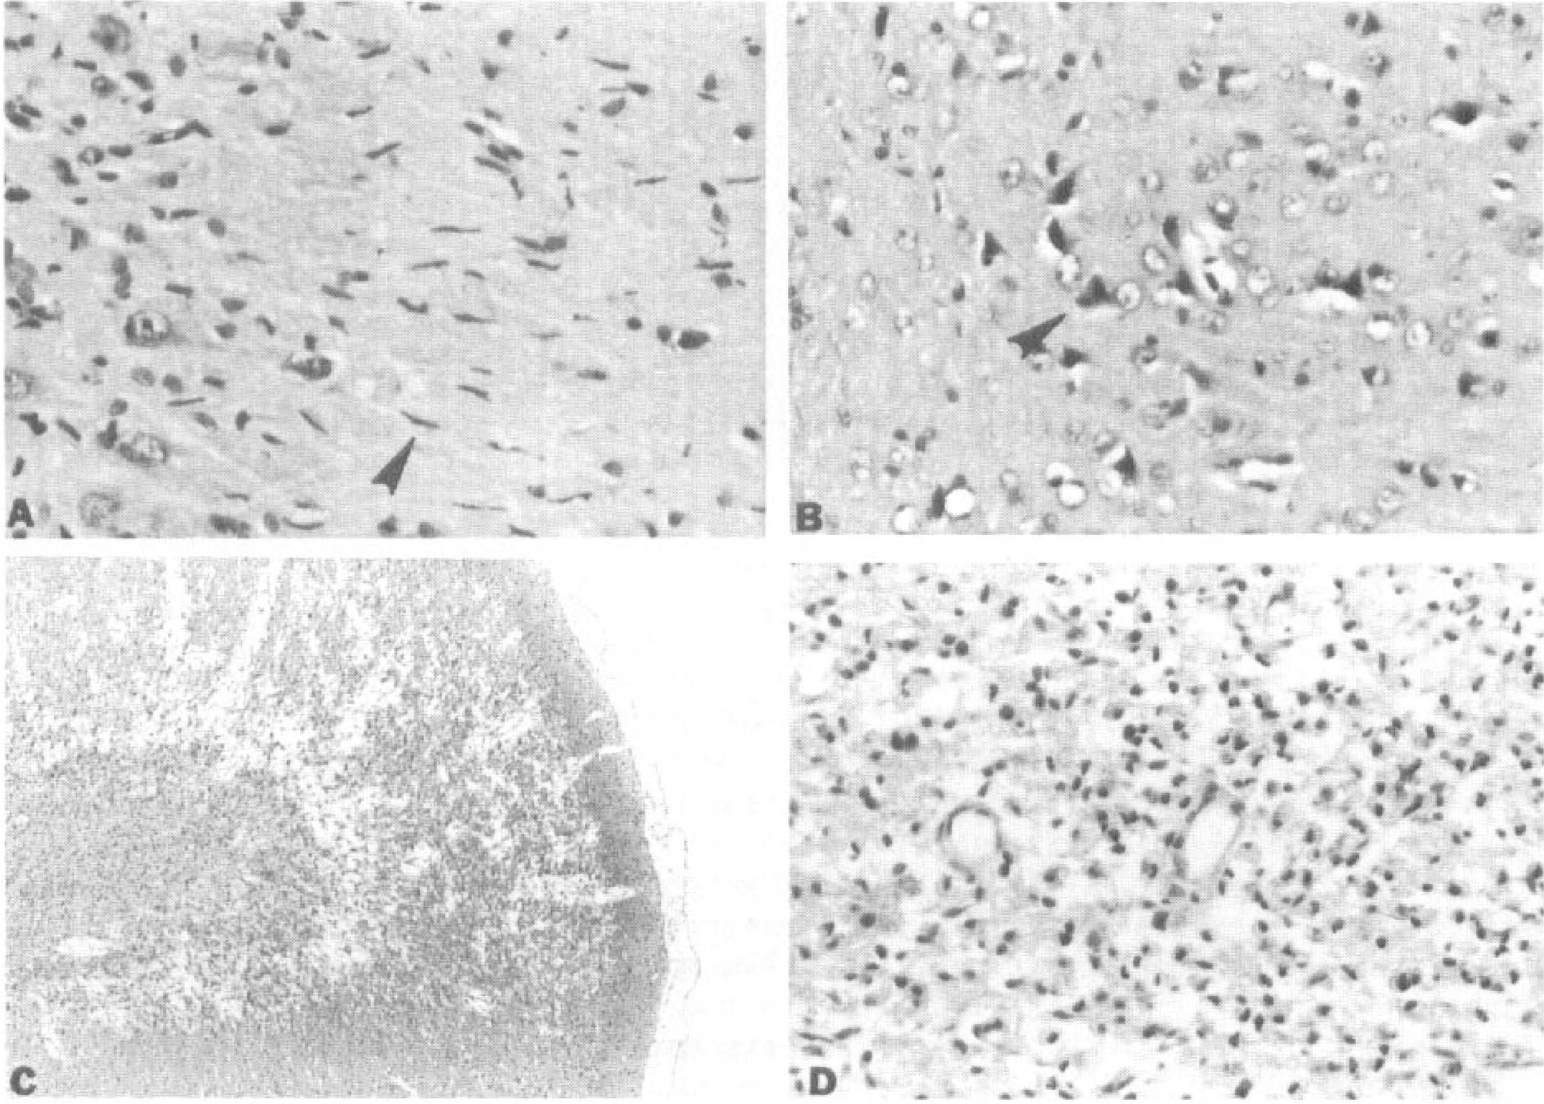
Brain pathology patterns induced by exposure to hypoglycemic respiratory depression. Photomicrographs of cerebral cortex and hippocampus illustrate activation of microglia
Thus, the seven histologic sections from the cerebral hemispheres yielded each 0 to 4 points, and as laminar cortical necrosis does not occur in the brainstem/cerebellum, the remaining two sections yielded each 0 to 2 points. This pathology score ranged from a minimum of 0, indicating no damage, to a maximum of 32 damage points.
Statistical analyses
Monitored physiologic parameters and pathology scores were expressed as means ± SD for each group, and group differences were assessed with the two-tailed Student t test. The brain injury rates in the different groups were compared using Fischer's exact test, and Wilcoxon's range test verified the treatment groups' differences in extent of brain injury. A level of P < 0.05 was accepted as statistically significant.
RESULTS
Physiologic changes
The cats composing the HG/RD group compared with the HG and RD groups, respectively, exhibited closely similar magnitude and duration of hypoglycemia or of respiratory depression's changes in respiratory gas composition of arterial blood. The two treatment HG/RD subgroups of cats were closely comparable during exposure but differed by design in the glycemia levels maintained during the treatment phase. Tables 1 and 2 present the various experimental groups' values for critical variables displayed during specific phases of the study. Figure 2 shows the average glycemia values experienced over time by the different experimental groups. Thus, the animals of corresponding experimental groups were exposed to similar durations of hypoglycemia and/or respiratory depression and showed similar experimental values of serum glucose concentration or blood respiratory gas composition and mean arterial blood pressure during the critical phases of the study, with one exception. Due to escalation of the duration of hypoglycemia in the HG group from 2 to 6.6 hours but a fixed 3-hour duration in the HG/RD group, the HG group experienced a significantly longer exposure to < 1.5 mmol serum glucose concentrations than did the HG/RD group. Guided by the rat hypoglycemia studies (Auer and Siesjö, 1993), we started with 2-hour HG exposures, as they yielded attenuated EEGs for cumulatively >30 minutes. Because brain injury did not ensue, we prolonged the exposure progressively up to more than threefold, but even so, all six animals of the HG group remained brain-intact. Despite the nearly twofold shorter mean duration of exposure, it was the HG/RD group that later demonstrated brain injury (see below).
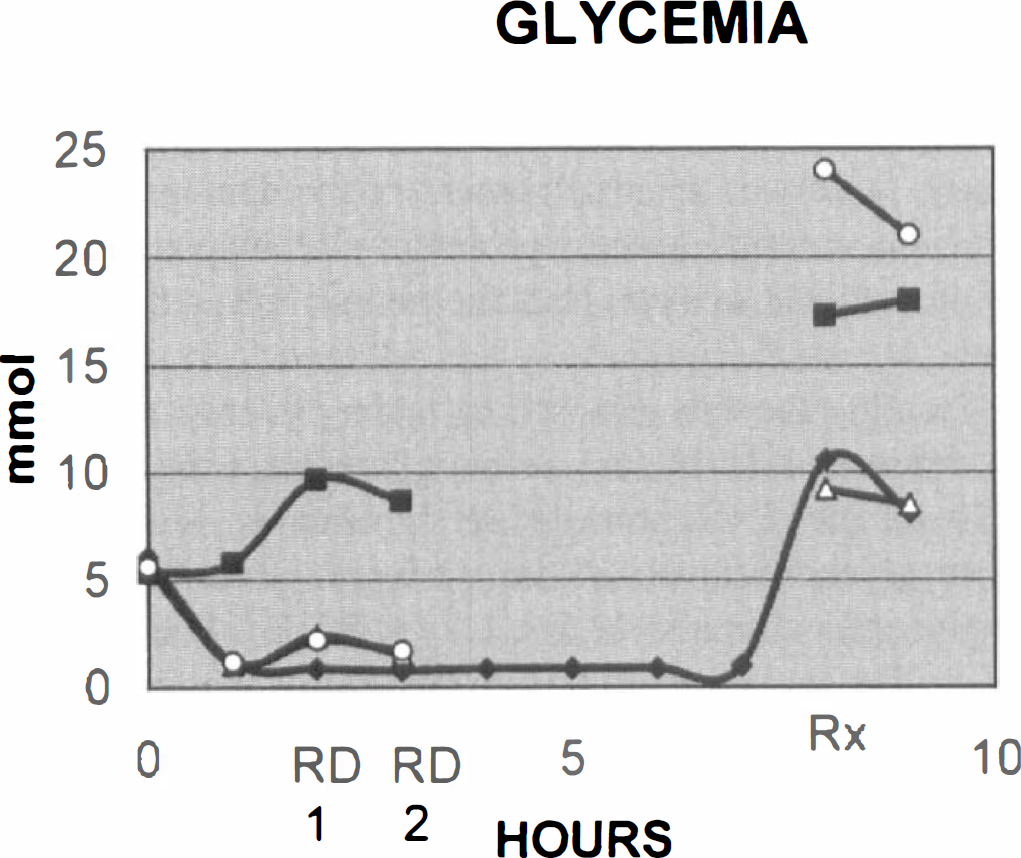
Temporal changes in glycemia. The mean values for each experimental group at 1-hour interval reveal a stable hypoglycemia of ~1 mmol in the hypoglycemic (HG) group. Respiratory depression (RD) elicits a hyperglycemic response in the RD and HG/RD groups that is similar in the two HG/RD treatment groups 1 and 2. Therapy-induced hyperglycemia terminating the exposures is mild in the HG and HG/RD1 groups but marked in the RD and HG/RD2 groups. (♦) HG; (■) RD; (△) HG/RD1; (○) HG/RD2.
Group comparability for exposure variables of HG, RD, and HG/RD
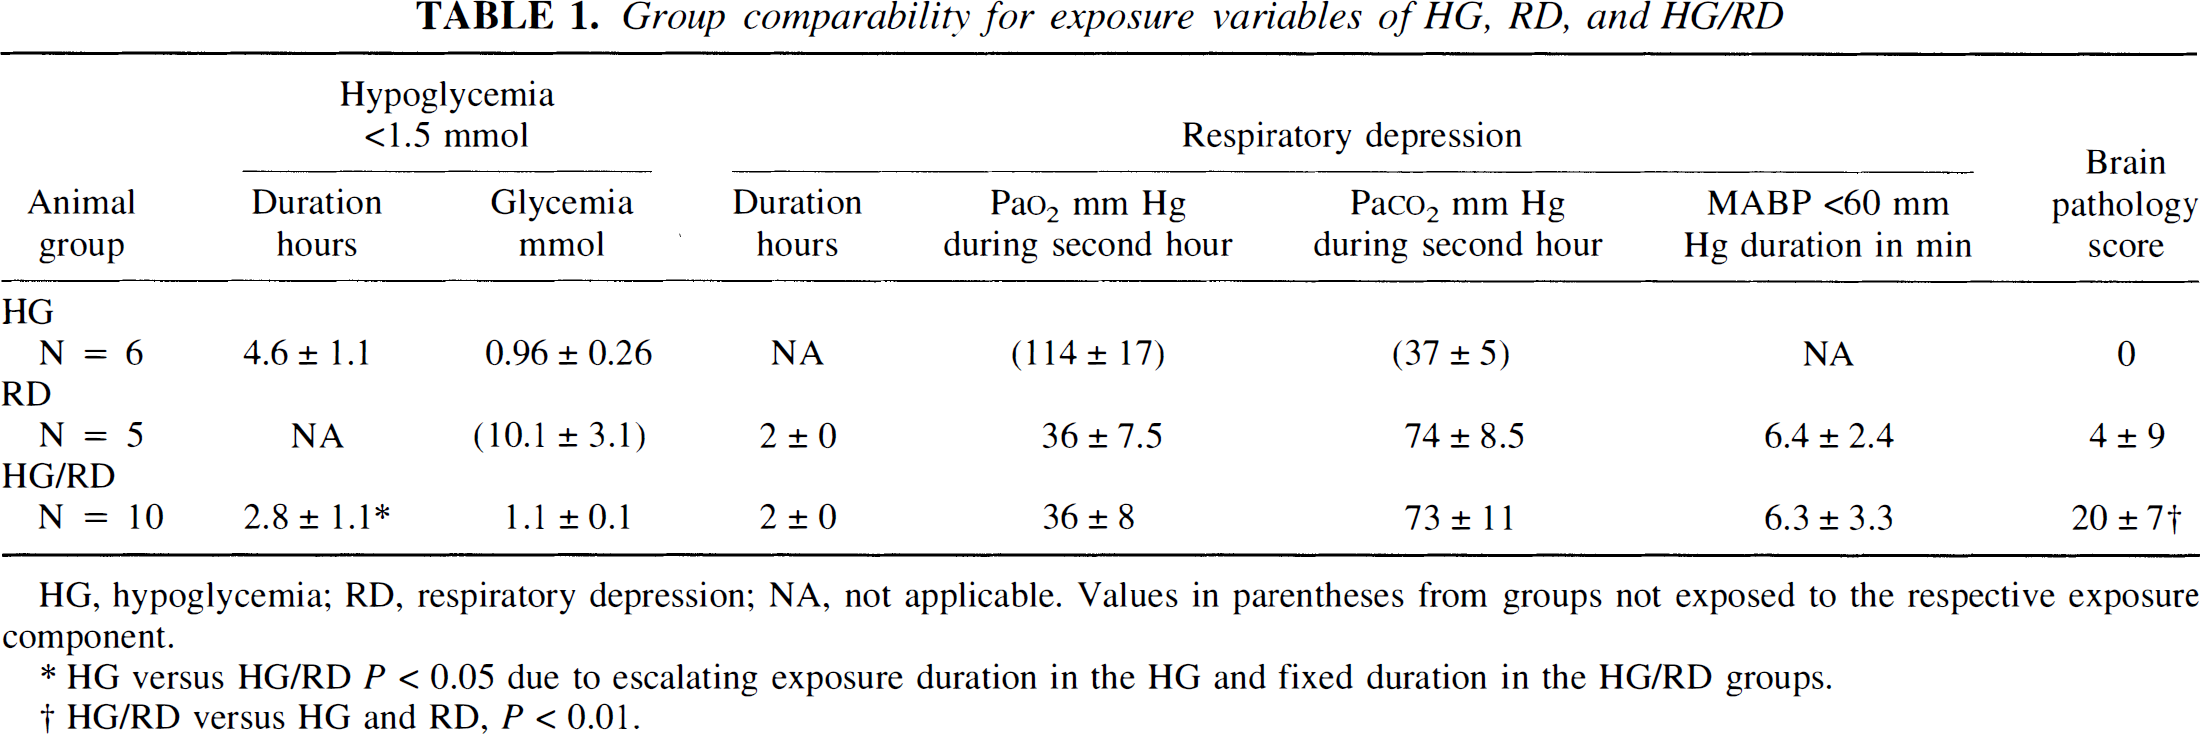
HG, hypoglycemia; RD, respiratory depression; NA, not applicable. Values in parentheses from groups not exposed to the respective exposure component.
HG versus HG/RD P < 0.05 due to escalating exposure duration in the HG and fixed duration in the HG/RD groups.
HG/RD versus HG and RD, P < 0.01.
Group comparability for exposure variables of HG/RD subgroups treated to euglycemia and hyperglycemia
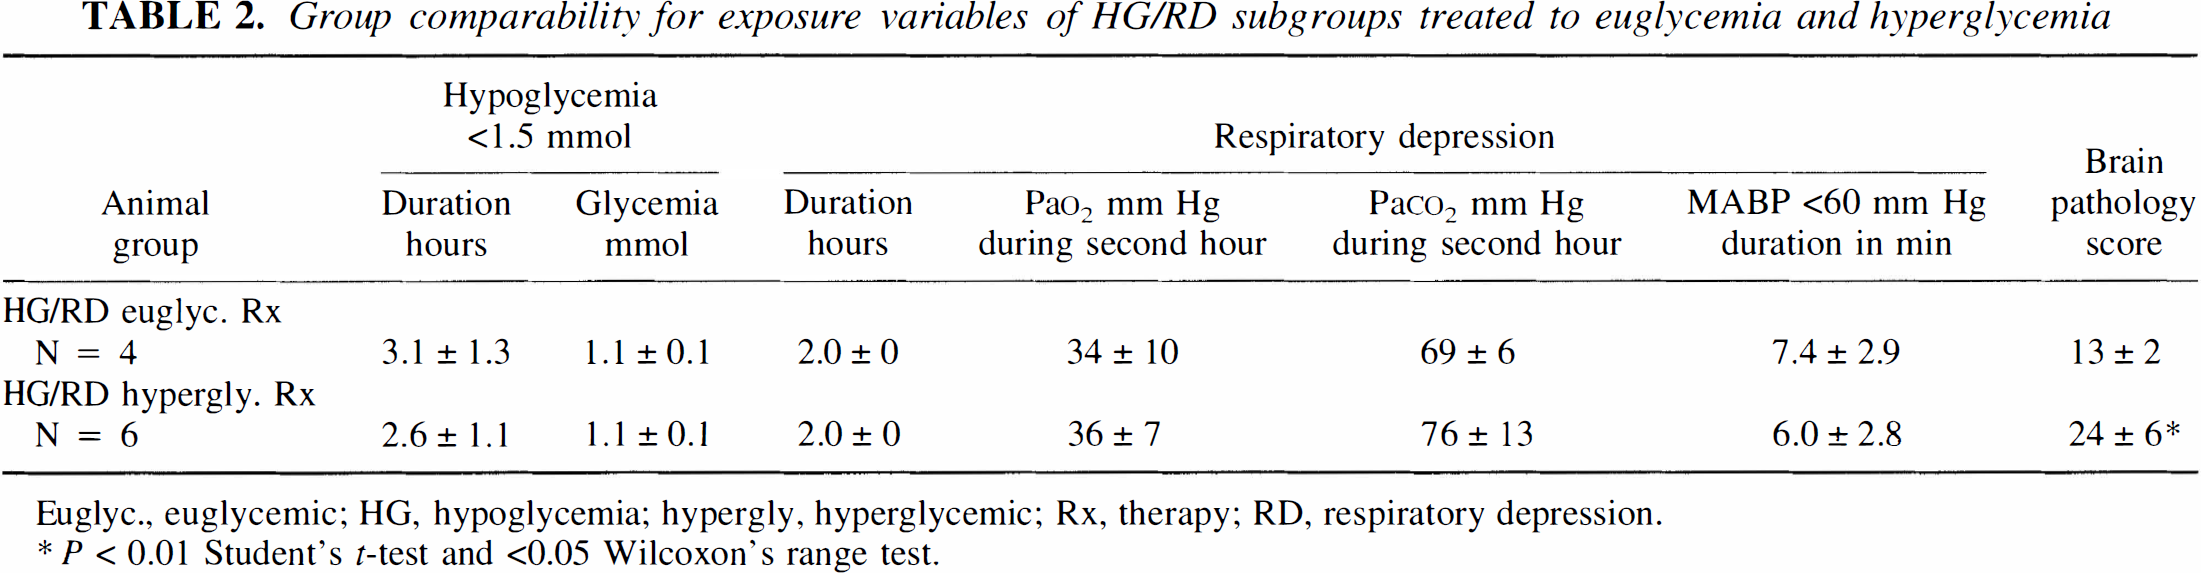
Euglyc., euglycemic; HG, hypoglycemia; hypergly, hyperglycemic; Rx, therapy; RD, respiratory depression.
P < 0.01 Student's t-test and <0.05 Wilcoxon's range test.
We deprived all cats of food for 2 days before their experimental exposure to facilitate the induction of marked hypoglycemia (Myers and Kahn, 1971) and to limit the hyperglycemic responses to asphyxia imposed during exposure to respiratory depression (de Courten-Myers et al., 1985). In normally fed cats, asphyxia-induced hyperglycemia may reach levels as high as 50 mmol (de Courten-Myers et al., 1985). Thus, the fasted cats exposed to respiratory depression alone developed serum glucose concentrations that averaged only 10.1 ± 3.1 mmol, indicating that this group's hyperglycemic response was significantly attenuated. Even so, they did not remain strictly euglycemic but became slightly hyperglycemic during asphyxia (Fig. 2). However, in spite of the fact that higher glycemia levels increase brain injury due to asphyxia (de Courten-Myers et al., 1985), four of five animals of this group remained brain-intact.
Among the animals exposed to hypoglycemic respiratory depression, the stress from asphyxia and hypotension elevated transitorily the serum glucose concentrations, necessitating the administration of additional insulin. Despite the additional insulin, the cats exposed to hypoglycemic respiratory depression exhibited significantly higher serum glucose concentrations during the exposure than did the cats exposed to hypoglycemia alone (2.3 ± 1.6 vs. 1.0 ± 0.3 mmol; P < 0.05, respectively). Therefore, the brain injury in all 10 HG/RD animals occurred in a setting of moderate hypoglycemia, whereas the intact brains of the cats exposed to hypoglycemia alone were seen despite their more marked and prolonged hypoglycemia (Fig. 2). The cats exposed to hypoglycemic respiratory depression and subsequently treated to eu- or hyperglycemia showed similar levels of serum glucose concentrations during hypoglycemic respiratory depression exposure (2.0 ± 1.6 vs. 2.5 ± 1.9 mmol, respectively). Treating the hypoglycemia of the cats of these two treatment subgroups with infusates differing in glucose content but similar osmolality produced significantly different glycemia levels of 22.7 ± 1.8 and 8.7 ± 0.8 mmol in the hyper- and euglycemic groups, respectively (Fig. 2).
The animals regularly developed seizure activity during exposure to marked hypoglycemia whether or not they were additionally exposed to respiratory depression. In contrast, the animals exposed to respiratory depression alone, without hypoglycemia, failed to show seizures. Seizures, usually recurrent, were identified in nonparalyzed animals by episodes of tonic-clonic movements accompanied by spike and wave activity in their EEG and transient increases in mean arterial blood pressure. The occurrence of the seizures regularly prevented sustained periods of isoelectric EEG, as whenever a cat's EEG attenuated, it would develop seizures that in turn would cause a transitory increase in the serum glucose concentration and a resumption of cerebral electrical activity.
The occurrence of seizures failed to correlate with development of brain injury because >80% of cats developed hypoglycemic seizures when exposed either to hypoglycemia alone (remaining brain intact) or to hypoglycemic respiratory depression causing brain damage. Whether the extent of brain injury correlates with seizure frequency could not be determined from the present study because the number of animals with EEG recordings was too small in the two treatment HG/RD subgroups. The EEGs were not recorded in animals undergoing MR studies because EEG electrodes, even when nonferrous, interfere with the homogeneity of the magnetic fields.
Diffusion-weighted magnetic resonance imaging
Three of the six cats exposed to hypoglycemia, all of which maintained a normal cardiovascular performance and a normal range of respiratory gas values, were followed with sequential DWI studies. In all three, the ADCs remained stable throughout the period of observation, which included the control period and the period of exposure to prolonged marked hypoglycemia, as is illustrated in Fig. 3. Three cats studied in the HG/RD group during the control period and during hypoglycemia showed stable ADCs. When the asphyxial state was added, the brain ADCs invariably increased (Fig. 3).
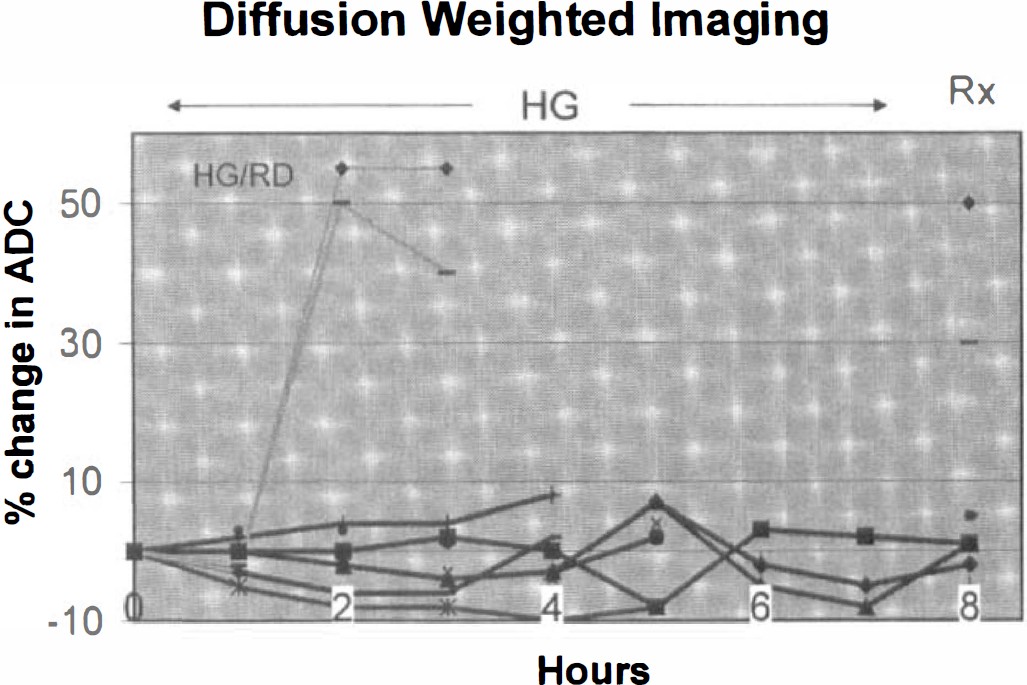
Diffusion-weighted imaging performed sequentially in four cats before, during, and after exposure to marked hypoglycemia (HG group) or combined exposure to hypoglycemia and respiratory depression (HG/RD group). The apparent diffusion coefficient (ADC) was normalized to standard and expressed as a percent change from the control period in up to three regions of interest. The ADC values remained stable (within ± 8%) throughout hypoglycemic exposure, with stable vital signs for up to 7 hours, but increased by ~50% when respiratory depression was added (line and diamonds). A decline in ADC indicative of brain energy failure was not observed. Glucose treatment (Rx) induced little further change in ADC values. All HG but none of HG/RD animals remained brain-intact.
Brain pathology
The brain pathologic findings of the cats exposed to hypoglycemia, respiratory depression, and hypoglycemic respiratory depression with their subgroups treated to eu-and hyperglycemia, respectively, are summarized and illustrated in Tables 1 and 2 and Figs. 1 and 4. All six cats exposed to marked hypoglycemia alone with cardiovascular and respiratory functions maintained essentially unchanged despite hypoglycemic exposure periods lasting as long as 6.6 hours showed no pathologic changes on brain examination (all six showed a brain pathology score of 0). Only one of the five cats exposed to respiratory depression alone showed damage to its brain (with a pathology score of 20 points). The remaining four cats remained brain-intact, leading to a mean ± SD pathology score of 4 ± 9 for the RD group as a whole. In contrast, all 10 cats exposed to hypoglycemic respiratory depression (3 hours of marked hypoglycemia, the last 2 hours also with respiratory depression) developed significant brain damage (P < 0.005, rate of injury in HG/RD vs. HG and RD groups). The pathology scores of the 10 HG/RD cats ranged from 11 to 30 points (group mean ± SD = 20 ± 7). Figure 4 depicts the individual pathology scores from the animals of the three groups: The HG and the RD groups differ significantly from the HG/RD group but not from each other.
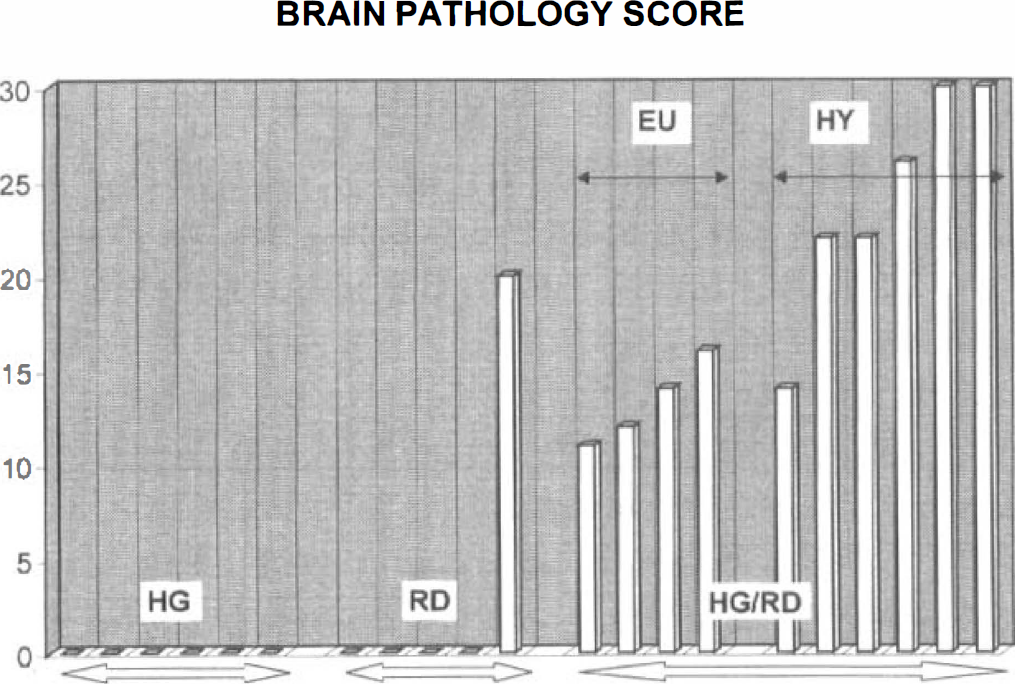
Brain pathology scores of cats exposed to hypoglycemia alone (HG group), to euglycemic respiratory depression (RD group), and to combined HG/RD (with their two treatment subgroups). All cats exposed to prolonged hypoglycemia where the cardiorespiratory functions were maintained unchanged (HG group) remained brain-intact. Exposure of cats to euglycemic respiratory depression caused only one in five cats to develop brain injury. In contrast to the low brain injury rates among the HG and RD groups, cats exposed to combined hypoglycemia plus respiratory depression (HG/RD) all showed brain damage (10/10). Of the cats in the HG/RD group, those treated to euglycemia showed significantly less extensive brain damage than did their peers treated to marked hyperglycemic overshoots.
The present hypoglycemic brain injury model in cats reproduces well the brain anomalies of human hypoglycemic encephalopathy with neuronal damage to cerebral cortex, hippocampus, and basal ganglia (Kalimo and Olsson, 1980; Auer et al., 1989). We observed three patterns of injury: widespread activation of microglia, a characteristic feature of hypoglycemic injury (Myers and Kahn, 1971); selective neuronal necrosis of the cerebral cortex, hippocampus, and basal ganglia (especially caudate nucleus); and laminar cerebral cortical necrosis. These three patterns of brain injury are illustrated in Fig. 1.
Microglial activation was observed in all 10 HG/RD brains, representing the only type of injury in 1 cat. Activation of microglia was observed in brain regions that also showed loss of neurons, namely, cerebral cortex, hippocampus, and basal ganglia. The process, though, extended far beyond these regions to also affect the thalamus and brainstem nuclei lacking neuronal soma injury. Activated microglial cells frequently were oriented along neurites, suggesting they were appearing in response to damage to neuronal processes. The cerebellum was consistently spared from recognizable damage.
Selective neuronal necrosis was observed in 9 of the 10 damaged HG/RD brains, whereas laminar cortical necrosis was segregated to 5 of the 6 cats in the subgroup treated to hyperglycemia (and was also present in the 1 brain-damaged euglycemic RD exposure cat). Thus, the cats exposed to hypoglycemic respiratory depression and treated to euglycemia failed to develop laminar cortical necrosis, accounting for much of the difference in pathology scores observed between the two treatment groups (shown below). Selective neuronal and laminar cortical necrosis elicited reactive astrocytic gliosis and isolated microglial activation did not, as was demonstrated by immunoreactivity for glial fibrillary acidic protein in the affected regions. Laminar cortical necrosis affected preferentially the superolateral convexity cerebral cortex, whereas selective neuronal necrosis was found also medially along the sagittal fissure, the CA1 segment of the hippocampus, the subiculum, and the caudate nucleus. Though overall there were strong similarities, minor differences emerged in the distribution pattern of hypoglycemic brain injury in rats (Auer et al., 1984) compared with the present study in cats. The strong preference to damage layer II neurons seen after hypoglycemic exposures in rats was less striking in this study, there was no involvement of the dentate gyrus of the hippocampus, and the preferential damage to regions of the caudate nucleus near the ventricle was not apparent.
Treating the cats exposed to hyperglycemic respiratory depression to hyper- and euglycemia, using osmotically balanced solutions, led to significantly higher treatment glycemia levels in the six hyper- than in the four euglycemia animals: 22.5 ± 1.7 vs. 8.7 ± 0.8 mmol; P < 0.01. The cats exposed to hyperglycemic respiratory depression and treated to hyper- or euglycemia also differed significantly in their pathology scores: 24 ± 6 vs. 13 ± 2 points; P < 0.005, Student's t- test; P < 0.05, Wilcoxon's rank test.
DISCUSSION
The present study demonstrates five main findings: (1) Cats exposed to marked and prolonged hypoglycemia with preserved cardiorespiratory functions remained brain-intact. (2) Eighty percent of cats exposed to euglycemic respiratory depression remained brain-intact. (3) In contrast, combined exposure to hypoglycemia and respiratory depression (elevated Paco2 and decreased Po2 values) caused brain damage in all 10 cats, even though the severity of the hypoglycemia was less than in the HG group. (4) Cats exposed to hypoglycemia and to hypoglycemic respiratory depression showed no evidence of brain energy failure. (5) Cats exposed to combined hypoglycemic respiratory depression treated to hyper-compared with euglycemia showed substantially greater brain injury.
Cats exposed to marked hypoglycemia alone with maintained cardiorespiratory status showed stable brain ADCs. This stability of the brain ADC suggests the brain maintained its energy state despite a severe and prolonged hypoglycemia. All of these cats also failed to show brain damage. Thus, cat exposure to marked hypoglycemia for prolonged periods is not necessarily associated either with brain energy failure or with brain damage, provided the animals do not experience a significant respiratory depression. This result contrasts with the ADC findings of Hasegawa et al. (1996), using a rat hypoglycemic model. Auer et al. (1984) and Auer and Siesjö (1993) have identified cerebral energy failure to accompany a flat EEG and reliable brain injury in the same rat hypoglycemia model even though cardiorespiratory functions are fully maintained.
This difference in the brain pathologic consequences of insulin-induced hypoglycemia of comparable severity in the cat and rat is perplexing. Given the difference in brain energy state in the two models, reasons may include differences in body/brain size ratios that may imply greater stores of alternative energy sources available during hypoglycemia in larger mammals; also, the greater metabolic rate of rats than cats may lead more readily to a depletion of brain energy in the rat. A compelling reason for the two model's opposite brain pathologic outcomes may be the protective effects of prolonged fasting before the study, which provided ketone bodies serving as an alternative fuel for the hypoglycemic cat brain (Senior and Sadeghi-Nejad, 1989). During prolonged fasting, as was used in the present study to facilitate the induction of insulin hypoglycemia, free fatty acids replace glucose as the main fuel of the body while the brain remains the major consumer of glucose. However, the brain energy needs then are supplemented by ketones, a glucose-sparing fuel (Senior and Sadeghi-Nejad, 1989). Thus, it appears likely the brain energy state may have been preserved and brain damage averted during the prolonged severe hypoglycemia through the availability of ketones. A similar protection may take place in humans suffering marked hypoglycemia as fasting is a frequent predisposing factor for development of hypoglycemic reactions in type 1 diabetes (Mortensen and Hougaard, 1997) and in drug-induced hypoglycemia (Seltzer, 1989).
Lewis et al. (1974) showed that glucose concentrations in blood, cerebrospinal fluid, and brain tissue correlate tightly until below 3 mmol blood glucose levels when calculated intracellular glucose concentrations become depleted, accompanied by reductions in glycogen, glucose-6-phosphate, lactate, and citric cycle intermediates followed by declines in alanine, β-aminobutyric acid, glutamine, and glutamate. Similarly, Silver and Erecinska (1994) demonstrated that brain extracellular glucose concentrations parallel those of serum during hypo- and hyperglycemia and are similar to whole-brain glucose concentrations. This suggests that no major gradients for glucose exist across brain cell membranes. During hypoglycemia, the brain glucose content declines, reflecting the high Km of the two main glucose transporters (GLUT-1 at the blood-brain barrier and GLUT-3 at the cell membrane) (Lund-Andersen, 1979; Gould et al., 1991). Because the velocity of glucose influx into brain exceeds that of its phosphorylation, intracellular glucose concentrations remain constant until the serum glucose concentration declines below 2.5 mmol (Pellegrino et al., 1990). At that point, compensatory physiologic mechanisms operate to increase cerebral blood flow and enhance glucose transport (Abdul-Rahman et al., 1980; Cilluffo et al., 1982). Because pentobarbital inhibits the activity of the GLUT-1 carrier in cultured cerebral capillaries (Honkanen et al., 1995), the present study's use of pentobarbital anesthesia would have predicted a greater, not a lesser, vulnerability to hypoglycemia. The brain-protective properties of barbiturates, mediated in part through reduced metabolic rates, seem not to have contributed substantially to the HG cat exposure's failure to cause brain injury because the same anesthetic regimen applied equally to the brain-injured HG/RD animals.
In the present study, the addition of respiratory depression during hypoglycemia greatly increased the brain injury rate from 0% in HG exposures and 20% in euglycemic RD exposures to a full 100%. This large increase suggests potentiation of brain damage from the combined exposure. Though the mechanisms responsible for this effect are not fully elucidated, the following studies relate to this finding.
Hypoxia induced by respiring animals with 3% O2 decreases brain extracellular glucose concentration by ~80% despite increases in blood glucose concentration indicating an increased brain glucose utilization and/or decreased glucose transport (Lund-Anderson, 1979). Thus, superimposing a respiratory depression on a marked hypoglycemia may further reduce the availability of brain tissue glucose. Nonetheless, brain energy failure seems still not to have ensued as the brain ADCs increased rather than decreased, the change associated with energy failure (Hossmann et al., 1994; Hasegawa et al., 1996). Though preliminary, repeated assessment of brain energy state with 31P MR spectroscopy during HG/ RD exposures confirmed the preservation of brain ATP levels (unpublished data) that contrasts with similar studies of hypoglycemic rat brains with isoelectric EEGs showing loss of high-energy phosphates (Behar et al., 1985). Even so, because the DWI and MR spectroscopy methods average relatively large brain regions, it is possible that focal brain regions' energy failure or milder degrees may not have been detectable.
Of interest are also in vitro studies of combined hypoxia and hypoglycemia that provoke far greater increases in intracellular Ca2+ than does exposure to either condition by itself (Bachelard et al., 1993). Furthermore, the release of excitatory amino acid neurotransmitters during exposure to hypoglycemia combined with hypoxia/ ischemia accentuates calcium influx into cells (Olney, 1994). As excessive calcium influx into brain cells is recognized as a critical step in the initiation of cell death (Choi, 1988; Siesjö, 1991; Siesjö and Bengtsson, 1989), this finding may help explain how exposure to hypoglycemic respiratory depression can enhance brain injury. The prominent microglial activation we observed in the brains of all cats exposed to hypoglycemic respiratory depression supports an excitatory amino acid type of injury because microglial activation suggests specific injury to neuronal processes (Moffett and Paden, 1994) and resembles the axon-sparing dendritic lesions observed after energy depletion-induced hypoglycemic injury in rats (Auer and Siesjö, 1993).
The present HG/RD model in cats enhances the comparability with important aspects of human hypoglycemia. Thus, the markedly hypoglycemic cat regularly shows seizures, a clinically prominent symptom of severe hypoglycemia in juvenile type 1 diabetes (Davis et al., 1997). Maybe due to the development of energy failure, hypoglycemic rats fail to show seizures. Also, prolonged fasting, as used in this model, is a common predisposing factor leading to symptomatic hypoglycemia in insulin-treated diabetes and for drug-induced coma (Seltzer, 1989; Davis et al., 1997).
The HG and HG/RD models in the cat may provide a better understanding of hypoglycemia-related clinical findings. Thus, the lack of brain injury in cats exposed to marked hypoglycemia parallels the low (2%) incidence of brain damage in patients with drug-induced hypoglycemic coma even though the neuroglycopenia is sufficient to impair brain function in both (Seltzer, 1989). The result that hypoglycemia, even of moderate severity, acts synergistically with respiratory depression to produce a high yield of brain injury may relate to the clinical observation that hypoglycemic coma can be associated with breathing abnormalities, seizures, and ultimately respiratory arrest, especially in young children (Lamminpaa and Vilska, 1990; Johnston et al., 1997). Thus, in a subset of patients experiencing hypoglycemic coma, the setting for combined exposure to hypoglycemic respiratory depression may be realized, leading to brain damage. Given the life-threatening nature of hypoglycemia and of respiratory impairments, death, though, may be more common than survival with brain injury. Importantly, infants sustain brain damage from exposures to moderately reduced glycemia levels (Lucas et al., 1988), levels insufficient to damage the brain in other hypoglycemia models (Myers and Kahn, 1971; Auer et al., 1984). Lucas et al. (1988) found that newborns with birth weights of < 1,850 g exhibited a 3.5-fold higher incidence of retarded mental development if they experienced ≥5 days of moderate reductions in plasma glucose concentrations (<2.6 mmol). Frequent hypoglycemic episodes were more injurious than more marked but less frequent episodes. Similarly, children with early-onset diabetes prone to develop frequent hypoglycemic episodes also experience increased rates of intellectual deficits (Rovet et al., 1987; Bergada et al., 1989). Because this age group is also prone to develop respiratory distress, a more frequent coexistence of respiratory problems and hypoglycemia leading to hypoglycemic respiratory depression-equivalent exposures may underlie their increased prevalence of impaired brain development.
In this study, treating hypoglycemia associated with respiratory depression to hyperglycemia led to more severe damage to the brain than its treatment to euglycemia. The mechanisms accounting for this effect remain unclear. We have ruled out lactic acid accumulation to damaging levels during treatment by brain 1H MR spectroscopy (de Courten-Myers et al., 1997). Mannitol, added to the infusate to equilibrate the osmolality of the treating low- and high-glucose solutions, might have reduced the brain injury in the animals treated to euglycemia by osmotically reducing the brain edema produced. However, because the infusion lasted only 10 minutes, this effect would have been short-lived and not likely to explain alone the large outcome difference observed between the two groups. A stronger influence may be expected from the hyperglycemia-induced increase in brain glucose concentrations that normalizes more slowly than the serum glucose concentrations (Wass and Lanier, 1996). The associated osmotic gradient tends to aggravate any brain edema present and thereby enhance the brain damage induced by the hypoglycemic respiratory depression. Whatever the mechanism, the observed adverse effect of treating marked hypoglycemia complicated by respiratory depression to hyper- rather than euglycemia suggests that the evolving brain damage can be influenced by the mode of treating hypoglycemia. As the treatment phase is under clinical control, avoiding treatment-induced hyperglycemic overshoots may minimize hypoglycemic brain injury. The goal of maintaining a normal serum glucose concentration during treatment already accords with the recommendation for treating ischemic brain injury (Wass and Lanier, 1996).
Footnotes
Acknowledgments
The authors thank Dr. Maximilian de Courten (International Diabetes Institute, Caulfield, Australia), for insightful comments and Dr. W. Swanson (Head, Animal Conservation Division, Cincinnati Zoo and Botanical Garden, Cincinnati, OH, U.S.A.) for support. Dr. Ya Hua provided valuable technical assistance.