
Abstract
A reduction in the apparent diffusion coefficient (ADC) of water measured by magnetic resonance imaging (MRI) has been shown to occur early after cerebrovascular occlusion. This change may be a useful indicator of brain tissue adversely affected by inadequate blood supply. The objective of this study was to test the hypothesis that loss of membrane ion homeostasis and depolarization can occur simultaneously with the drop in ADC. Also investigated was whether elevation of extracellular glutamate ([GLU]e) would occur before ADC changes. High-speed MRI of the trace of the diffusion tensor (15-second time resolution) was combined with simultaneous recording of the extracellular direct current (DC) potential and on-line [GLU]e from the striatum of the anesthetized rat. After a control period, data were acquired during remote middle cerebral artery occlusion for 60 minutes, followed by 30 minutes of reperfusion, and cardiac arrest-induced global ischemia. After either focal or global ischemia, the ADC was reduced by 10 to 25% before anoxic depolarization occurred. After either insult, the time for half the maximum change in ADC was significantly shorter than the corresponding DC potential parameter (P < 0.05). The [GLU]e remained at low levels during the entire period of varying ADC and DC potential and did not peak until much later after either ischemic insult. This study demonstrates that ADC changes can occur before membrane depolarization and that high [GLU]e has no involvement in the early rapid ADC decrease.
Diffusion-weighted magnetic resonance imaging (MRI) has become a valuable tool with which to investigate pathological events in the brain early after an ischemic insult both in experimental models (van Bruggen et al., 1994) and clinically (Baird and Warach, 1998). However, uncertainty remains concerning the precise biophysical mechanisms underlying the rapid decrease in apparent diffusion coefficient (ADC) of water after cerebral ischemia. It is widely believed that cell swelling due to water influx associated with anoxic depolarization, that is, disruption of transmembrane ionic gradients, is a key event. The proportion of water in the intracellular compartment increases as a result of cell swelling, and this would lead to an overall decrease in ADC if the extracellular diffusion were more rapid. Alternatively, cell swelling and contraction of the extracellular space could increase tortuosity in that compartment, also leading to a decrease in ADC. There is a body of evidence that tends to support this hypothesis, in that depolarizing events in vivo, such as energy failure (Busza et al., 1992), inhibition of membrane ion pumps (Benveniste et al., 1992; Mintorovitch et al., 1994), epileptic seizures (Zhong et al., 1993), activation of glutamatergic ion channels (Dijkhuizen et al., 1996), and spreading depression (De Crespigny et al., 1998; Latour et al., 1994), as well as osmotically driven cell swelling in model systems (Anderson et al., 1996; O'Shea et al., 1995) are all associated with a decrease in ADC in brain tissue. Nevertheless, the recent demonstration that the ADC of intracellular metabolites such as N-acetylaspartate, creatine, and phosphocreatine is also reduced after ischemia (van der Toorn et al., 1996a; Wich et al., 1995) suggests that other mechanisms restricted to the cytosol may also contribute to the ADC decrease. Furthermore, although strategies to preserve ATP following ischemia, such as hyperglycemia and hypothermia, have been shown to delay the onset of ADC decrease (Williams et al., 1995), it has recently been suggested that hyperglycemia delays membrane depolarization significantly more than it delays reduction in ADC (Huang et al., 1997, 1998). In an attempt to resolve these uncertainties, we set out to test the hypothesis that loss of membrane ion homeostasis, as indicated by the onset of anoxic depolarization, occurs simultaneously with the drop in water ADC.
Another feature common to many of the interventions that lead to a reduction in water ADC in vivo is an increase in extracellular glutamate ([GLU]e). In principle, and as proposed by some investigators (Benveniste et al., 1992), an increase in [GLU]e could contribute to ADC changes by allowing water influx through activation of ionotropic glutamate receptors. Although existing data have suggested that high [GLU]e is not necessary to support anoxic depolarization or to elicit spreading depression (Obrenovitch and Zilkha, 1995; Obrenovitch et al., 1996, 1998), the possibility remains that water influx and the ADC change may be associated with activation of glutamate-dependent ion channels. We therefore tested a secondary hypothesis: that elevation of [GLU]e to levels sufficient to cause opening of ion channels would occur before significant ADC changes.
Our experimental strategy was to combine high-speed MR measurements of the trace of the diffusion tensor together with simultaneous recording of the extracellular direct current (DC) potential and glutamate in a rat model of cerebral ischemia. Measurements were carried out during focal ischemia, reperfusion, and complete (global) ischemia produced by cardiac arrest.
MATERIALS AND METHODS
Surgery
Male Wistar rats (Harlan-Olac, Bicester, U.K.) weighing 285 ± 9.0 g were initially anesthetized with 3% halothane vaporized in O2. The animal was secured in a purpose-built cradle incorporating a mouth piece and ear bars to minimize movement artifacts. Subsequent surgical anesthesia with spontaneous respiration was maintained with 1.5% halothane through a nose cone built into the cradle. Intraluminal occlusion of the middle cerebral artery was accomplished using a modification of the Longa technique (Longa et al., 1989; Roussel et al., 1994). In brief, the right common carotid artery was permanently ligated and cannulated with an embolus consisting of a molded silicone rubber tip, 2 mm long and 250 to 300 μm in diameter and attached to a 150-μm-diameter nylon thread. The embolus tip was advanced anteriorly along the internal carotid artery until it lay at the entrance to the tympanic bulla. The embolus tail was attached to a purpose-built probe to allow further advancement of the embolus tip remotely from outside of the magnet. Initiation of middle cerebral artery occlusion consisted of advancing the embolus tip 10 mm from the tympanic bulla so that it lay opposite the middle cerebral/internal carotid artery junction. The right femoral vein was cannulated for introduction of a 2.5-mL air embolus to induce cardiac arrest.
A midline longitudinal skin incision was made in the scalp, and the skull was thinned over the right parietal bone using a dental drill under constant saline superfusion. A small craniectomy was made using a sharp scalpel blade to remove thinned bone fragments. The animal was secured in a rodent stereotaxic frame, and a concentric microdialysis probe incorporating a DC potential electrode (Applied Neurosciences, London, U.K.) was implanted in the right dorsolateral striatum at coordinates 0.8 mm anterior to bregma, 3 mm lateral, and 6 mm below the pia (Paxinos and Watson, 1982). This brain region is maximally affected by this model of ischemia (Harris et al., 1997; Roussel et al., 1994) and thus can be regarded as the ischemic core. After placement of the animal in the magnet and throughout the experiment, anesthesia was maintained with 0.8% halothane vaporized in N2O and O2 flowing at 0.8 and 0.4 L/min, respectively. As we have previously found in a separate series of experiments that this level of anesthesia does not alter blood gases or plasma glucose concentration after focal ischemia (N. G. Harris et al., unpublished observations), blood chemistry measurements were not performed. The rate and depth of ventilation, electrocardiogram, and rectal temperature were monitored and kept within the normal range by small adjustments of the anesthesia and air-heating device, respectively.
DC potential recording
The DC potential was recorded from a chlorided silver wire electrode incorporated into the microdialysis probe in the brain and a reference electrode placed subcutaneously at the neck. The DC potential electrode was incorporated within the upper part of the inlet connector (0.6-mm o.d.) so that the implanted part (0.22-mm o.d.) acted as a conventional glass capillary electrode. The absence of any metal within the parenchyma resulted in only minimal susceptibility effects on the MR images. The signal was passed through the MR spectrometer shielding via a filter that prevented radiofrequency interference with the MR signal. After sufficient signal amplification (Neurolog Amplifer System; Digitimer, Welwyn, Garden City, U.K.), the DC potential signal was output to an IBM-compatible computer via an analog-to-digital converter card, displayed real-time with software written in ASYST (Keithley Asyst, Reading, U.K.) and stored directly to the hard disk with a 4-second temporal resolution.
Microdialysis
Enzyme amperometric analysis was used to detect changes in the extracellular concentration of glutamate with a sampling frequency of 4 seconds and a time resolution of 30 seconds (Zilkha et al., 1995; see also Discussion). A biosensor containing glutamate oxidase and associated electrochemical systems required for glutamate detection was positioned on the animal cradle adjacent to the head to minimize the dead volume before glutamate assay. A concentric microdialysis probe was perfused with artificial cerebrospinal fluid at 1 μL/min with a microinjection pump (CMA/Microdialysis, Stockholm, Sweden). The artificial cerebrospinal fluid composition was as follows (in mmol/L): NaCl 125, KCl 2.5, MgCl2 1.18, CaCl2 1.26 (pH adjusted to 7.3 with NaOH, unbuffered). The dialysate was directed to the biosensor from which the electrochemical detection of glutamate resulted in a current that was displayed and recorded on a computer as described for the DC potential. Dialysate glutamate concentration was referred to as extracellular glutamate, [GLU]e.
Imaging protocol
The MRI was performed on a 2.35 T horizontal-bore magnet interfaced to an SMIS console (Surrey Medical Imaging Systems, Guilford, U.K.). Radiofrequency pulses were delivered through a whole-body transmitter coil, and the induced signal was received via a single-turn, 25-mm-diameter surface coil placed over the head. The two coils were passively decoupled using the methods of Styles (1988) and Bendall et al. (1986). Tetrahedral diffusion-encoding gradients (Conturo et al., 1996) were used to make optimum use of the available gradient strength (40 mT/m). This provided a 30% increase in signal-to-noise ratio and a 16% increase in contrast-to-noise ratio between the lesion and the contralateral side when compared with using conventional orthogonally oriented gradients (Harris et al., 1997). The tetrahedral gradient pattern was incorporated into a spin echo, echo planar imaging sequence with the following parameters: echo time = 72 ms, repetition time = 1,500 ms, field of view = 40 mm, 128 × 64 data matrix, two averages per image, three slices (2.1 mm) centered around the microdialysis probe, Δ = 30 ms, δ = 16 ms, and b =0 and 916 s/mm2. Five images were required to calculate the trace of the diffusion tensor (Conturo et al., 1996), enabling the ADC to be measured every 15 seconds.
Experimental protocol
Baseline imaging and physiological data were acquired after at least 2 hours had elapsed after surgery to confirm that all parameters lay within the normal range. The MR, DC potential, and microdialysis parameters were recorded for 30 minutes during and after each of three different experimental paradigms performed sequentially on each rat: remote MCA occlusion for 60 minutes, reperfusion for 30 minutes, and global ischemia. A further group was subjected to global ischemia only to control for any effect that the initial focal insult had on the time course data during the subsequent global insult.
Image analysis
Data were Fourier-transformed and zero-filled to a data matrix of 128 × 128 in the SMIS image format. The image slice containing the tip of the microdialysis probe was identified on the b =0 (non-diffusion-weighted) image from the signal void generated by the magnetic susceptibility effect of the microdialysis probe. The images were then transformed to unformatted, byte-swapped images for postprocessing on a Sun workstation. The activation of large diffusion gradients simultaneously in the tetrahedral sequence together with the use of echo planar imaging resulted in some minor eddy current distortions in the diffusion-weighted images. These distortions were manifested by minor image compression and shifting in the phase-encoding direction so that image registration was necessary. These artifacts were corrected using an algorithm and UNIX shell script routine (Symms et al., 1997) written to utilize the AIR 3.0 image registration software (Woods et al., 1992). Diffusion-weighted images acquired during each intervention were realigned to the initial b0 image acquired at the beginning of each data acquisition. Trace maps were calculated on a pixel-by-pixel basis using the equation
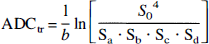
where ADCtr is the trace of the apparent diffusion tensor, b is the b value (916 s/mm2), S0 is the pixel intensity in the spin echo (b0) image, and Sk is the pixel intensity from the diffusion-weighted images. Maps were calculated using IDL software (Research Systems, Boulder, CO, U.S.A.) and displayed with Xdispimage (D. Plummer, University of London, London, U.K.). The trace ADC was calculated in a 1.5-mm2 region of interest immediately below the site of the microdialysis probe/ DC potential recording electrode in the striatum, in a region that did not show magnetic susceptibility effects.
Data analysis
DC potential and [GLU]e data were time-averaged to match the 15-second time resolution of the ADC data. The DC and ADC data were temporally aligned in Excel spreadsheets using the occlusion time as a marker. As it was not possible to accurately synchronize the glutamate with the ADC and DC potential data because of the necessary dead space within the system, the initial rise in [GLU]e was aligned to the occurrence of the first anoxic depolarization on the basis of previous studies (Obrenovitch, 1996; Wahl et al., 1994; see also Discussion).
Plots for each of the parameters measured were constructed and combined for each of the three experimental paradigms. The following measurements were made to characterize the ADC and DC potential responses: pre- and postevent means during a stable part of the recording; t50, the time to reach 50% of the difference between the pre- and postevent means; and tmax, the time for the postevent data to lie within 2 SD of the postevent mean. No attempt was made to determine the ADC threshold corresponding to the onset of anoxic depolarization for each animal because the procedure was too sensitive to noise in the ADC measurements (i.e., whereas the onset of DC potential change can be timed quite precisely, a similar relative change in ADC would lie within the noise of the measurements). However, a general threshold was arrived at by combining data from all animals in a scatterplot of the time course data.
Statistical analysis
Values are presented as means ± SD. We tested the null hypothesis that within each experimental paradigm, the ADC and DC potential time courses were the same. We analyzed the time course parameters for a significant difference to do this. Data from the two global ischemia groups were tested for a significant difference and were pooled if they were found to be similar. Finally, we tested the hypothesis that the time courses were similar between the different ischemia protocols. For all data, the Kolmogorov-Smirnov (with Lillie for correction) and Levene median tests were used to describe the distribution of the data and to determine the equality of the variances, respectively. If there was no significant difference between the variances for all data (P > 0.05), the Student's t-test was used to test for a significant difference between the means. For data that were not normally distributed (P < 0.05), the Mann-Whitney rank sum test was used to determine any difference. Differences between the means were expressed at the probability levels of P < 0.05, 0.01, and 0.001.
RESULTS
Methodology
There were no obvious effects on the stability or reproducibility of the MR measurements caused by the DC potential/microdialysis setup. Within the immediate vicinity of the probe, there was some minor signal loss due to magnetic susceptibility effects, and this could be seen most clearly in the high signal-to-noise, non-diffusion-weighted images. However, this did not interfere with the ADC measurements from the region of interest, which was placed to avoid the susceptibility distortions (Fig. 1). The DC potential could not be measured while the imaging gradients were being switched, but the recording recovered rapidly enough so that stable measurements could be undertaken during the recovery period. There was a baseline offset in the amperometric glutamate recording as a result of placing the detection system within the bore of the magnet. In consequence, [GLU]e is expressed as a difference from control values. Focal ischemia data were acquired from 11 rats, of which 7 were successfully reperfused, although only 5 animals yielded data with sufficient signal-to-noise ratio for analysis. Global ischemia data were subsequently collected from six of the reperfused animals. Additional global ischemia data were acquired from four separate animals with no prior insult.
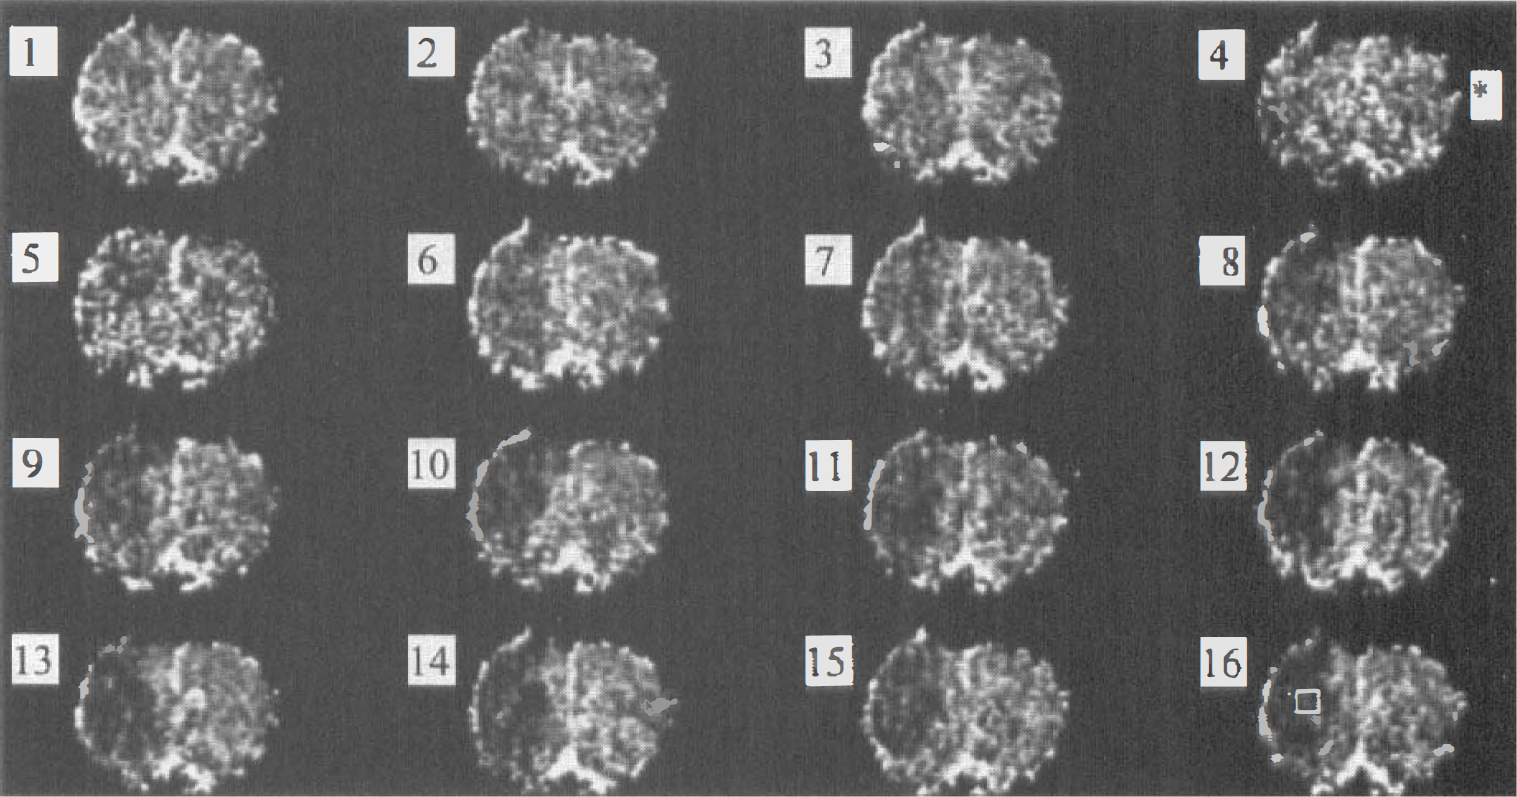
Single-slice, coronally oriented, diffusion-weighted trace images acquired with a 15-second time resolution. Images are contiguous, beginning at 1 minute before focal ischemia (image 1) to 3 minutes after (image 16). The asterisk denotes time of occlusion. The box on image 16 indicates the brain region from which the apparent diffusion coefficient (ADC) region-of-interest measurements were obtained. An area of reduced ADC is already present within 15 seconds after occlusion (left side of image 5).
Focal ischemia
Focal ischemia resulted in a 23 ± 2.4% reduction in the ADC (0.72 ± 0.055 to 0.56 ± 0.048 mm2/s), a negative deflection in the DC potential (−29 ± 2.4 mV), and a 3.5-fold increase in [GLU]e (Table 1; Fig. 2A). The time for half the maximum change in the ADC to occur (t50) was 74 ± 26 seconds, significantly shorter than the t50 for the DC potential (100 ± 15 seconds; P =0.011). Similarly, the time taken for the maximum change to occur (tmax) was over threefold greater for the DC potential than for the ADC (278 ± 120 and 87 ± 26 seconds, respectively; P < 0.001). Note that throughout the entire period of varying ADC and DC potential, the [GLU]e remained at relatively low levels (Fig. 2A).
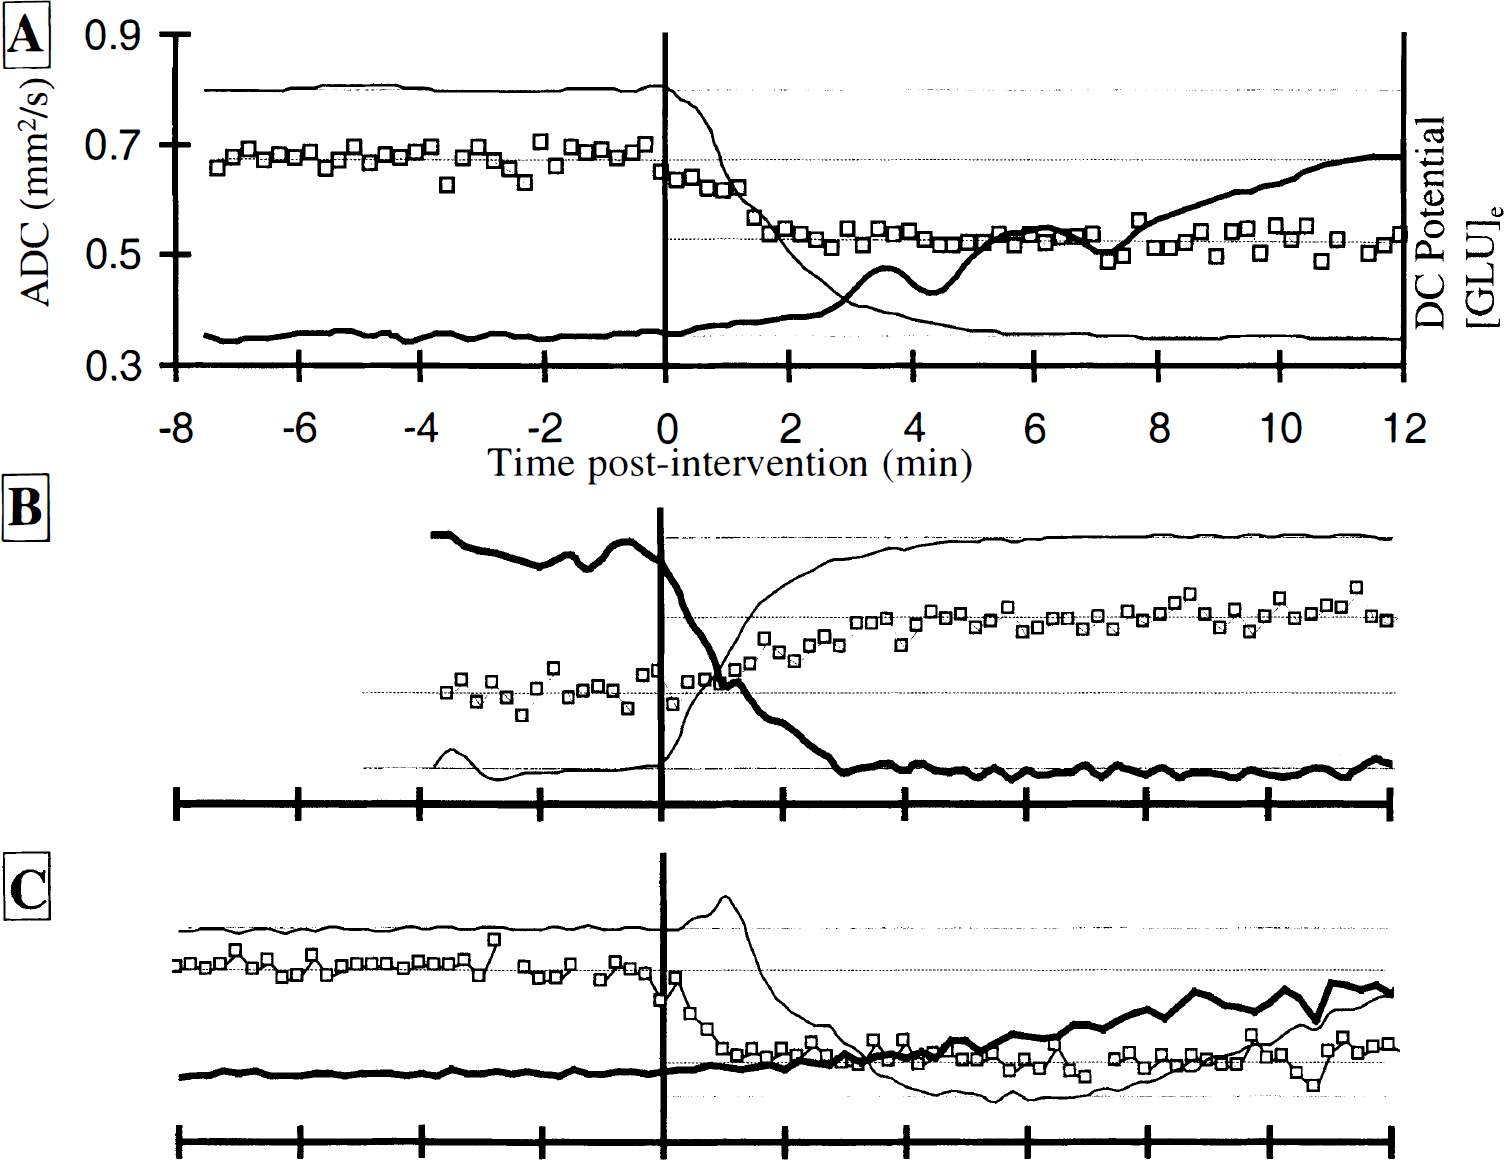
Typical time courses of the apparent diffusion coefficient (ADC; square symbols), direct current (DC) potential (light line), and glutamate dialysate concentration (dark line) during focal ischemia
Results of the ADC, DC potential and glutamate time-course analysis for all experimental groups
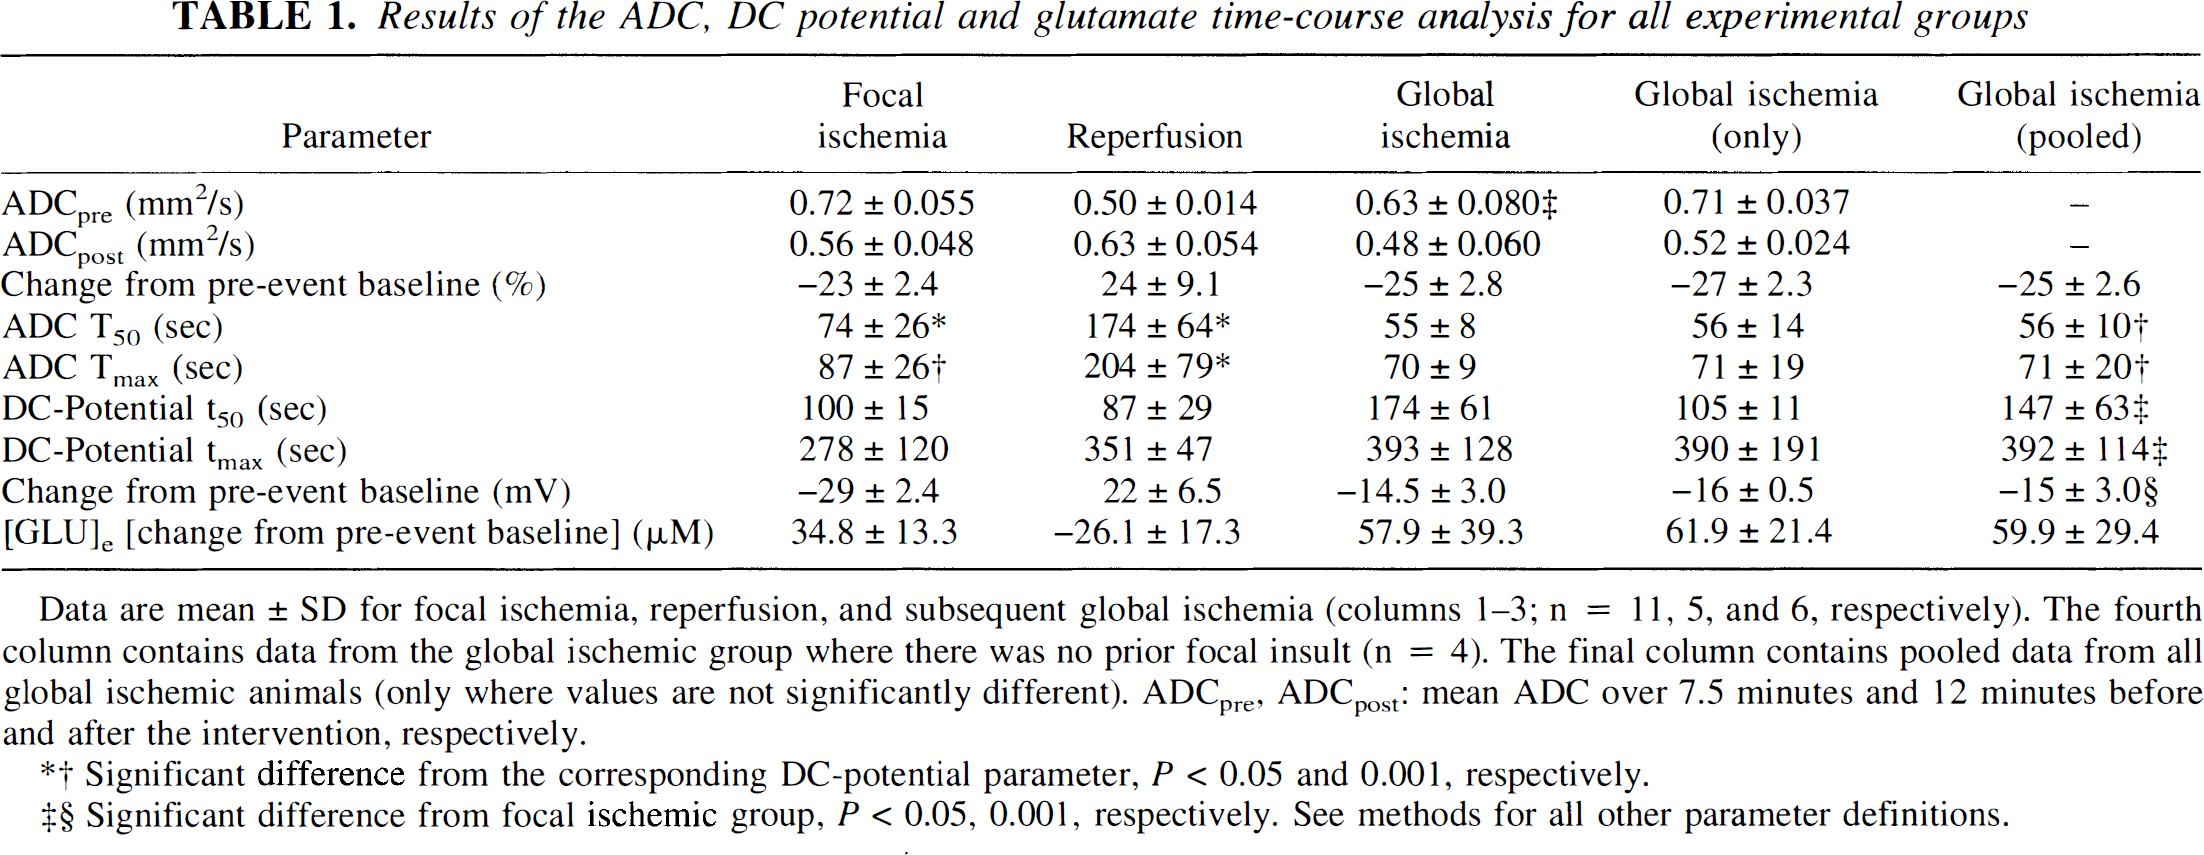
Data are mean ± SD for focal ischemia, reperfusion, and subsequent global ischemia (columns 1-3; n = 11, 5, and 6, respectively). The fourth column contains data from the global ischemic group where there was no prior focal insult (n = 4). The final column contains pooled data from all global ischemic animals (only where values are not significantly different). ADCpre, ADCpost: mean ADC over 7.5 minutes and 12 minutes before and after the intervention, respectively.
Significant difference from the corresponding DC-potential parameter, P < 0.05 and 0.001, respectively.
Significant difference from focal ischemic group, P < 0.05, 0.001, respectively. See methods for all other parameter definitions.
Reperfusion
During the time between the end of the focal ischemia measurements and subsequent reperfusion (~30 minutes), there was a smaller secondary decline in ADC (0.56 ± 0.048 to 0.50 ± 0.014 mm2/s) (Table 1; Fig. 2B). Reperfusion at 1 hour after focal ischemia resulted in a reversal of all measured parameters toward normal levels. The mean ADC returned toward baseline, increasing by 24 ± 9.1% to 0.63 ± 0.054 mm2/s, which, although similar in magnitude to the initial decline following focal ischemia, still returned to only 88% of preischemic control levels.
A positive deflection of the DC potential was initiated immediately upon reperfusion (22 ± 6.5 mV), and this returned toward control levels with a significantly faster time constant than the ADC (t50 = 87 ± 29 and 174 ± 64 seconds, respectively; P < 0.05). However, the time for maximal change in DC potential was significantly longer than for the ADC so that the ADC change was completed well before the DC potential (tmax = 351 ± 47 and 204 ± 79 seconds, respectively; P < 0.01). Reperfusion also resulted in a decrease in [GLU]e to around baseline levels, which occurred more rapidly than the focal ischemia-induced rise in concentration. Paradoxically, whereas the DC potential tmax was similar between reperfusion and ischemic groups, the ADC tmax for reperfusion was over twofold longer when compared with both focal and global ischemia groups (Table 1).
Global ischemia
There was no significant difference between any time course parameters whether global ischemia was initiated at 30 minutes after reperfusion or as a single event without prior insult (Table 1). Therefore, the results from the two global ischemia groups were combined. The general characteristics of the time courses after global ischemia were similar to those observed after focal ischemia (Fig. 2C). Considering all global ischemic animals, the ADC decreased by 27 ± 2.3% from baseline and at a significantly greater rate than the DC potential (t50 = 56 ± 10 seconds compared with 147 ± 63 seconds, respectively; P < 0.001). The change in ADC was completed much earlier than the DC potential (tmax = 71 ± 20 and 392 ± 114 seconds; P < 0.001); in fact, the ADC change occurred even before the DC potential had decreased by half. The [GLU]e was initially low around the time of maximal change in ADC and DC potential and did not reach a peak until much later in the time course.
Focal versus global ischemia
A more detailed analysis of the DC potential time course in the focal and global ischemic groups revealed a subtle difference in the initial waveform (Fig. 2A and C). In 9 of the 10 global ischemic animals studied, there was an initial transient hyperpolarization 1 to 2 minutes in duration after induction of ischemia. In the tenth animal, the waveform remained at the control level for a similar duration. In contrast, after focal ischemia, there was no hyperpolarization; the DC potential decreased immediately from the control level with a monotonic time course over the first 2 minutes. This was consistent for all animals studied. Scatterplots of the percentage change in ADC versus DC potential demonstrate a clear difference in the relationship between these two measurements during global compared with focal ischemia (Figs. 3A and 3B). In global ischemia, a substantial drop in ADC can often occur with no decrease in the DC potential.
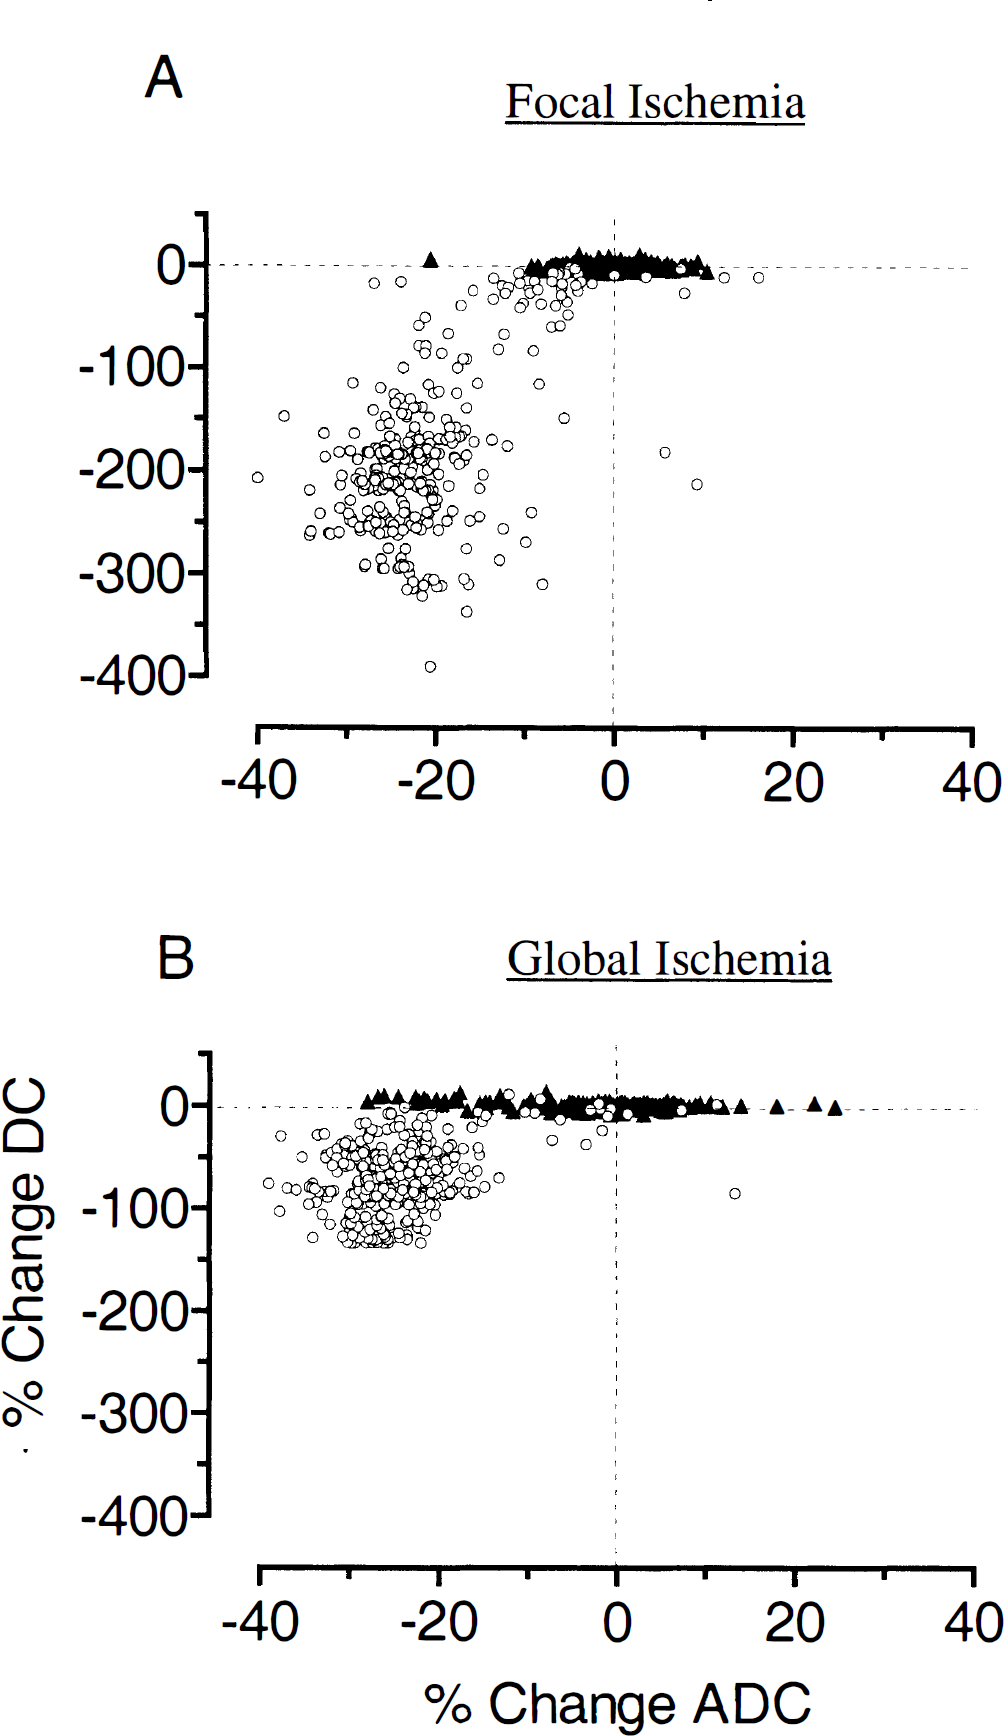
Scatterplots of percentage change in apparent diffusion coefficient (ADC) and direct current (DC) potential from baseline (pre-event) values during focal
For the temporal parameters t50 and tmax that describe the later part of the ADC time course, there was no significant difference between all global ischemia animals and the focal ischemia group. However, the DC potential t50 and tmax were significantly shorter after focal ischemia (P < 0.05) despite the magnitude of change being twofold greater after global ischemia (29 ± 2.4 and 15 ± 3.0 mV, respectively; P < 0.001).
DISCUSSION
The high temporal resolution used for data acquisition in this study enabled us to demonstrate some significant temporal dissociations between the ADC and DC potential time courses subsequent to either focal or global ischemia. The parameters t50 and tmax were significantly shorter for the ADC time course than for the DC potential after both focal and global ischemia. There were significant differences in the DC potential response between the models but not in the ADC, further emphasizing the physiological independence of these two signals. Extracellular glutamate remained low during the initial period of depolarization, rising slowly to peak much later than the ADC or DC potential parameters. However, its recovery on reperfusion occurred at least as rapidly as the normalization of the other indicators.
Experimental considerations
A dissociation of the MR and physiological responses would be expected if the measurements were taken from different regions. However, the placement of the region of interest immediately below the dialysis probe in the dorsolateral striatum is in a region that we have previously observed to show consistent ADC changes on induction of focal ischemia (Harris et al., 1997). Furthermore, the characteristics of the DC potential and glutamate changes closely match those expected from core ischemic rather than periinfarct regions (Obrenovitch, 1995).
Another factor that may affect postischemic onset of anoxic depolarization and subsequent cell swelling is the plasma glucose concentration (Hansen, 1978). However, it has been demonstrated that hyperglycemia does not affect the onset of ADC decline after focal or global ischemia in the rat, although it does significantly reduce the rate of ADC decline when compared with normoglycemia (Huang et al., 1997, 1998). In the present study, a difference in plasma glucose concentration might have been expected between the group receiving both a focal and a global insult and that receiving just a global insult. However, we found no significant differences in any time course parameter (t50, tmax) between these groups so that any differences in plasma concentrations had an insignificant effect on the time courses.
Anoxic depolarization and ADC: other studies
A close correlation between changes in ADC and DC potential was observed in a preliminary study of cardiac arrest-induced global ischemia, in which variables were recorded with similar time resolution to our study (de Crespigny et al., 1997). However, simultaneous recordings were achieved in only three rats, and no statistical evaluation was made. A further study from the same group found a close agreement between the occurrence of DC potential transients and ADC changes after K+-induced spreading depression (de Crespigny et al., 1998). Contrary to our findings, these studies support the idea that the reduction in ADC is concurrent with a loss of membrane potential and subsequent cell swelling. On the other hand, in accordance with our data, subsequent to either global or focal ischemia (Huang et al., 1997, 1998), a significant drop in water ADC was shown to occur before the average onset time of anoxic depolarization, as reported by Hansen (1978). Unlike in the study reported herein, where both DC potential and ADC were measured, Huang et al. (1997) interpreted their ADC measurements in the light of previous reports on ischemia-induced DC potential changes (Hansen, 1978).
Glutamate release and ADC
The precise timing of the glutamate measurements is more problematic than the electrical or MR measurements because of the design of the microdialysis system leading to both a time lag before glutamate changes are detected and a “smearing out” of the response. The smearing effect does not present a problem as the true temporal resolution of the amperometric recording system is ~30 seconds (Zihlka et al., 1995), considerably faster than the fastest glutamate time course we measured in this study. The [GLU]e time courses were synchronized with the first occurrence of anoxic depolarization as there is good evidence from other studies that the onsets of anoxic depolarization and glutamate release are essentially simultaneous (Obrenovitch, 1996; Wahl et al., 1994). As the peak of the [GLU]e response occurred at times >30 minutes after ischemia, in agreement with others (Graham et al., 1990; Wahl et al., 1994), which is severalfold longer than the time taken to reach the maximum ADC and DC potential responses, we believe that realignment of the data would not have a significant impact on the results. As the time courses were not resynchronized after reperfusion or global ischemia, it is legitimate to compare the glutamate, electrical, and ADC responses after reperfusion or global ischemia with those after the initial (artificially synchronized) focal ischemia. Glutamate reuptake is initiated very early during reperfusion as soon as repolarization starts to occur, while the ADC remains depressed. However, after global ischemia, [GLU]e starts to increase slowly during a period when the DC potential remains (at least) fully polarized and the ADC is falling.
It has been proposed that ischemia-induced glutamate release at the time of anoxic depolarization may contribute to the rapid ADC reductions observed during ischemia (Benveniste, 1991; Benveniste et al., 1992). However, the data presented here show that the [GLU]e time course is quite different from the ADC and DC potential during both focal and global ischemia. Consistent with other data on the lack of a proven role for glutamate in eliciting spreading depression or anoxic depolarization (Obrenovitch et al., 1996; Obrenovitch and Urenjak, 1997; Obrenovitch, 1999), it seems unlikely that extracellular glutamate has an involvement in the early rapid ADC decrease.
Focal versus global ischemia
Focal and global ischemia resulted in similar ADC time courses but significant differences in the corresponding DC potential waveforms (Figs. 2A and 2C, and 3). The major differences relate to the prolonged onset time to anoxic depolarization due to a hyperpolarization after global ischemia and to a much larger DC potential change after the focal insult. Although there may be a number of possible explanations, it is notable that DC potential hyperpolarizations are associated with hypercapnia in normal brain (Lehmenkühler et al., 1985) and that tissue Pco2 has been shown to rise even before anoxic depolarization during global ischemia (Obrenovitch et al., 1990). Presumably, in the absence of residual flow during global ischemia, the buildup of CO2 is greater when compared with focal ischemia, possibly causing the hyperpolarization of the DC potential. Although the differing DC potential changes are of interest for their own sake and have been noted by others (Hansen, 1978; Hossmann, 1971; Obrenovitch et al., 1993), their principle relevance to this study is that they refute the hypothesis that anoxic depolarization and loss of membrane ion homeostasis drive the change in water ADC.
Mechanisms for ADC change
As anoxic depolarization is known to be associated with cell swelling, the current observations that ADC changes occur before this event do not support the concept that the ADC changes are cell volume driven. However, there is evidence that some cell swelling can occur before the onset of anoxic depolarization, as a 20% decrease in extracellular space was measured after ischemia before depolarization occurred using an extracellular marker diffusion method (Hansen and Olsen, 1980). Moreover, as anoxic depolarization does not occur until ATP levels are reduced to 30% of normal (Obrenovitch et al., 1990), our observation that ADC changes can occur prior to depolarization is consistent with other studies reporting that loss of ATP does not necessarily correlate spatially (Kohno et al., 1995) or temporally (van der Toorn et al., 1996b) with ADC change after ischemia and conversely that maintenance of ATP need not prevent ADC decline (Huang et al., 1997, 1998). In conclusion, there is ample evidence that loss of membrane ion homeostasis does not need to occur before the ADC of water can change.
One possible mechanism not previously considered by which ADC reductions may result is through an indirect relation to increased [H+]e that occurs very soon after ischemia, earlier than the membrane ion changes relating to anoxic depolarization (Hansen, 1985). Intracellular acid—base homeostasis is partly controlled by the Na+/H+ transporter, which is activated during ischemia (Taylor et al., 1996) and accounts for the rapid rise in [H+]e. An early intracellular flux of Na+ that occurs to accommodate this proton transfer would most likely be associated with an osmotic shift of water into the cell, thus accounting for the early predepolarization' ADC changes observed in this study. In support of this, an early decrease in extracellular space during the predepolarization period, as measured by Hansen and Olsen (1980), was associated with a much smaller increase in extracellular Na+ compared with Ca2+ and K+, indicating an early Na+ flux into the cell (Xie et al., 1994). Similar conclusions were made in a 23Na MR spectroscopy study on the dog, where the global ischemia-induced decrease in sodium signal was interpreted as an intracellular Na+ flux before complete ATP depletion (Eleff et al., 1991). There are a number of diffusion-weighted imaging studies that appear to substantiate this hypothesis. For example, in the rat middle cerebral artery model, both the area of reduced ADC and its cerebral blood flow threshold correlated better with tissue acidosis than indicators of energy failure (Kohno et al., 1995; Hoehn-Berlage et al., 1995). Similarly, impedance changes were demonstrated at a level of cerebral blood flow greater than that for membrane failure in the cat ischemia model, implying that anoxic depolarization does not necessarily accompany extracellular volume changes (Matsuoka and Hossmann, 1982).
In the current study, normalization of the ADC during reperfusion was much slower than the initial ischemia-induced reduction. This may well be due to sustained cell swelling induced by activation of Na+/H+ antiport systems, which are known to be involved in normalization of intracellular pH with concomitant cell swelling (Kempski et al., 1988). In further support of acidosis underlying the ischemia-induced ADC change, we have observed that, similar to the time course of extracellular acidosis after reperfusion (Taylor et al., 1996), the ADC recovery was much slower than that of the DC potential. Finally, the recovery of ADC on reperfusion correlates closely with tissue pH both in the cat model (Hossmann et al., 1994) and in the global ischemia gerbil model (Allen et al., 1988; Busza et al., 1992). Nevertheless, despite this evidence for predepolarization volume changes, it must be recognized that larger cell volume changes will occur after full membrane depolarization has been initiated. Thus, at the very least, our data imply a strong nonlinear relationship between cell volume and ADC, if not a complete dissociation.
CONCLUSION
In conclusion, we have demonstrated that based on the differences in ADC and DC potential time courses after either focal or global ischemia, anoxic depolarization is not a prerequisite for a reduction in water ADC. The physiological dissociation between these parameters is further emphasized by differences in the time course data that occurred as a function of the model of ischemia.
Although there is evidence for cell volume changing before depolarization, this does not appear to be a sufficient or complete explanation of the ADC changes that we have observed. Finally, we have shown that the time course of [GLU]e release is sufficiently different from the ADC as to be unrelated to at least the initial acute ADC decline.