
Abstract
Magnetic resonance imaging (MRI) was utilized to obtain absolute estimates of regional brain water content (W), and results were compared with those obtained with conventional wet/dry measurements. In total, 31 male Long-Evans rats were studied and divided into two groups based on the surgical procedures used to induce cerebral focal ischemia: suture (n = 18) and three-vessel ligation (TVL; n = 13) groups. Both relative spin density and T1 were extracted from the acquired MR images. After correcting for radiofrequency field inhomogeneities, T2* signal decay, and temperature effects, in vivo regional brain water content, in absolute terms, was obtained by normalizing the measured relative brain spin density of animals to that of a water phantom. A highly linear relationship between MR-estimated brain water content based on the normalized spin density and wet/dry measurements was obtained with slopes of 0.989 and 0.986 for the suture (r = 0.79) and TVL (r = 0.83) groups, respectively. Except for the normal subcortex of the TVL group (P < 0.02) and the normal hemisphere of the suture group (P < 0.003), no significant differences were observed between MR-estimated and wet/dry measurements of brain water content. In addition, a highly linear relationship between MR-measured R1 (= 1/T1) and 1/W of wet/dry measurements was obtained. However, slopes of the linear regression lines in the two groups were significantly different (P < 0.02), indicating that different R1 values were associated with the same water content depending on the model. These results show that an absolute measurement of in vivo regional brain water content can be obtained with MRI and potentially serves as a noninvasive means to monitor different therapeutic interventions for the management of brain edema subsequent to stroke and head trauma.
Brain edema complicates the clinical course of massive cerebral infarctions and is responsible for a great majority of the fatalities that occur during the acute phase of ischemic stroke (Bounds et al., 1981). Brain edema also complicates many instances of brain tumor and head trauma. Although of diverse individual pathophysiologies, these entities share a common predisposition to the development of insidious secondary injury that may greatly increase morbidity and mortality. Changes in brain water content (W) critically influence intracranial pressure/volume homeostasis and are fundamental to the pathophysiology of secondary brain injury.
The increases in brain W and subsequently brain volume that occur after tissue infarction can produce substantial elevations in intracranial pressure beyond a critical point on the pressure-volume curve (Plum, 1961; Halsey and Capra, 1972; Ropper and Shafran, 1984). Intracranial hypertension may impair perfusion of potentially viable brain regions, extending the ischemic injury outside of the initial ischemic focus (Klatzo, 1985), and is correlated with increased mortality from stroke (Ropper and Shafran, 1984). Perhaps of equal importance, asymmetric increases in tissue volume within the cranial vault can establish regional tissue pressure gradients that drive dramatic shifts of brain structures as the lesion expands (Ropper and Shafran, 1984; O'Brien and Waltz, 1973; Weaver et al., 1982). These brain shifts may occur with or without measurable increases in global intracranial pressure (Ropper and Shafran, 1984; Frank, 1995) and yet with a noticeable increase in brain W on both magnetic resonance imaging (MRI) and computed tomography.
Management of cerebral edema is a major focus of neurological and neurosurgical intensive care (Ropper and Rockoff, 1988), yet the appropriate treatment plans under various clinical circumstances are ill defined and controversial (Muizelaar and Schroder, 1994). Lack of accurate and clinically robust means of measuring brain water content in living human subjects has made it difficult to carry out the appropriate clinical investigations to resolve these issues.
Magnetic resonance imaging has proven useful in the management of acute ischemic stroke, providing information on the location of lesions and the degree of mass effect. However, quantitative measurements of brain water content subsequent to ischemic insult are not yet available with any MR technique. There is a large body of literature reporting results from using either T1 or T2 as a means to assess the increase of brain water (Naruse et al., 1982, 1986; Bakker and Vriend, 1984; Bederson et al., 1986; Kato et al., 1986; Kotwica et al., 1989; Fu et al., 1990; Kamman et al., 1990; Boisvert et al., 1990; Fatouros et al., 1991; Lin et al., 1997), yet only relative estimates are available with these approaches. In contrast, relative spin density as measured with proton MRI is directly proportional to the water content. However, the measurements of spin density are technically more challenging and have been hampered by confounding factors such as radiofrequency (RF) field inhomogeneities and T2* signal decay.
Recently, it has been demonstrated by Venkatensan et al. (1998) that the effects of RF field inhomogeneities could be minimized so that a more accurate estimate of relative spin density and T1 could be obtained. However, the use of this method to obtain a noninvasive estimation of water content in vivo has not been explored. In this study, focal ischemic rat models were utilized to induce a wide range of elevated brain water content, and a three-dimensional fast low flip angle shot (FLASH) MR sequence was utilized to acquire images in which both relative spin density and T1 were extracted. Finally, the accuracy of the MR-estimated regional brain water content based on the measured relative spin density and T1 was assessed by comparing the MR-estimated brain water content with that obtained with the conventionally used wet/dry measurements. In addition, the dependence of the MR-estimated brain water content on the surgical procedures was assessed by comparing the water estimates between two focal cerebral ischemic rat models, namely, suture and three-vessel ligation (TVL) models.
MATERIALS AND METHODS
Animal preparation
All procedures described below were approved by the Animal Studies Committee at the Washington University Medical School and fell within the guidelines for animal care established by the National Institutes of Health.
A total of 31 adult male Long-Evans rats (275 to 325 g) were used in this study. The rats were divided into two groups based on the surgical procedures used to induce focal ischemia, namely, TVL (n = 13) and suture (n = 18) models. All animals were imaged during either acute (<6 hours after reperfusion) or subacute (between 22 and 25 hours after reperfusion) states to explore a wide range of elevated brain water content. Animals were maintained under ad lib conditions for 24 hours prior to surgery, and general anesthesia was induced with a single intraperitoneal injection of pentobarbital (65 mg/kg). Thermal stability (37 ± 0.5°C) was maintained during surgery with a servo-controlled lamp connected to a rectal thermometer.
Two surgical procedures that have been routinely used in our laboratory were utilized to induce cerebral focal ischemia: the TVL and the suture models. The details of both models have been described elsewhere (Chen et al., 1986; Koizumi et al., 1986; Longa et al., 1989), and a brief description of each model is given below.
Three-vessel ligation model. The right middle cerebral artery was exposed using microsurgical techniques, and a 2-cm vertical skin incision was made midway between the right eye and ear. After splitting of the temporalis muscle, a 2-mm burr hole was drilled at the junction of the zygomatic arch and the squamous bone. The middle cerebral artery was ligated immediately above the rhinal fissure with a 10-0 ophthalmic suture. Finally, both common carotid arteries were then exposed with a midline cervical incision and clamped with minimally traumatic aneurysm clips. Both the middle cerebral artery ligation and aneurysm clips were kept for 90 minutes, and reperfusion was achieved by removing the suture as well as the clips.
Suture model. The right common carotid artery and external carotid artery were exposed through a ventral midline incision. The right proximal external carotid artery was then ligated permanently. A 4-0 nylon monofilament with its tip rounded by heating near a flame and then coated with silicon was inserted through an arteriotomy of the common carotid artery ~3 mm below the carotid bifurcation and advanced into the internal carotid artery roughly 20 to 22 mm until resistance was felt. The suture was kept in place for 90 minutes, and reperfusion was achieved by withdrawing the suture from the internal carotid artery to the common carotid artery.
After the completion of reperfusion for both models, the rats were then placed in an incubator to maintain body temperature within normal limits and allowed to fully recover from anesthesia before returning to ad lib conditions in the animal quarters.
General anesthesia was induced again with a single intraperitoneal injection of pentobarbital (65 mg/kg) prior to the MR session (described below). The room temperature and the rectal temperature of the rats were measured before and immediately after the imaging experiment using a digital thermocouple thermometer (Physitemp, Clifton, NJ, U.S.A.) capable of measuring temperatures with a precision of 0.1°C over a wide range.
Magnetic resonance imaging protocol
All imaging was performed on a Siemens 1.5 T Vision whole-body imaging system (Siemens Medical Systems, Erlangen, Germany) with a maximum gradient strength of 25 mT/m and a slew rate of 41.7 mT/m/s. A homemade, linearly polarized, six-element transmit/receive birdcage coil (cylinder, 3.25 cm in diameter and 5.5 cm long) was used to acquire images. In addition to the scout sequence, two three-dimensional sequences with a symmetric echo readout and a bandwidth of 195 Hz/pixel were used in this study. A three-dimensional RF spoiled double echo gradient echo sequence was used first to acquire images covering the entire brain and later for the estimates of T1 and relative spin density. The echo times of this sequence were 5.4 and 15 milliseconds, respectively. The imaging parameters were as follows: repetition time = 30 milliseconds; field of view = 60 × 60 mm2 with a matrix size of 128 × 128; and 32 partitions covering a volume of interest of 32 mm. This sequence was repeated six times with identical imaging parameters as mentioned above except six different flip angles of 2, 5, 10, 20, 40, and 60° were used for each acquisition.
A three-dimensional gradient echo single echo sequence was used to acquire images to estimate the RF inhomogeneities of the coil [α(r)] and transmitter miscalibration (α0). To obtain an estimate of α(r), a 2° flip angle acquisition was used to image the uniform normalization water phantom with five signal averages, yielding high signal-to-noise ratio images. The α(r) was mapped only once in a known spatial coordinate system and was applied to each rat data set in a prestored format. Conversely, for the estimation of α0, a nonselective RF pulse was used to image each rat, and images were acquired at six flip angles ranging from 160 to 210° in steps of 10°. Oversampling along the slice-select direction was utilized to avoid aliasing. As α0 can vary from scan to scan, it is necessary to obtain an estimate of α0 for each experiment. For both acquisitions, the imaging parameters were as follows: repetition time = 30 milliseconds; echo time = 5.4 milliseconds; field of view = 60 × 60 mm2 with a matrix size of 64 × 64; and 32 partitions with a volume of interest of 64 mm.
All images were acquired in the coronal orientation with animals placed in a prone position. The total imaging time to acquire both the double echo three-dimensional images and the images for the estimates of α0 was kept to ~20 minutes to minimize the variation in the rat's rectal temperature during the MR experiments.
Wet/dry measurements
Animals were killed with an overdose of pentobarbital within 30 minutes after the completion of the MR experiments and were decapitated. The convexities of the brain were then exposed in a humidity chamber. For the suture model group, the brain was quickly separated into right (ischemic hemisphere) and left (nonischemic hemisphere) hemispheres, whereas for the TVL group, the brain was separated into right cortex, right subcortex, left cortex, and left subcortex. The tissue samples were weighed separately with a basic precision scale (Saltoritius Scale, Gottingen, Germany) and dried to a constant weight in a vacuum oven (Precision Scientific, Chicago, IL, U.S.A.) at 80°C and low vacuum. The percent W of each sample was calculated via the following equation (Elliott and Jasper, 1949):
Data analysis
After completion of the MR acquisition, all images were transferred to a SunSparc20 workstation (Sun Microsystems, Mountain View, CA, U.S.A.) for postprocessing including the estimation of RF field inhomogeneity, calculation of relative spin density and T1 maps with RF field correction, correction of T2* effects, correction of temperature effects, and finally estimation of absolute brain water content. Detailed descriptions for the extraction of relative spin density and T1 from the acquired images and the correction of RF field inhomogeneities are addressed elsewhere (Venkatesan et al., 1998). The corrections of T2* and temperature effects and the estimates of absolute water content are given below.
T2* corrections. To minimize the effects of T2* signal decay, the images obtained with the double echo sequence were used to estimate T2* on a pixel-by-pixel basis. Subsequently, the originally acquired images were divided by exp(−TE/T2*), where TE is echo time, on a pixel-by-pixel basis prior to the estimation of spin density and T1.
Temperature correction and absolute brain water estimates. To obtain estimates of absolute brain water content in vivo, the MR-measured relative spin density of rat brains needs to be normalized to a relative spin density of known water content. A homogeneous water phantom was imaged with the three-dimensional double echo fast low flip angle shot sequence, as mentioned previously, and the MR-measured relative spin density was then used as the spin density of 100% of water content. The imaging procedure for the homogeneous phantom was done only once, and the obtained relative spin density was used to normalize all further rat studies. Furthermore, it is known that the relative spin density is temperature dependent (Young et al., 1994a,b). This is due to the fact that the MR-estimated relative spin density is approximately equal to ργ2ħB0/4kT, where ρ is the proton density in a given volume, γ is the gyromagnetic ratio, ħ is Planck's constant, B0 is the static magnetic field, k is the Boltzmann constant, and T is the absolute temperature. We have previously demonstrated that a linear relationship between the absolute temperature (in Kelvin) and the measured spin density exists (ρ0 = −3.9*T (K) + 2,381; r =0.99) for a homogeneous water phantom (Lin et al., 1999). Therefore, prior to normalizing the MR-measured spin density of the rats to that of the homogeneous phantom, the corresponding MR-measured relative spin density of the water phantom was scaled to the mean rat's rectal temperature (the mean of the rectal temperature measured before and immediately after the MR experiment). Finally, the MR-estimated absolute brain water content (WMR) was obtained by taking the ratio of the measured relative spin density of the rats and the temperature-corrected relative spin density of the water phantom.
Regional analysis. Five slices of processed WMR and T1 maps starting from a plane ~2 mm caudal to the coronal plane containing the ear canals were transferred to a Macintosh Quadra personal computer (Apple Computers, Cupertino, CA, U.S.A.) for the estimates of regional brain water content. An image-processing software package, DIPStation (Hayden Image Processing Group, Boulder, CO, U.S.A.), was used to create binary masks of the spatial regions corresponding to the left and the right hemisphere for the suture group, whereas regions of right cortex, right subcortex, left cortex, and left subcortex were created for the TVL group. Finally, regional WMR and T1 of the rat brain were obtained for the two groups.
Statistical analysis
Data are expressed as mean ± SD, where SD represents the intersubject variability. A single-factor analysis of variance was used for the comparison of water content between groups. A linear regression analysis was used to obtain the slope, y intercept, and correlation coefficient (r) of a regression line when R1 (= 1/T1) was correlated with the inverse of wet/dry-measured water content. In contrast, the y intercept was forced to go through zero when WMR was correlated with the wet/dry-measured water content. Furthermore, a Student t test was used to test the difference of slopes between two linear regression lines. A P value of <0.05 was considered to be a significant difference between groups at a 95% confidence level.
RESULTS
Rectal temperatures before and immediately after MRI are summarized in Table 1 for both groups. An average of 2.98 ± 0.7 and 2.49 ± 0.93°C reduction in rectal temperature during the MR experiments was observed for the TVL and suture groups, respectively. No significant differences of rectal temperatures between the two groups were observed for either time point.
Rectal temperatures for both groups
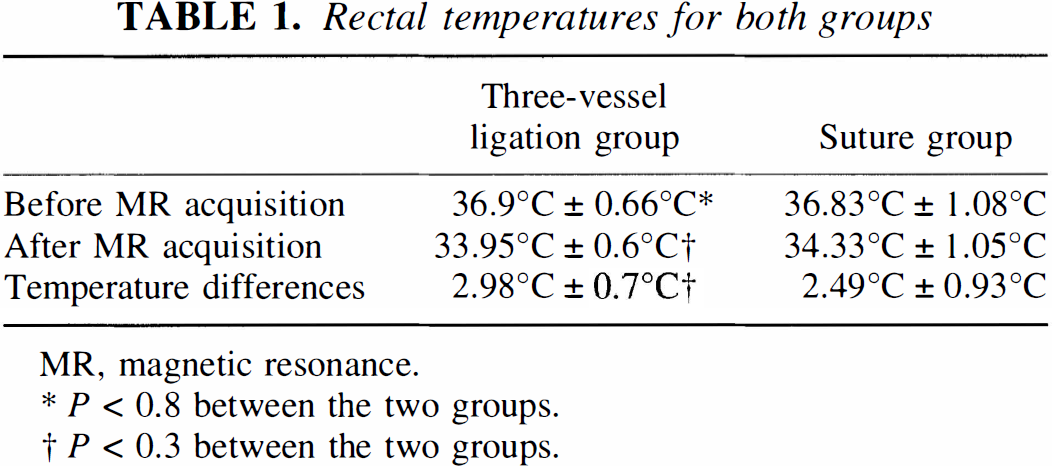
MR, magnetic resonance.
P < 0.8 between the two groups.
P < 0.3 between the two groups.
Representative images acquired with the double echo three-dimensional sequence are shown in Fig. 1 from two separate focal ischemic rats to demonstrate the ischemic insults induced by the two models. The corresponding spin density and T1 maps using the proposed methods are shown in Fig. 2 for the TVL (Figs. 2a and 2b) and suture (Figs. 2c and 2d) models, respectively.
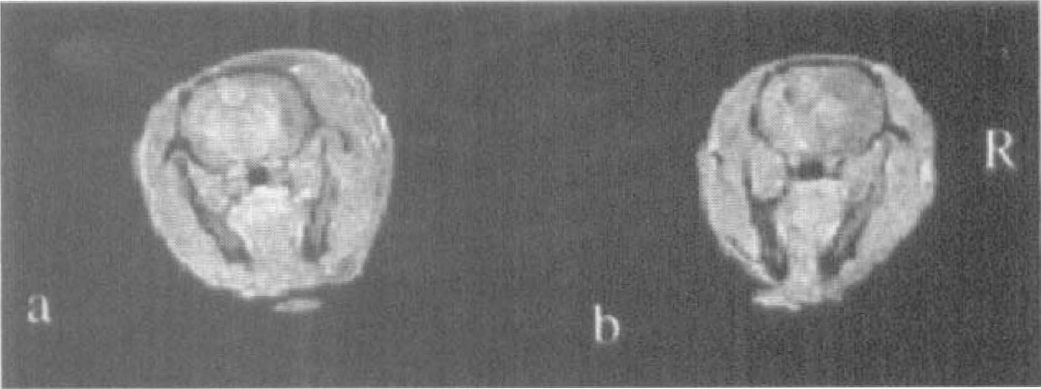
Focal ischemia was induced with the three-vessel ligation (TVL) model
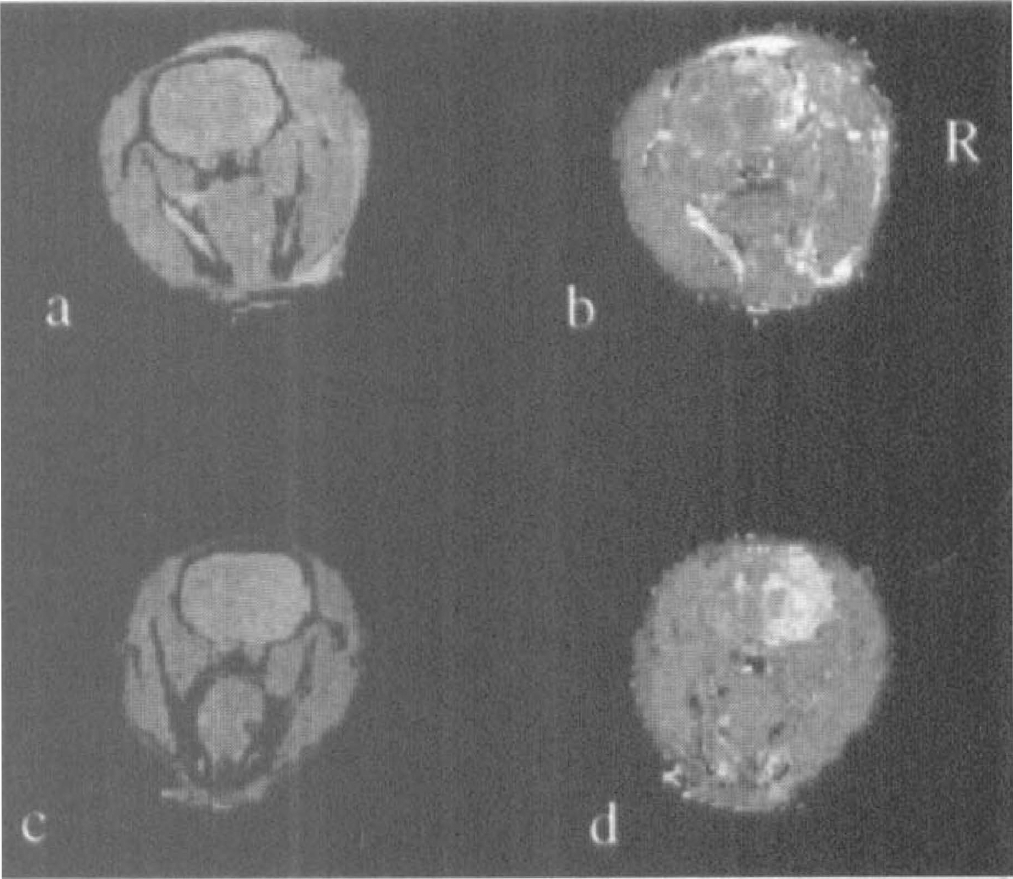
The corresponding spin density and T1 maps of the ischemic rats presented in Fig. 1 are shown.
Relationships between R1 and 1/W for both the suture and the TVL groups are shown in Fig. 3. Results from both groups are fitted to two different linear regression lines. A highly linear relationship between R1 and 1/W is obtained for both the suture (r = 0.91) and the TVL (r = 0.87) groups, respectively. The results from both groups have a substantial overlap when R1 is large, indicating that a comparable R1 is obtained between the two groups when brain W is in the normal range (~78 to 81%). However, the R1 values diverge between the two groups when the brain W is increased. As a result, when the slopes of the linear regression lines from the two groups are compared, a significant difference is observed (P < 0.02).
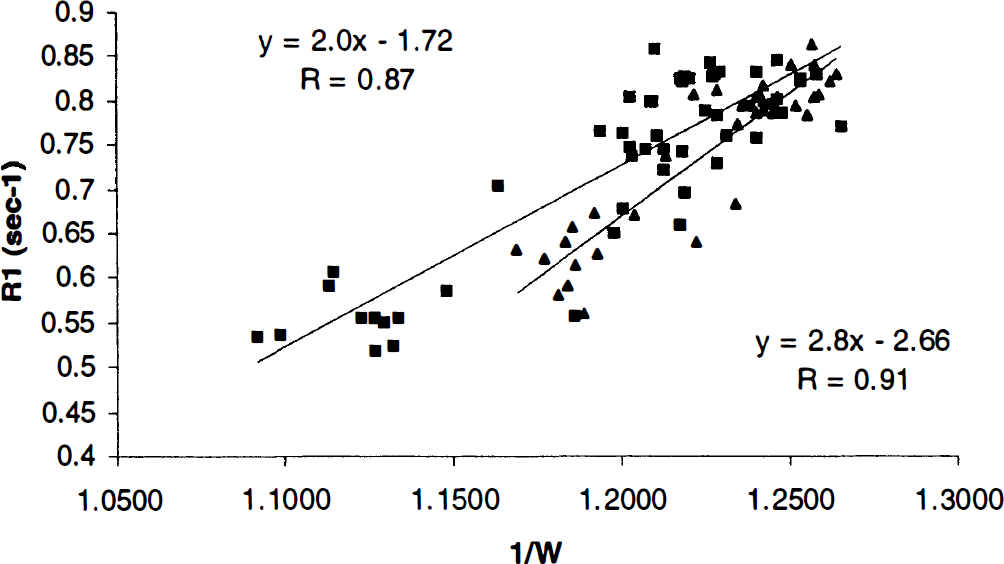
The relationships between R1 and 1/W are shown for the three-vessel ligation (TVL) group (squares) and the suture group (triangles), respectively. The associated slope, y intercept, and correlation coefficient of the linear regression line for the TVL group are shown at the left upper corner, and the slope, y intercept, and correlation coefficient for the suture group are shown at the right bottom corner of the plot.
The means and SD of regional brain W obtained from both wet/dry measurements and WMR estimates are summarized in Table 2 for both the TVL and the suture groups. As hemispheric regions of interest were used for the suture group whereas the hemisphere was subdivided into cortex and subcortex for the TVL group, a lower mean W elevation of the suture model (83.55 ± 1.48%, ischemic hemisphere) was observed when compared with the TVL group (88.77 ± 1.87%, right cortex). Comparing regional W between WMR and wet/dry measurements, significant differences were observed only for the normal subcortex of the TVL group (P < 0.02) and the normal hemisphere (P < 0.003) of the suture group, indicating that MR significantly underestimates the true W for only these two regions. Finally, even though a more cortical stroke is anticipated for rats that undergo the TVL-induced cerebral ischemia, a slight increase of W in the ischemic subcortex is observed and this increase in W reaches a significant difference (P < 0.001) when compared with that obtained from the control subcortex of the same group.
Brain water content measurements for both wet/dry and MR estimates
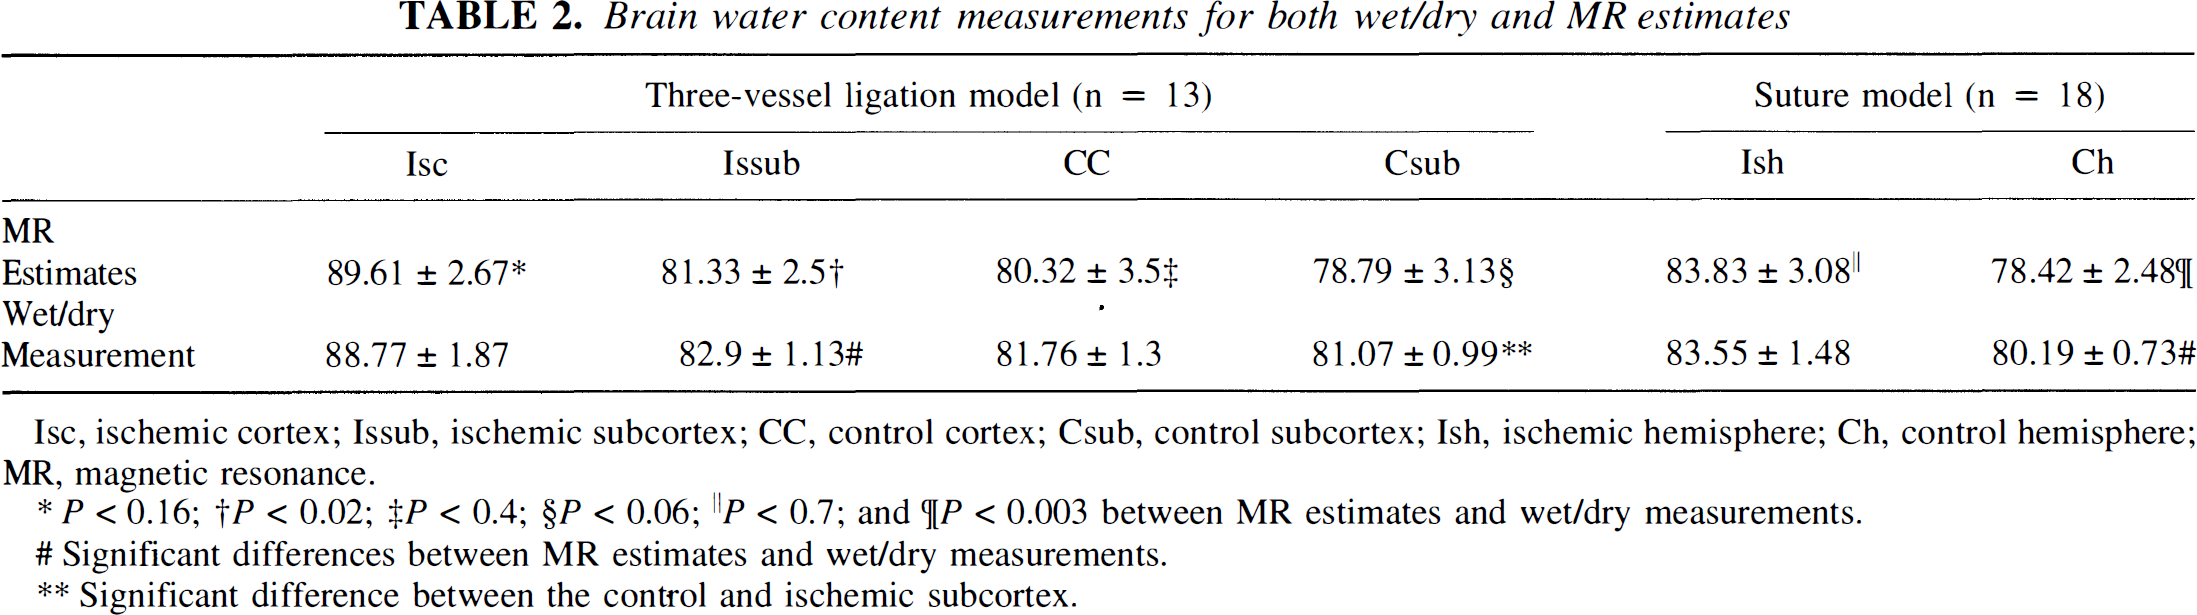
Isc, ischemic cortex; Issub, ischemic subcortex; CC, control cortex; Csub, control subcortex; Ish, ischemic hemisphere; Ch, control hemisphere; MR, magnetic resonance.
P < 0.16;
P < 0.02;
P < 0.4;
P < 0.06;
P < 0.7; and
P < 0.003 between MR estimates and wet/dry measurements.
Significant differences between MR estimates and wet/dry measurements.
Significant difference between the control and ischemic subcortex.
The relationship between wet/dry measurements and WMR is shown in Fig. 4 for both models. A linear regression analysis was used to assess the correlation between WMR and wet/dry measurements for each group separately. A highly linear relationship was obtained for both groups with correlation coefficients of 0.83 and 0.79 for the TVL and suture groups, respectively. More importantly, slopes of 0.986 and 0.989, indicating a 1.4 and 1.1% underestimation of the true water content with the MR estimates, were obtained for the TVL and suture groups, respectively. When data from both groups were combined as a whole for the linear regression analysis, a slope of 0.988 with a correlation coefficient of 0.82 was obtained.
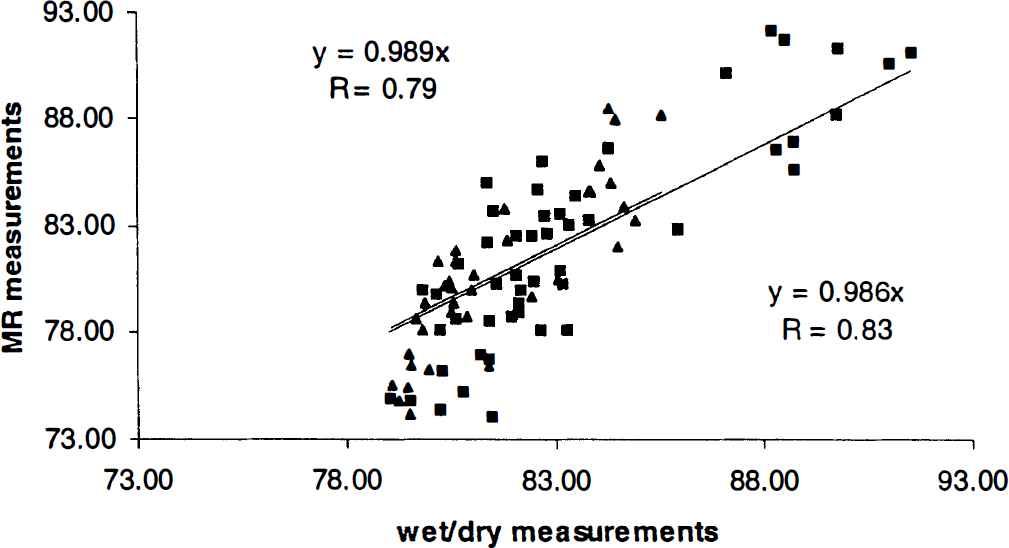
Relationships between magnetic resonance-estimated brain water content and that obtained from wet/dry measurements for both the suture (triangles) and the three-vessel ligation (TVL; squares) groups. The slopes and correlation coefficients for the TVL group are shown at the right bottom corner, and the slopes and correlation coefficients for the suture model are shown at the left upper corner of the plot.
DISCUSSION
Absolute measurements of brain W were obtained in vivo with the proposed three-dimensional MRI method. A highly linear relationship between WMR and that obtained with the ex vivo wet/dry measurements was observed for rats that underwent either suture (r = 0.79, slope = 0.989) or TVL (r = 0.83, slope = 0.986) -induced focal ischemia. These findings, however, may seem somewhat surprising when considering the previously proposed model of water molecules in biological systems by Fullerton et al. (1982). They suggested that the water molecules could exist in one of three different states: tightly bound with large molecules, loosely bound with large molecules, and free water. The T2 of the free water pool is rather long and therefore essentially contributes to the observed MR signal (MR visible) in most of the MR experiments. Conversely, the T2 values of the tightly bound and loosely bound water pools are thought to be rather short, <1 and 10 milliseconds, respectively, which may cause a substantial underestimation of true water content with an MR approach. Specifically, it has been suggested that the MR-invisible water content could be as high as 18.7% in normal brain tissue and 8% in an infarcted brain region (Kaneoke et al., 1987). Based on the above arguments, an underestimation of brain water content by MRI might be anticipated.
Clearly, our results disagree with these expectations, and a much smaller underestimation of true water content was obtained (Table 2). This discrepancy could be explained in part by the utilization of a double echo sequence that compensates signal loss from T2* decay and thereby minimizes the possible underestimation of WMR. However, only two echoes were used, leading to potential errors, which include inability to recover signal from short T2* species (<5.4 milliseconds) and inaccuracy in T2* estimates for multiexponential signal decay. These could potentially explain the observed significant underestimation of WMR for the normal subcortical region of the TVL group and the normal hemisphere of the suture group where the MR-invisible water is anticipated to be higher than in the ischemic regions (Table 2; Fig. 4) (Kaneoke et al., 1987). Although it is possible to utilize a multiecho sequence with a very short echo time to minimize the above-mentioned errors, it would require a longer data acquisition time and a lower spatial resolution. Despite these limitations, our results suggest a very comparable estimation of brain W, in absolute terms, between the MR and the ex vivo wet/dry measurements for a wide range of W in two different cerebral focal ischemic rat models.
Region-of-interest analyses
A higher brain W after ischemia was observed for the TVL group when compared with the suture group (Table 2). This discrepancy is most likely explained by the two different region-of-interest analyses used for the estimates of brain W in our studies. In the suture group, the brain was separated into the ischemic and control hemispheres, whereas the brain was subdivided into four regions (right cortex, right subcortex, left cortex, and left subcortex) for the TVL group. This is justified because a more cortical ischemia is normally induced by TVL procedures, whereas both subcortical and cortical regions are commonly injured in the suture-induced focal ischemia (Fig. 1). Therefore, to reduce the intersubject variability caused by the heterogeneity of brain edema from the two models, two region-of-interest analyses were used to assess the regional brain water content.
The inherited consequences of the two different region-of-interest analyses for the estimates of brain W are obvious and demonstrated in Results. As cortical regions were isolated for the estimates of brain water increased after stroke for the TVL group, partial volume between cortex and subcortex was minimized. Conversely, when a hemisphere was used as a whole to obtain an estimate of W increase after stroke, it could potentially include not only the core of ischemia where the most elevation of brain water normally occurred but also the periinfarcted regions where increased water content was much less. As a result, a smaller overall W increase for the suture group was obtained (Table 2). Furthermore, the two region-of-interest analyses could also contribute to the discrepancy in the measured SD of the two groups. Somewhat higher SDs of WMR in the TVL group than those of the suture group are observed (Table 2). This is likely to be explained by the fact that a smaller number of pixels were available when the hemisphere was divided into cortex and subcortex in the TVL group. In contrast, a larger hemispheric region of interest allowed more pixels for averaging, which in turn improved the signal-to-noise ratio of WMR and reduced the overall intersubject SD for the suture group.
Temperature effects on MR water estimation
In addition to the changes of brain W after stroke, temperature alterations alone can also induce changes in both relative spin density and T1 (Young et al., 1994a,b; Lin et al., 1999). In this study, we have assumed that the rectal temperature is representative of the brain temperature, and the mean of the rectal temperatures recorded before and immediately after MR experiments was used as the brain temperature. Subsequently, based on the known relation between temperature and spin density of the water phantom from our previous study (Lin et al., 1999), the spin density of the water phantom at this mean rectal temperature was estimated so that the temperature dependence from the water phantom and animals could be cancelled prior to the estimates of WMR.
The assumption that mean rectal temperatures are representative of brain temperatures could potentially impose errors in the estimates of brain W. As demonstrated by many investigators, the rectal temperature is representative of the brain temperature only under normal physiological conditions (Busto et al., 1987; Minamisawa et al., 1990). During a 20-minute global ischemia in rats, Busto et al. (1987) demonstrated that the brain temperature continued to drop to roughly 7°C below the control temperature while the rectal temperature was maintained considerably stable throughout the experiment. In addition, a temperature gradient within the ischemic brain was reported by Minamisawa et al. (1990). A progressive increase in brain temperature from the superficial tissues to the deep ones was observed when body temperatures were not controlled, whereas the temperature gradient was reversed when the body temperature was maintained via an external heating device. Furthermore, those authors also suggested that the magnitude of brain temperature reduction is highly dependent on the severity of ischemic injury as well as surgical procedures used to induce ischemia. However, all these studies focus on the brain temperature changes during ischemic conditions and/or immediately after the reperfusion; relatively little attention is given to the relation between brain temperature and rectal temperature beyond the hyperacute state (i.e., between 4 and 24 hours after reperfusion in our study). Therefore, the exact temperature differences between the rectal temperature and brain temperature are not known for our studies. Nevertheless, it is perhaps reasonable to assume that the rectal temperatures are higher than the brain temperatures in the ischemic hemisphere, leading to, potentially, a slight overestimation in WMR when compared with wet/dry measurements. This may explain the observed overestimation of WMR for higher water content as shown in Fig. 4. Nevertheless, instead of using an external water phantom for the normalization of MR-measured relative spin density of the brain, cerebrospinal fluid, which has a relative spin density of 1, could also be used in the future to further minimize the temperature dependence of WMR.
Technical considerations
One of the major difficulties associated with the proposed method is the differences in coil loading or B1 field between the phantom and rat images. There are two potential solutions to overcome this problem. First, a low flip angle three-dimensional sequence could be used to characterize the B1 field under conditions where a water phantom or the object of interest is in the coil so that effects of coil loading can be taken into account. As demonstrated in our previously published article (Venkatesan et al., 1998), the B1 characteristics between a water phantom and the knee of a human subject are rather similar, yielding a minimal effect on our signal model. Second, as proposed in this study as well as our previously published report (Venkatesan et al., 1998), the most desirable solution is to obtain an estimate of the B1 field of each experiment so that the effects of coil loading are completely taken into account and absolute estimates of brain water content independent of the coil loading can be obtained.
Using T1 for obtaining brain water
A highly linear relationship between R1 and 1/W for both the suture (r = 0.9) and the TVL (r = 0.87) groups was obtained. In addition, for a given range of water content as small as 8%, the T1 ranges between 1,170 and 1,900 milliseconds, suggesting roughly a 90-millisecond change in T1 for every 1% increase in water content (Fig. 3). This should provide a sensitive means for estimating brain W changes. However, when examining the data closely, similar R1 values were obtained between two groups when 1/W was >1.225, whereas the R1 values diverged between the two groups when 1/W was <1.225. As a result, when the slopes of both models were compared, a significant difference between the two slopes was obtained, suggesting that the same W is likely to be associated with different R1 values between the suture and TVL groups. To a large degree, these findings are not surprising. Even though many investigators have reported a linear relationship between R1 and 1/W, different slopes are observed among groups (Kato et al., 1986; Fu et al., 1990; Kamman et al., 1990). This is likely to be explained by the fact that factors other than W could also affect the estimates of T1, leading to the inconsistent results reported in the literature.
The divergence of the two slopes between the suture and the TVL groups could be of importance and potentially indicate the discrepancy of pathophysiological conditions between the two groups. As the same sequence and imaging parameters were used and a comparable estimation of water content between normalized spin density and wet/dry measurements was obtained for both groups, the observed discrepancy in slopes between R1 and 1/W is most likely caused by temperature differences in the ischemic brain between the two groups. More studies are needed to further investigate the observed differences in slopes between the two groups.
The above-mentioned difficulties associated with the use of T1 as a means for estimating W are minimized when MR-measured relative spin density is used for estimating WMR. Although further studies are required to improve the sensitivity for the estimates of in vivo brain water content, the success of our proposed method should provide the possibility of evaluating the effectiveness of different therapeutic interventions for the treatment of brain edema subsequent to brain injury. Furthermore, this may also provide the means of monitoring brain edema in vivo, for which there is as yet no available clinical protocol.
Footnotes
Acknowledgment
The authors thank Prof. E. Mark Haacke at Case Western Reserve University for his many valuable suggestions and review of this manuscript.