
Abstract
It has been reported recently that very delayed damage can occur as a result of focal cerebral ischemia induced by vascular occlusion of short duration. With use of diffusion-, T2-, and contrast-enhanced dynamic magnetic resonance imaging (MRI) techniques, the occlusion time dependence together with the temporal profile for this delayed response in a rat model of transient focal cortical ischemia have been established. The distal branch of the middle cerebral artery was occluded for 20, 30, 45, or 90 minutes. Twenty minutes of vascular occlusion with reperfusion exhibited no significant mean change in either the apparent diffusion coefficient of water (ADC) or the T2 relaxation time at 6, 24, 48, or 72 hours after reperfusion (P = 0.97 and 0.70, respectively). Ninety minutes of ischemia caused dramatic tissue injury at 6 hours, as indicated by an increase in T2 relaxation times to 135% of the contralateral values (P < 0.01). However, at intermediate periods of ischemia (30 to 45 minutes), complete reversal of the ADC was seen at 6 hours after reperfusion but was followed by a secondary decline over time, such that a 25% reduction in tissue ADC was seen at 24 as compared with 6 hours (P < 0.02). This secondary response was accompanied by an increase in cerebral blood volume (CBV), as shown by contrast-enhanced dynamic MRI (120% of contralateral values; P < 0.001), an increase in T2 relaxation time (132%; P < 0.01), together with clear morphological signs of cell death. By day 18, the mean volume of missing cortical tissue measured with high-resolution MRI in animals occluded for 30 and 45 minutes was 50% smaller than that in 90-minute occluded animals (P < 0.005). These data show that ultimate infarct size is reduced after early reperfusion and is occlusion time dependent. The early tissue recovery that is seen with intermediate occlusion times can be followed by cell death, which has a delayed onset and is accompanied by an increase in CBV.
Keywords
It is well known that brief periods of global ischemia (Pulsinelli et al., 1982) or hypoxia-ischemia (Lorek et al., 1994) can induce delayed tissue damage that occurs as late as 2 to 3 days after the insult. The exact mechanisms of this delayed cell death are presently unknown.
Suppression of protein synthesis (Krause and Tiffany, 1993), reperfusion injury caused by the formation of oxygen free radicals (Chan, 1996) or infiltration of neutrophils (Zhang and Iadecola, 1994), disturbance of the mitochondrial respiratory chain (Abe et al., 1995), and secondary disturbances in cerebral perfusion (Levy et al., 1979; Pulsinelli et al., 1982) may contribute to this phenomenon. More recently, progressive fragmentation of genomic DNA and the expression of gene products accompanying a cell death cascade (MacManus and Linnik, 1997) have been proposed to play important roles in this delayed cell death. The progression of delayed cell death using histopathological and other methods has been studied mainly in adult and neonatal models of global ischemia or hypoxia-ischemia. In contrast to the pathophysiology of delayed cell death after global ischemia, a focal ischemic infarct induced by permanent or prolonged (>1 hour) occlusion of the middle cerebral artery (MCA) has a very rapid onset, and the major expansion of the infarct into the perifocal area is usually accomplished within 4 hours after the onset of occlusion (Gill et al., 1995; Pierce et al., 1997). Recently, Du et al. (1996) have shown that focal ischemia induced by occlusion of the MCA for short duration induces cell death that is remarkably delayed in nature. This cell death can be prevented by treatment with the protein synthesis blocker cycloheximide, and the authors therefore proposed that apoptotic mechanisms may account for the delayed cell loss. This hypothesis is further supported by the recent findings that caspase inhibitors (z-VAD.FMK, z-DEVD.FMK) are efficacious in models of mild focal ischemia but show no effect if the initial insult is more severe (Fink et al., 1998).
Despite these recent and provocative findings, the contribution of apoptosis-mediated cell death to the pathophysiology of stroke remains controversial (van Lookeren Campagne and Gill, 1996), and other factors such as tissue inflammation or altered hemodynamics cannot be excluded (Levy et al., 1979; Slater et al., 1997). A detailed understanding of the evolution of the pathophysiology and its dependence on the severity of the ischemic insult is required for an adequate interpretation of these results. The progression of ischemic damage to infarction can be studied using magnetic resonance imaging (MRI) techniques. Through a combination of diffusion-weighted, blood volume-sensitive, and T2-weighted MRI techniques, we have obtained a comprehensive picture of the evolution of tissue damage and altered hemodynamics that occur after ischemia-reperfusion in the rat brain.
METHODS
Surgical procedures
All experiments involving the use of animals were approved by Genentech's Animal Care and Use Committee (American Association for the Accreditation of Laboratory Animal Care accredited). Long-Evans rats (300 to 330 g) were deprived of food 24 hours before surgery. The rats were anesthetized with 2.5% isoflurane in a mixture of 30% O2/70% N2O. Core temperature was maintained at 37°C during and 6 hours after reperfusion using a thermostatically controlled heating blanket (Harvard Instruments, South Natick, MA, U.S.A.). Occlusion of the MCA was performed as described elsewhere (Chen et al., 1986). The right MCA was exposed via a craniotomy and ligated with a 10-0 suture. Both common carotid arteries were also occluded for the ischemic period. To induce ischemia of variable severity, the MCA was occluded for either 20, 30, 45, or 90 minutes (n = 6–8 for each occlusion time). Complete interruption of the blood flow and subsequent reflow were verified directly under the microscope. The cranial window was covered with a piece of webbing and the skin was temporarily sutured for MRI during occlusion or permanently sutured after reflow. The animals were either kept under anesthesia for immediate MRI or allowed to recover for imaging at later times. Between 6 and 24 hours after occlusion, one animal in the 45-minute occlusion group and one animal in the 90-minute occlusion group died. One animal in the 30-minute occlusion group and one animal in the 45-minute occlusion group showed no adequate reperfusion, as revealed by the absence of tissue normalization on diffusion-weighted images at 6 hours after reperfusion. Imaging results from these four animals were omitted from the analysis. A separate group of animals (n = 8) underwent craniotomy and a suture was inserted under the MCA but was not tied off (sham operation). In another group of animals (n = 9), the right femoral artery was cannulated with a PE-50 catheter for monitoring of blood pressure and pulse rate (measured with a Grass model 7 polygraph; Grass Instruments, Quincy, MA, U.S.A.), blood glucose (Lifescan One Touch Profile; Lifescan, Milpitas, CA, U.S.A.), and blood gases (Pao2 and Paco2, measured with a model 238 blood gas analyzer; Ciba Corning Diagnostics, Halstead, U.K.). Measurements were performed 30 to 50 minutes before occlusion, 10 to 35 minutes after occlusion, and 30 to 50 minutes after reperfusion following MCA occlusion for 45 minutes.
MRI measurements
For the MRI experiments, the rats were reanesthetized with 2% isoflurane (30% O2/70% N2O) delivered through a face mask. The rats' heads were held rigid in a plastic frame (Applied Neurosciences, Thurso, U.K.) so that the parietal surface of the skull was horizontal in the magnet and the brain was centered in a volume radiofrequency coil operating in quadrature mode (internal diameter 6 cm). The animal core temperature was maintained at 37.0 ± 0.5°C with warm air. Respiratory rate, heart rate, and oxygen saturation were monitored on-line in the magnet with a pulse oximeter sensor (Nonin Medical, Plymouth, MN, U.S.A.) placed on the hind paw, and the level of anesthesia was adjusted such that respiratory rate, heart rate, and oxygen saturation were maintained within an acceptable range. The MRI experiments were performed on a 4.7-T Varian Unity Inova MR system (Varian Instruments, Palo Alto, CA, U.S.A.). Positioning and slice planning were performed from a series of scout images obtained using a fast spin echo sequence in the coronal plane. Diffusion-weighted and T2-weighted MRI was performed on nine contiguous slices, 2 mm thick, spanning the region of interest (ROI).
Typical imaging parameters were as follows: echo time (TE) 60 milliseconds; repetition time (TR) 1.5 seconds; field of view 40 × 40 mm; 64 × 64 matrix; number of excitations (NEX) 2. Brain apparent diffusion coefficient (ADC) values were determined using a pulsed-field gradient spin echo technique with diffusion sensitization perpendicular to the image plane at three diffusion weights (b = 262, 513, and 1,046 s/mm2). T2 relaxation times were obtained from a multiecho-based imaging sequence using eight evenly spaced echoes (echo spacing 15 milliseconds, TR 2 seconds, NEX 2, 64 × 64 matrix). To establish the relative change in cerebral blood volume (CBV), bolus tracking experiments were performed using a T2*-weighted gradient echo sequence (TR 10 milliseconds, TE 8 milliseconds, 64 × 64 data matrix, 15° flip angle). A relatively short TE was chosen for this experiment to reduce long-range susceptibility artifacts arising from the surgical trauma to the skull, which caused an unacceptable signal loss in the ischemic cortex at early time points. The susceptibility artifacts seen at longer TEs arise from the surgical intervention to the skull, not the brain tissue. No evidence of hemorrhage is seen within the cortex either by MRI or by histology. An intravenous bolus injection of 0.6 mmol/kg Gd-diethylenetriamine pentaacetate (Gd-DTPA) contrast agent (Magnevist; Berlex, Wayne, NJ, U.S.A.) was given after the tenth image in a series of 40 images acquired from a single coronal slice centered in the ischemic territory.
Three groups of experiments were performed. The first group (n = 8) consisted of sham-operated animals from which diffusion- and T2-weighted images were taken at 1 and 3 days after surgery. In the second group (n = 35), the animals were initially imaged 6 hours after the onset of ischemia and then at −24, 48, and 72 hours after reperfusion using the T2-weighted and diffusion-weighted protocols. These animals were imaged again 2 weeks later to derive an estimate of the ultimate infarct size as seen from a T2-weighted image. More accurate assessment of the eventual infarct size was obtained from high-resolution anatomical MRI using the same protocol as for T2-weighted imaging but at higher resolution and signal-to-noise ratio (TE 28 milliseconds, TR 2 seconds, NEX 16, 128 × 128 matrix). Due to the time constraints imposed by the imaging protocol, it was not possible to establish the ADC change that occurred during the ischemia period for the 20- and 30-minute occlusion times, but the initial reduction in ADC that occurs during the ischemic period was assessed in the rats exposed to 90 minutes of occlusion. These animals were imaged at 20, 50, and 70 minutes after the onset of ischemia. To establish the temporal evolution and to assess the changes in cerebral hemodynamics associated with this delayed response, a third group of animals (n = 8) was studied in which images were taken during occlusion, every 3 hours for the first 24 hours after reperfusion, and then again at 48 hours using T2-weighted, diffusion-weighted, and dynamic contrast-enhanced susceptibility-weighted MRI. Due to premature death, three animals were excluded prior to analysis.
Data processing
Image analysis and postprocessing were performed off-line using MRVision software (MRVision Co., Menlo Park, CA, U.S.A.). The ADC and T2 parameter maps were generated from two-parameter fits to monoexponential models (Le Bihan et al., 1986). Due to diffusion anisotropy, the ADC values are dependent on the direction of the sensitization gradient, but we sought to establish the comparative change with time and ADCav was not measured in this experiment. The mean changes in ADC and T2 were measured in the parameter maps from both the ischemic cortex and the contralateral cortex by taking the mean value from three ROIs that spanned the lesioned cortex or the contralateral cortex. From the dynamic susceptibility data, signal intensity versus time curves for each ROI were converted into transverse relaxation rate (δR2*) according to the following formula: δR2*(t) = -ln[S(t)/SO]/TE, where S(t) is the signal intensity at time t during contrast agent passage through the vascular bed and S0 is the precontrast signal intensity. A relative value for the CBV was obtained from the integral of this curve. In theory, by measuring the mean transit time from the first moment of the γ-variate fit and using the central volume principle, an estimate of the relative change in cerebral blood flow can be obtained. However, in practice, this measurement is more difficult to make and with many pitfalls (Weisskoff et al., 1993). For the purpose of this study, data analysis was restricted to the determination of CBV. Images were smoothed in space using a 3 × 3 kernel, and ROIs within the ischemic cortex were delineated by eye from the difference image (pre- minus post-Gd-DTPA) in which the boundary represents the greatest contrast. Mean values for the hemodynamic parameters were determined at each point and normalized to an equivalent region in the contralateral hemisphere.
The T2 maps were used to estimate the volume of tissue with significant T2 changes. In each coronal section, a threshold was determined by the pixel average T2 values in the contralateral cortex plus 2 × SD. The volumes of pixels above this threshold value in each coronal plane were summed to give a total volume. To determine the volume of infarction 18 days after reperfusion, the areas of remaining tissue in each hemisphere were delineated by hand and integrated over 13 high-resolution coronal images. The volume of the ipsilateral hemisphere was subtracted from that of the contralateral hemisphere.
Histology
At different time points after MCA occlusion, animals were anesthetized with sodium pentobarbital and perfused transcar-dially with 4% paraformaldehyde dissolved in 0.1 mol/L phosphate-buffered saline (n = 3 for each time point). Brains were subsequently embedded in paraffin wax, and 7-mm sections were stained with hematoxylin/eosin to study microscopic changes in tissue morphology.
Statistical analysis
The data are expressed as means ± SD. To test the effect of occlusion time on changes in ADC or T2 relaxation times, for each occlusion time, repeated T2 and ADC measures in the ipsilateral and contralateral hemispheres were fitted to a quadratic curve: T2 (ADC) = B0 + B1 * hour + B2 * hour2. The parameters from each animal, that is, the slopes of the curves, were averaged and the P values calculated using a t test. In cases in which the slopes in the ipsilateral and contralateral hemispheres were not different, the intercepts were estimated and differences tested using a Student t test. In cases in which the parameters were significantly different, the average ADC responses in the ipsilateral cortex at 24 hours were compared with those averaged over 6 and 48 hours, and the average T2 response in the ipsilateral cortex was compared with that in the contralateral cortex at 24 hours after reperfusion. The percentage drop or increase in values was tested for significance by using a t test. For animals occluded for 90 minutes, T2 values of the ipsi- versus contralateral cortex were tested at 6 hours. Likewise, ADC values of the ipsi- versus contralateral cortex were tested at 24 hours.
In the longitudinal experiments (occlusion time dependence of T2 or ADC changes and secondary changes in CBV following 45-minute occlusion), the ipsi- versus contralateral ADC, T2, and CBV values were compared at single time points for each parameter, namely, at 12, 24, and 15 hours after reperfusion, respectively, using a t test. To estimate whether the CBV increased over time, the average slope of the curve established by a linear regression analysis of time versus CBV was averaged over five animals and P values were determined using a t test.
Differences in volumes of T2 changes and volumes of lost tissue were estimated using a factorial analysis of variance followed by, in the case of a significant effect, the Fisher least significant difference test.
RESULTS
The physiologic parameters were within the normal range. No significant differences were found in the parameters measured before occlusion (baseline), during occlusion, and after reperfusion (Table 1). Sham-operated animals showed no changes in the cortex of ADC or T2 values at any time point. Varying the duration of the MCA occlusion altered the evolution of the tissue damage. Brief periods of focal cerebral ischemia (<20-minute occlusion time) exhibited no significant mean change in either ADC or T2 values over time (P = 0.70 and 0.97, respectively; Fig. 1). The absence of any ischemic damage was confirmed by histology performed at 3 and 14 days (results not shown), suggesting that, in this model of focal ischemia, this brief insult does not result in any delayed cell death. During 90-minute occlusion, a clear up to 40% decrease in the ADC of the ipsilateral compared with the contralateral cortex was observed. The ipsilateral and contralateral (respectively) ADC values were 428 ± 51 and 629 ± 64, 402 ± 36 and 665 ± 46, and 400 ± 13 and 678 ± 14 × 10–6 mm2/s at 20, 50, and 70 minutes after occlusion (n = 4). The ipsilateral T2 values measured during occlusion did not differ significantly from the contralateral values and were (respectively) 53 ± 1 and 52 ± 2, 52 ± 2 and 49 ± 2, and 54 ± 1 and 53 ± 2 milliseconds at 20, 50, and 70 minutes after occlusion (n = 4). At 6 hours after reperfusion, a 47% decrease in the mean ADC value and a 35% increase in T2 relaxation time compared with contralateral values were measured (P < 0.01; Fig. 1). The significantly elevated ADC values 2 and 3 days after occlusion (120% increase compared with contralateral values; P < 0.01) may indicate total lysis of cells, resulting in a disruption of diffusion barriers. At an intermediate duration of ischemia (30 to 45 minutes), complete reversal of ADC was seen at 6 hours after reperfusion, but this was followed by a significant secondary drop in ADC values at 24 hours, which were on the average 10% (30-minute occlusion) or 25% (45-minute occlusion) lower than the average values at 6 and 48 hours (P = 0.02). This secondary drop was accompanied by a mean increase in the T2 relaxation time of 13% (30-minute occlusion) or 53% (45-minute occlusion) (P < 0.01).
Physiologic variables measured before (baseline), during (10 to 35 minutes after occlusion), and after (30 to 50 minutes after reperfusion) middle cerebral artery occlusion (n = 9)
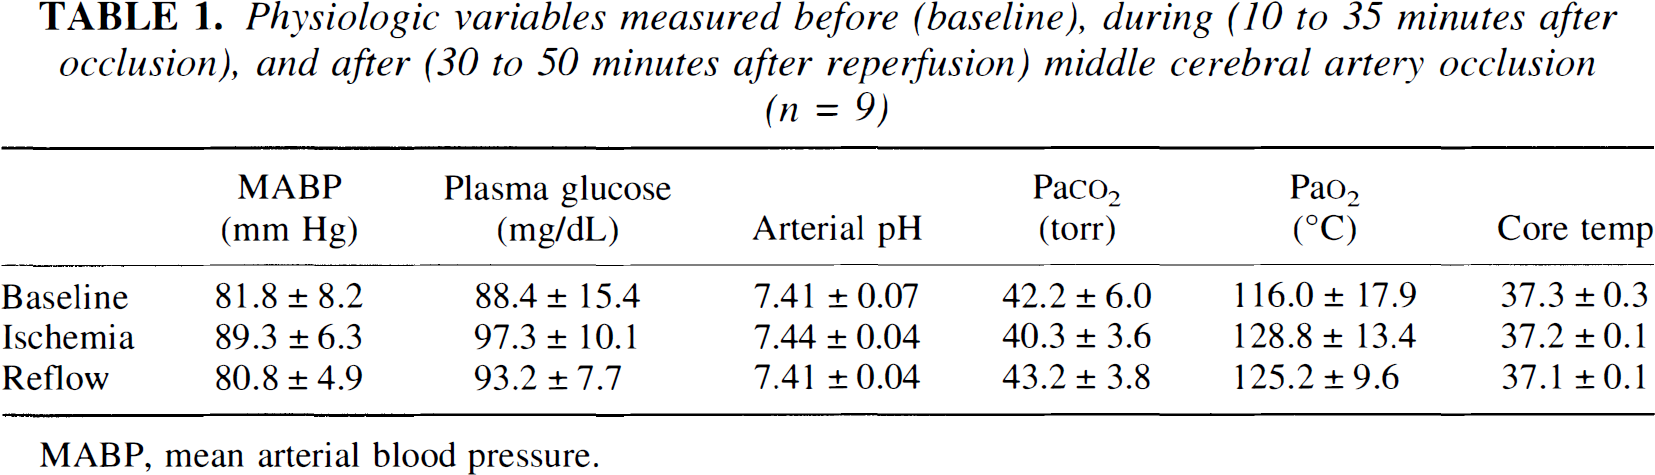
MABP, mean arterial blood pressure.
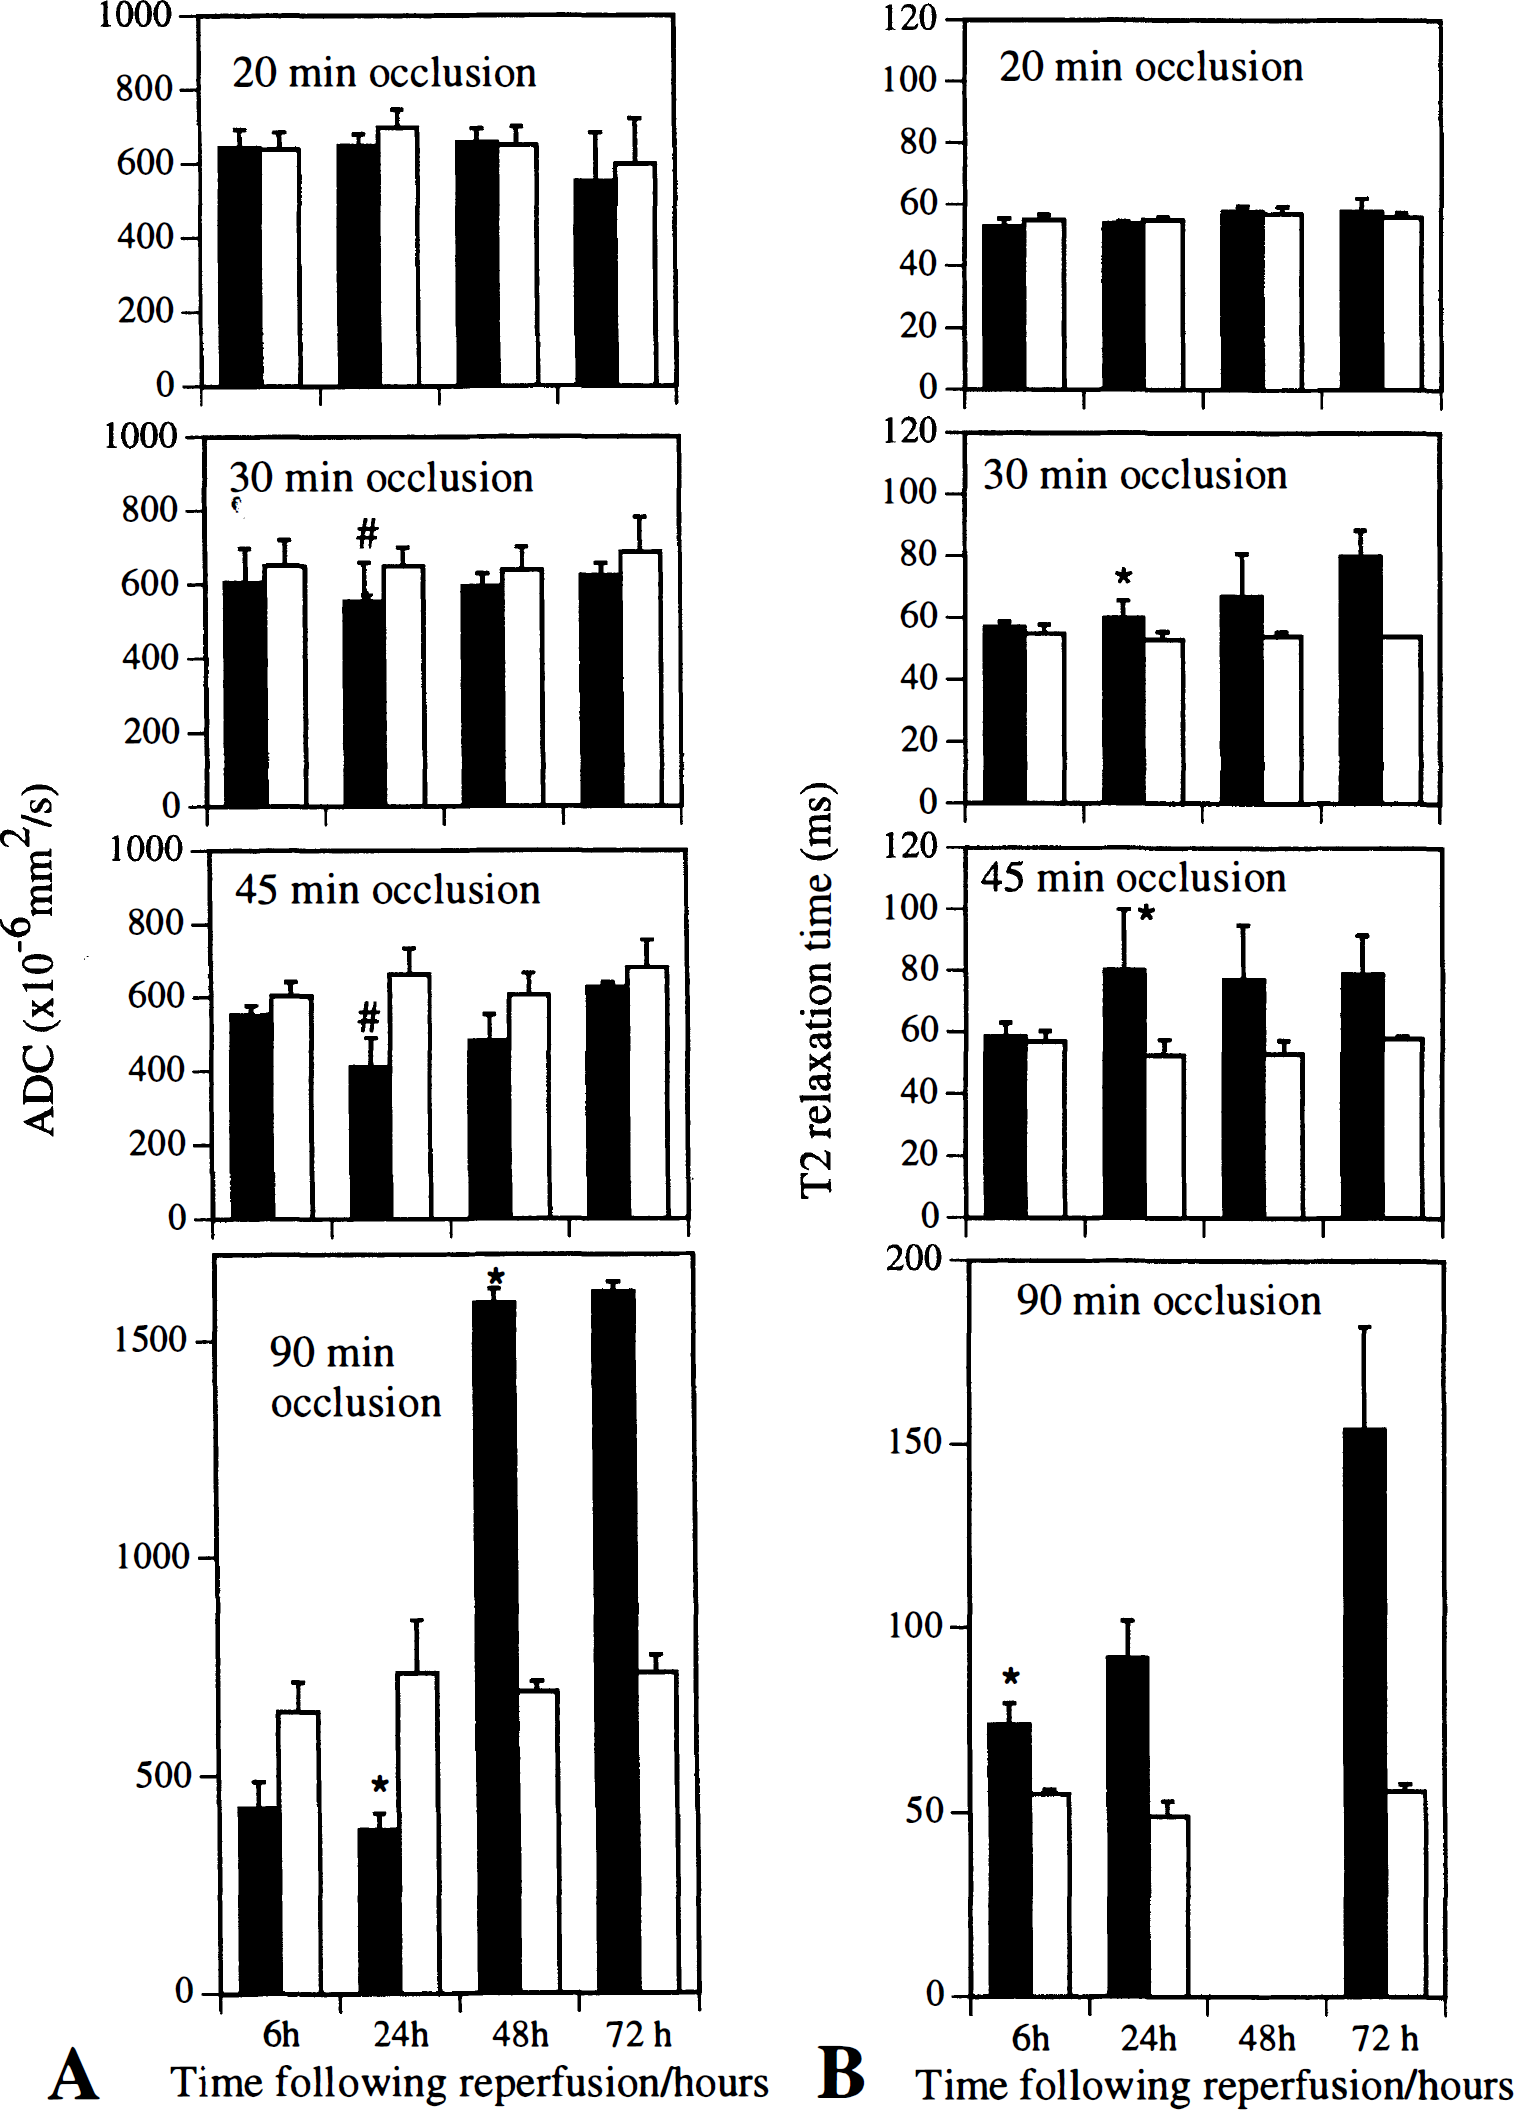
(A and B) The evolution of the tissue damage is dependent on the duration of the ischemic event. Brief periods of focal cerebral ischemia (20-minute occlusion time) resulted in complete reversal of the apparent diffusion coefficient (ADC), whereas 90 minutes of focal ischemia resulted in dramatic tissue injury at 6 hours after reperfusion (seen as a change in both ADC and T2 relaxation time). However, at an intermediate duration of ischemia (30 and 45 minutes), complete reversal of ADC was seen at 6 hours after reperfusion but was followed by secondary ischemic damage that was first seen 1 day later. Contralateral mean values did not significantly change over time. All values are expressed as means of six to eight animals. *P < 0.02, significantly different from contralateral values; #P < 0.04, significantly different from mean at 6- and 48-hour time points. (▪) ipsilateral; (□) contralateral.
In a separate group, animals were imaged during occlusion, every 3 hours for the first 24 hours after occlusion and then again at 48 hours after occlusion of 45 minutes duration. Diffusion- and T2-weighted MRI were performed at each time point. The ischemic territory was clearly delineated as a region of hyperintensity on the diffusion-weighted images during occlusion, indicating a reduction in ADC that completely reversed on reperfusion (Fig. 2A). A secondary appearance of a hyperintense region was seen 12 hours later, followed by a mean increase in T2 relaxation time by 24 hours (Fig. 2B). Quantitative changes in the ipsilateral and contralateral ADC and T2 relaxation times were calculated from both ADC and T2 maps (Fig. 2C). A gradual but progressive secondary decline in the ADC was seen, becoming significant at 12 hours after reperfusion (15% less than contralateral values; P = 0.02; Fig. 2C). The T2 relaxation times were significantly increased by 24 hours after reperfusion (23% over contralateral values; P = 0.06). Histological examination at 6 hours following 45 minutes of occlusion revealed only slight cellular swelling in the MCA territory, whereas the secondary decline in ADC was accompanied by clear histopathological changes at 24 hours after reperfusion, including cell swelling and nuclear pyknosis (Fig. 3). This differed from the histopathological changes following 90 minutes of occlusion. Major histological signs of cell death were found at 6 hours, indicating that little, if any, recovery of the ischemic damage is offered by reestablishing the blood flow after this duration of ischemia (Fig. 3). Development of coagulative necrosis, neovascularization, and infiltration of foamy macrophages is present at 14 days after both 45- and 90-minute occlusion (results not shown). Detailed histological analysis of both hematoxylin/eosin-stained sections, like those shown in Fig. 3, as well as toluidine-stained 1-mm-thick epon sections (results not shown) indicated the absence of any apoptotic morphology at any time point following occlusion.
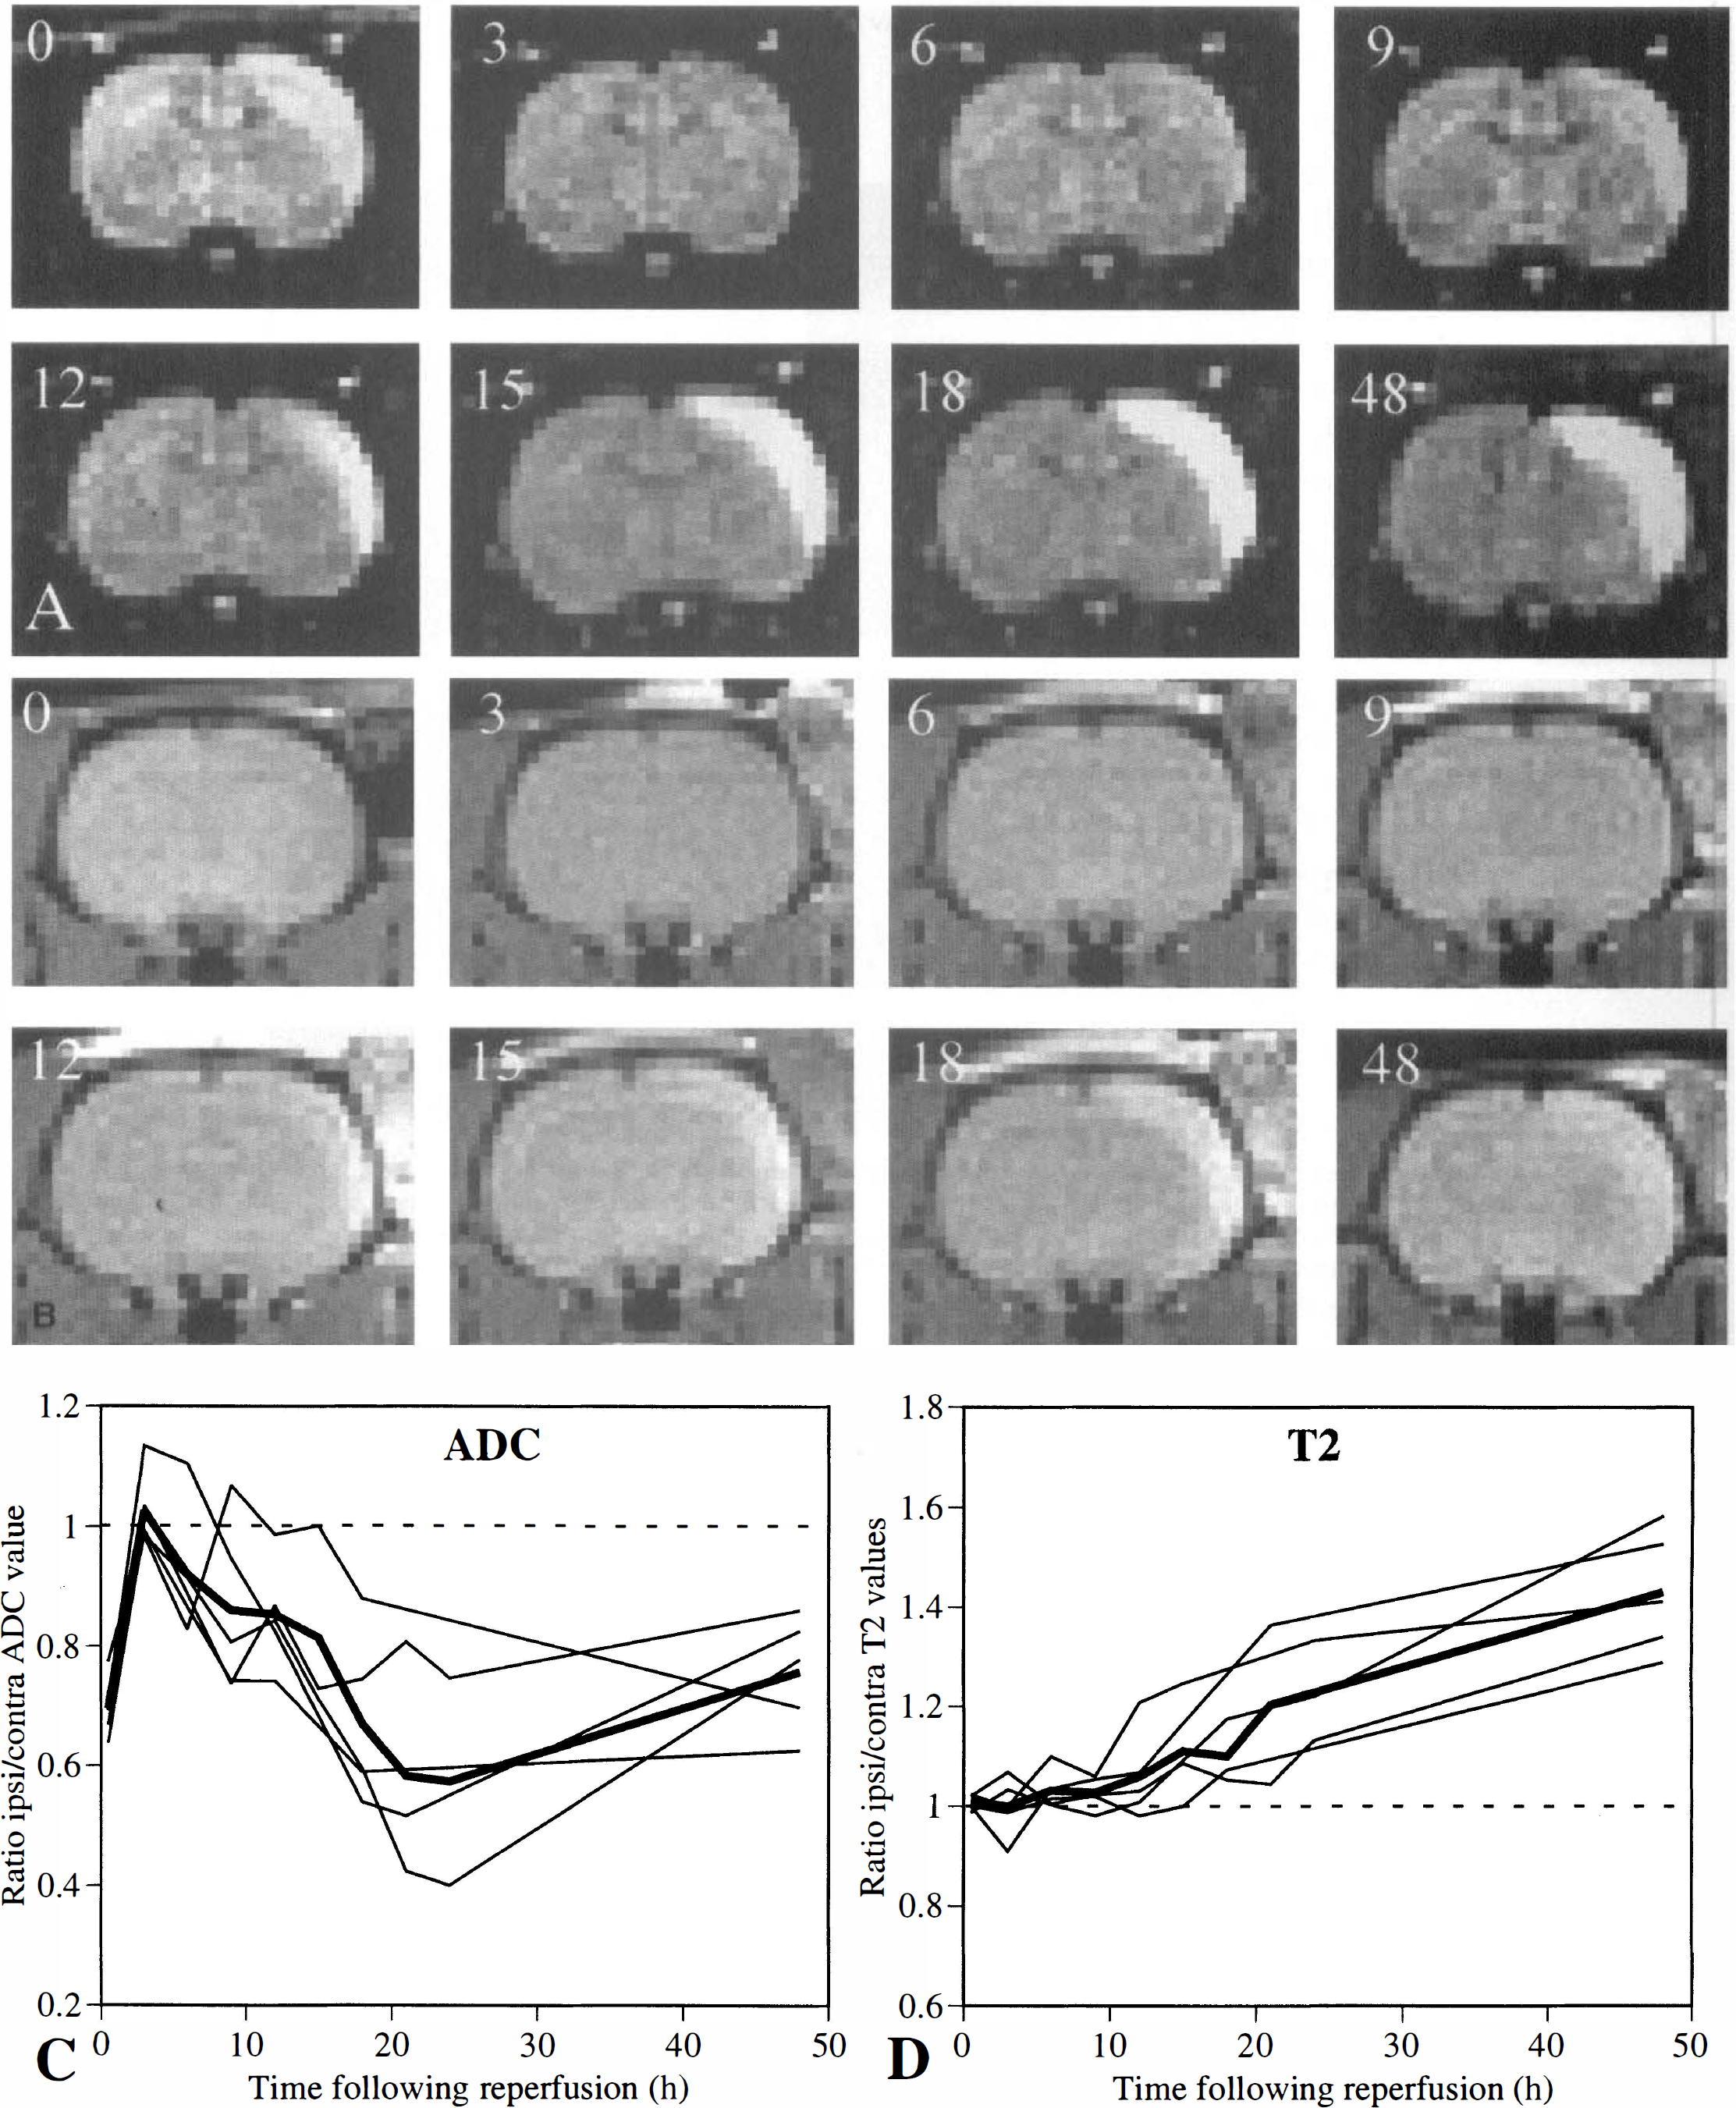
Biphasic response in tissue apparent diffusion coefficient (ADC) and delayed increase in T2 relaxation time after 45-minute occlusion and reperfusion. Diffusion-weighted
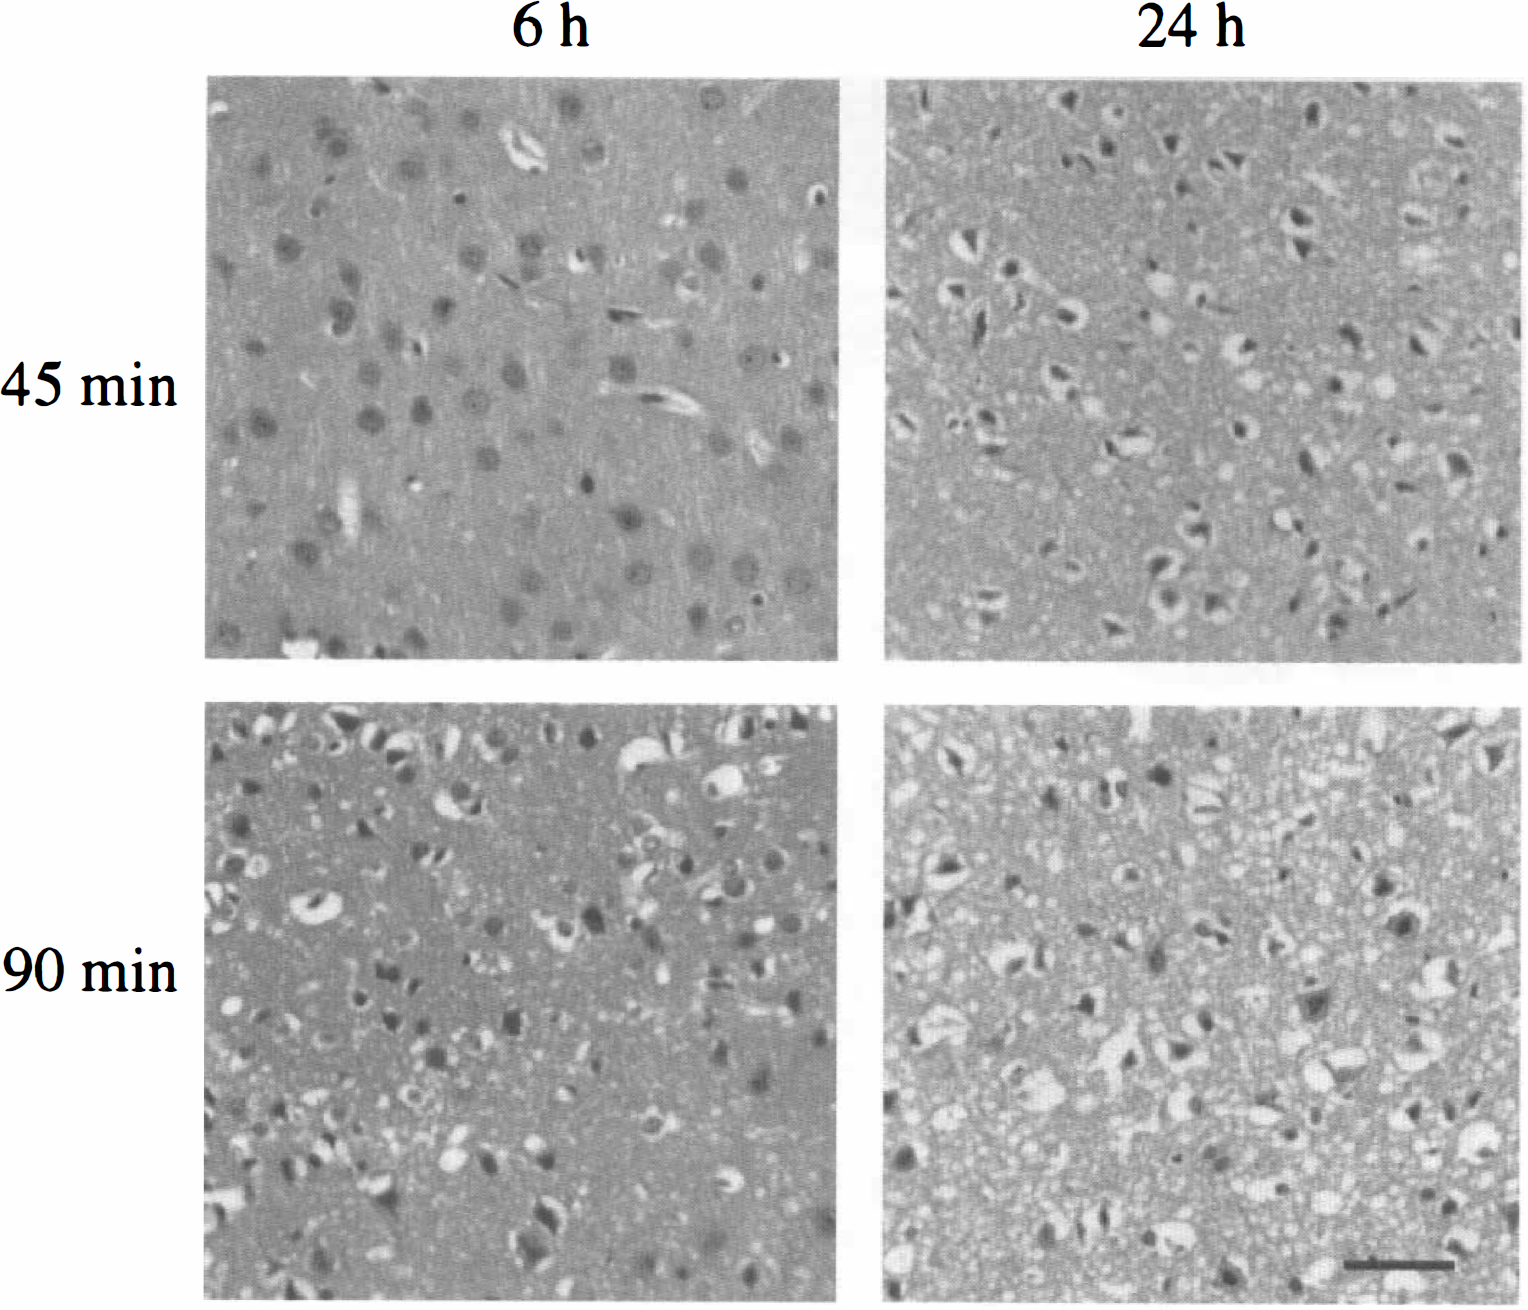
Time course of histopathological changes in the primary somatosensory cortex after 45- and 90-minute occlusion as shown in hematoxylin/eosin-stained 7-mm paraffin sections. After 45-minute occlusion, minor histological changes are found near the site of the middle cerebral artery occlusion, but massive neuronal loss and reactive gliosis are found at 1 day. Ninety-minute occlusion resulted in clear histological changes at 6 hours, evidenced by cell swelling and chromatin condensation. Further cell loss and nuclear pyknosis are evident by 1 day. Bar = 50 μm.
The time course of development of cerebral edema was further studied by estimating the volume of increased T2 relaxation time from T2 maps (Fig. 4A). The hyperintense volume was maximal at 3 days after 30-and 45-minute occlusion. Ninety-minute occlusion resulted in a maximal volume 1 day after reperfusion. The volume of tissue with an increased T2 relaxation time was significantly smaller in 30-minute occluded animals than in 45-minute occluded animals at 1 day (P < 0.05) and in 90-minute occluded animals at all time points (P < 0.001). To investigate how the infarcts induced by different occlusion times developed over longer periods of time, final cavity formation and cell loss expected to occur due to selective neuronal necrosis were measured from the volume of missing tissue at 18 days after occlusion. Hemispheric tissue loss in 30- and 45-minute occluded animals was significantly less than that in 90-minute occluded animals as measured 18 days after reperfusion (P < 0.005).

(A) Temporal evolution of the volume of tissue with an increased T2 relaxation time measured in T2 maps following occlusion of different durations. The volumes in 30-minute occluded animals are significantly smaller than those of 90-minute occluded animals at each time point, whereas the volumes of 45-minute occluded animals did not differ significantly from those of 90-minute occluded animals except at 1 day. ) 45 minutes; (□) 90 minutes.
Hemodynamic changes in the ischemic cortex were evaluated using dynamic contrast-enhanced susceptibility-weighted MRI (Fig. 5A). It is well established that the estimate of regional mean transit time using first-pass techniques is difficult, with many pitfalls (Weisskoff et al., 1993). This problem is confounded by the inevitable low signal-to-noise ratio associated with the high-resolution requirements of small-animal research. For these reasons, we have restricted our study to the measurement of CBV as a more accurate reflection of the vascular responses. The average temporal changes in the hemodynamic parameters during ischemia and after reperfusion for an ROI taken from within the ischemic cortex are shown in Fig. 5B. It is clear from these graphs that there is a significant reduction in regional CBV during ischemia, as expected, returning to normal at 3 to 6 hours after reperfusion. There appears to be a slow but progressive increase in regional CBV over time (slope P < 0.01), which becomes significant 15 hours after reperfusion (contralateral/ipsilateral ratio significantly different from unity; P < 0.01). This result can be best visualized from a series of difference images recorded during the passage of the contrast agent obtained 15 hours (Fig. 5A) after onset of ischemia for one rat. There is a clear reduction in signal intensity associated with the transit of the contrast agent that is most dramatic in the affected cortex. It should be noted that there was a reduction in regional CBV in the caudate putamen during ischemia (mean ratio ipsilateral/contralateral hemisphere 0.78; P < 0.05). A secondary reduction in regional CBV was also observed in the caudate putamen at 9 to 15 hours after reperfusion in three of five rats studied (0.87; NS). This secondary effect can be seen in Fig. 5a.
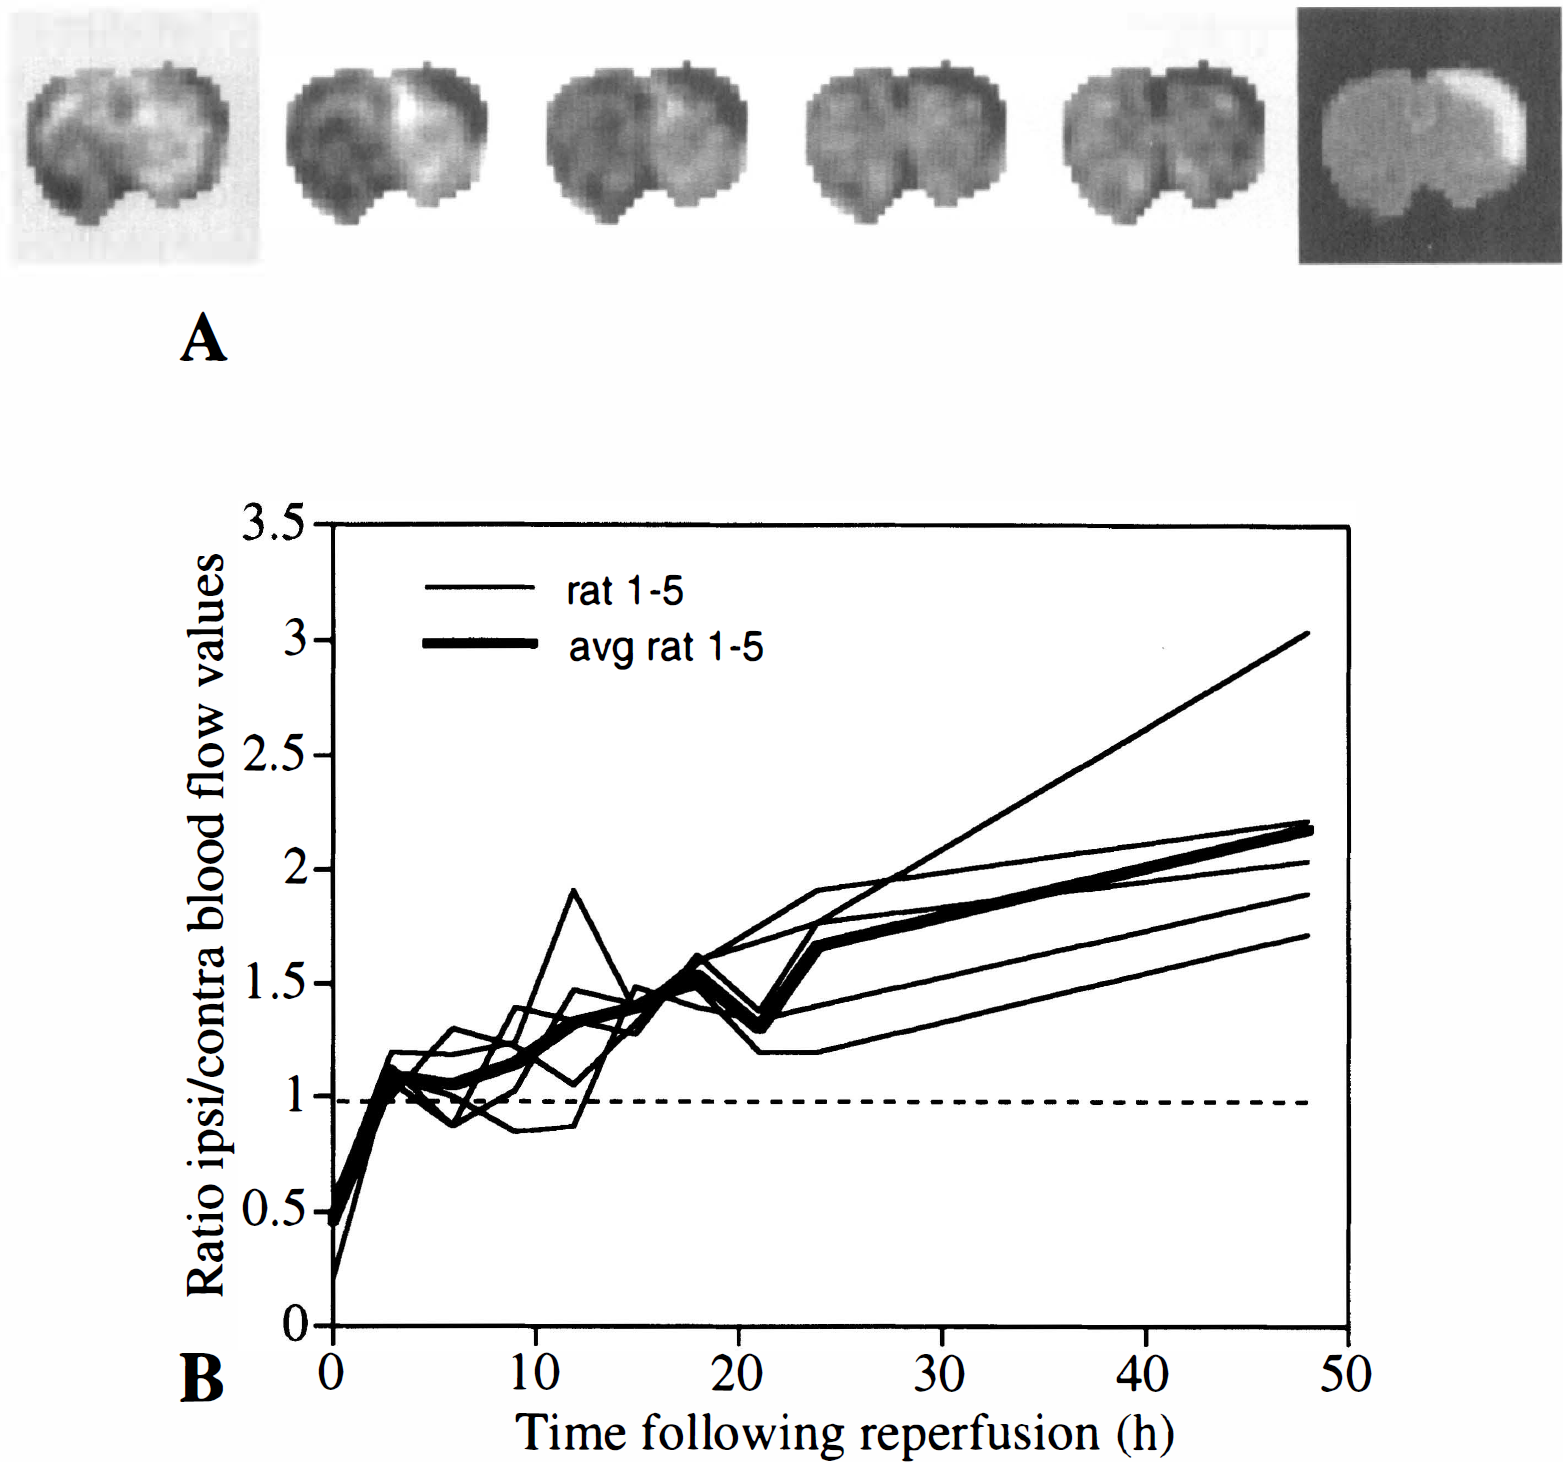
(A) Cerebral hyperemia after mild focal ischemia. The qualitative effects of Gd-diethylenetriamine pentaacetate on the magnetic resonance signal intensity are best visualized with a sequence of difference imaging recorded during the first pass of the agent. The images shown represent a time series acquired 15 hours after occlusion in the same animal. The images were taken every 0.6 second before, during, and after intravenous injection of the contrast agent. The different images represent the change in signal intensity as a function of time compared with an image recorded before the injection of the contrast agent in the same time series. The equivalent diffusion-weighted image is shown in the last panel for comparison. The area of high signal intensity in the affected cortex seen from the diffusion-weighted image corresponds to an area of enhanced relative cerebral blood volume (CBV).
DISCUSSION
These data show that temporary mild focal cortical ischemia can result in cell death that is delayed by 1 day. Furthermore, the time course and the severity of the insult are dependent on the duration of the initial insult. The delayed response is accompanied by an increase in CBV, indicating that vascular reactivity may contribute to this delayed response.
A previous study reported on a slowly progressing cell death after 30-minute occlusion, matching the infarct volume after 90-minute occlusion by 14 days of reperfusion (Du et al., 1996). The progression of the infarct after 30-minute occlusion was prevented by cycloheximide, leading the authors to suggest that an apoptotic mechanism is responsible for this delayed progression. In the present study, using MRI to noninvasively monitor the progression of cerebral edema over time, we did find a clear difference in the time course of pathophysiological changes in 30- and 90-minute occluded animals that is in line with the study of Du et al. (1996). In 30-minute occluded animals, a further expansion of the cerebral edema measured by T2-weighted MRI took place between 1 and 3 days after occlusion, whereas the volumes of changes in T2-weighted images were maximal at 1 day for 45- and 90-minute occluded animals. Thus, after the first 3 days following reperfusion, we found no further expansion of the T2 volumes up to 14 days later for all occlusion durations, and, contrary to the results of Du et al. (1996), we found no histological signs indicative of apoptosis. Possibly, after short-duration occlusion, a delayed component of neuronal death may exist in the form of selective neuronal necrosis (Garcia et al., 1997). This selective neuronal death occurs at a predictable site of the cerebral cortex in a delayed manner and may proceed with a time course different from the vascular edema detected as a change in T2-weighted images.
The results in our study are consistent with those from a previous study in which brief focal ischemia induced by an endovascular suture for 30 minutes resulted in a recovery of signal intensities in diffusion-weighted images on reperfusion followed by a clear progression of delayed damage 24 hours later (Zarow et al., 1995). Contrary to our findings, there was incomplete recovery of signal intensity changes in diffusion-weighted images shortly (45 minutes) after reperfusion, which may be explained by a more severe infarct induced by endovascular MCA occlusion. Also, this previous study does not describe changes in diffusion-weighted or T2-weighted images at time points between 45 minutes and 24 hours of reperfusion or after 24 hours, but the results indicate that, similar to our study, secondary tissue changes can occur in another model of focal cerebral ischemia.
A noteworthy finding in this study is the presence of clear hemodynamic changes in the cerebral cortex preceding and accompanying the secondary decrease in ADC and increase in T2 relaxation time. It is known from previous studies that the degree of CBV closely correlates with the degree of reduction in ADC (Pierce et al., 1997) during occlusion, but after reperfusion there is no clear correlation between ADC and CBV (Miyabe et al., 1996). On reperfusion, there is a period of cerebral hyperemia in which the blood flow to the affected tissue exceeds the metabolic demand and is considered a period of “luxury perfusion” (Dijkhuizen et al., 1998; Marchal et al., 1996; Steiger et al., 1996). This transient hyperemia is often followed by a period of hypoperfusion, but both these events occur within the first few hours after return of blood flow to the ischemic territory (Sakaki et al., 1993). Increased CBV has been reported in several articles to occur shortly after reperfusion (Busch et al., 1998; Dirnagl et al., 1989), but only few studies report changes in cerebral hemodynamics later than 12 hours after reperfusion (Dijkhuizen et al., 1998; Marchal et al., 1996), as observed in our study. In our study, we found no evidence for enhanced CBV occurring within 12 hours after reperfusion. Beyond 12 hours, the area of tissue with an increased CBV closely corresponded to the area of reduced water diffusion, and therefore this response differs remarkably from the primary response (occlusion) where blood flow is decreased. The exact mechanisms underlying this delayed or secondary perturbation in cerebral hemodynamics are presently unknown and could be explained by the presence of an autoregulatory response of the tissue vasculature. An increase in CBV may be indicative of local vasodilatation induced by vasoactive mediators like CO2 or NO (Humphreys and Koss, 1998; Steiger et al., 1996), lactate (Pulsinelli and Duffy, 1983), or factors that form part of an inflammatory response (Slater et al., 1997; Tanaka et al., 1995). Enhanced blood volume, rather than being beneficial, may contribute to infarct development, and there is some evidence linking delayed tissue damage with altered hemodynamics. For example, delayed necrosis in the CA1 sector of the hippocampus occurs after a brief period of global ischemia and is accompanied by an increase in cerebral blood flow (Suzuki et al., 1983). Increases in either CBV and/or cerebral blood flow may increase the extent of reperfusion damage that has previously been shown to significantly contribute to infarct development (Aronowski et al., 1997). As demonstrated in our study, the extent to which reperfusion injury contributes to infarct development is clearly a function of occlusion time. After 90-minute occlusion, the volume of T2 changes representing vascular edema did not expand much following reperfusion, indicating that most of the infarct had developed prior to reperfusion. Following intermediate occlusion times, cells may initially recover from the ischemic insult, but the combination of hyperemia and the ischemic episode may trigger a delayed response. Future studies that selectively modulate vascular changes after reperfusion may address these issues more directly.
The delayed, secondary reduction in ADC seen in this study of mild focal ischemia is similar to the biphasic drop in ADC observed after hypoxic-ischemic or global ischemic injury. An acute phase with a clear reduction in cellular energy levels and water diffusion is followed by a secondary phase of delayed neuronal death occurring 1 day or later following the insult (Dijkhuizen et al., 1998). This biphasic response to an initial hypoxic-ischemic insult is even more pronounced in models of neonatal hypoxia-ischemia (Tuor et al., 1998; Thornton et al., 1998). The similarities of these time courses indicate that there may be common mechanisms responsible for the appearance of delayed death following focal and hypoxic-ischemic injury. In these studies, secondary energy failure has been implicated as the main cause of delayed neuronal death (Thornton et al., 1998). Indeed, the delayed appearance of ADC reduction may be closely related to cytotoxic edema associated with the failure of energy-requiring ionic membrane pumps to maintain ion homeostasis. Both MRI and spectroscopy have been extensively used to monitor tissue energy status in the brain after an ischemic insult (Penrice et al., 1997; Williams et al., 1989). Indirect evidence for secondary energy failure playing a role in delayed damage comes from studies of poly(ADP-ribose) polymerase (PARP). It has been shown that energy-requiring PARP, activated through reperfusion-mediated free radical-induced DNA damage, may deplete the cells' reserve stores of ATP, causing energy failure and cytotoxic cell swelling that result in cell death. Both in vitro (Zhang and Iadecola, 1994) and in vivo (Eliasson et al., 1997) studies indicated that chemical inhibition of PARP enzymatic activity protects neurons from delayed cell death caused by ischemic insults. Future studies utilizing inhibitors of PARP may resolve whether PARP activity is a causal factor responsible for the secondary decline in brain tissue ADC seen in this and related cerebral pathologies.
In conclusion, using MRI and histopathology, we have described the time course of tissue and hemodynamic changes related to infarct progression after focal cerebral ischemia of short duration. The time course and cooccurrence of tissue changes with cerebral hyperemia indicate that vascular factors rather than slow selective apoptotic cell death play a role in infarct development after mild focal ischemia. Further studies are aimed at understanding the mechanisms responsible for this delayed neuronal death and establishing new therapeutic targets for future treatment of mild stroke and transient ischemic attacks.
Footnotes
Acknowledgments:
The authors thank Christian Galindo for statistical evaluation of the data and Carol Errett for technical assistance.